This QuickStart lists all the new and public beta features released, as well as bugs fixed in April 2024.
It is summary in nature, and you should refer to the specific Sigma documentation links provided for more information.
Public beta features will carry the section text "Beta".
All other features are considered released (GA or generally available).
Sigma actually has feature and bug fix releases weekly, and high-priority bug fixes on demand. We felt it was best to keep these QuickStarts to a summary of the previous month for your convenience.
New first Friday features QuickStarts will be published on the first Friday of each month, and will include information for the previous month.

Cross-org template sharing
Send and accept workbook templates across different Sigma organizations.
With secure cross-org sharing, a receiving organization must choose its own data source to populate the shared template, ensuring no data from the sharing organization is disclosed.
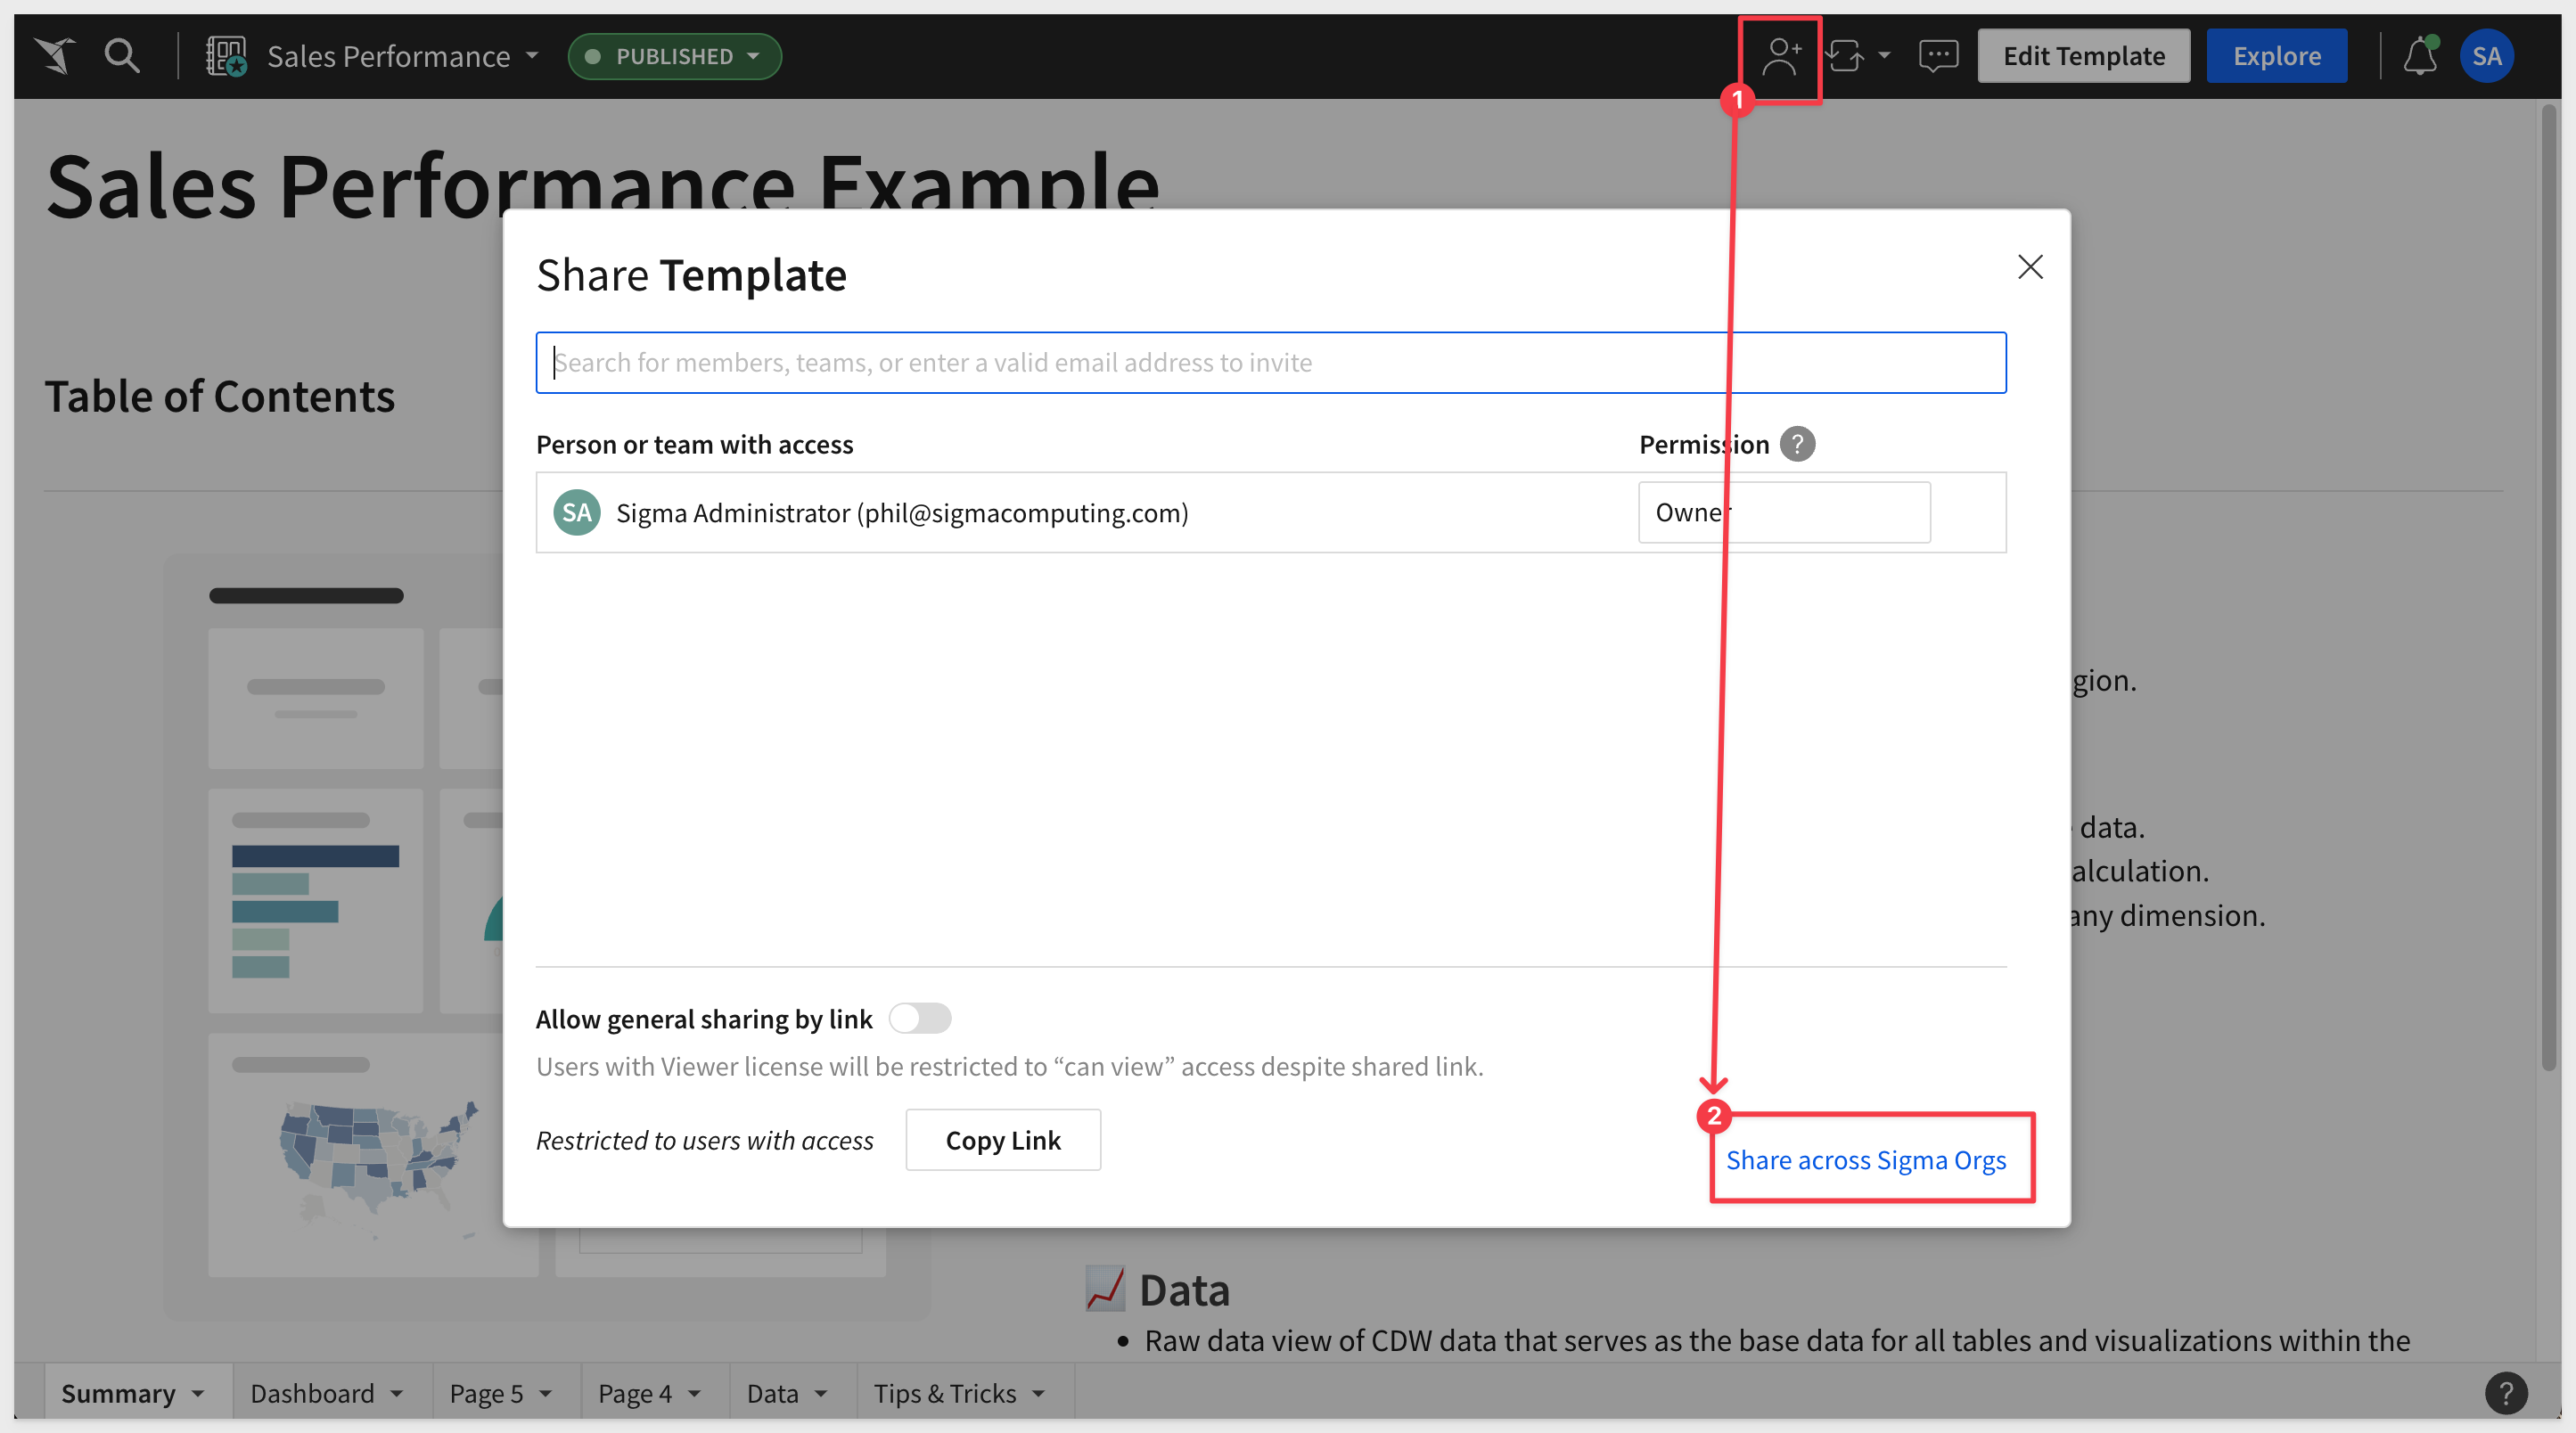
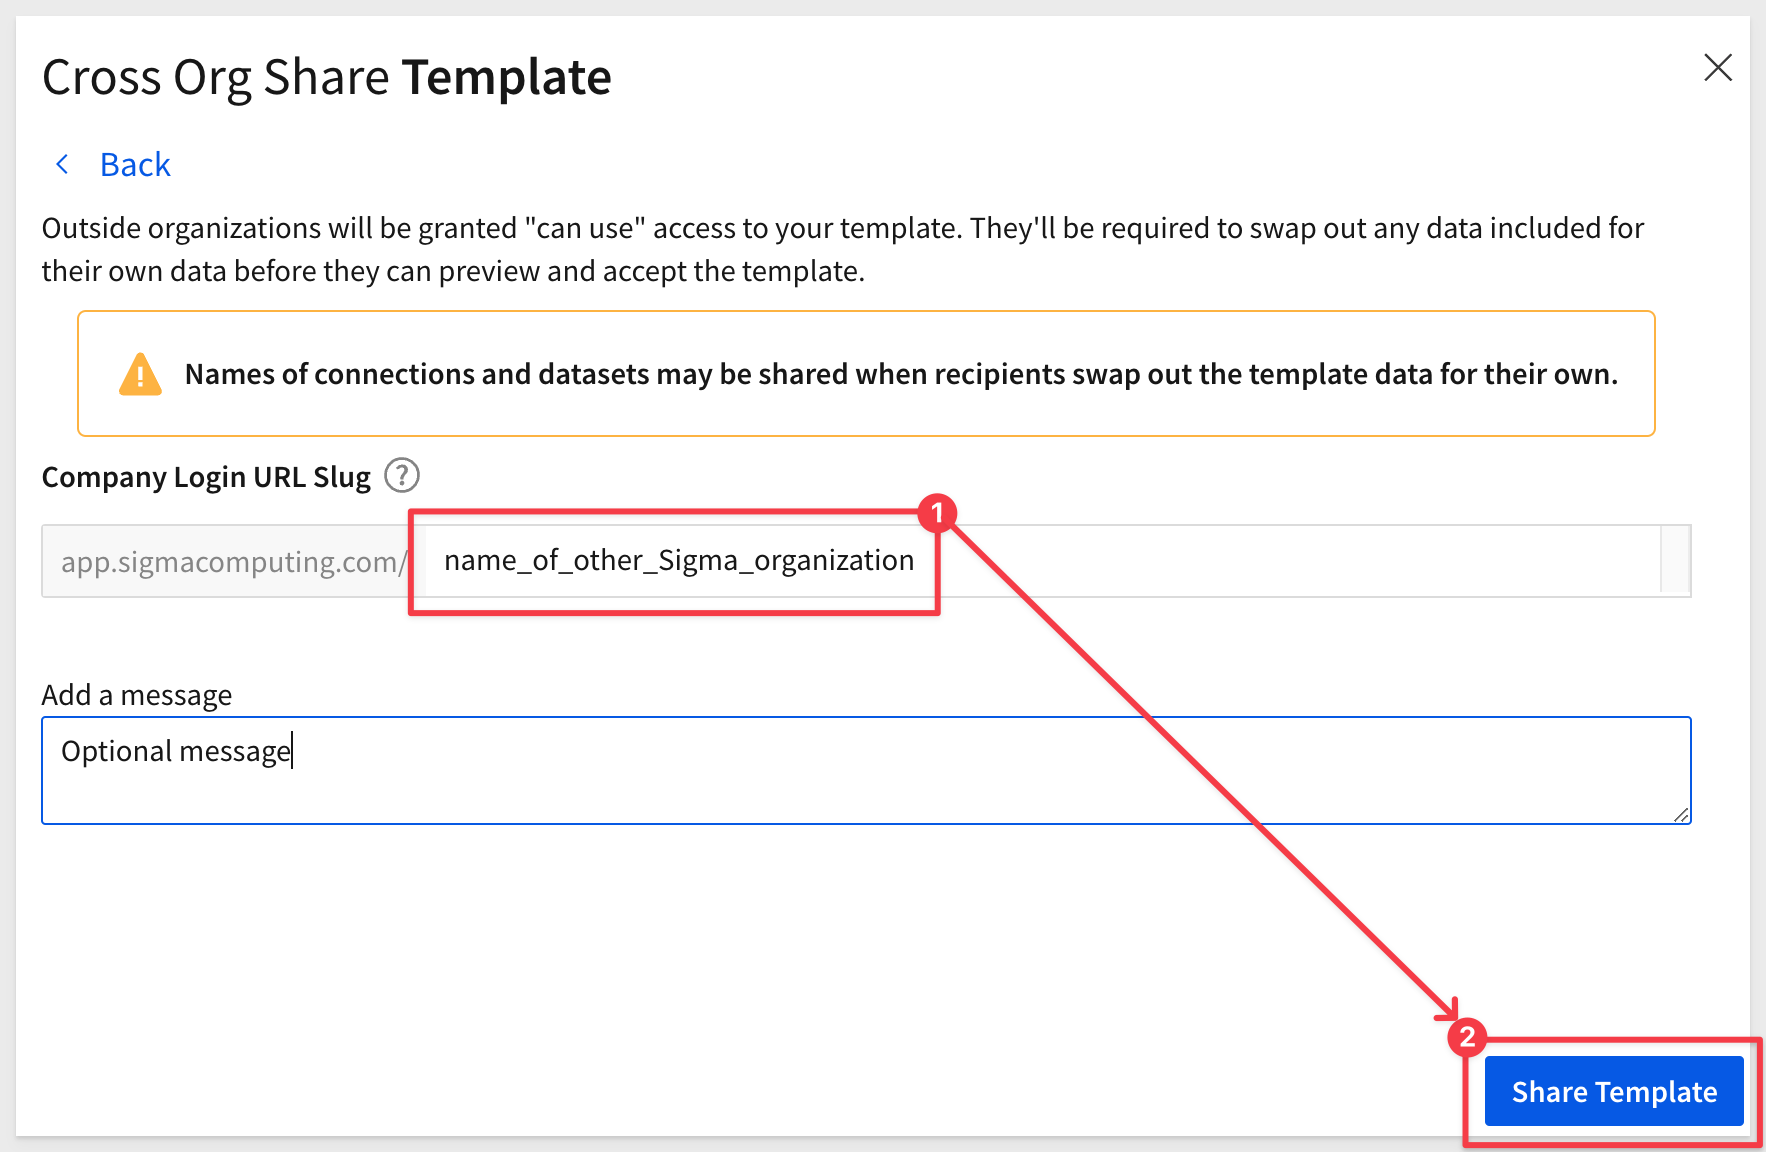
For more information, see Share and accept cross-org workbook templates.
Customizable session length
If your organization uses password or SAML authentication, you can customize the session length to control how long internal and guest users stay logged in before Sigma requires re-authentication.
By default, the session length is set to 720 hours, meaning users must log in every 30 days.
Adjust the session length to align with internal security policies and external regulatory requirements.
For more information, see Manage authentication method and options.
Snowflake key pair authentication and rotation
Create a Snowflake connection using the key pair authentication method, and protect your data with key rotation.
Key pair authentication offers enhanced security through the use of a private key (secured by Sigma) and a public key (shared with Snowflake) for encryption and decryption. By implementing periodic key rotation, you can further protect your data from threats of exposure and compromised keys.
For more information, see Sigma's Snowflake Key-pair Authorization QuickStart.

Scoped API keys
This update provides more control over API privileges to ensure developers are granted relevant feature access.
You are now able to define the scope of an API key to permit access to APIs only, embeds only, or both:

For more information about client credentials, see Generate API client credentials and Generate embed client credentials.

1: To preserve data integrity, Sigma no longer converts Yes/No and 0/1 values to True/False boolean values in CSV uploads.
2: In embeds, the workbook:chart:onvalueselect event no longer sends an empty value property.
3: Users no longer encounter false permission errors when accessing permitted tagged workbook versions.
4: Sigma now displays an error when an admin attempts to generate a signed embed URL for a public embed.
5: Bookmark selection for exports is now available only when all attachments are PDF or PNG files.

Sigma Data Models represent the next iteration of Datasets and their introduction is a foundational change that offers significant benefits over the existing Dataset functionality. We're investing heavily in Data Models over the coming months and years, with plans to add a whole suite of functionality, coupled with the ease-of-use that you have come to expect from Sigma.
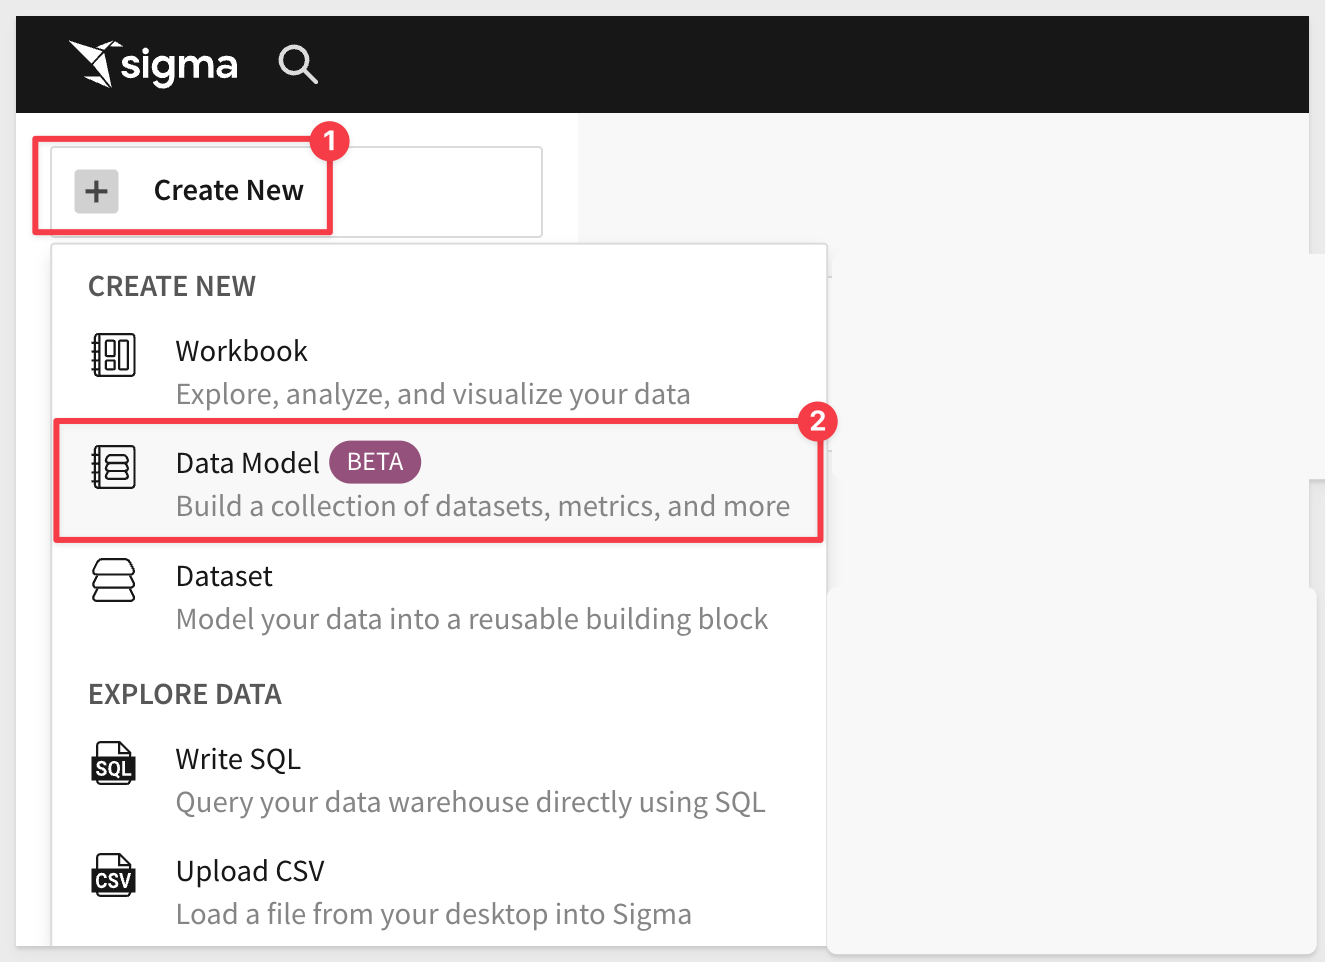
This is large topic, and we will be providing a ton of resources for customers to take advantage of, including a new QuickStart.
For now, we strongly recommend reading this post in Sigma Community on DataModels.
There is also some documentation (with more to come) here.

Embed API Code Samples (signing packages)
Sigma has previously provided code samples based on node.js and Javascript.
Now you can see sample code for additional languages, for signing embed URLs to reduce time to deploy embedded applications.
For sample code in Go, Python, Ruby, and JavaScript, see the Embed Signing Packages Github repository.
Explore mode and bookmarks in embeds
Explore mode is now available in embedded workbooks.
Embed users can perform ad hoc analysis, save the explored state as a personal bookmark, and manage existing bookmarks.
For more information, see Explore a published workbook and Bookmarks in embedded workbooks.

Advanced calculation options for metrics
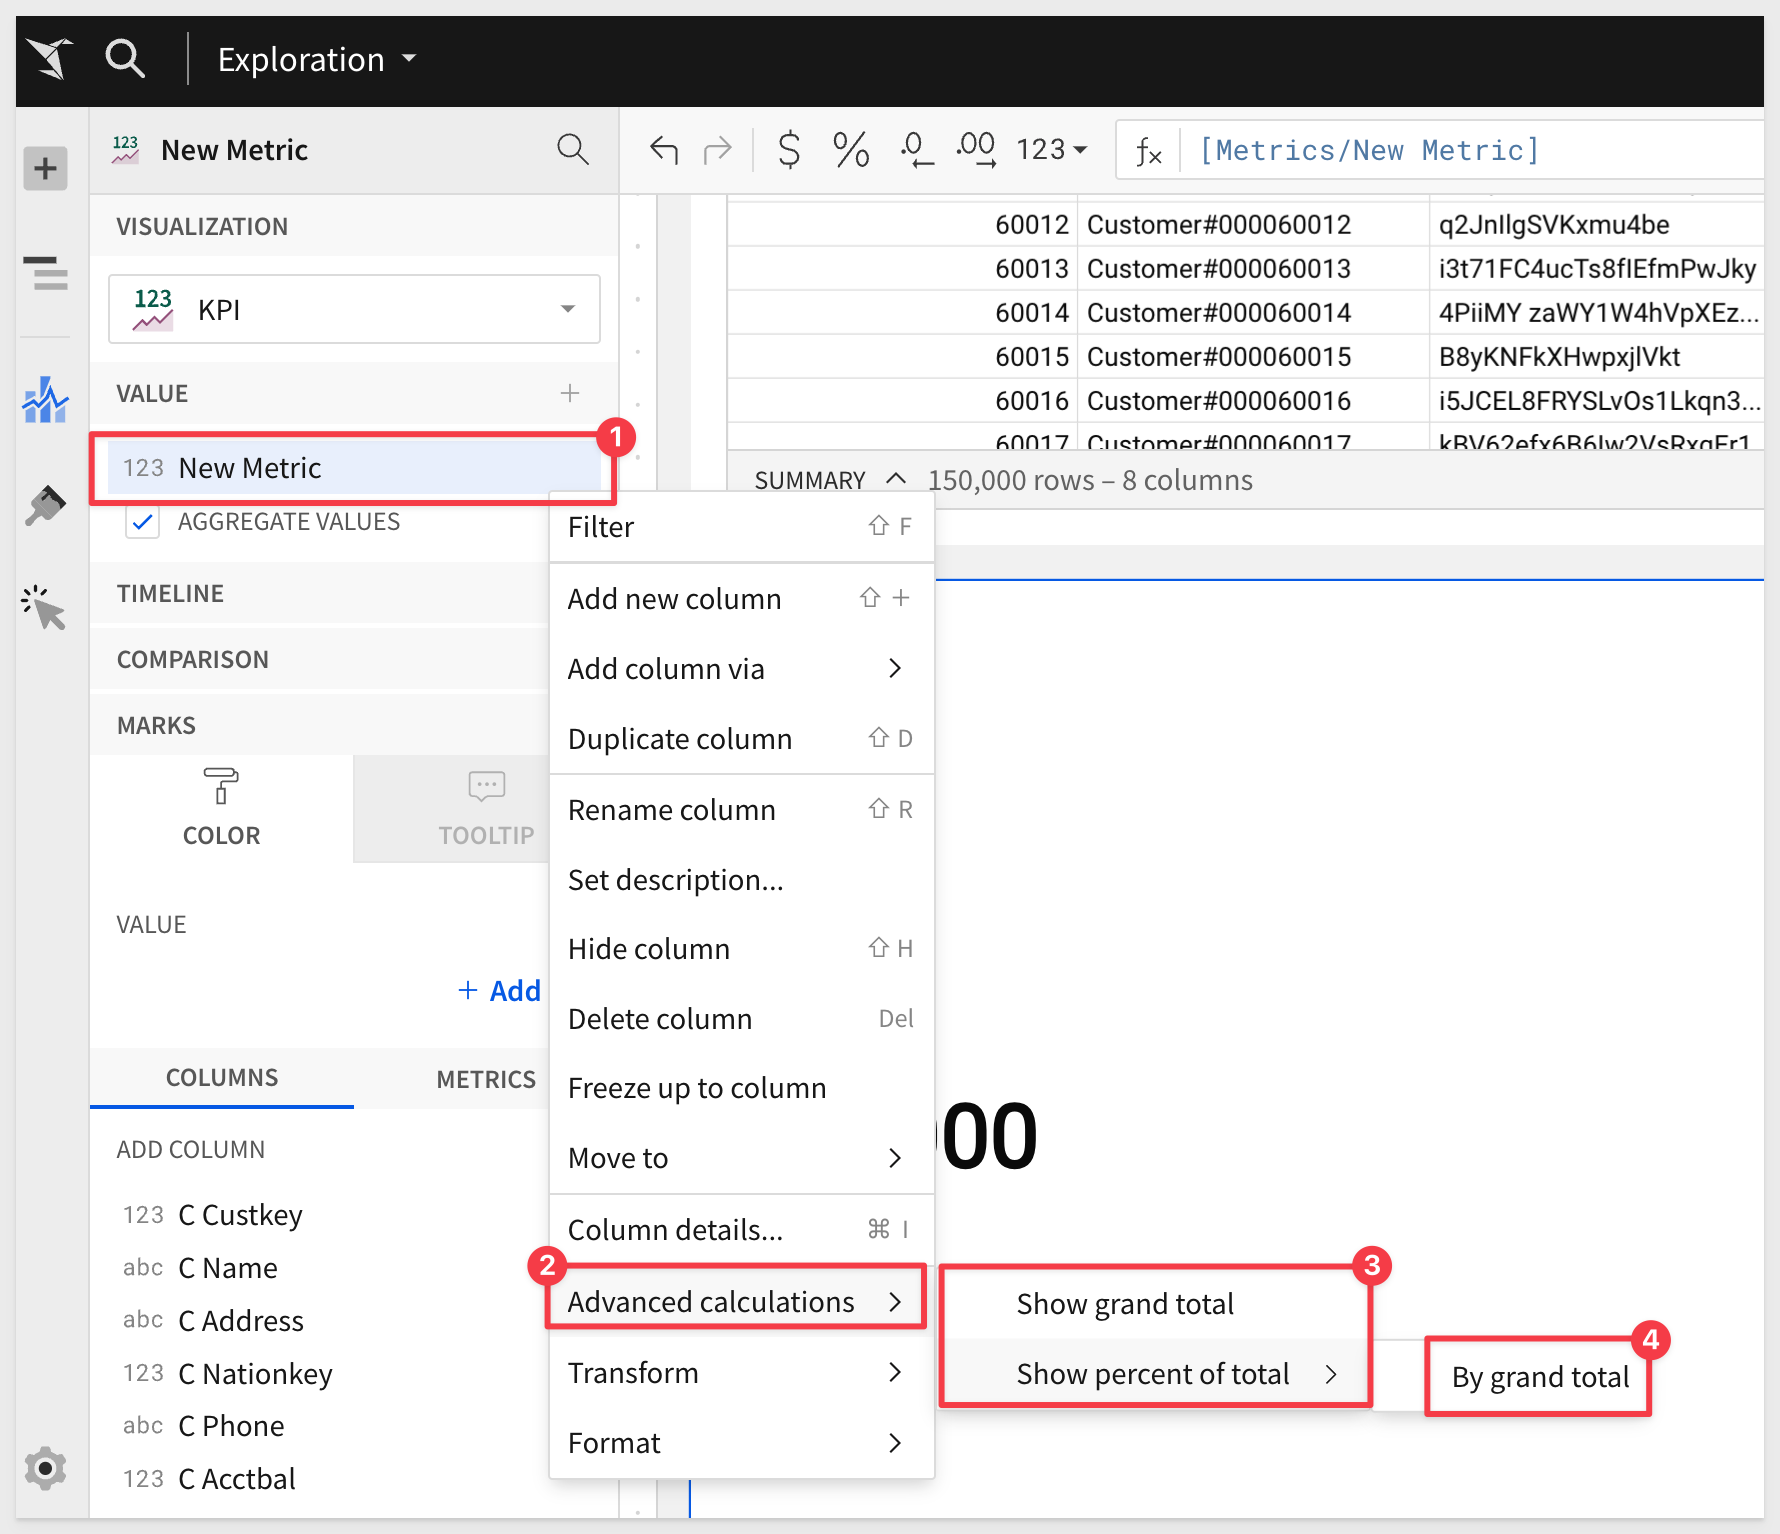
Quickly convert metrics to cumulative aggregates (grand total) or relative aggregates (percent of total) in tables, pivot tables, and visualizations.
Open the relevant metric column menu, then hover over Advanced calculations and select an option to show the grand total or percent of total.
Available percentage breakdowns (by grand total, x-axis, row, column, etc.) depend on the element type.
For example:
ArrayAggDistinct function
The ArrayAggDistinct function identifies distinct non-null row values of a column or group and aggregates them into a single array.
For more information see ArrayAggDistinct.
Record formula support
Record formulas enhances data processing and user interaction. Record formulas allow you to create structured objects, such as JSON, directly within your workbooks and data models.
Key Benefits:
- Data Type Preservation: When Sigma processes these structured objects, it maintains the specific data types of each field. This not only preserves data integrity and accuracy but also simplifies data manipulation by eliminating the need for type conversions.
- Ease of Access: The structured format ensures that you can easily access and manipulate the values within these objects.
For more information, see Generate and access structured objects.

Interactive chart legends
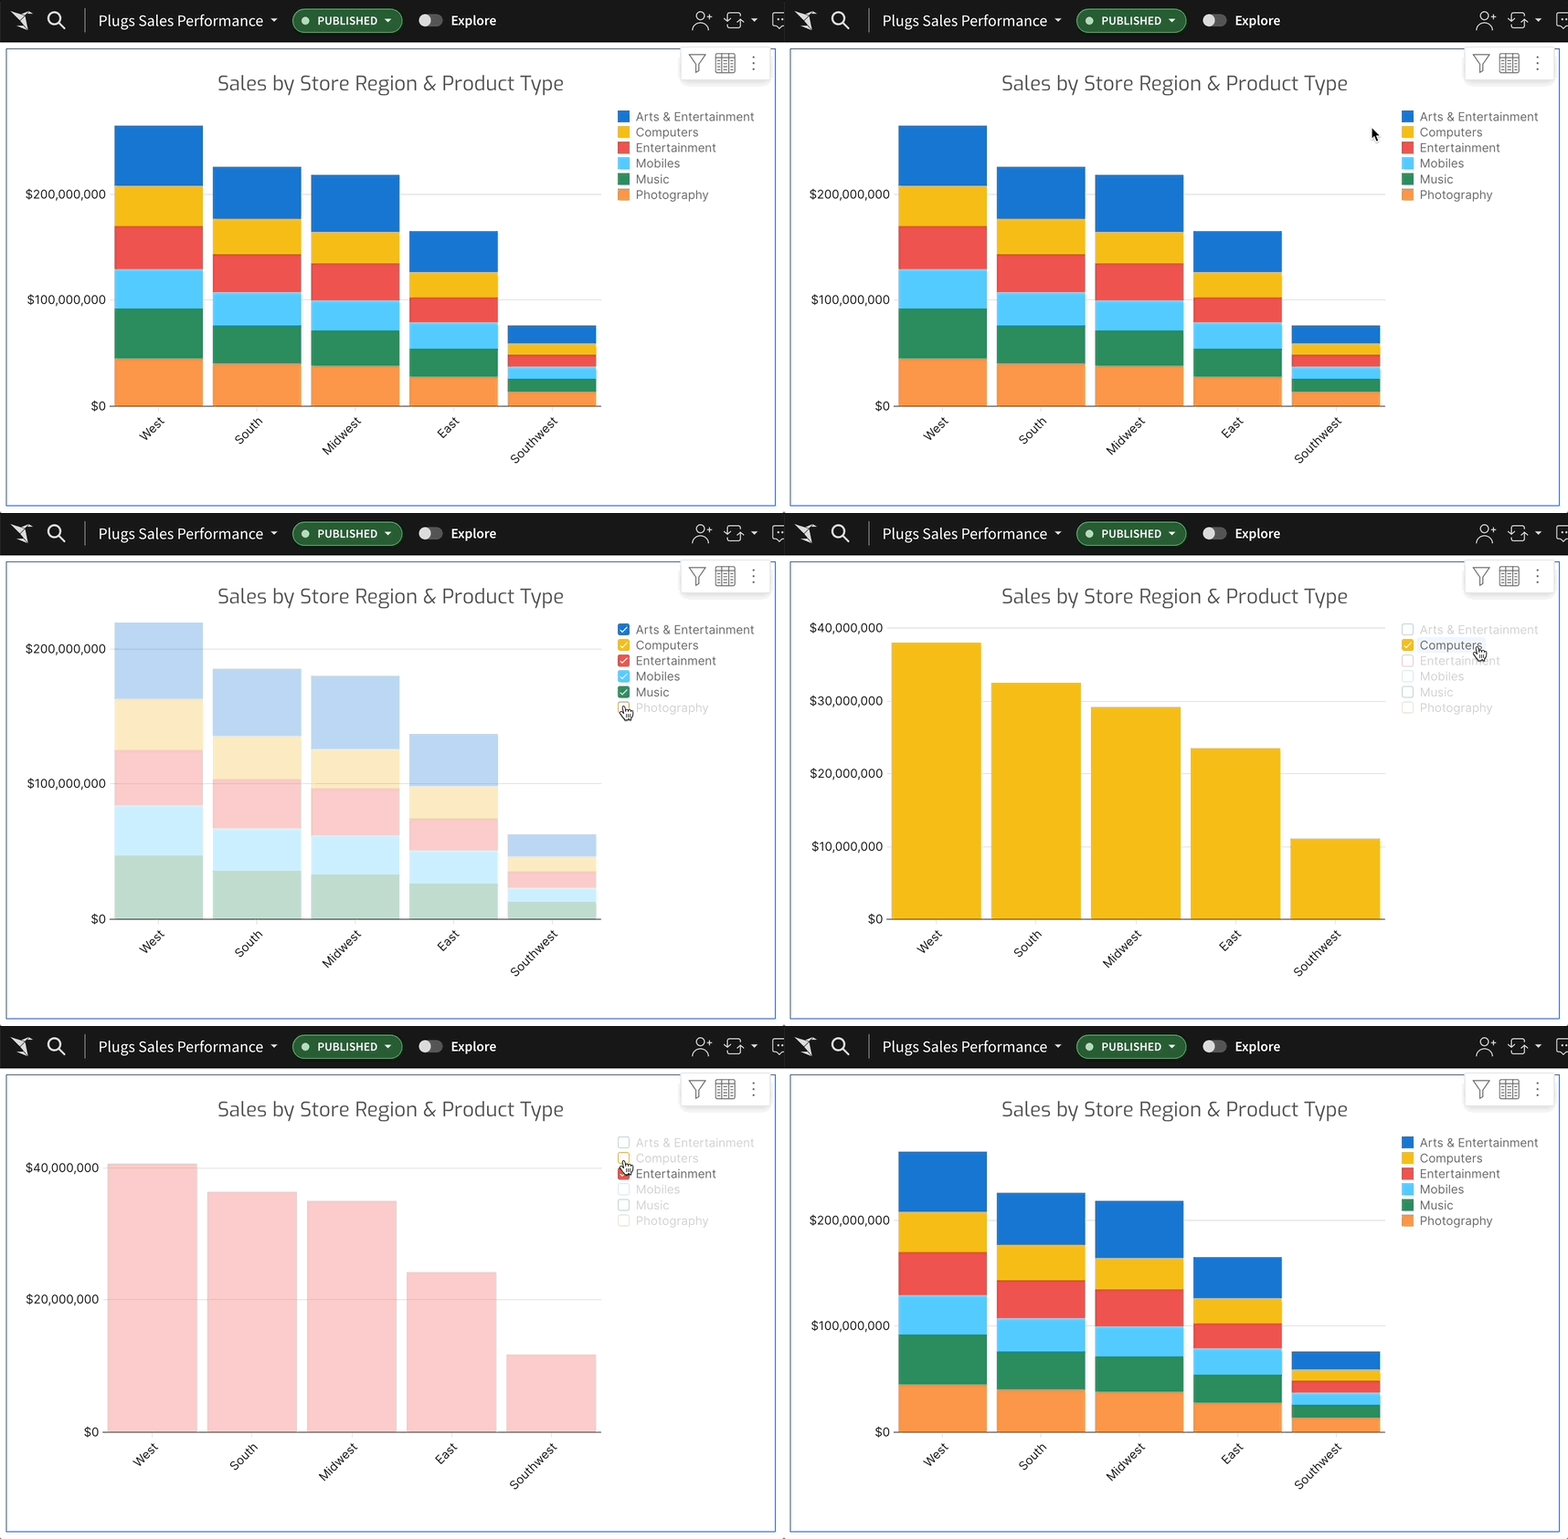
Interact with chart legend entries to quickly focus on specific data subsets.
Charts containing legends that represent qualitative segments (like categories or series) support the following interactive filtering capabilities:
- Hover over a legend entry to highlight corresponding data points.
- Click a legend entry label to isolate corresponding data points.
- Select or clear the checkbox of one or more legend entries to show or hide corresponding data points.
- Click anywhere (within the element) outside of the plot area or legend to reset the chart display.

- Navigational Actions: Users can configure dashboard elements to act as links, enabling navigation to specific destinations based on the displayed data, which facilitates seamless integration with other tools or detailed reports.
- Control Management: These actions allow users to dynamically manage control values such as filters and parameters directly from the dashboard, enhancing user interaction and data exploration flexibility.
- Element Modification: Users can set actions to modify or refresh dashboard elements in real-time, ensuring data visualizations are always current and relevant.
- Download and Export: This feature enables the automatic downloading and exporting of data or reports directly from the dashboard, streamlining data handling and reporting processes.
Each of these functionalities adds significant value by making dashboards more interactive, user-friendly, and efficient in handling complex data workflows.
An simple example of this can be found in the free Sigma Loan Analysis template. In this example, there are three action buttons on the page and the "Performance" button has a click-action that will take the user to a specific workbook page.
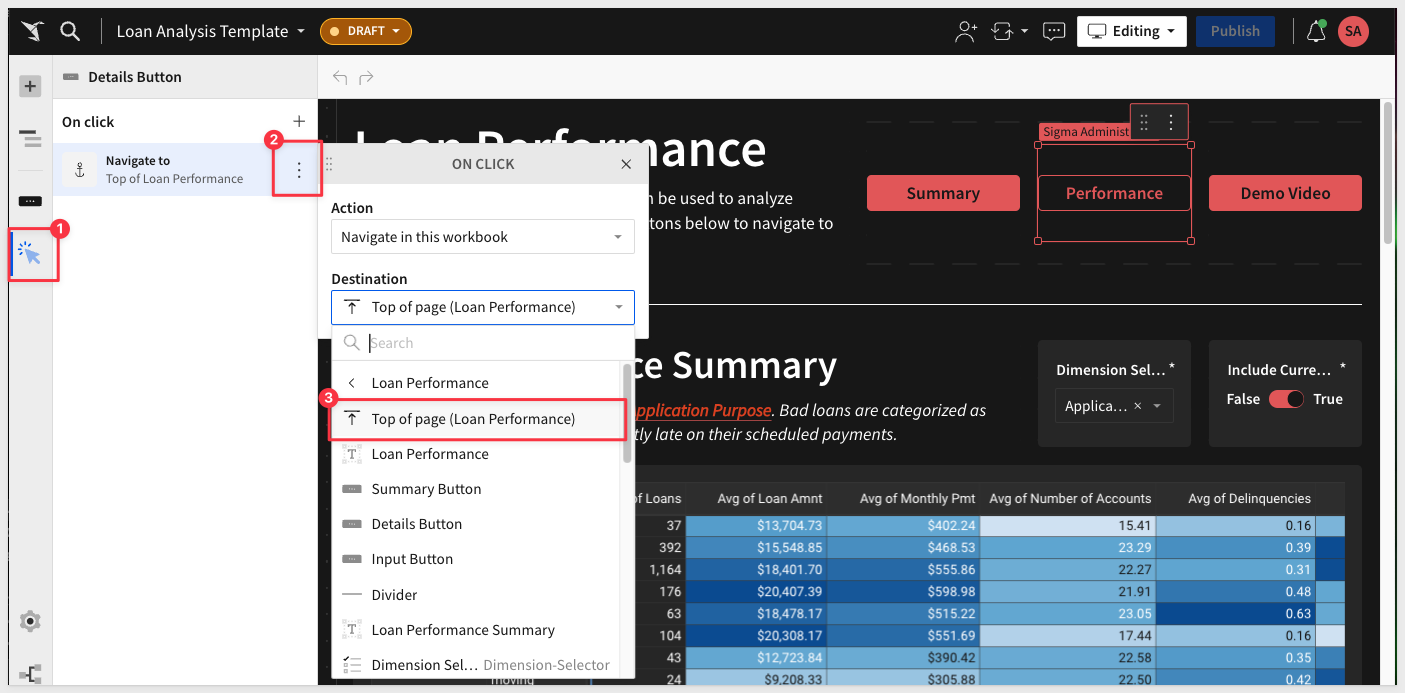
For more information, see Intro to Actions

Additional Resource Links
Blog
Community
Help Center
QuickStarts


