This QuickStart (QS) discusses and demonstrates how to use Sigma Metrics against a use case we will detail later on.
Metrics in bi (business intelligence) refer to the quantitative measurements used to evaluate and analyze the performance of a business. These metrics are calculations that are used to support a variety of use cases including financial performance, customer behavior, operational efficiency, and more.
Examples of common metrics used in business intelligence include:
- Revenue: track the total income generated by a business over a period of time.
- Customer retention: measures the percentage of customers who continue to use a business's products or services over time.
- Net Promoter Score (NPS): gauges customer satisfaction and loyalty by asking customers how likely they are to recommend a business to others.
- Conversion rate: measures the percentage of website visitors who complete a desired action, such as making a purchase or filling out a form.
- Cost per acquisition (CPA): calculates the cost of acquiring a new customer.
- Return on Investment (ROI): calculates the financial return on a particular investment, such as a marketing campaign or product development initiative.
By tracking and analyzing these metrics, businesses can gain valuable insights into their performance and make data-driven decisions to improve their operations, better serve their customers, and increase their profitability.
Metrics in Sigma provide a way to ensure consistent metric logic across tables, visualizations, and pivot tables.
Metrics help avoid:
Inconsistent analysis:
Analysts can define calculations differently. For example, one may define revenue as the sum of [Sales Price], where another may define it as the sum of [Sales Price] - [Discount]. These differences lead to inconsistent results and a lack of trust in the data.
Repetitive work:
Common business logic for a calculation like profit margin needs to be used all over the place. Today in Sigma, analysts have to derive the definition from scratch in every new workbook. This is a lot of repetitive, tedious work.
Benefits of using metrics include:
Promote accurate, consistent, and governed analysis amongst all your analysts.
Incorporate common business calculations into your business users without having to derive them yourself.
- Define once, reuse everywhere.
- Full power of Sigma's formula language
- Referential integrity: Change the definition in one place, it updates everywhere
- Granular access control through dataset permissions
For more information on Sigma's product release strategy, see Sigma product releases.
Target Audience
Anyone who is trying to create content in Sigma and those interested in governing the calculations that are being used.
Prerequisites
- A computer with a current browser. It does not matter which browser you want to use.
- Access to your Sigma environment. A Sigma trial environment is acceptable and preferred.
- Some familiarity with Sigma is assumed. Not all steps will be shown as the basics are assumed to be understood.
What You'll Learn
How to apply Metrics in Sigma using Sigma's sample database to build out information based on a Marketing campaign use case.
What You'll Build
We will build a simple solution that meets requirements provided by Marketing for active campaign status.

Metrics in Sigma are custom aggregate calculations that can be reused across workbook data elements that share a data source (i.e., dataset or connection table).
They can be as simple or complex as required by the use case. The person creating Sigma content does not need to know the details of the metric to use them in their Workbook and by using an approved metric, they will accelerate their workflow.
Metrics are defined at the data source level to promote consistent metric logic across elements and help users perform standard calculations with ease and efficiency.
There are some basic rules for creating Metrics:
For Datasets:
For Connection Tables:
Marketing has requested details on how well the various Salesforce campaigns are performing.
They want specifics on active campaigns to make sure they are staying on budget:
<ol type="n">
  <li>How many leads are coming in for each campaign.</li>
  <li>The total cost (spend) per campaign.</li>
  <li>How much pipeline was generated.</li>
  <li>Value of closed pipeline.</li>
  <li>Which campaigns are over on their budget.</li>
</ol>
They also want the ability to drill down into the data to get to the lowest level available. They also want to create some visuals (TBD), using the same data on their own.
Now that we know what the requirements are, let's create a reusable set of data that leverages metrics so that any future use of the data includes the approved (governed) calculations.
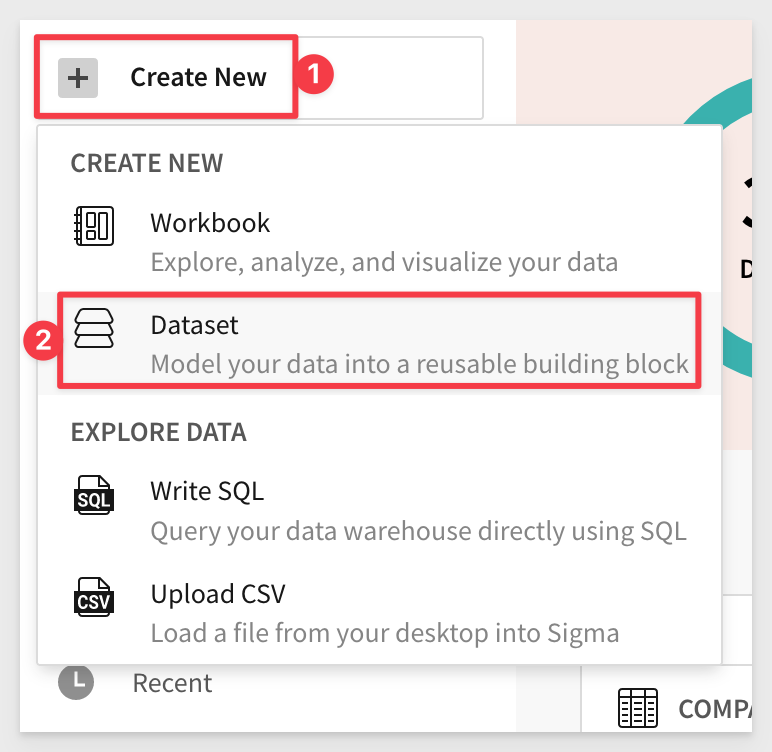
Login into Sigma and click + Create New and select Dataset.
On the Select a Data Source page, select Table.
We will be using the Salesforce data in our cloud data warehouse, as shown:
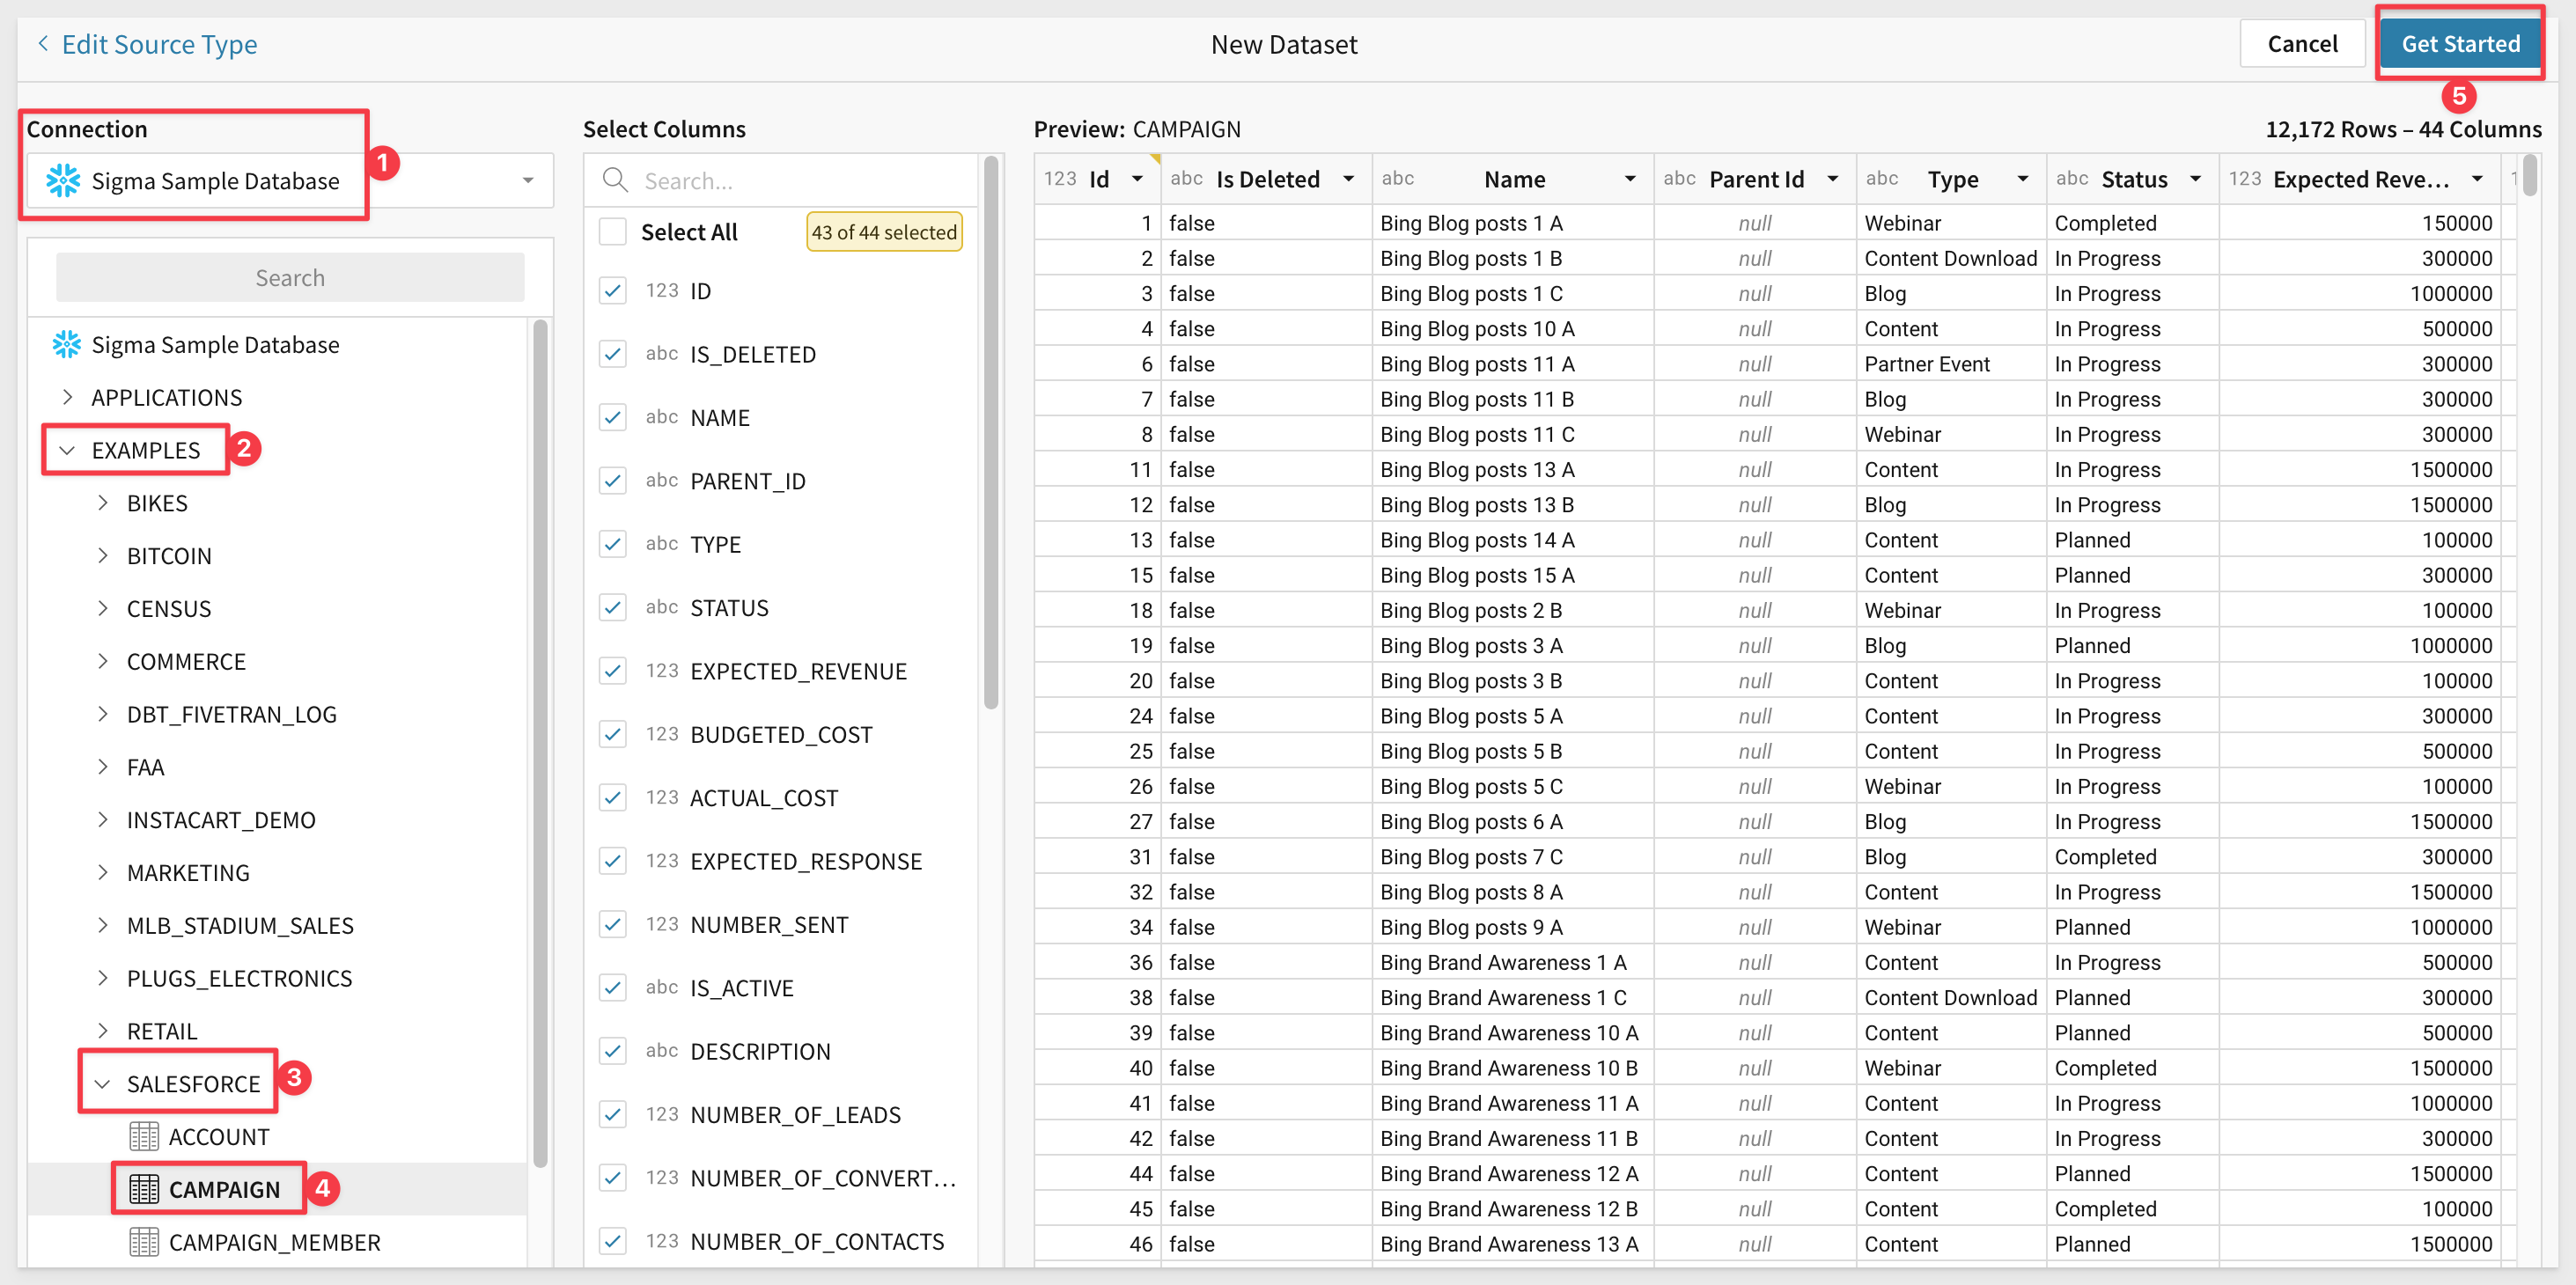
Click Get Started.
Recall that Marketing only wants to see active campaigns.
Click the Worksheet tab.
Select the column Is Active and click its menu. Select Filter:
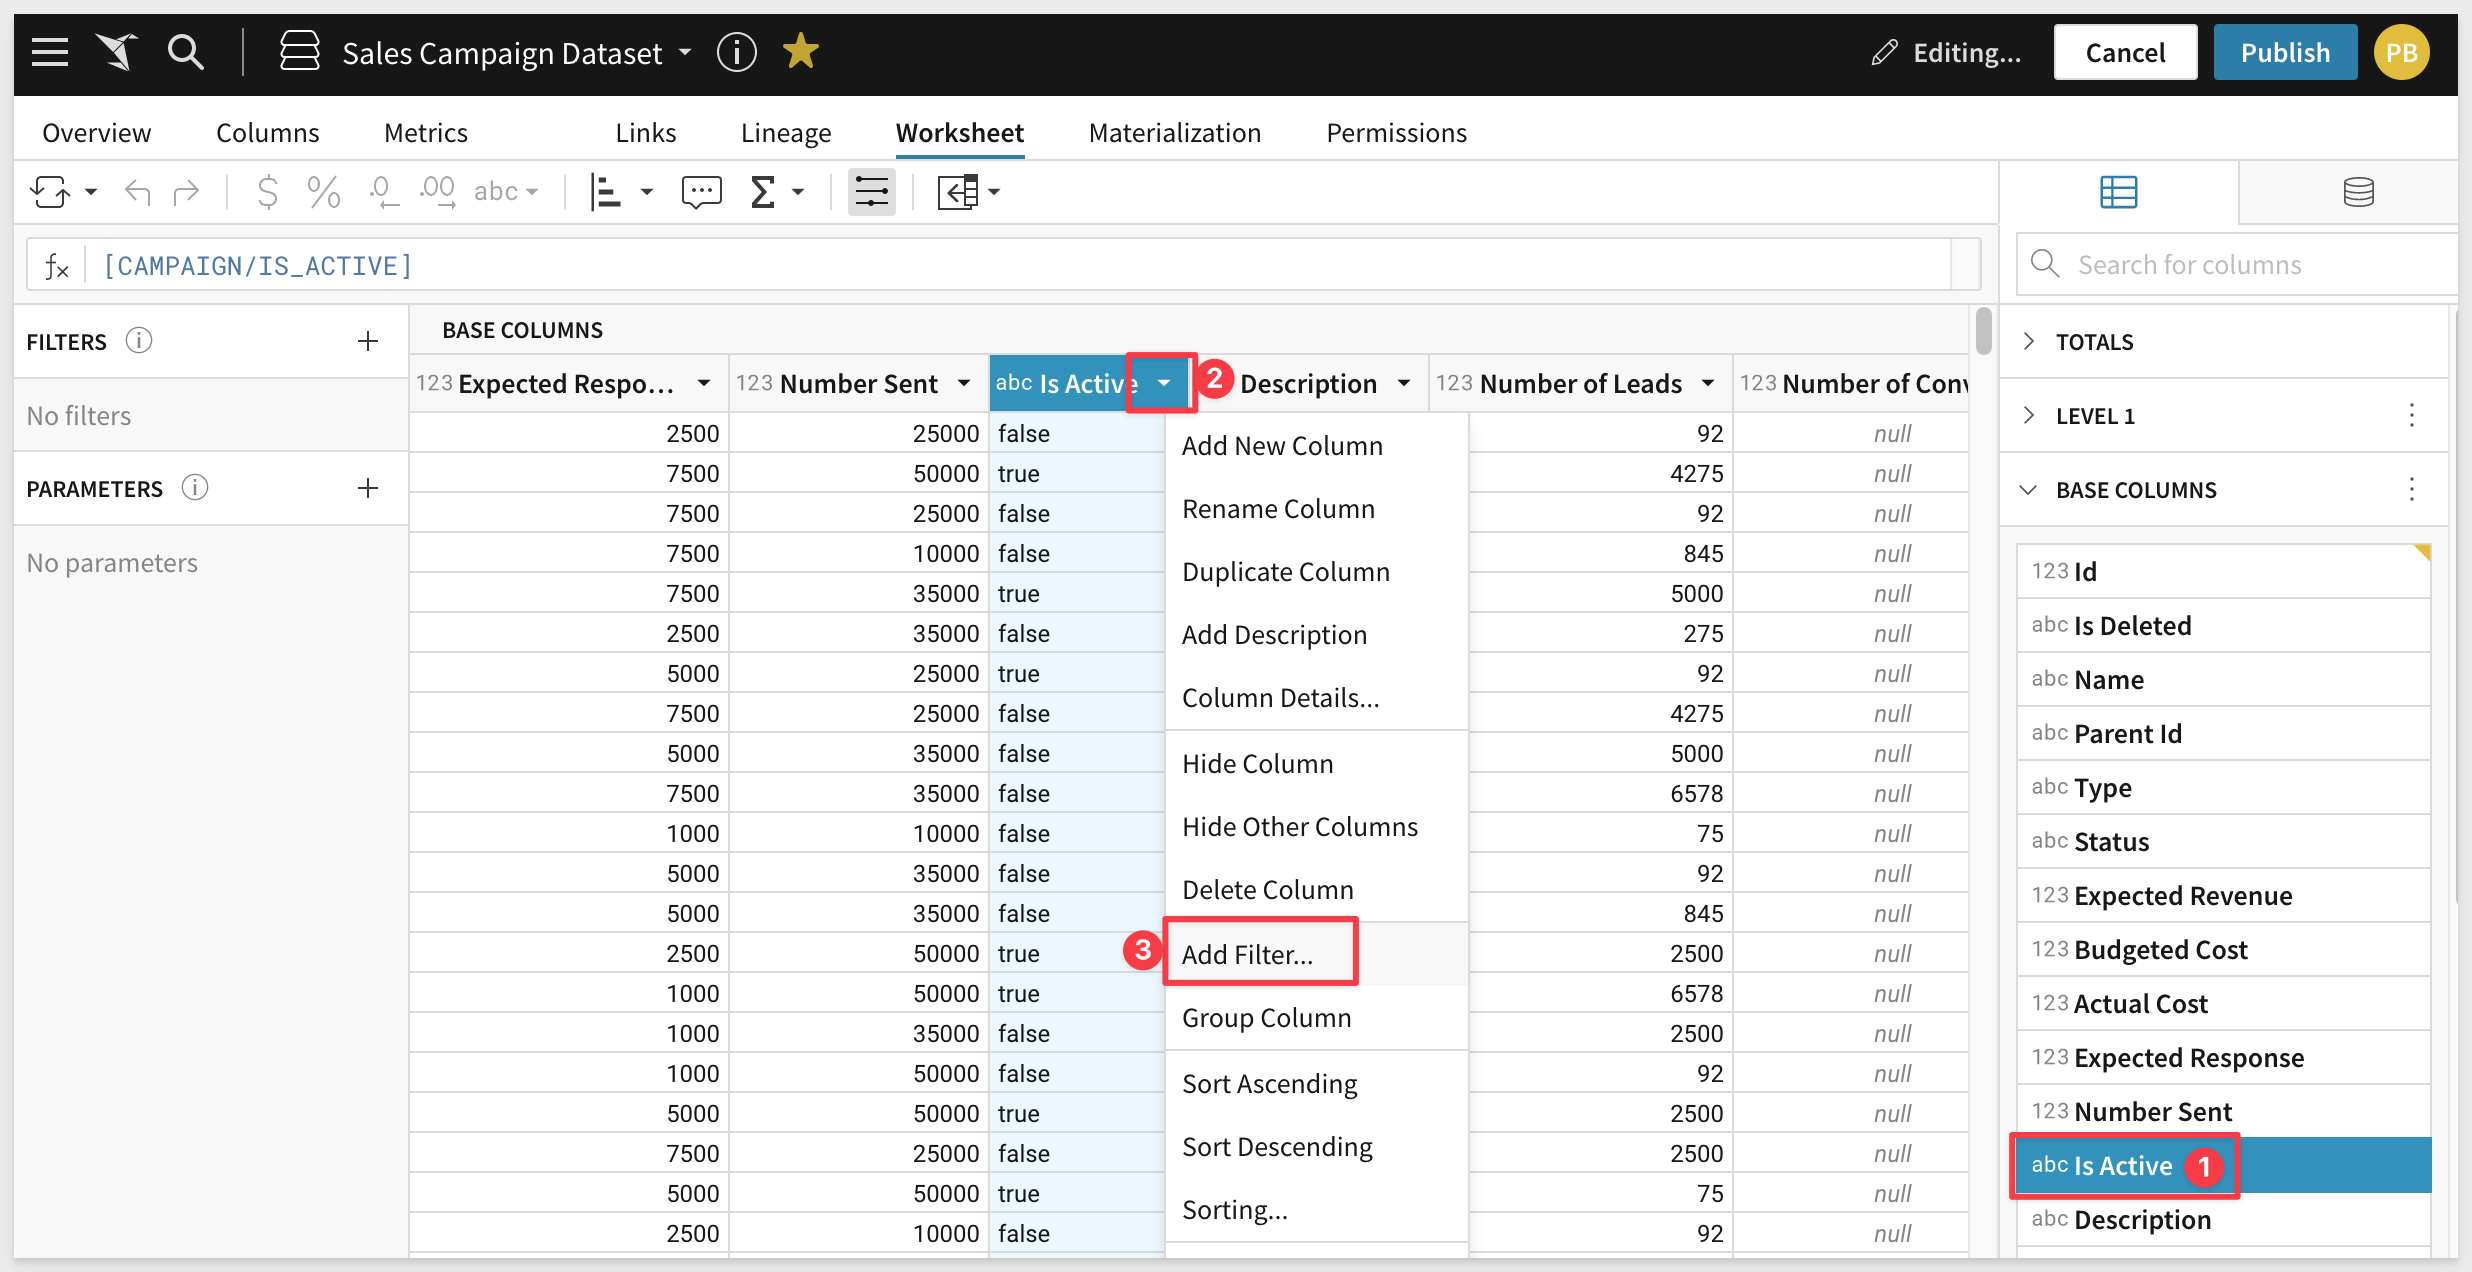
We want to exclude anything that is not "Active" or true:
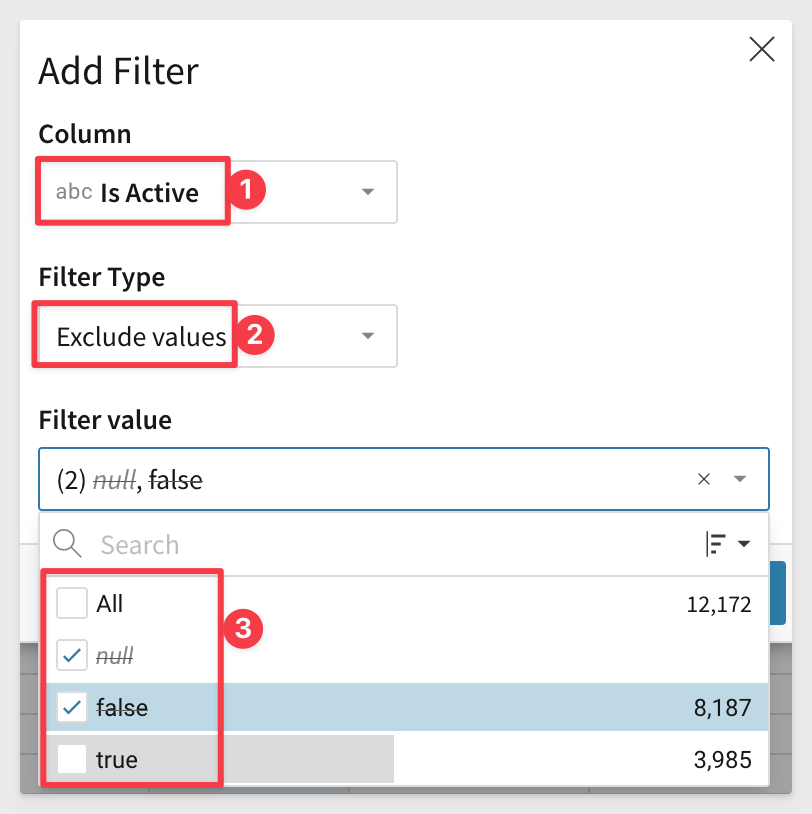
Click Save.
This will also serve to reduce the amount of data returned since it is not required in this use case.
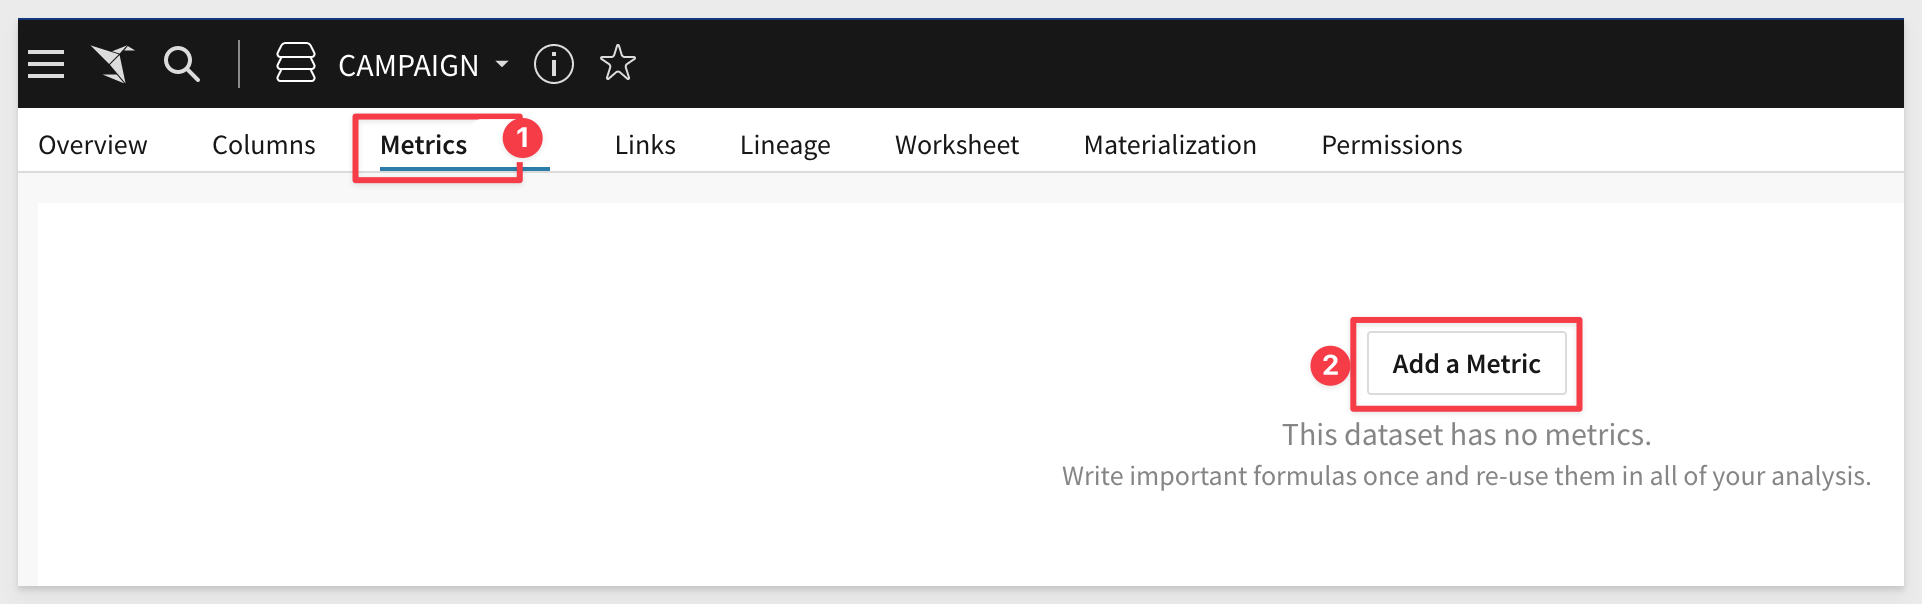
We are now presented with the unpublished Dataset and we can add some metrics.
Click the Metrics tab and click Add Metric:
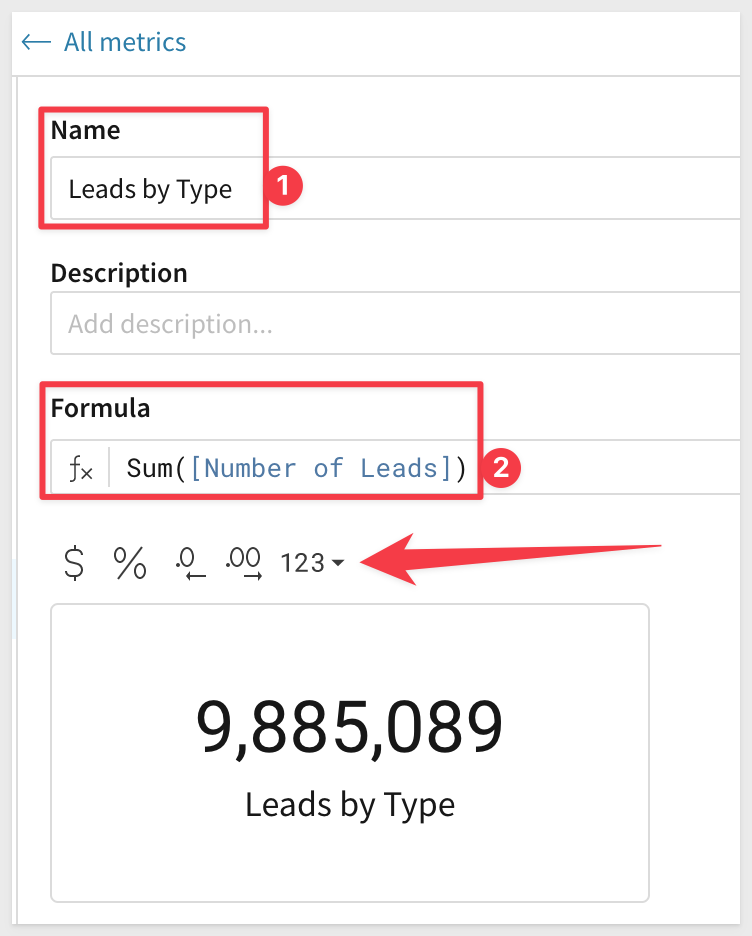
Adding new Metrics is very simple. All that is required is to provide a name and formula. The description can be very useful, but it is optional.
For this new metric, use:
NAME:             FORMULA:
Leads by Type     Sum([Number of Leads])
Notice that you can also set the default formatting for the Metric. This saves steps for the users later.
The metric is saved as soon as you create it.
Click the All Metrics link to see a list of all available metrics in this Dataset:
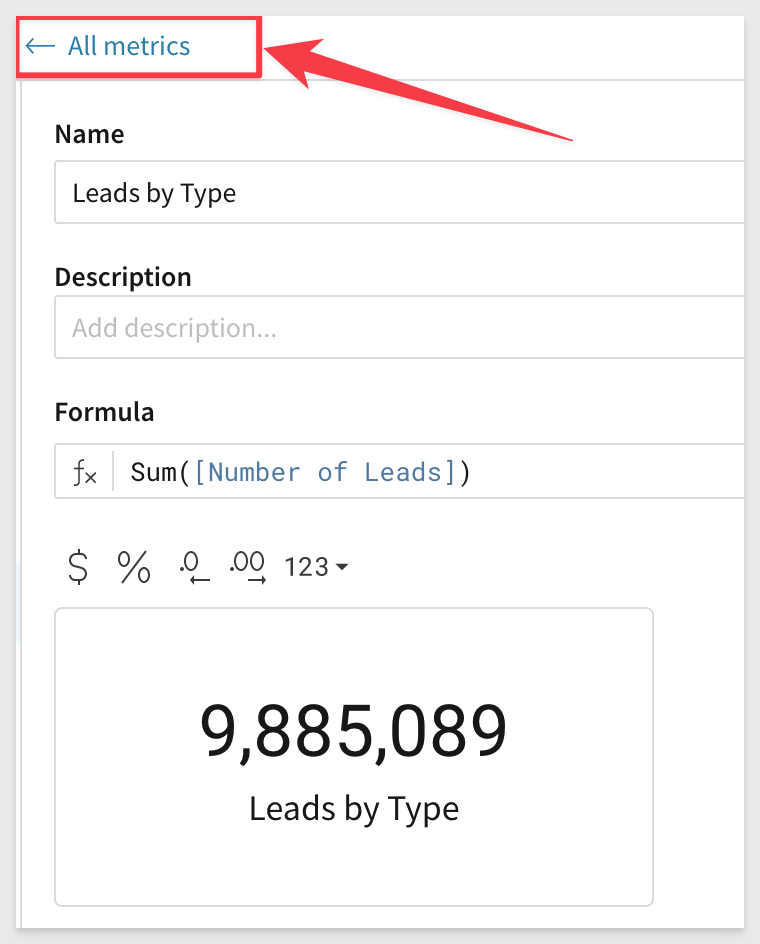
From this list you are also able to modify or delete any Metric.
Now create a few more metrics so that we can build our use case out:
NAME:                 FORMAT:        FORMULA:
Pipeline Generated    Currency       Sum([Amount All Opportunities])
Total Closed Won      Currency       Sum([Amount Won Opportunities])
Budget Allocated      Currency       Sum([Budgeted Cost])
Actual $ Spend        Currency       Sum([Actual Cost])
Attributed Margin     Currency       Sum([Amount Won Opportunities] - [Actual Cost])
Under-Over Budget     Automatic      If(Sum([Actual Cost]) / Sum([Budgeted Cost]) >= 1, "Over Budget", "Under Budget")
Most of the metrics used are simple enough but as you can see with the Under-Over Budget formula, you can get as complex as needed and use any of the available Functions.
Click here to see the available functions in Sigma
If you have not already done so, name the Dataset Sales Campaign Dataset and Publish it.
Now that we have a Dataset with some Metrics, let's build content.
From the Sales Campaign Dataset, click the Explore button in the upper right corner of the page header.
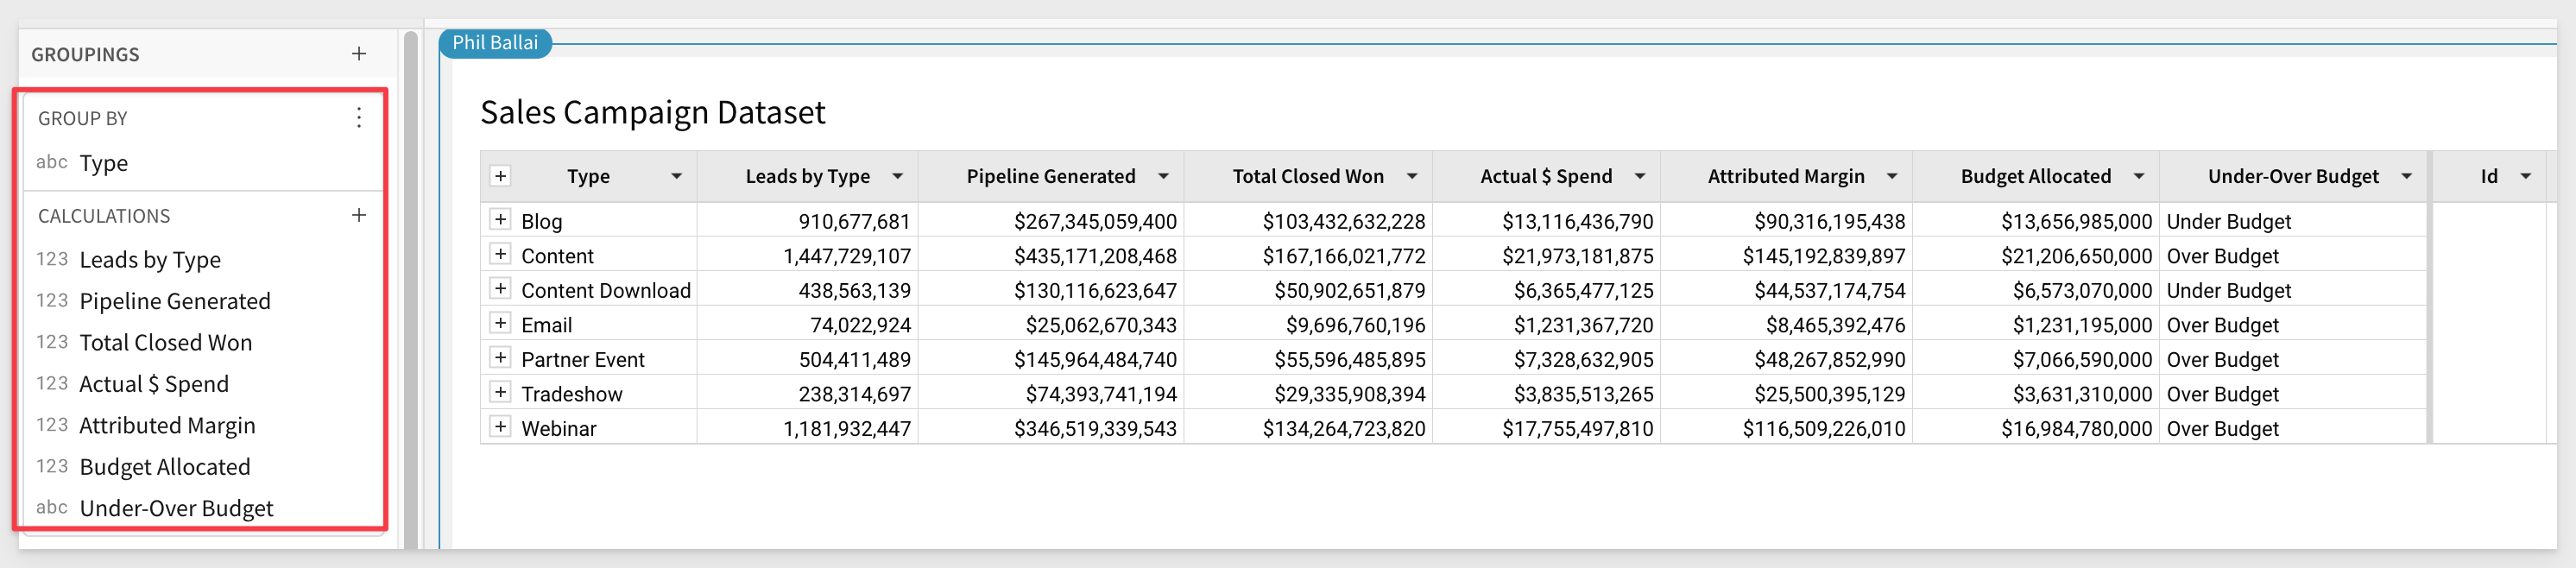
Group the table by Type.
Now let's add some columns but instead of having to do it manually and sort out the correct calculations, we will just use the bre-built ones provided by Metrics.
In the Element Panel, click the Metrics tab.
Drag each Metric to the Calculations under the Grouping for Type in the order in which you want the columns appear:
Let's also make the campaigns that are over budget stand out while we are here:
For the column Under-Over Budget click the menu icon and select Conditional formatting:
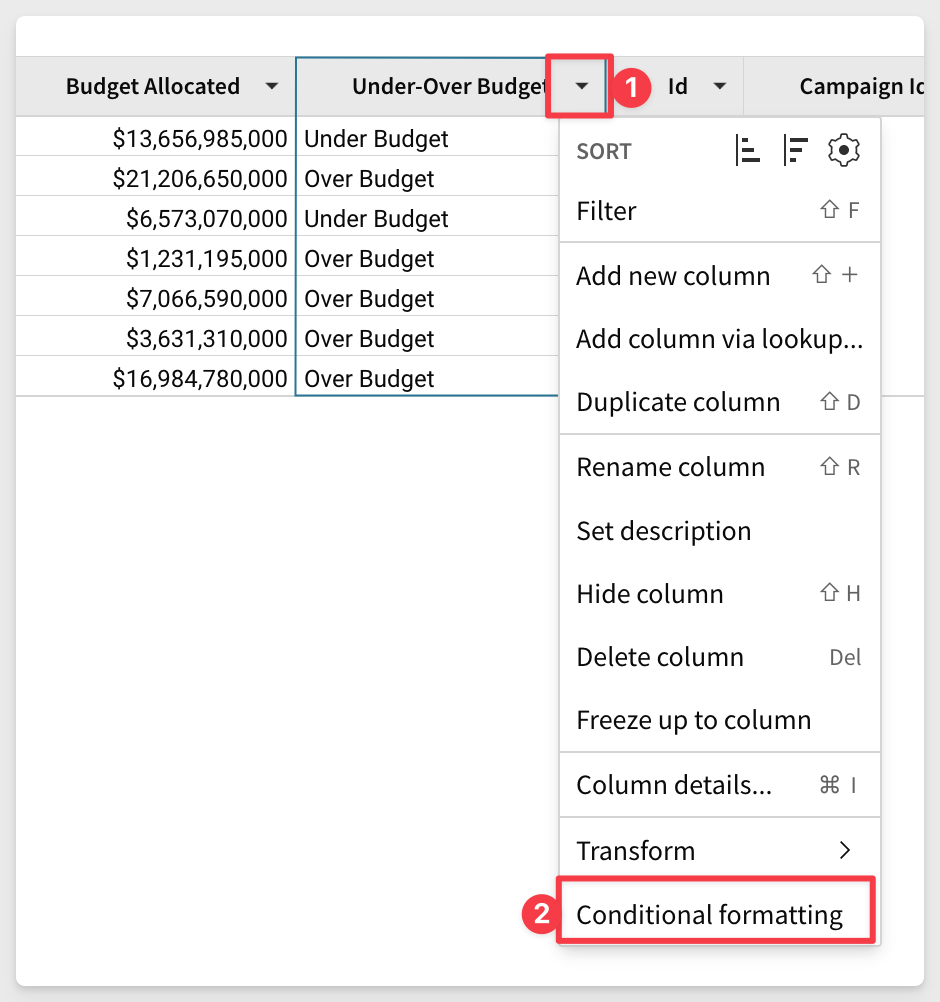
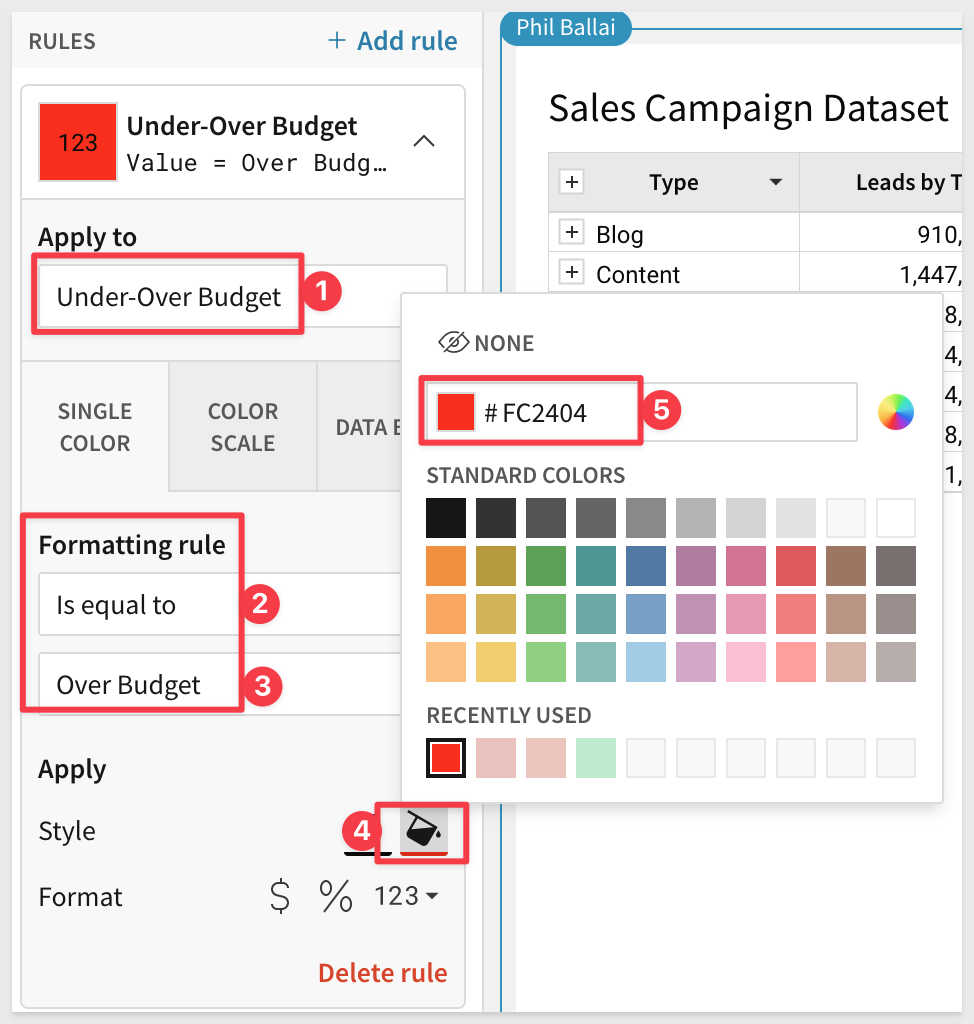
Configure it so that cells with "Over Budget" will appear red in the column cell:
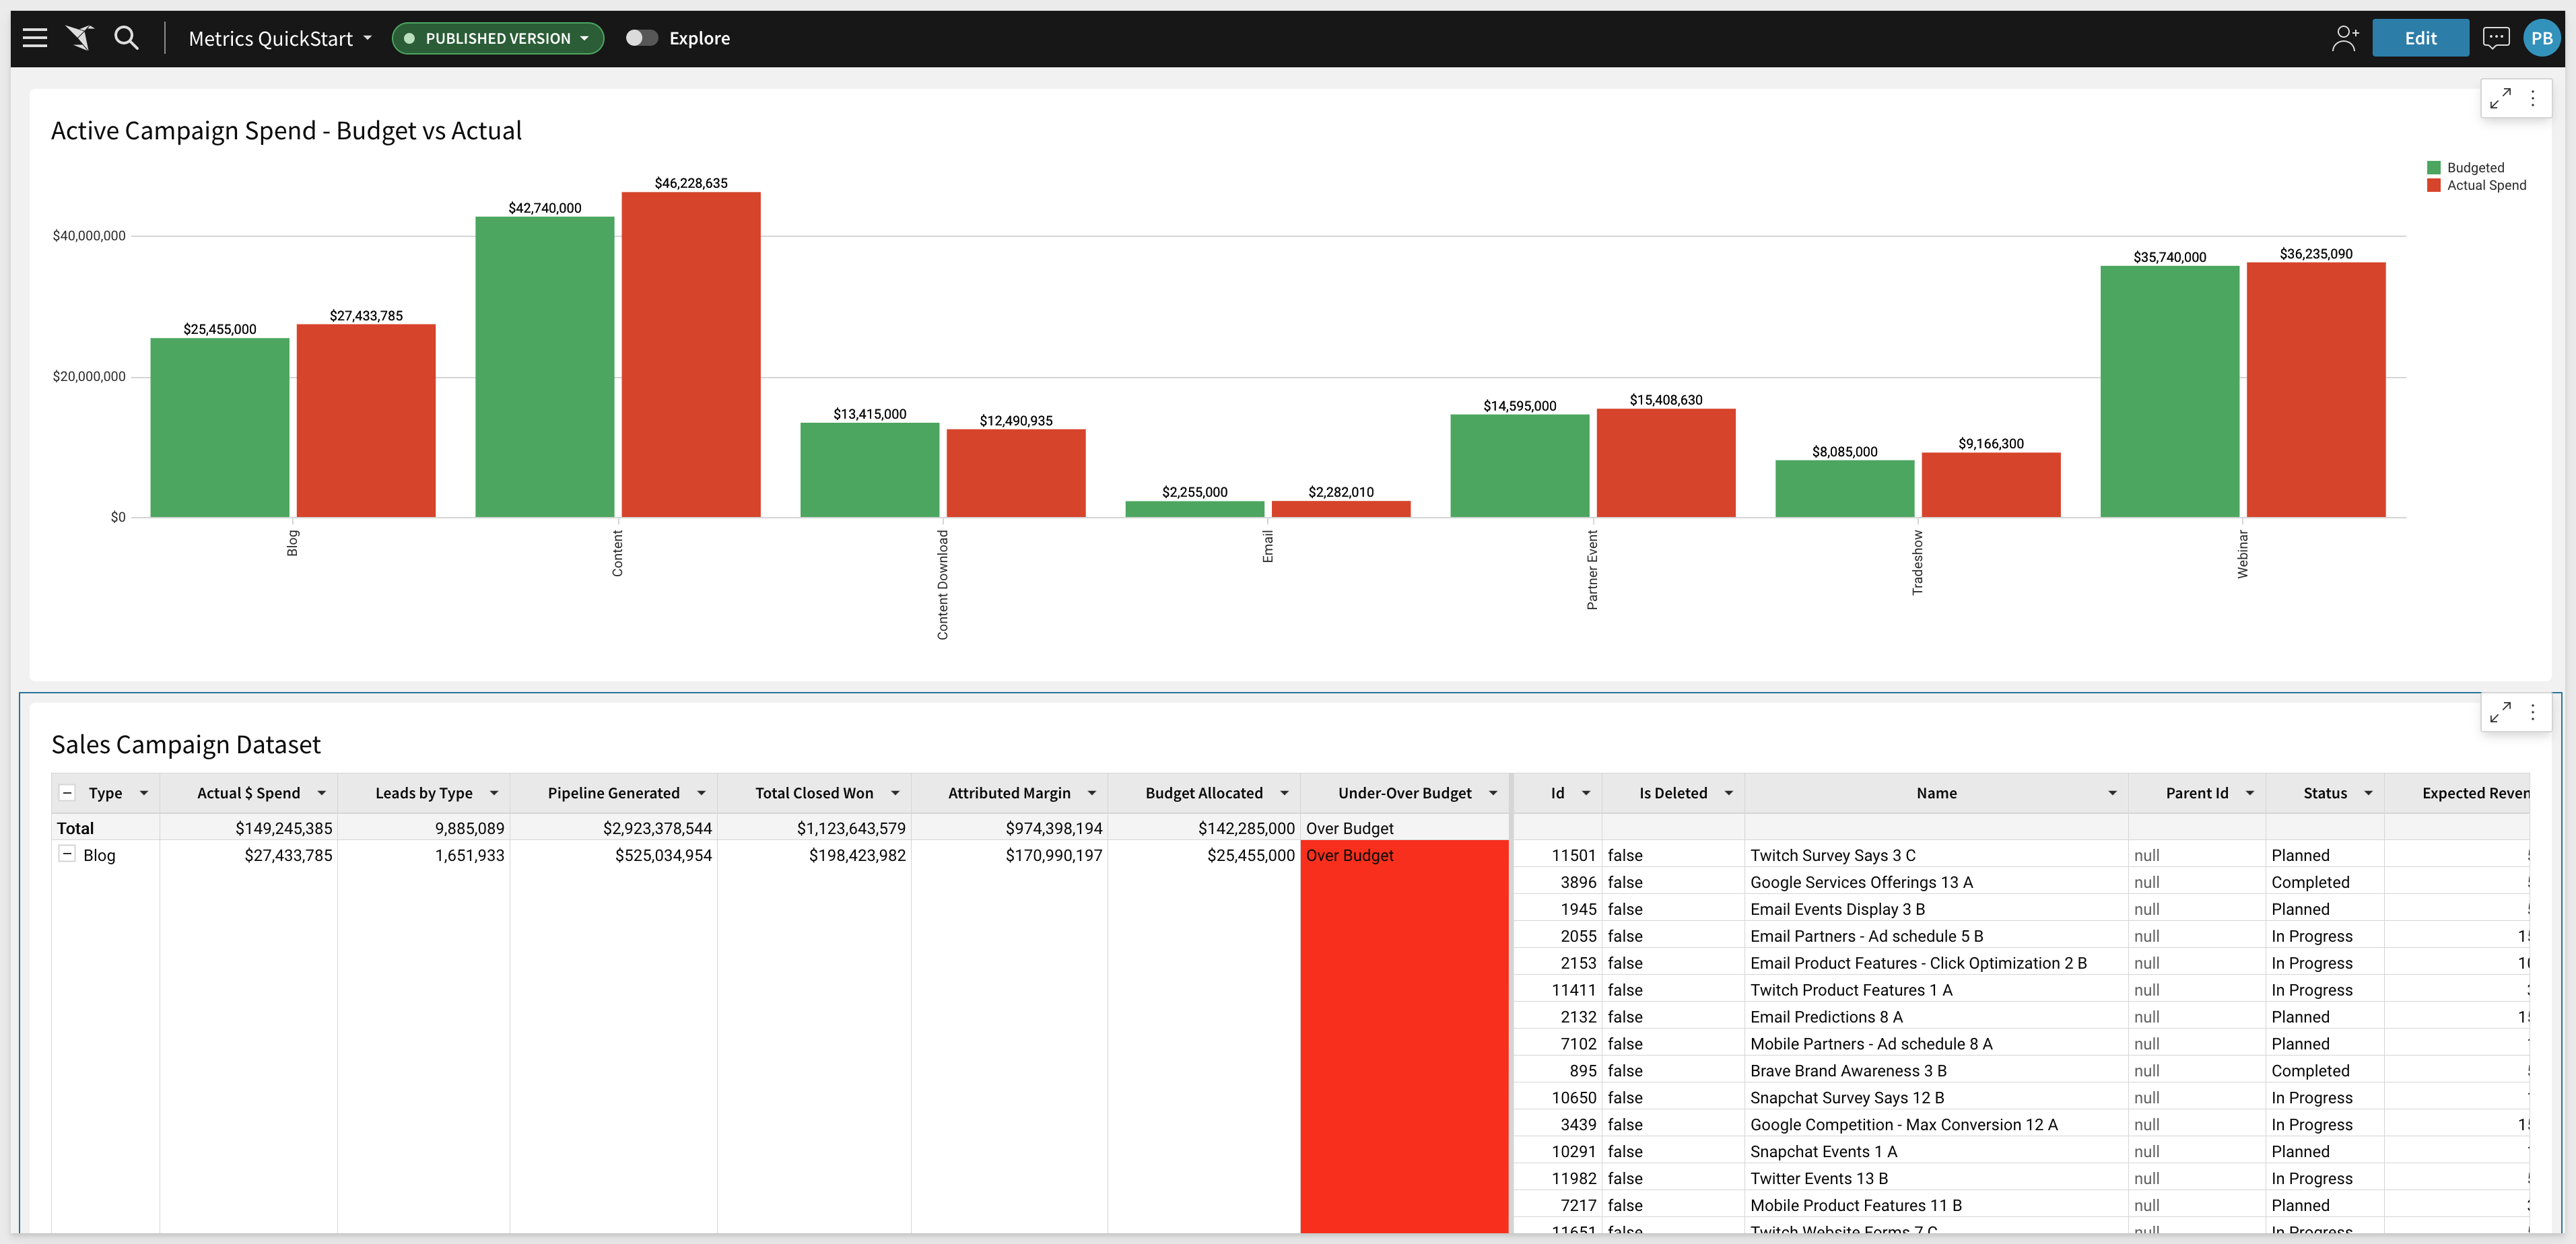
Now that we have a table using trusted calculations, we can leverage it into a Visualization to make easy to see campaign spend to date:
We simply create a Child Element / Visualization from the table:
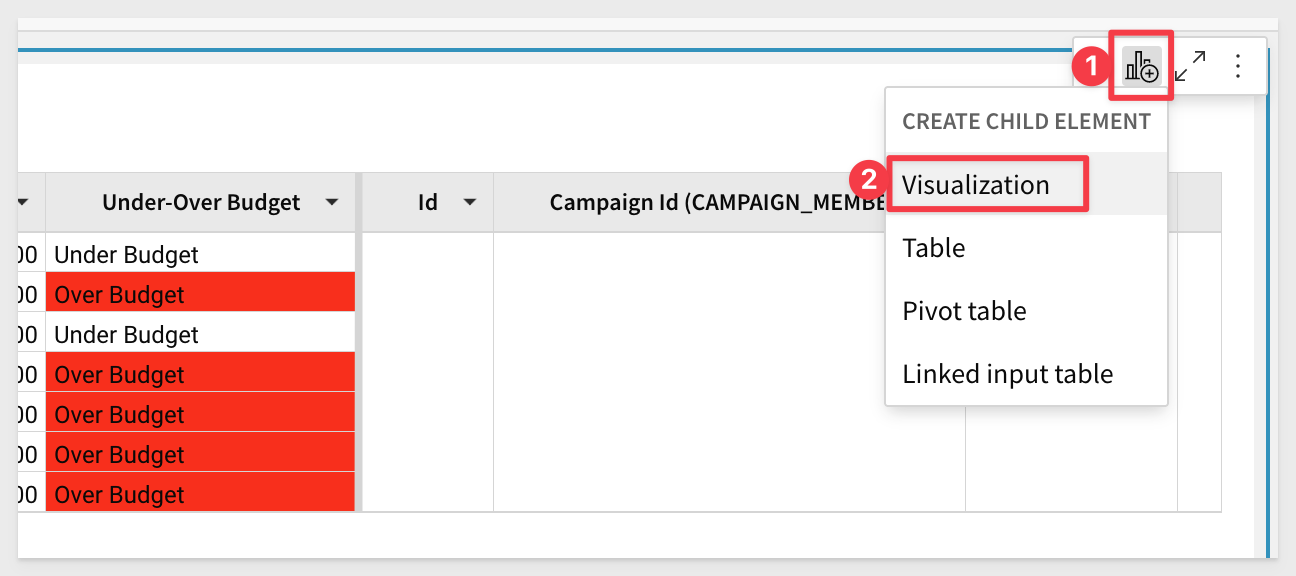
and configure a bar chart as:
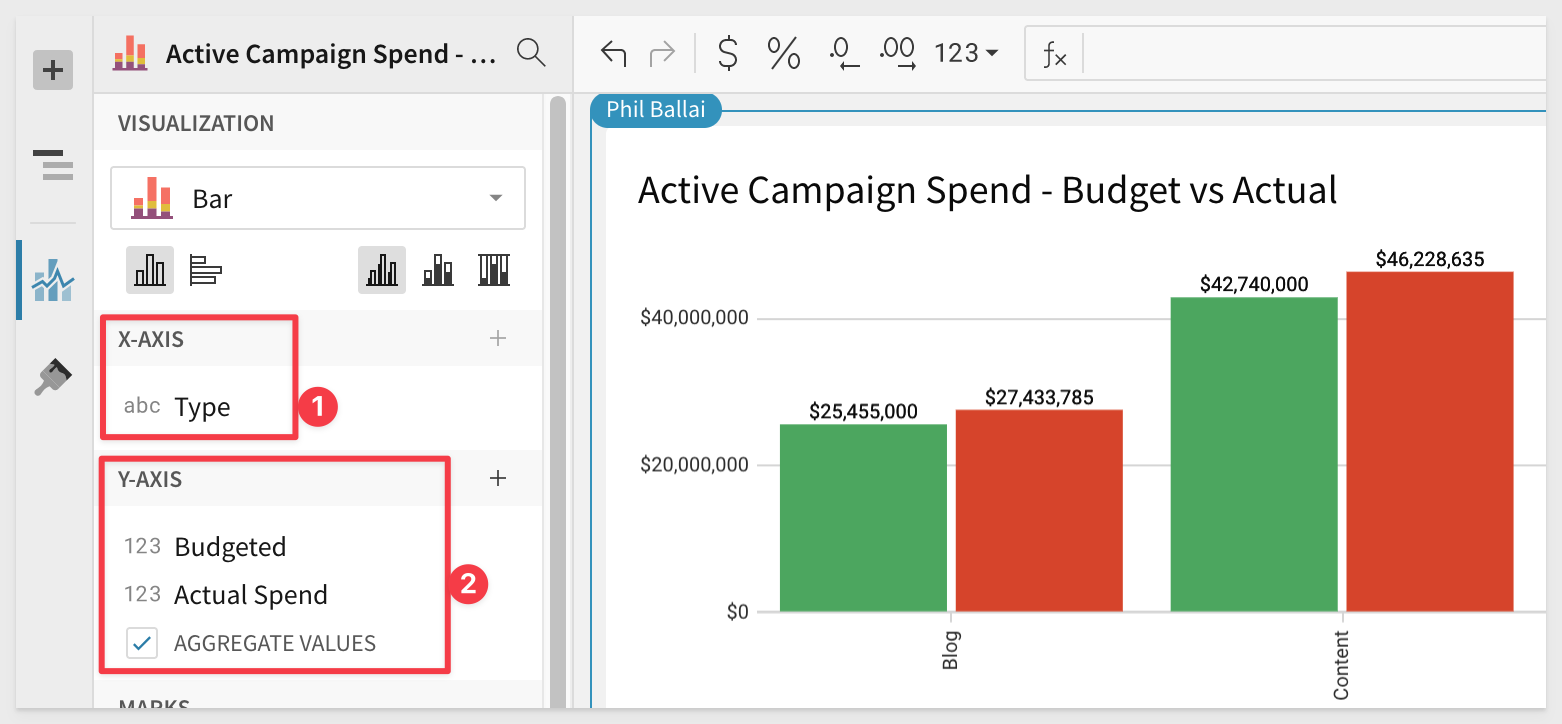
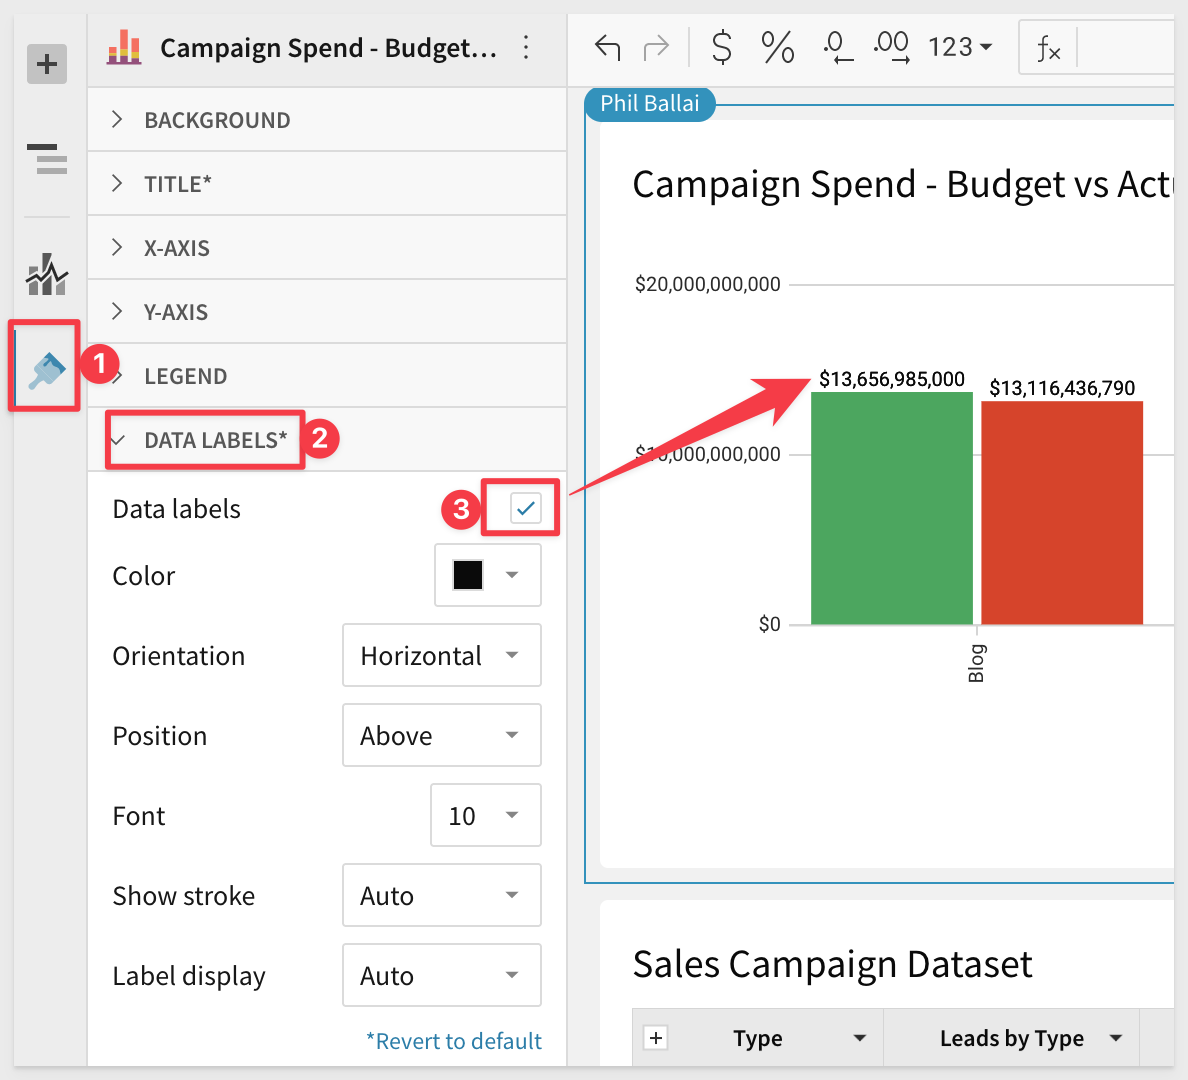
We also enabled data labels to display the value on top of each bar:
Rename the chart to Active Campaign Spend - Budget vs Actual.
Publish your Workbook and see the final results by navigating to the Published Version:
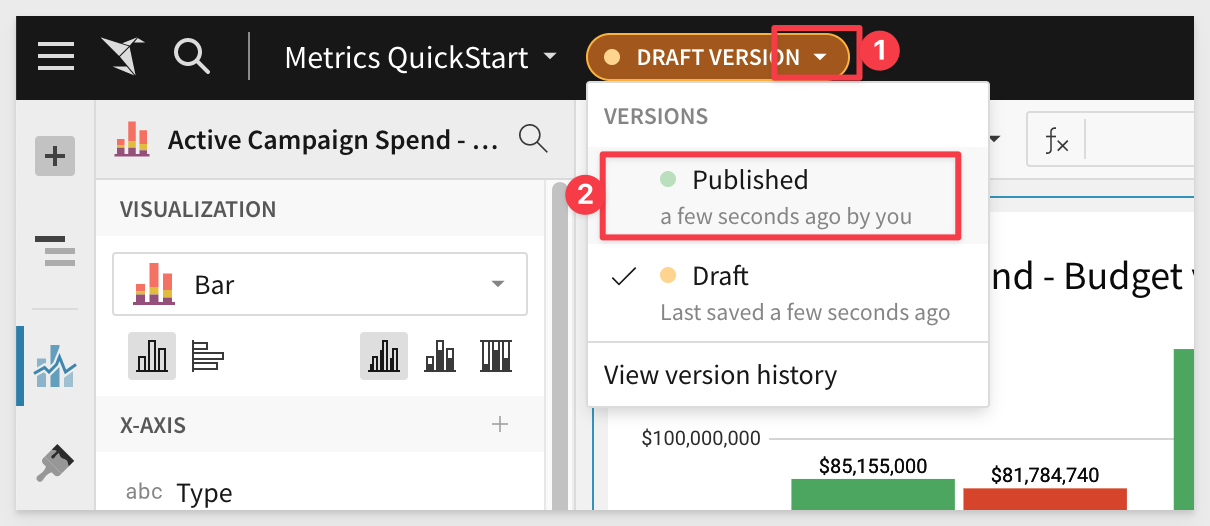
Now Marketing has all the information they requested and can use Sigma's Drill Anywhere feature to get to the lowest level of data to explore as they see fit without having us pre-define the drill-path.
For more information on Metrics click here.
In this lab we learned how to create and manage Metrics in Sigma.
Additional Resource Links
Be sure to check out all the latest developments at Sigma's First Friday Feature page!
Help Center Home
Sigma Community
Sigma Blog