Describe what you want in plain language and watch Sigma build it — a sales dashboard, a survey app, a formatted input table — all live on your data and ready to publish, not a throwaway mockup.
The Fundamentals 01 QuickStart introduces Assistant for analysis — asking a question and opening the answer in a workbook. Here we go further: using Assistant's Plan and Build modes to design and construct dashboards and AI apps from scratch, then refine them conversationally.
Along the way you'll learn how to:
- Use Assistant's
PlanandBuildmodes, and switch between them - Start from a governed data model and let semantic search find the right source
- Plan a build from a design image, and have Assistant question the plan before building
- Build a revenue forecast — actuals, a projection, KPIs, and COGS/margin views
- Refine the result conversationally, adding controls and adjusting the forecast
For more information on Sigma's product release strategy, see Sigma product releases
If something isn't working as expected, here's how to contact Sigma support
Target Audience
Builders — analysts and developers who create workbooks, dashboards, and apps — and anyone who wants to move from an idea to a working Sigma asset quickly. Some familiarity with Sigma is assumed; if you're brand new, start with Fundamentals 01
Prerequisites
- A computer with a current browser.
- Access to a Sigma environment where Assistant is enabled for building. See the premium feature note above.
- An AI provider configured by your administrator. See Set up an AI provider.
- The Use Assistant and Create, edit, and publish workbooks permissions on your account type.

When you're editing a workbook draft, Assistant works in two modes beyond the analysis you saw in Fundamentals 01:
- Plan mode — Assistant gathers context, clarifies your goals, and proposes a structured approach: recommended pages, elements, layout, and the data sources needed. Nothing is built until you approve. You can refine the plan in the prompt bar or open the plan editor with
View plan. - Build mode — Assistant creates and modifies workbook content: tables, charts, KPIs, controls, filters, tabbed containers, modals, input tables, and the actions that make an app interactive.
Assistant opens in Build mode by default. Use the mode picker in the prompt bar to switch, and Assistant will sometimes suggest a switch itself — for example, offering Plan mode when a request is ambiguous. Your conversation context carries across both modes.
Two starting points
Where you begin depends on what you already have:
- Adjusting an existing dashboard — select the page or element you want to change, open Assistant from the element toolbar, and describe the change. Assistant edits in place, so you can refine what's already built without starting over.
- Building something new — start in
Planmode. Iterate on a detailed plan before anything is built, then switch toBuild. Planning first isn't just tidy — it's cheaper. Every build request spends AI credits; agreeing on scope and structure up front means Assistant builds the right thing once, instead of building, discarding, and rebuilding.
The rest of this QuickStart walks both paths — planning and building something new, and editing something that already exists.
Where to find Assistant
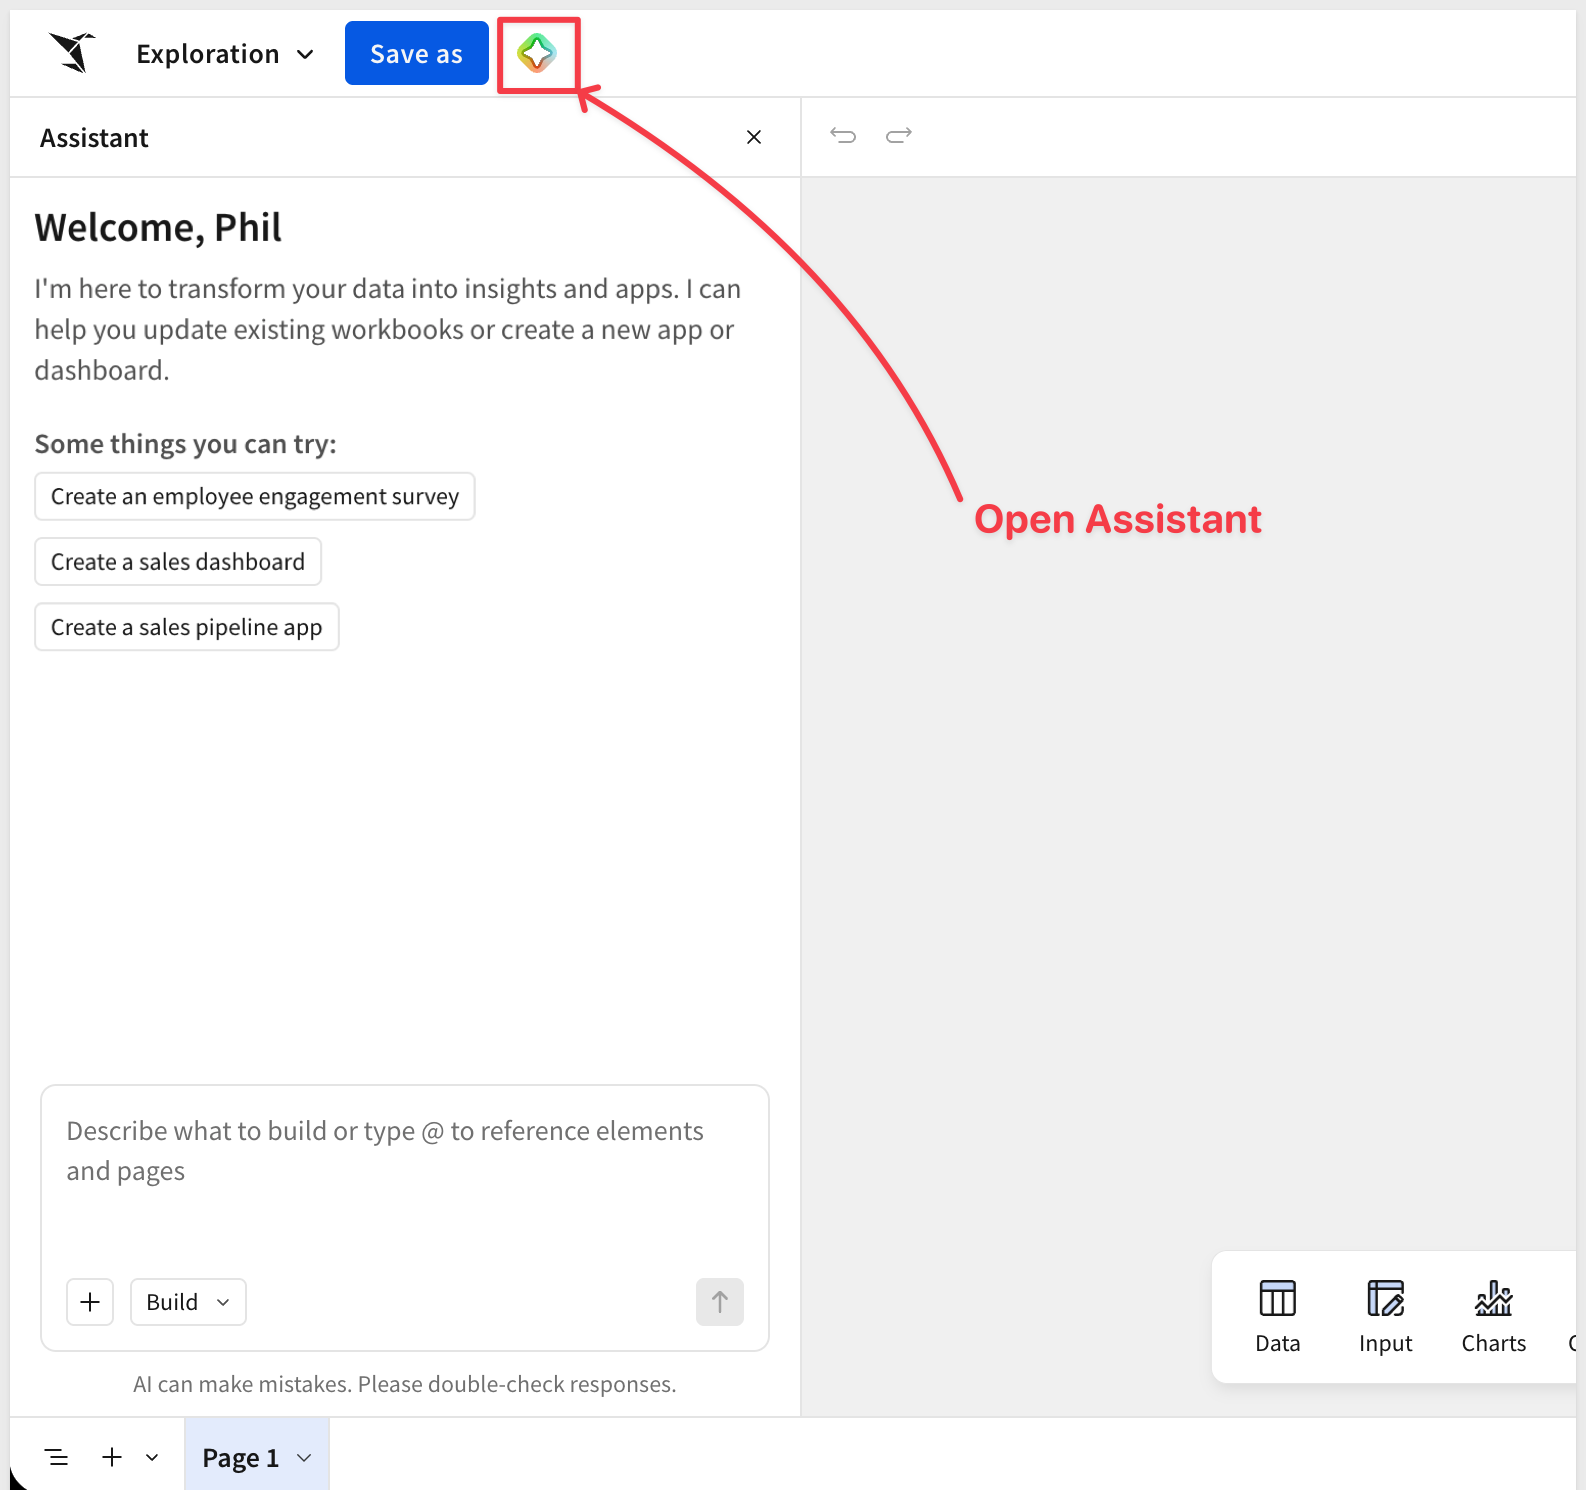
While editing a workbook draft, open Assistant from any of these entry points, which can vary based on your Sigma configuration:
- The empty-state prompt on a new, blank page
- The
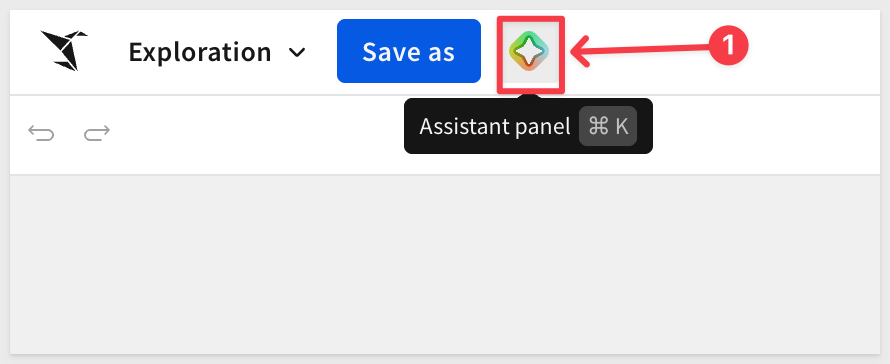
Assistant panelicon in the workbook header - The
⌘ + K(macOS) orCtrl + K(Windows) keyboard shortcut - The
Ask or edit with prompticon on a selected element's toolbar
Attach context to a prompt
Assistant produces better results when you point it at the right information. In the prompt bar, use Add or type @ to attach:
- A data source — a table, data model, semantic view, or existing element for Assistant to build from or analyze
- A workbook object — a page or element for Assistant to answer questions about, build on, or modify
- An image — a visual reference Assistant can add to the workbook or rebuild natively in Sigma
Best practice dictates building on a data model rather than a raw warehouse table. Assistant can read from tables, data models, and semantic views, but the quality of what it builds depends on the source you give it. A data model pre-defines business-friendly column names, descriptions, and metrics, so Assistant interprets your prompts accurately instead of guessing at raw column names. Authoring the model is a separate step your data team does up front — if you're new to it, see Fundamentals 10: Data Modeling
Here's the part that saves you time: you don't have to go hunting for the right source. Assistant's semantic search finds it from a plain description of the data you need.
We could start from the Assistant on the left sidebar of the homepage, but instead let's create a new workbook first.
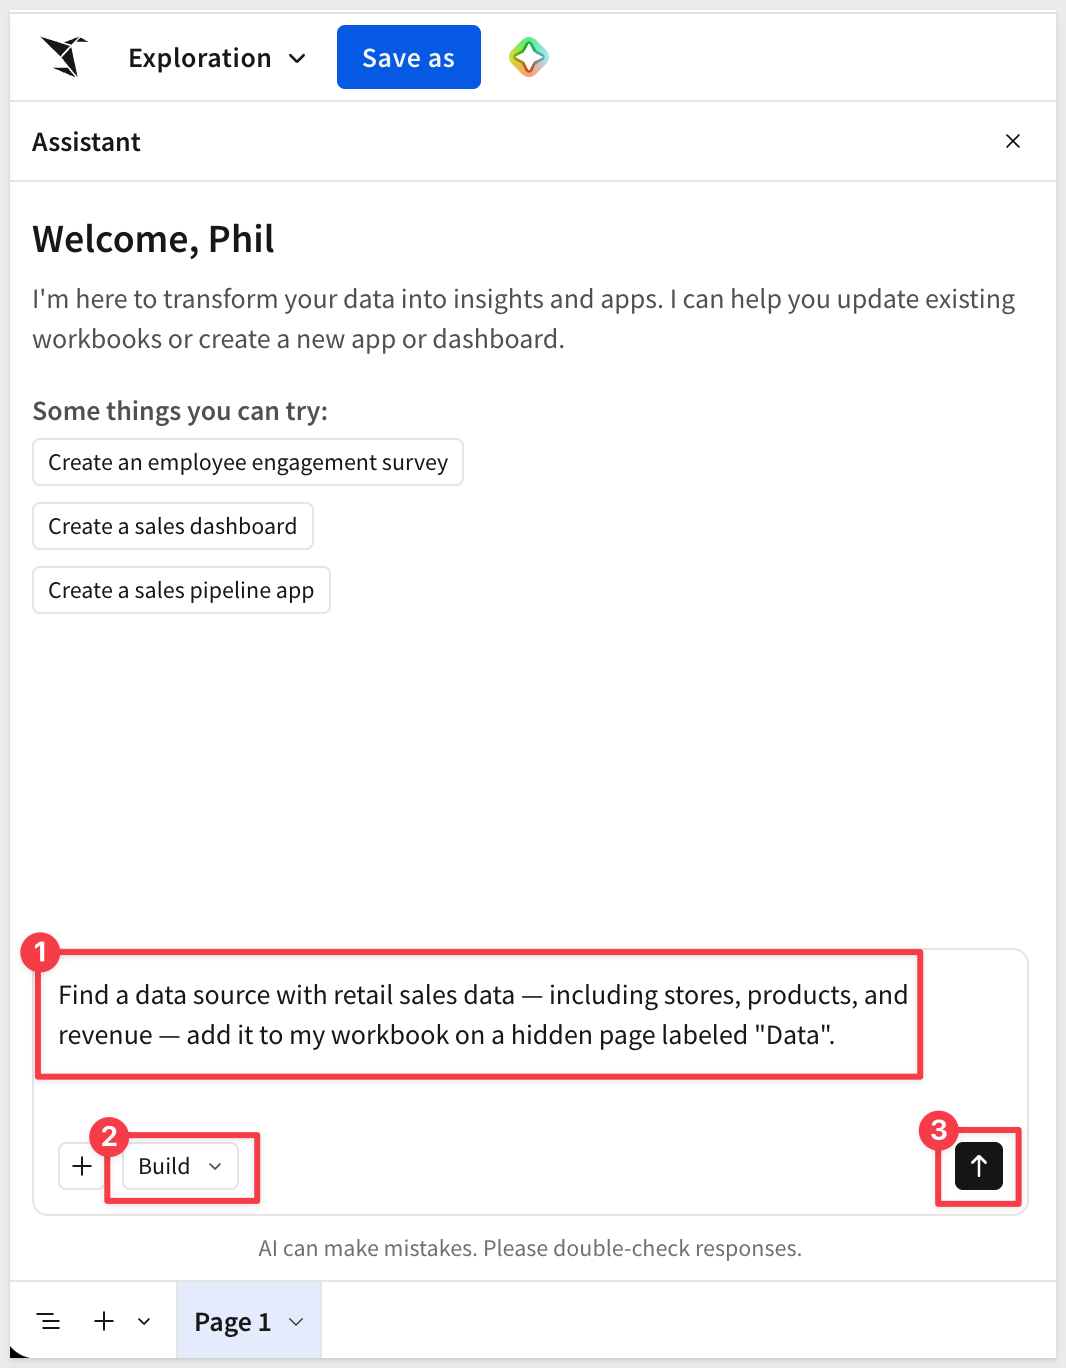
Click Create new > Workbook, open Assistant, and — instead of naming a table — describe what you're after:
We will use Build mode so that Assistant can also add the table to our workbook.
Find a data source with retail sales data — including stores, products, and revenue — add it to my workbook on a hidden page labeled "Data".
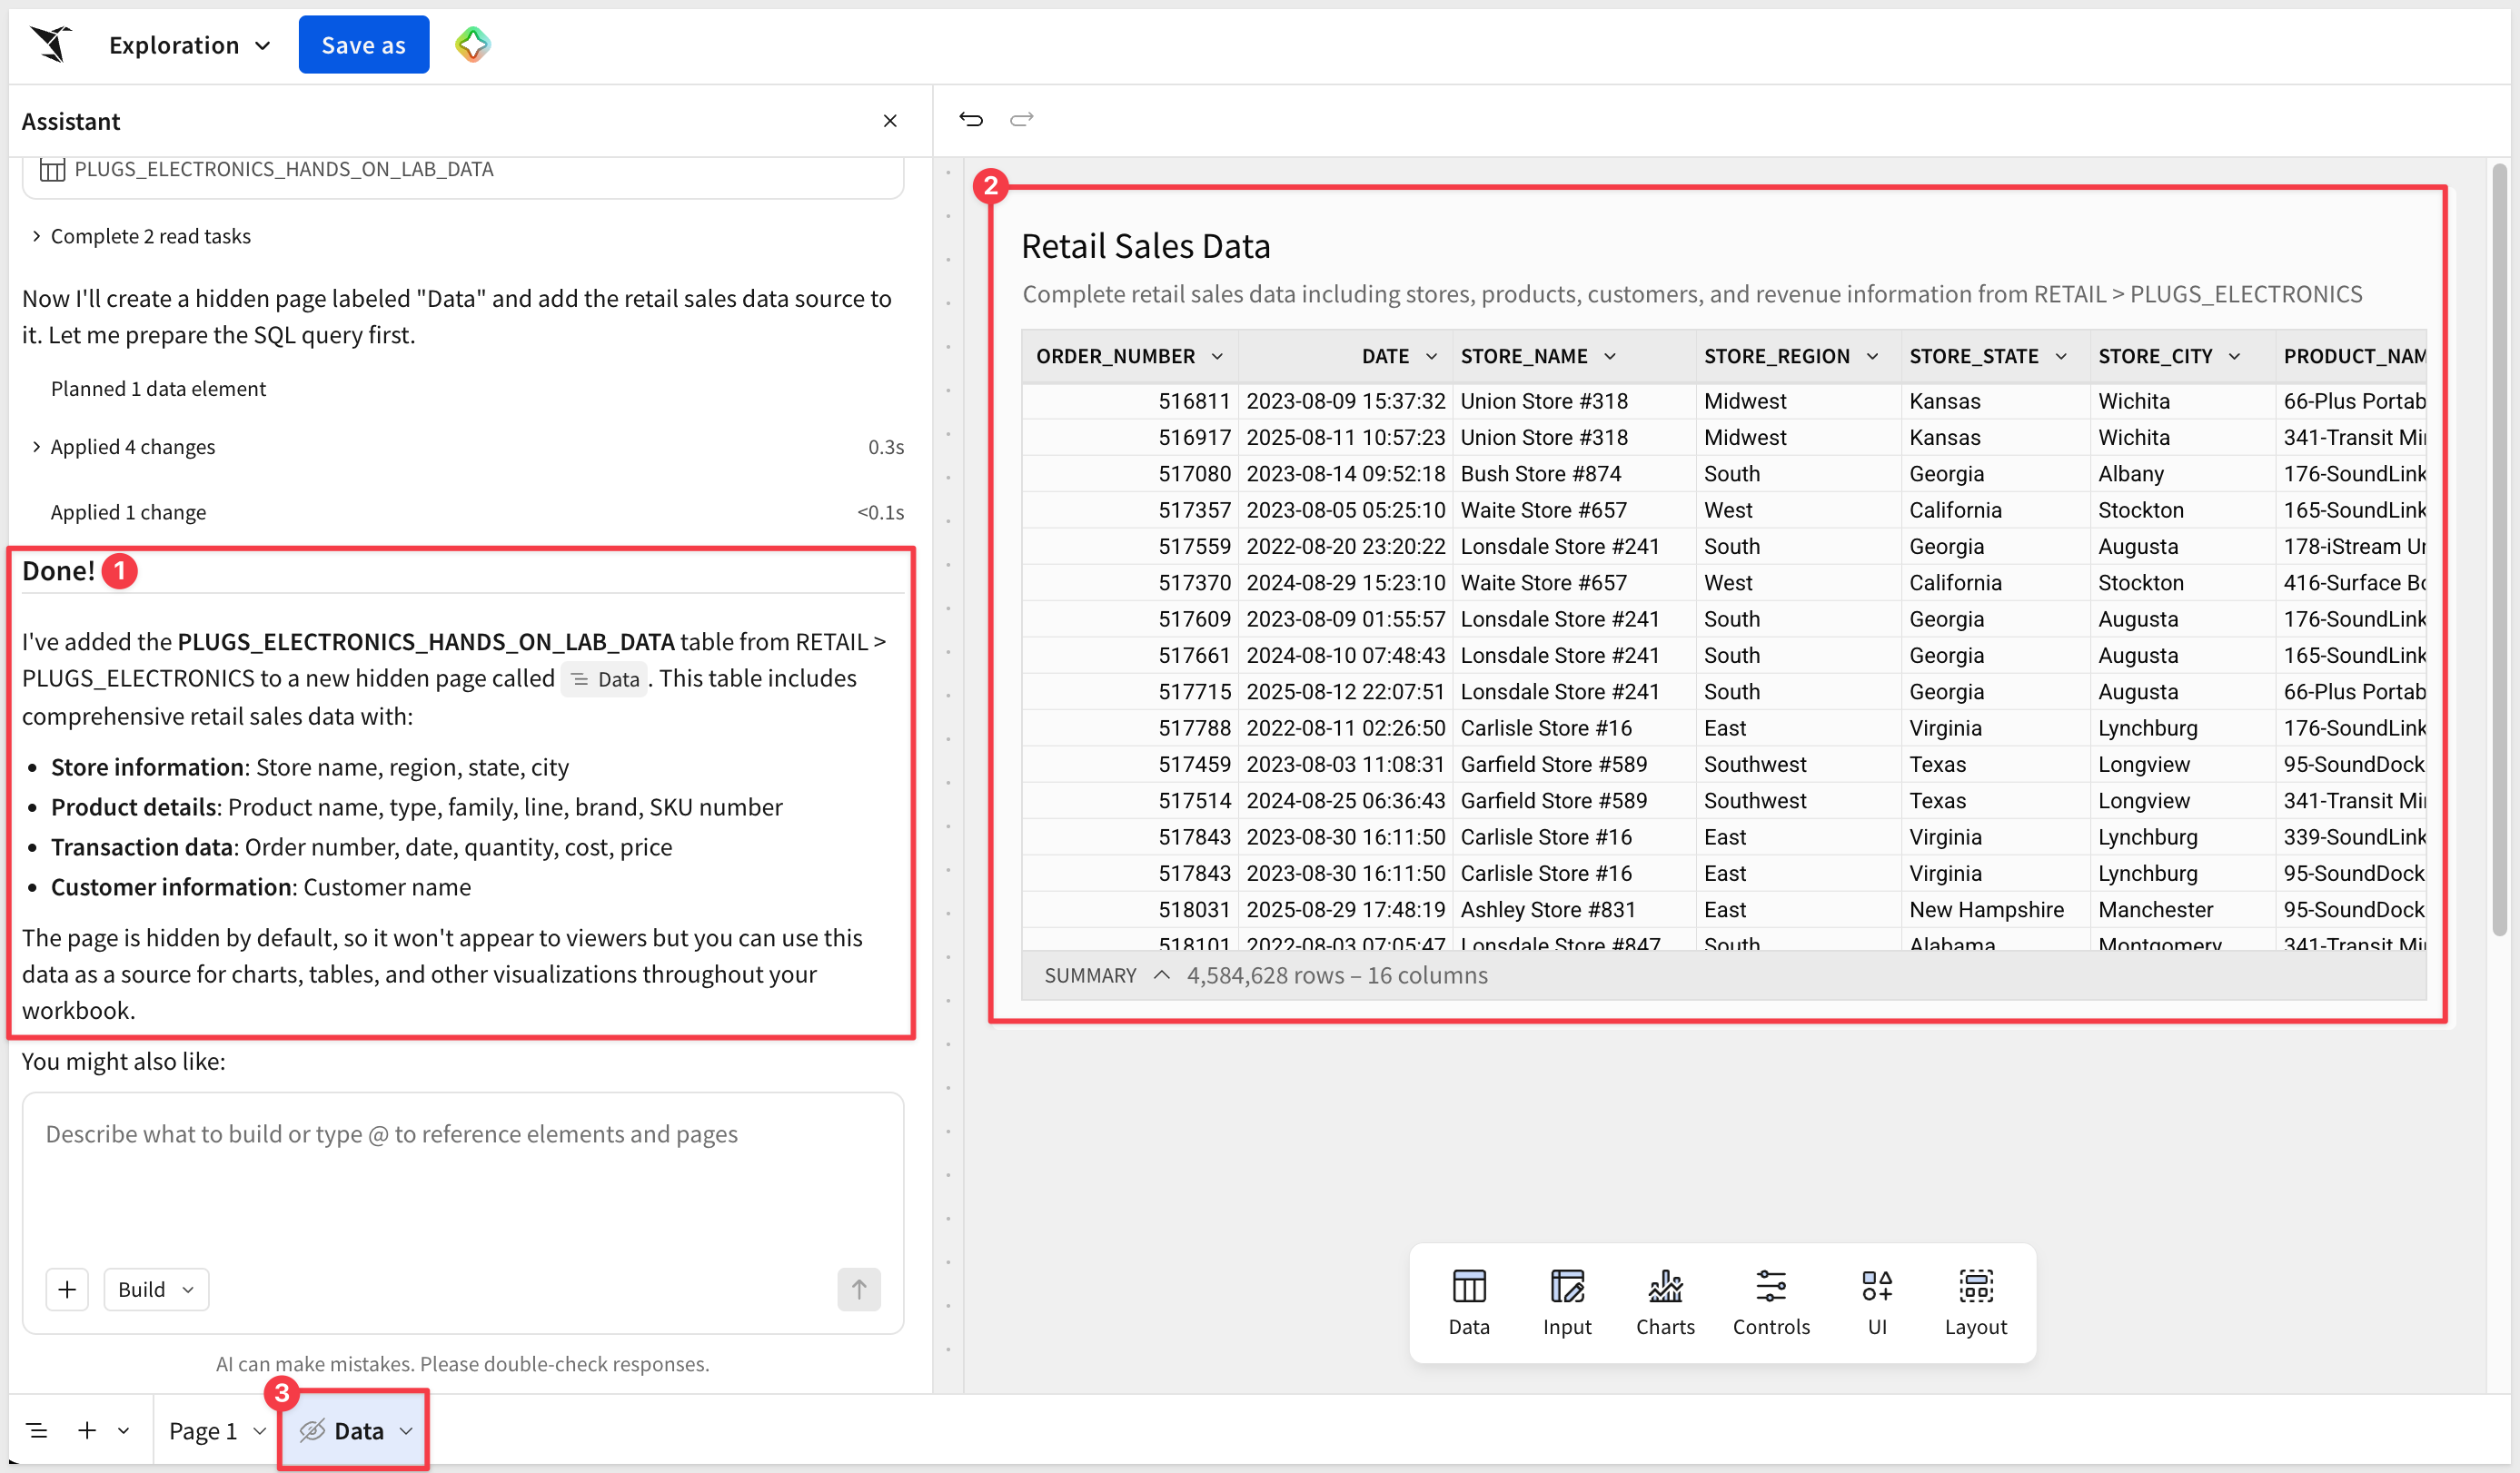
Assistant searches the data you're permitted to access, matches your description to the PLUGS_ELECTRONICS_HANDS_ON_LAB_DATA table in Sigma Sample Database > RETAIL, and prompts for us to select the correct one — no schema knowledge required.
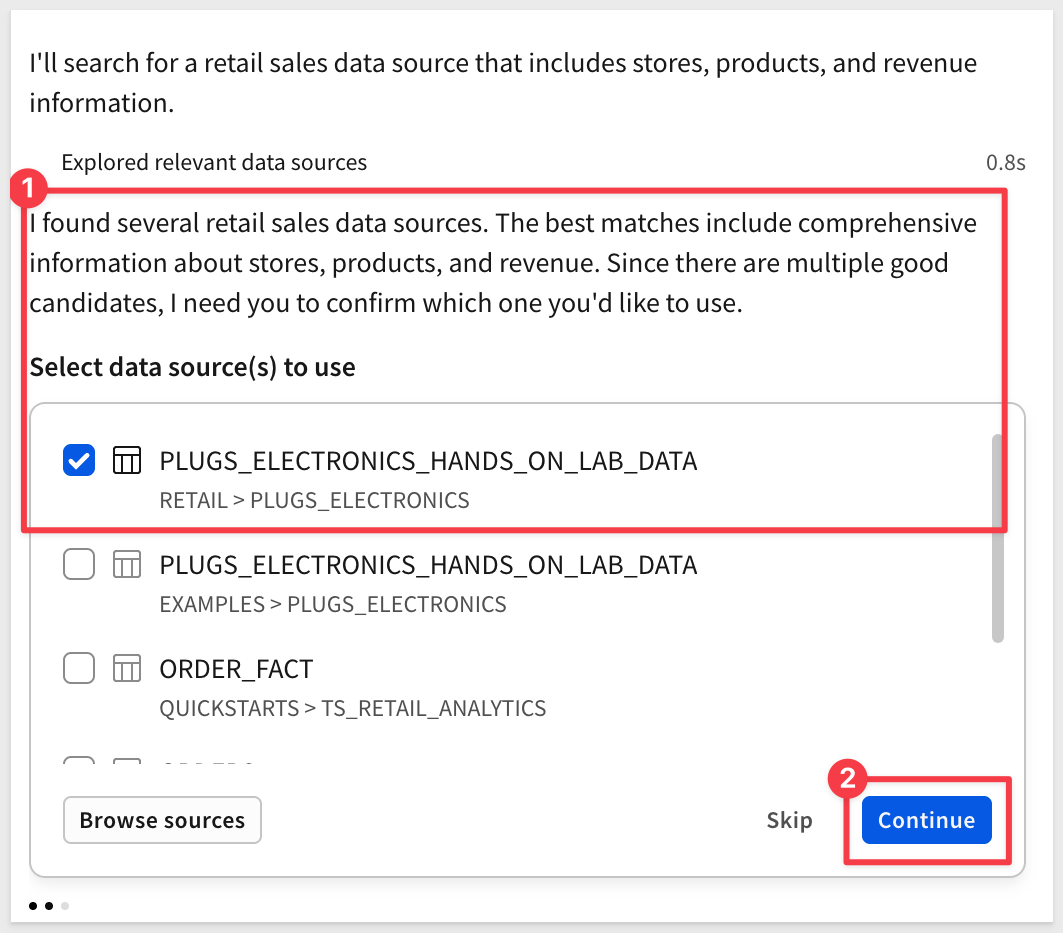
Choose the RETAIL > PLUGS_ELECTRONICS table and click Continue.
Assistant lets us know when it is done with that task:
Now the payoff — building a real dashboard. We'll build a revenue forecast: actual revenue over time, a projection for the months ahead, and the KPIs and metric views an executive would expect. Rather than firing a single prompt and hoping, we'll plan first, let Assistant ask us questions, then build.
Planning up front is also where you save the most build time and AI credits.
Attach a design
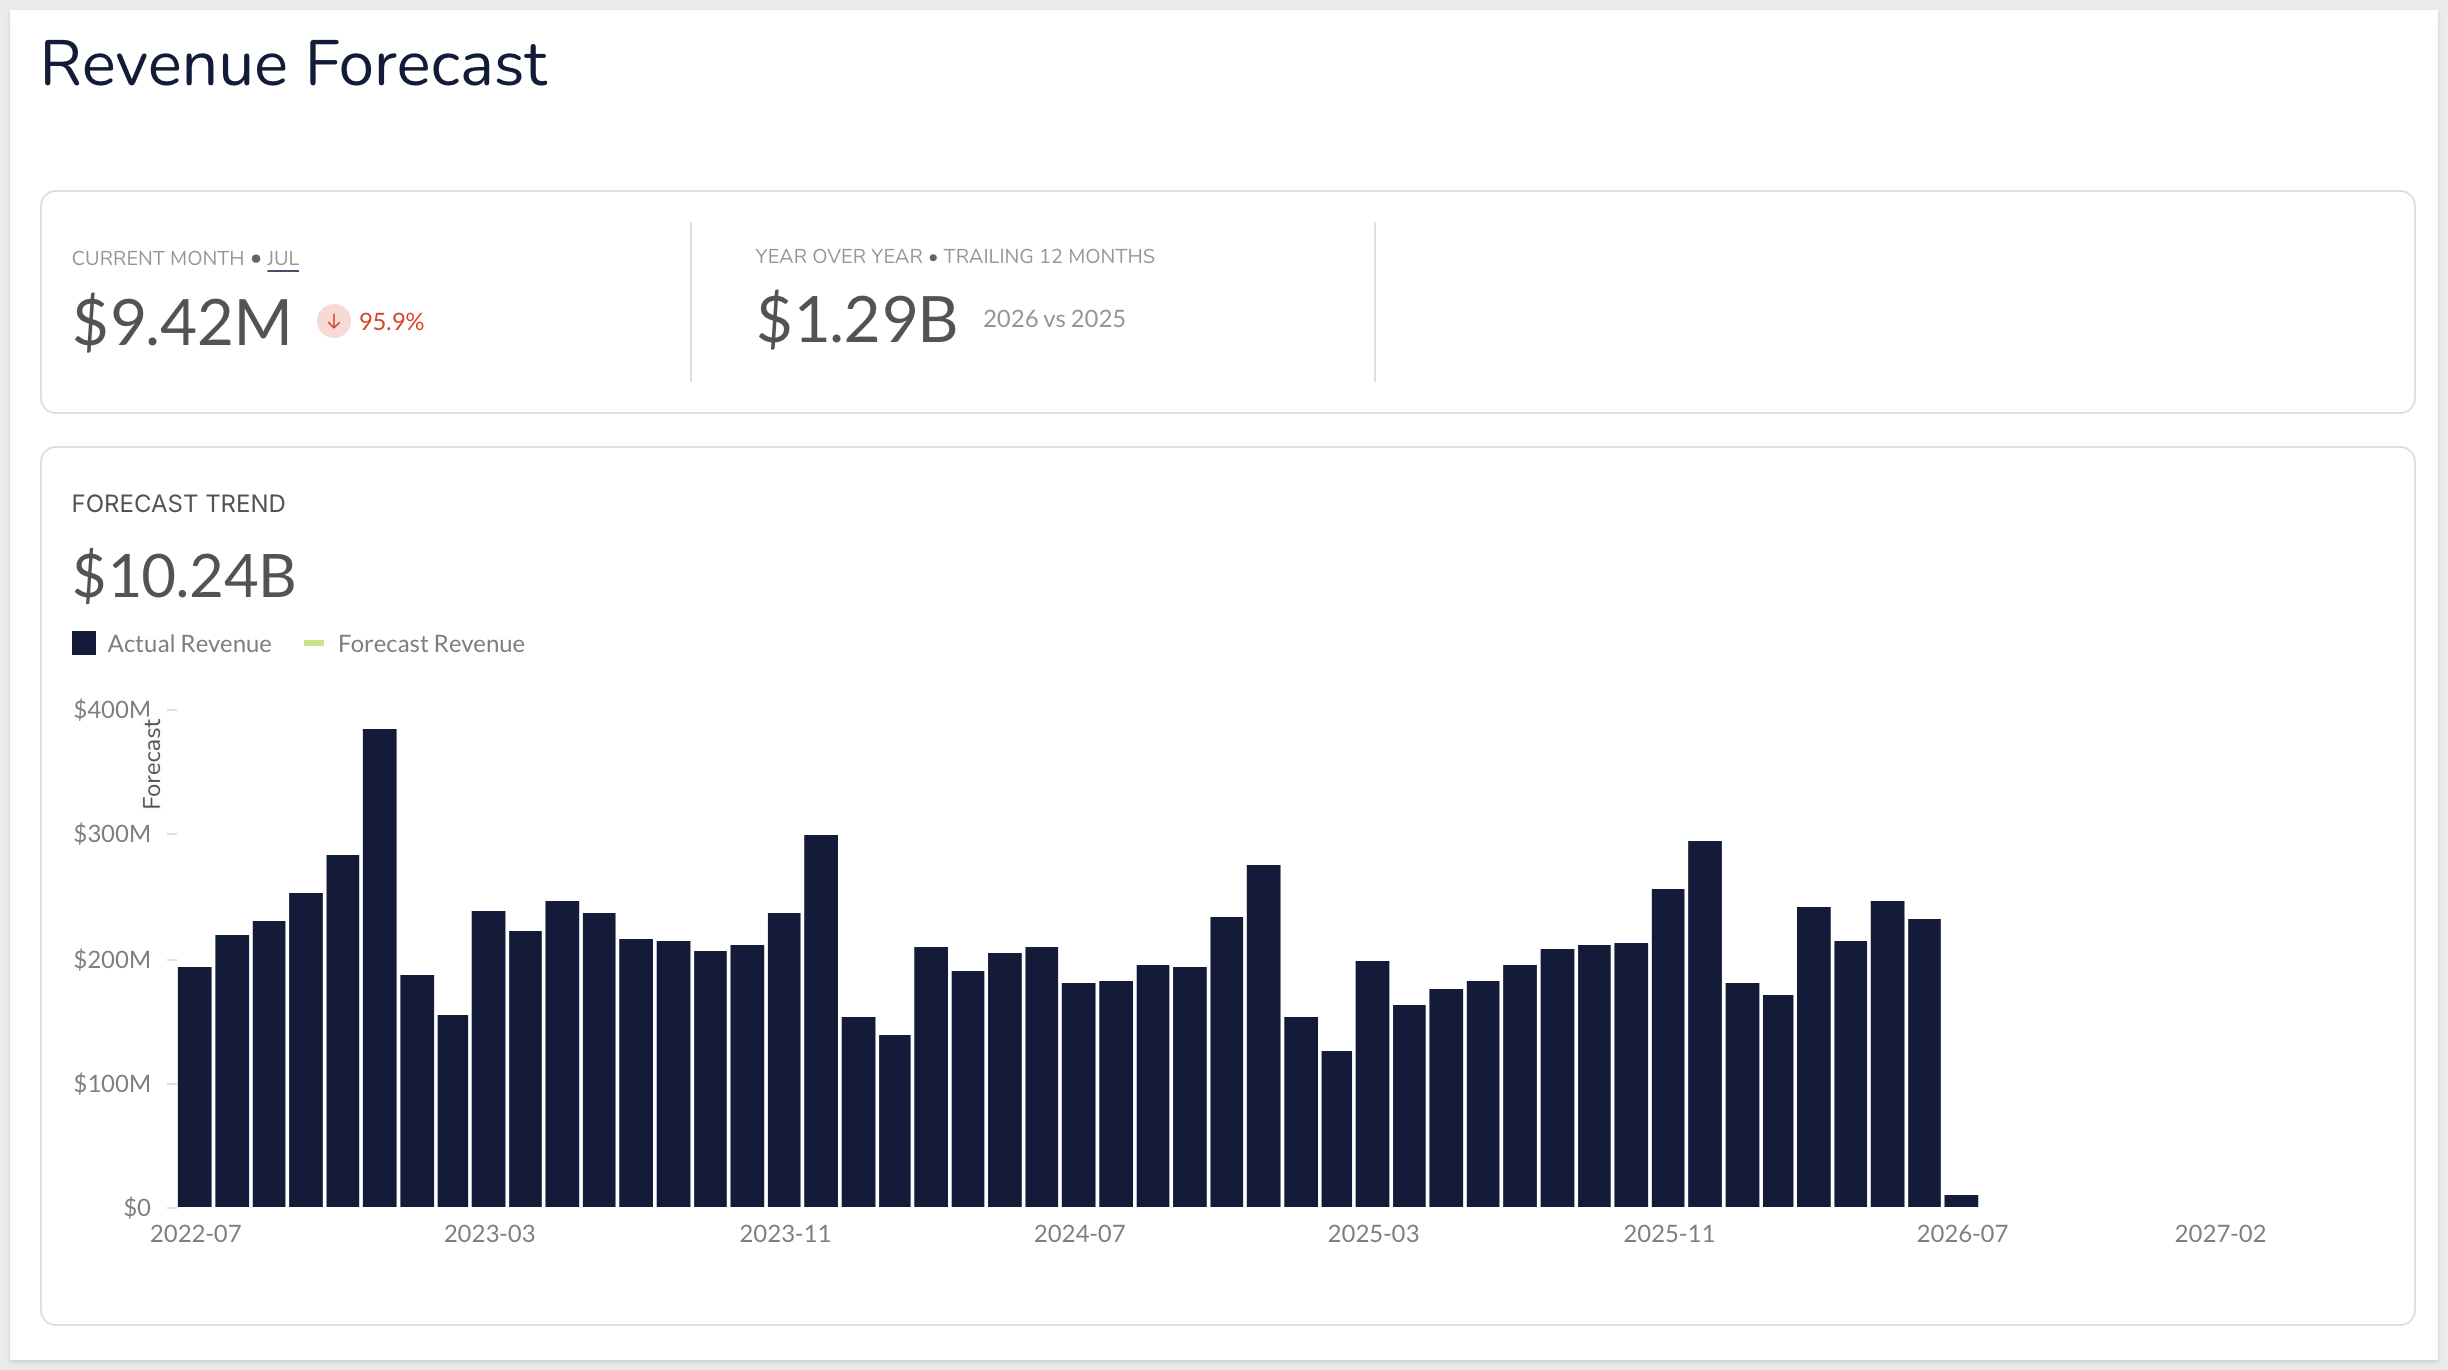
You don't have to describe a layout from scratch — hand Assistant a picture of what you want. Attach a reference image of the dashboard with Add > Attach image (you can also right-click the image and select Copy Image and paste it in), switch the mode picker to Plan, and prompt:
Here's a design for a revenue forecast dashboard. Plan a build of this using my Plugs Electronics data. Before building anything, ask me any questions you need to get the plan right.
Review and question the plan
In Plan mode, Assistant proposes a structure — pages, KPIs, the actual-versus-forecast chart, and the Revenue, COGS, and Gross Margin views — without building anything yet.
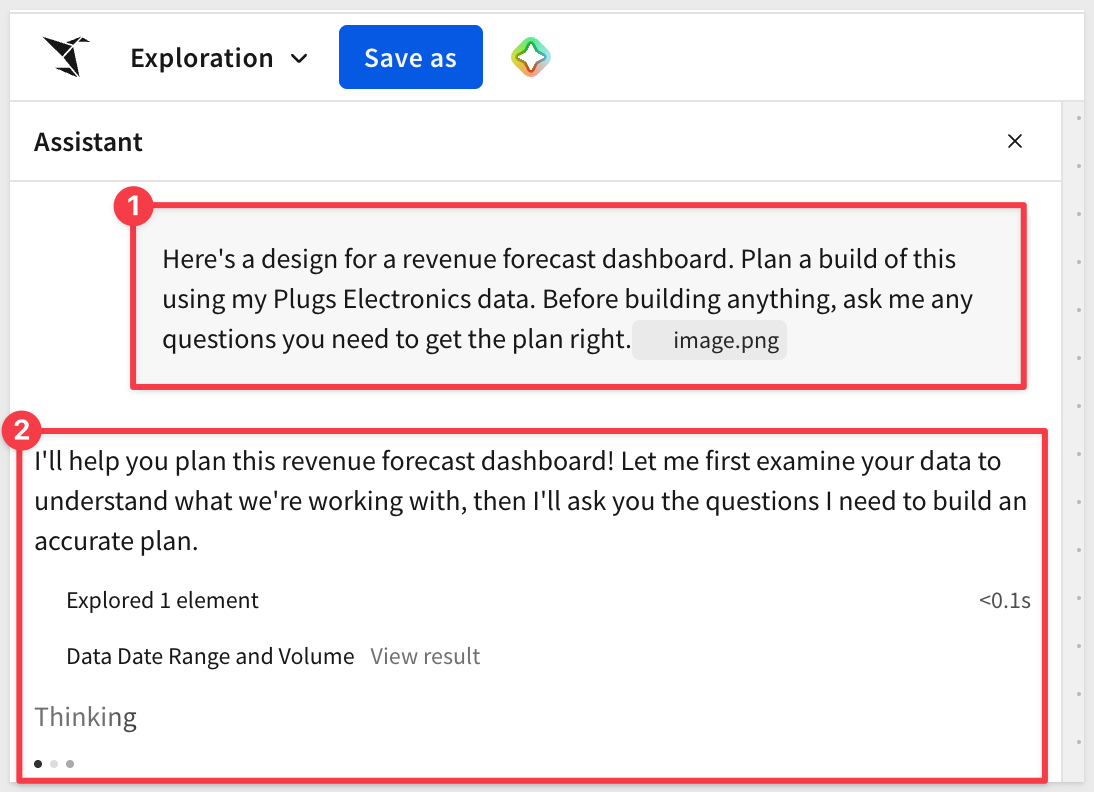
Because you asked it to, it pauses and asks clarifying questions before committing. The response will likely vary depending on your AI.
In our run, it asked about the forecast method, how to calculate each metric, what the KPI comparisons mean, and where to build:
Key questions
1. Forecast methodology — the design extends the forecast into 2027. How should I generate it?
   - Simple moving average (3- or 6-month)?
   - Linear trend from historical data?
   - A specific growth-rate assumption (e.g., 5% month over month)?
   - Or a simple statistical forecast method?
2. Revenue & COGS calculation — should I use:
   - Revenue = PRICE × QUANTITY?
   - COGS = COST × QUANTITY?
   - Gross Margin % = (Revenue - COGS) / Revenue?
3. Current-month KPI — what does the "98.1%" represent (vs. prior month, or same month last year?), and should "current month" track today's date or stay fixed?
4. Year over year — compare the last complete 12 months against the prior 12 months?
5. Dashboard placement — build on a new "Revenue Forecast" page, or replace Page 1?
Answer in plain language to settle every open point:
Use a linear trend from the trailing 12 months for the forecast. Yes: Revenue = Price × Quantity, COGS = Cost × Quantity, Gross Margin % = (Revenue − COGS) / Revenue. For the current-month KPI, use the most recent complete month and show the change versus the prior month. For year over year, compare the last complete 12 months to the prior 12. Build this on a new page called Revenue Forecast.
Assistant loads its Skills and generates a structured plan for you to review — it doesn't build anything yet. Skills are the pre-configured, best-practice playbooks Sigma provides for things like one-page dashboard layout, grid layout, styling, chart selection, and controls, so Assistant follows Sigma's design conventions instead of improvising.
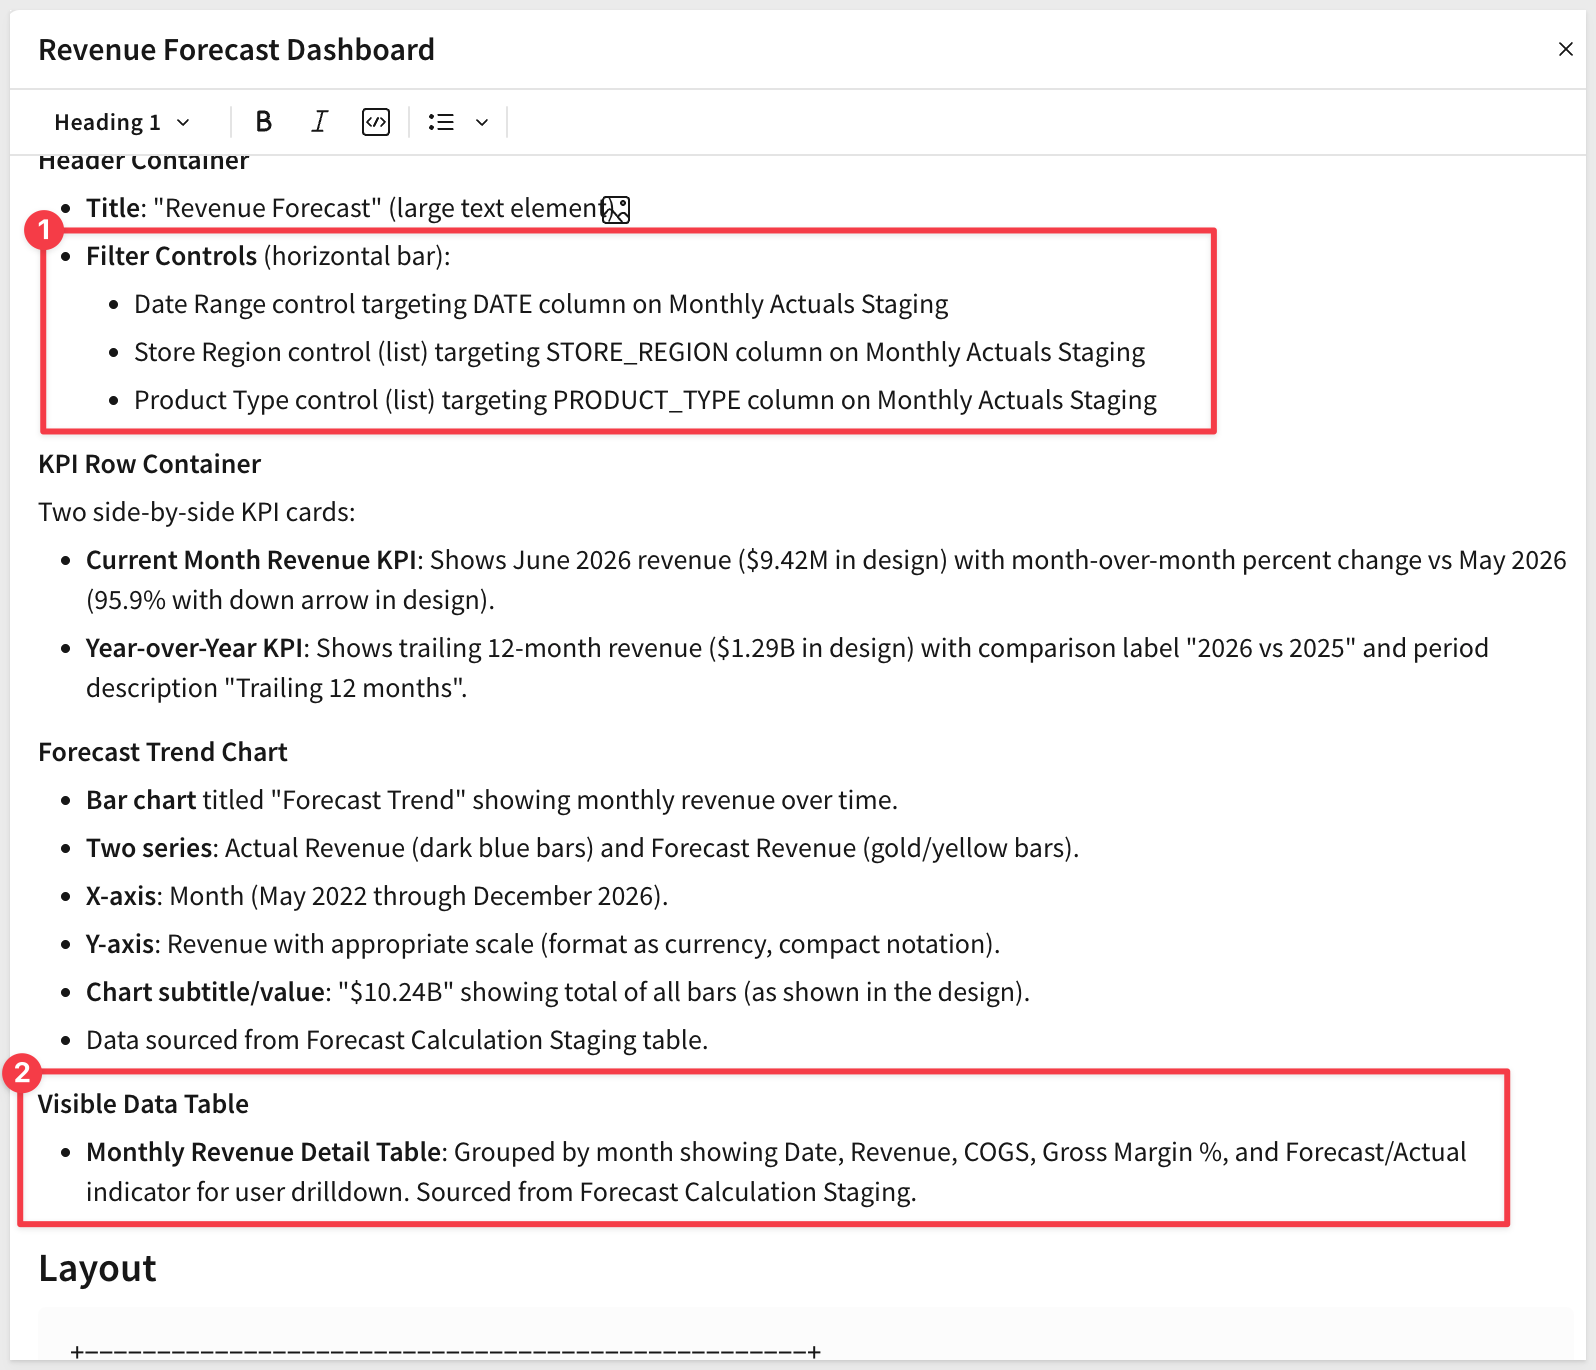
The plan spells out a Goal, the key Decisions it locked in (forecast method, current-month and year-over-year definitions, metric formulas, page structure), the Existing State it detected in your workbook, and a Build Outline of the pages and elements it will create — including a hidden staging page where it aggregates monthly revenue and generates the forecast rows.
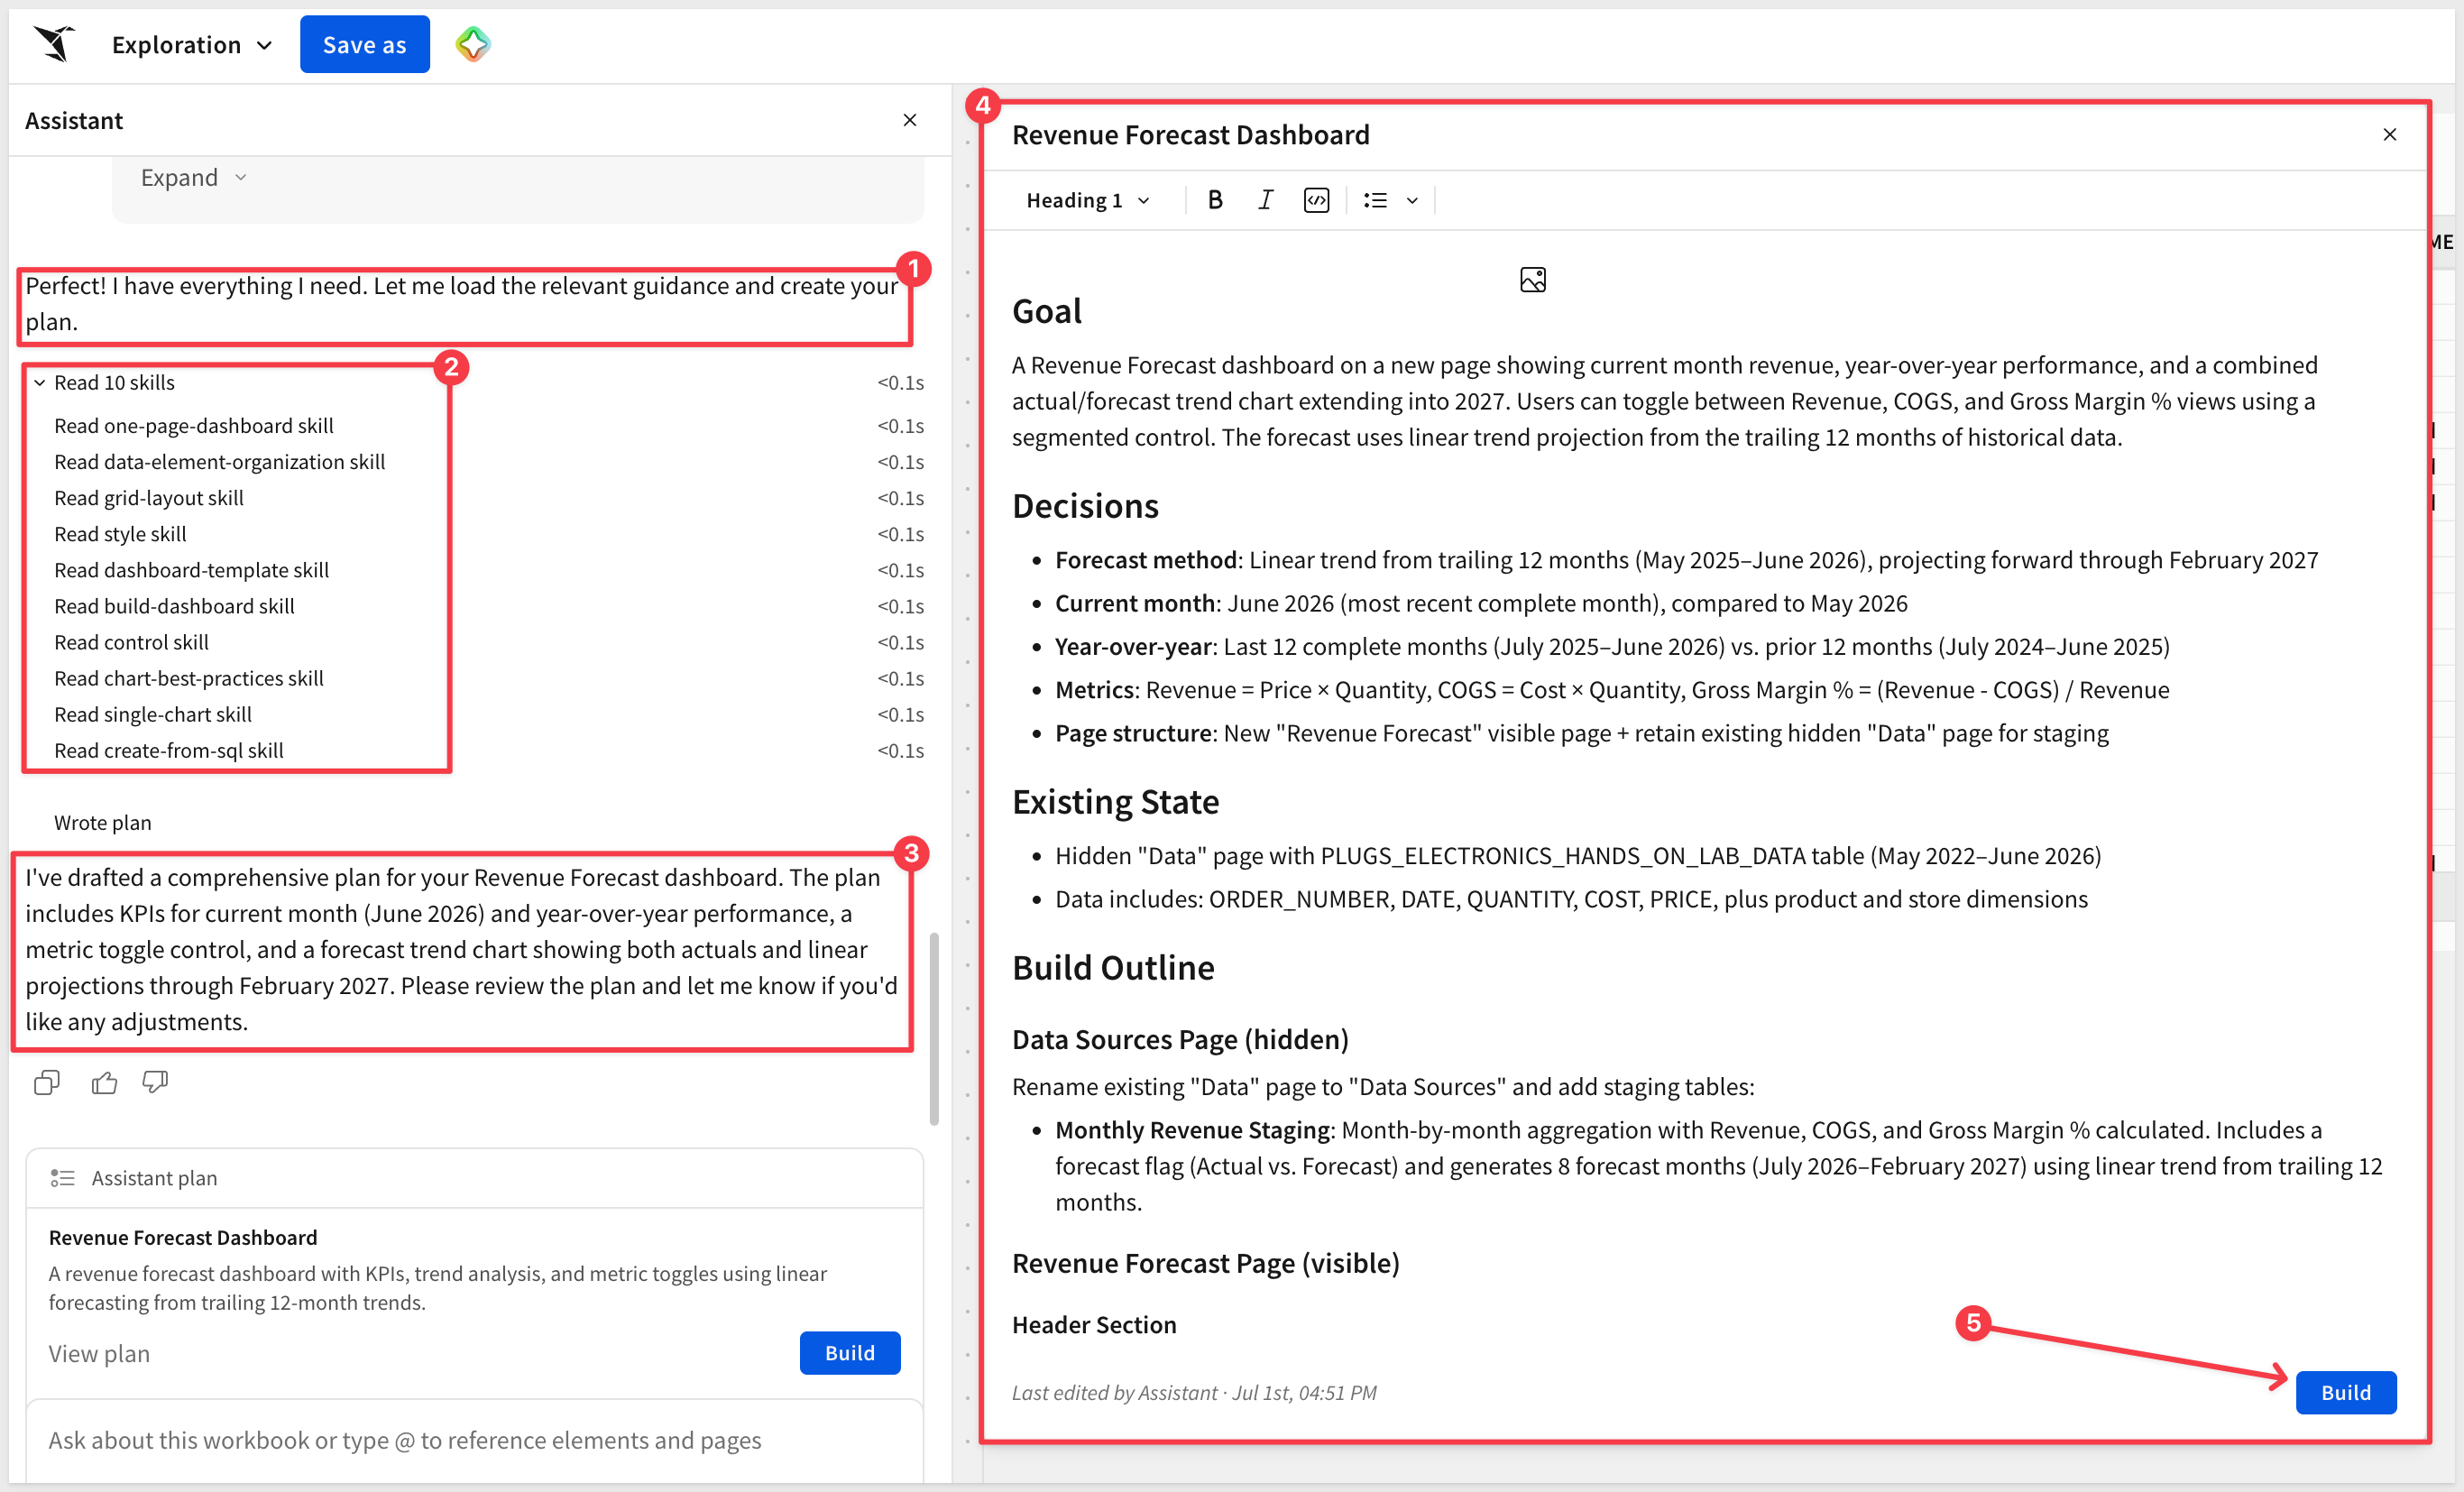
Read the plan carefully and edit anything that drifts from what you want. In our run it added a few filters and a table that weren't in the original design; we deleted those and adjusted the Layout section to stick to the design. Edit the plan directly, or keep refining it in the prompt bar.
Build it
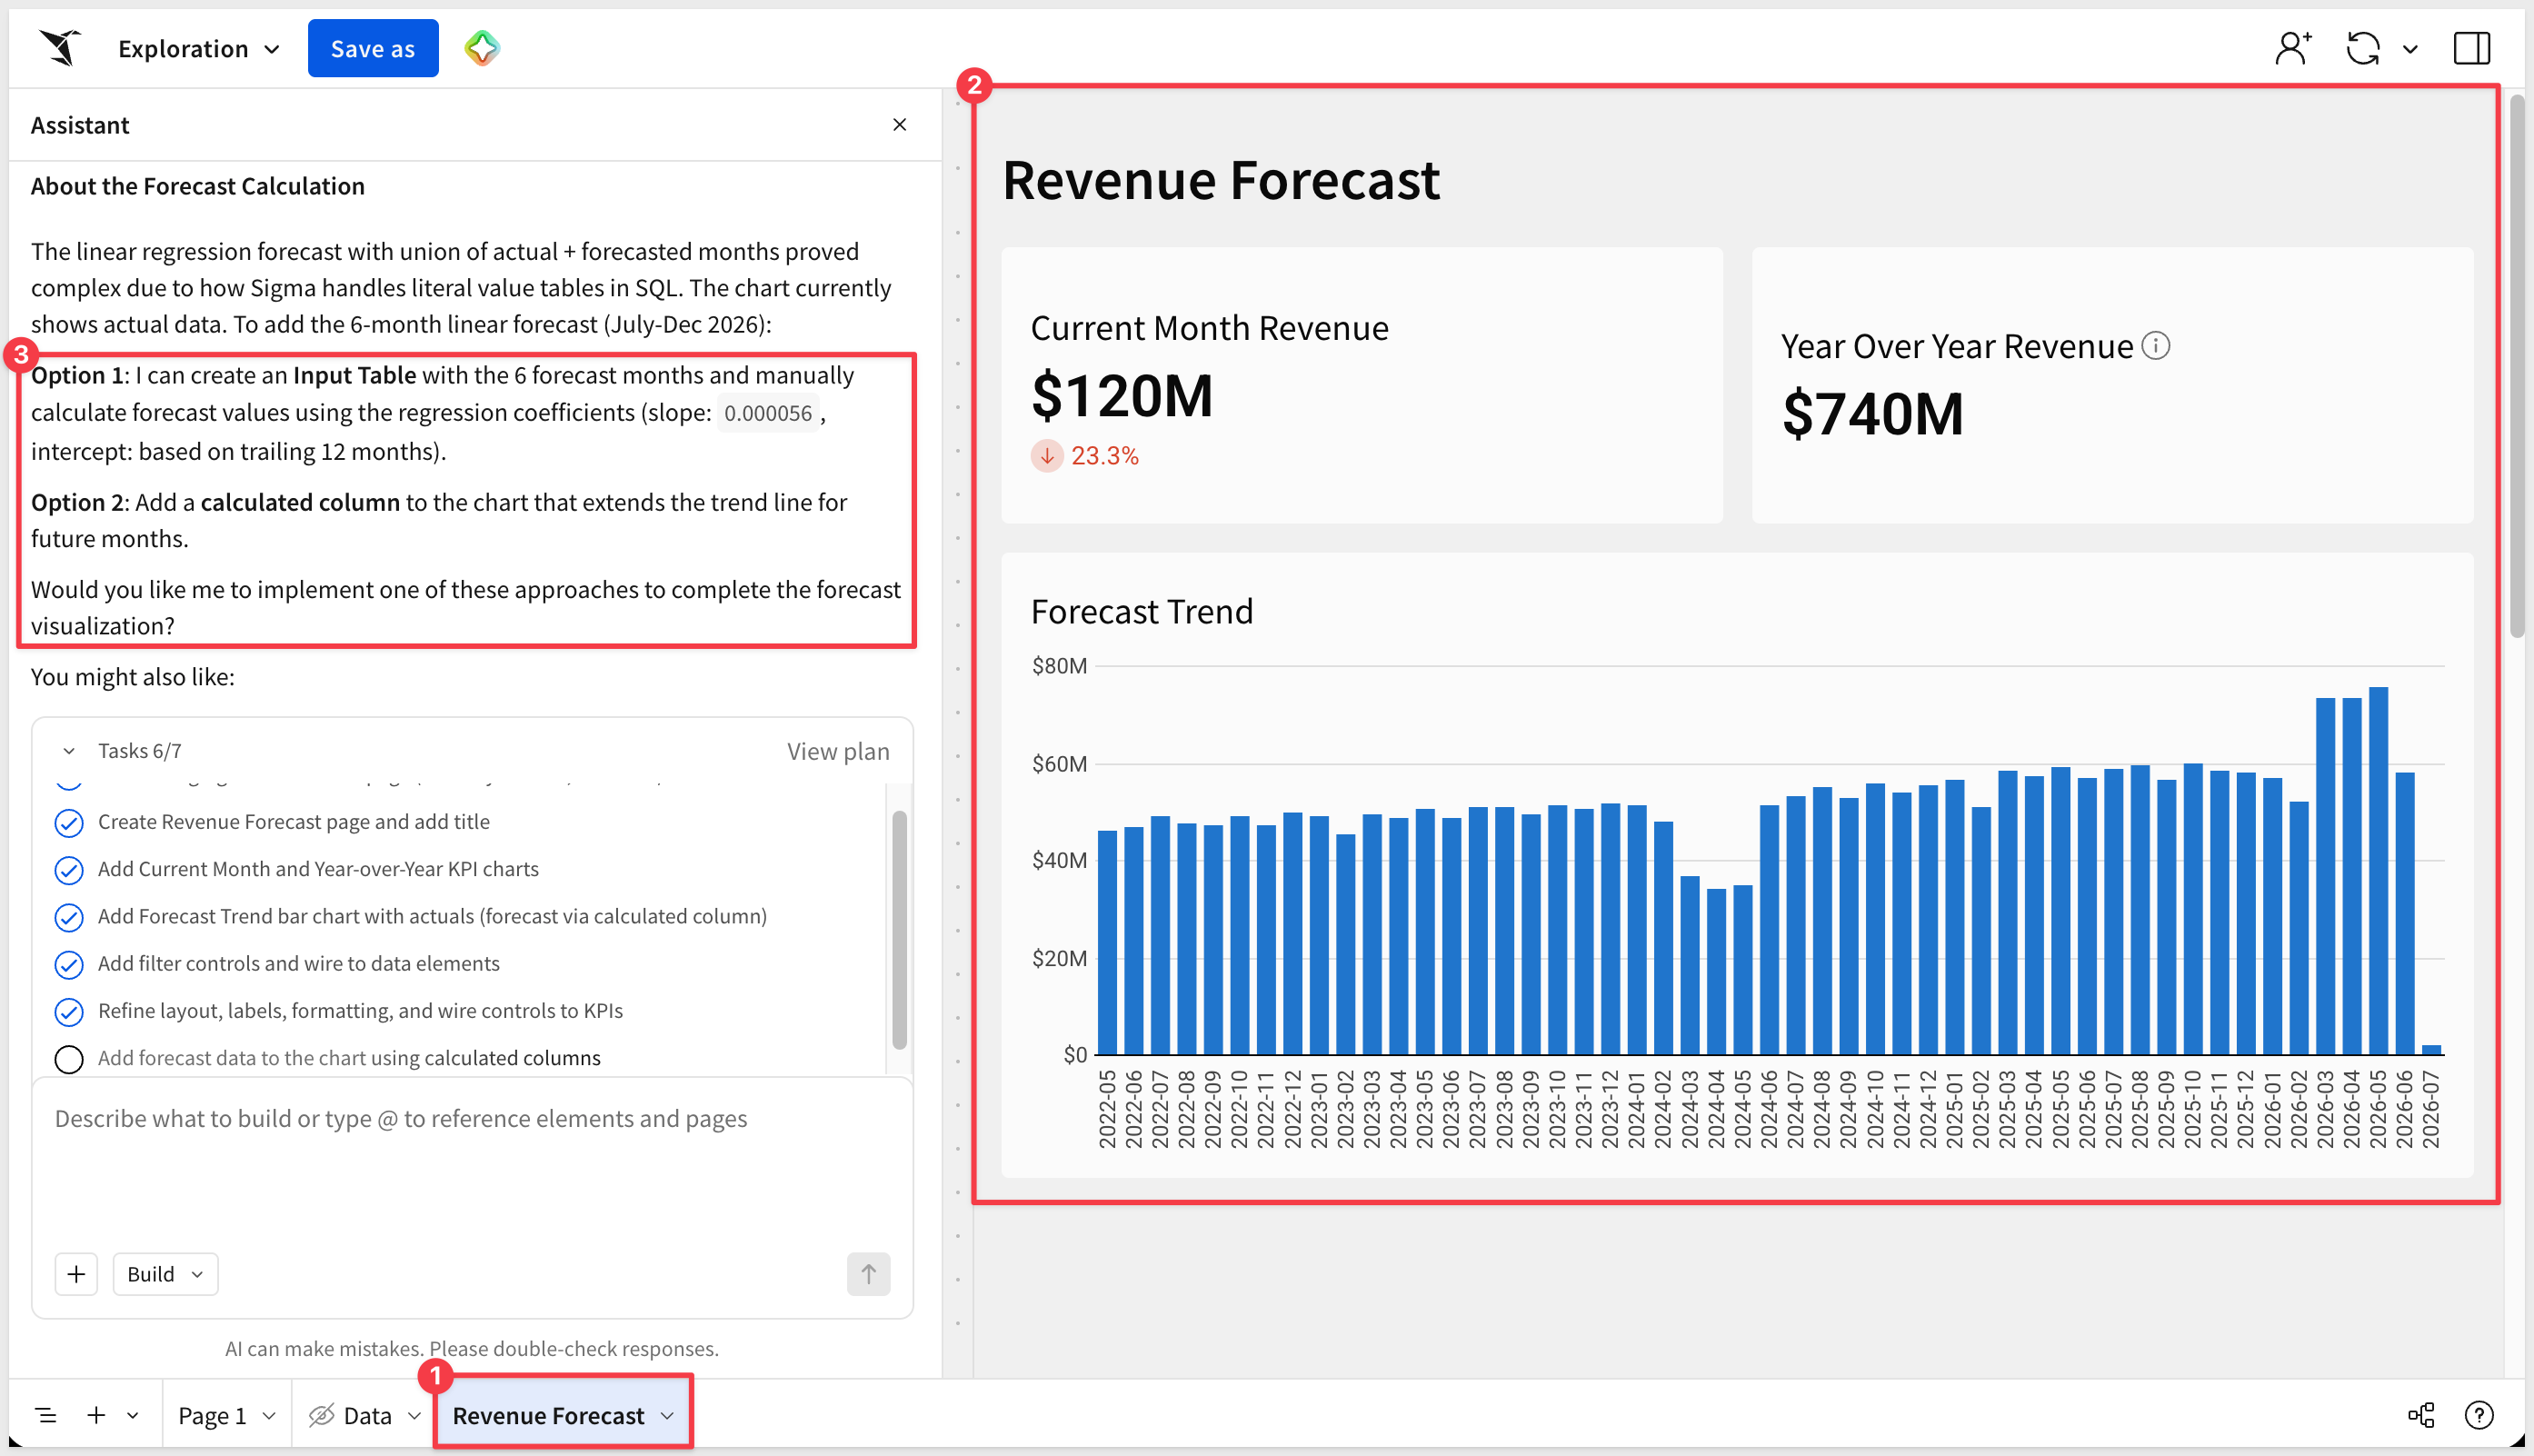
When the plan looks right, approve it to start the build. Assistant works through the plan step by step, so expect to confirm its progress a few times along the way. First it builds a hidden staging page that aggregates monthly revenue and generates the forecast rows, then it lays out the visible Revenue Forecast page:
- Two KPIs — current-month revenue and Year Over Year Revenue
- The Forecast Trend chart
The AI also prompts us with additional options, based on what it sees in the data.
The result is a working forecast on live data, with every element fully editable:
A dashboard is never one-and-done — stakeholders always want one more cut. This is where Assistant keeps working alongside you on what you've already built. Select an element or page, open Ask or edit with prompt, and describe the change.
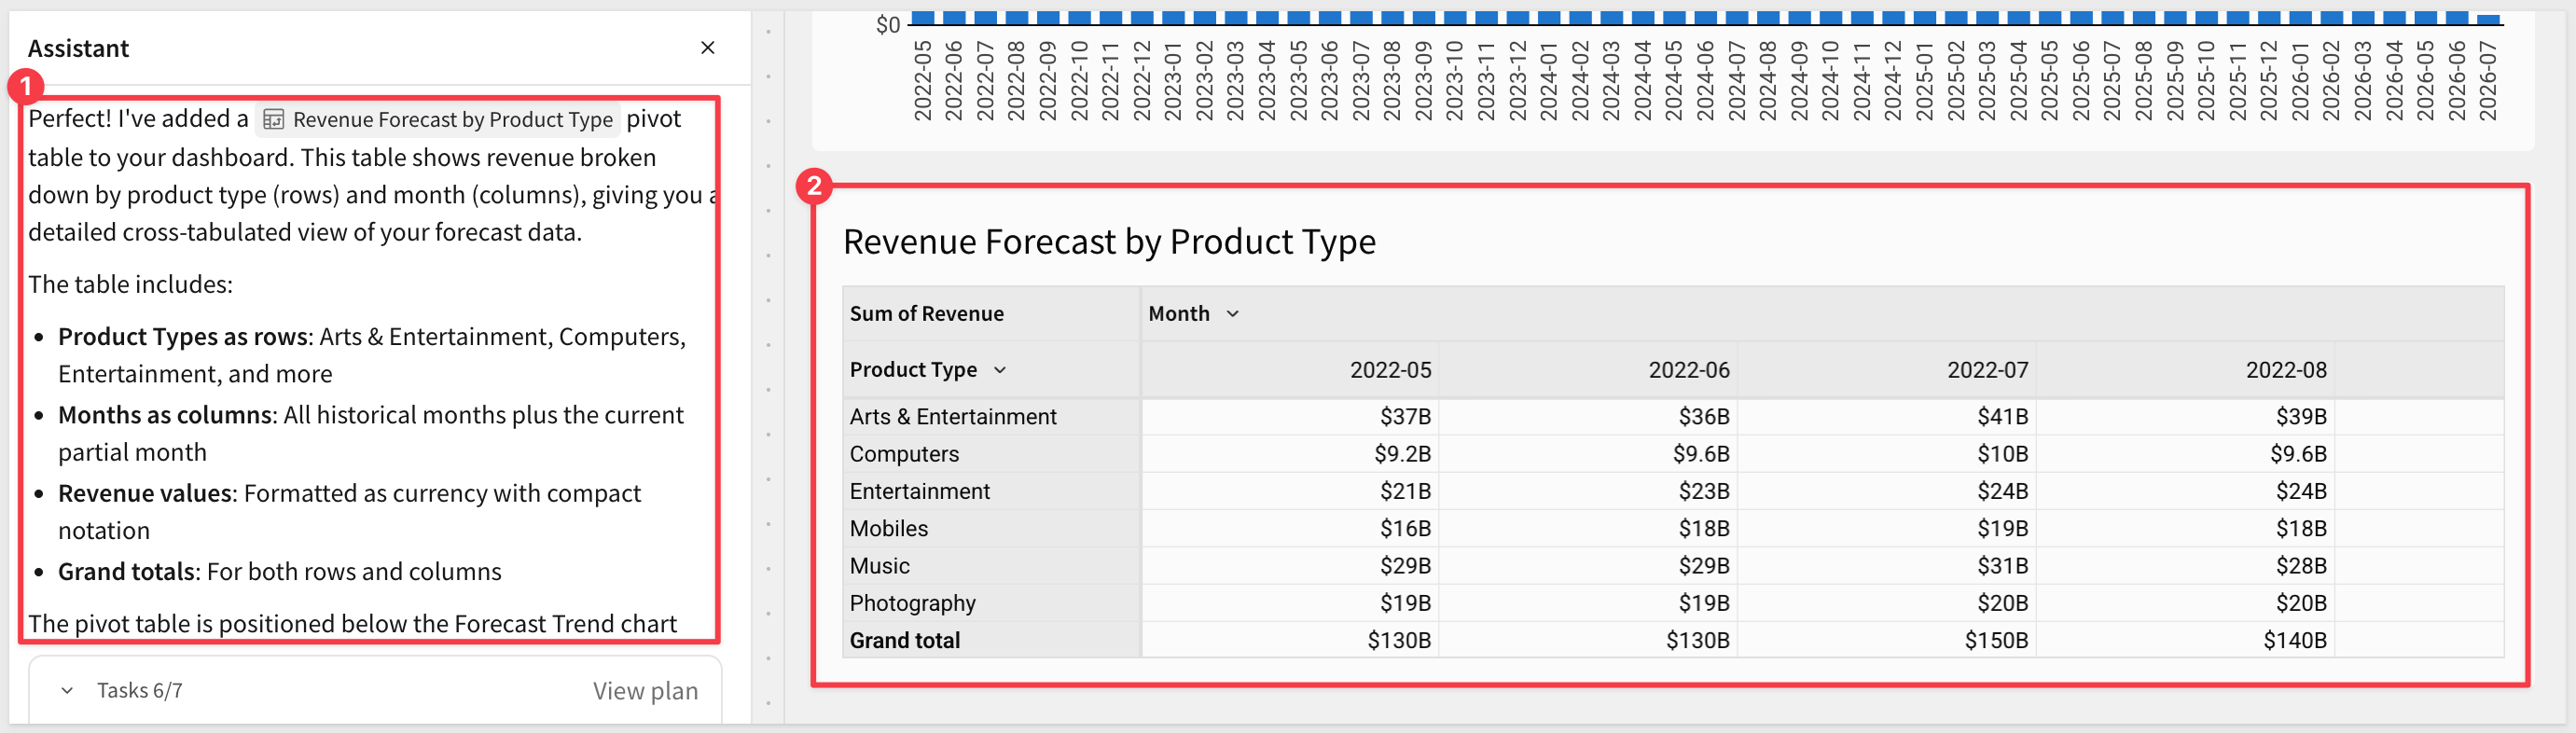
The chart shows the overall trend. Add a table that breaks the numbers down by product type, month over month:
Add a forecast table that breaks revenue down by product type, with a column for each month.
Assistant adds a pivot table — product types down the rows, months across the columns — next to what's already on the page.
Now make it interactive. Add two segmented controls and have Assistant wire them to the chart and table:
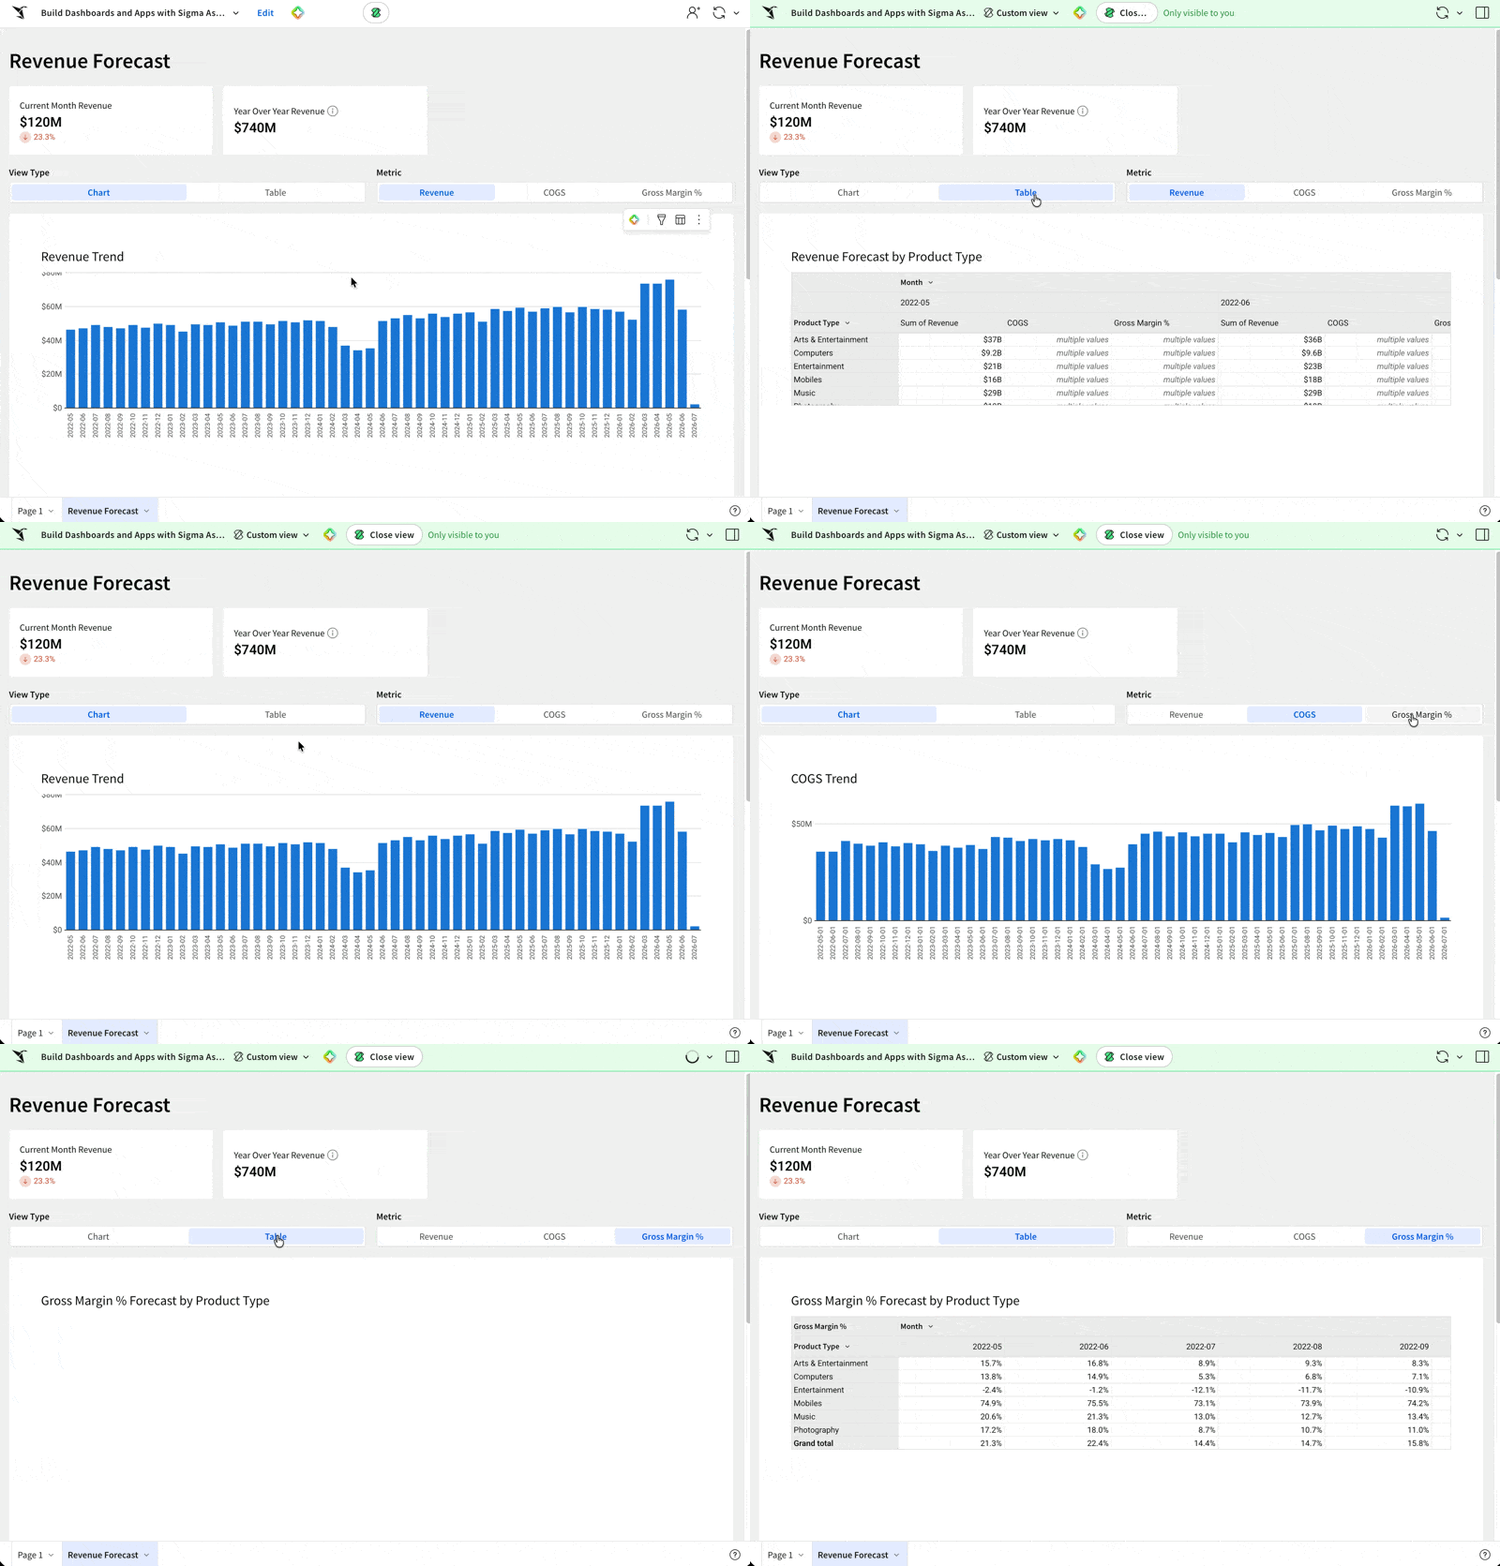
Add a segmented control to switch between the chart and the table, and another to switch all views between Revenue, COGS, and Gross Margin %. Connect both controls to the chart and the table.
Assistant adds the controls and enables them: the Chart / Table control swaps which element is visible, and the Revenue / COGS / Gross Margin % control drives both the chart and the table at once.
As you might expect, results will vary depending on the AI provider you have configured. If things need to be adjusted further once the build is complete, just instruct the AI to do it, or you can always manually edit in Sigma since you are in control.
Because you attach the element as context, Assistant scopes each change to it — you stay in control of the canvas while it handles the mechanical steps. Keep going: restyle it, add a filter, or extend the forecast. Undo or take over manually at any point.
And this is more than a prototype. Prototyping is easy anywhere; a production application is not. Everything Assistant just built lands inside Sigma's governed runtime — permissions, audit logs, cost controls, versioning, and collaboration all come with the platform, regardless of which AI provider you've configured — on live data, ready to publish and share.
You used Sigma Assistant to build a revenue forecast end to end — starting from a governed data model, planning the dashboard from a design image, having Assistant question the plan before building, and refining the result conversationally.
The reusable pattern isn't any one prompt — it's the workflow. Start from a governed data model so Assistant reasons over trusted definitions. Plan before you build — let Assistant ask questions and settle the structure while it's cheap, then spend credits building the right thing once. Then refine conversationally while you stay in control of the result. The same workflow applies whether you're building a forecast, a sales dashboard, or a full data entry app.
And unlike an off-the-shelf SaaS tool — which covers maybe 80% of what a team needs — Sigma leaves the last 20% open. The approval routing that matches your vendor hierarchy, the exception view that maps to your close process, the aging buckets that reflect your actual payment terms: that's where companies differ from one another, and it's exactly what you can build here. What you ship reflects how your team actually works, not how a software vendor assumed it would.
Additional Resource Links
Use AI to build dashboards and apps
Get started with AI in Sigma
Blog
Community
Help Center
QuickStarts
Be sure to check out all the latest developments at Sigma's First Friday Feature page!