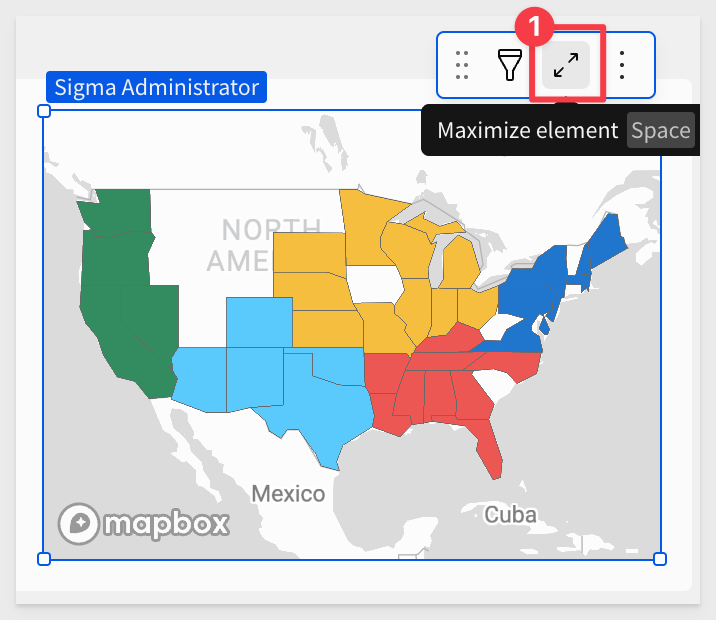
Cross Chart Actions allow you to click or select data in one visualization and instantly filter other elements on the page.
This makes dashboards more interactive, supports intuitive drill-downs, and enables business users to explore relationships in the data—without needing to build separate filters.
While this QuickStart focuses on charts, the same techniques can also be applied to other elements.
For more information on Sigma's product release strategy, see Sigma product releases
If something doesn't work as expected, here's how to contact Sigma support
Target Audience
The typical audience for this QuickStart includes users of Excel, common Business Intelligence or Reporting tools, and semi-technical users who want to try out or learn Sigma.
Prerequisites
- Any modern browser is acceptable.
- Access to your Sigma environment.
- Some familiarity with Sigma is assumed. Not all steps will be shown, as the basics are assumed to be understood.

Log in to Sigma and create a new Workbook.
Rename the workbook Cross_Chart_Actions_QuickStart.
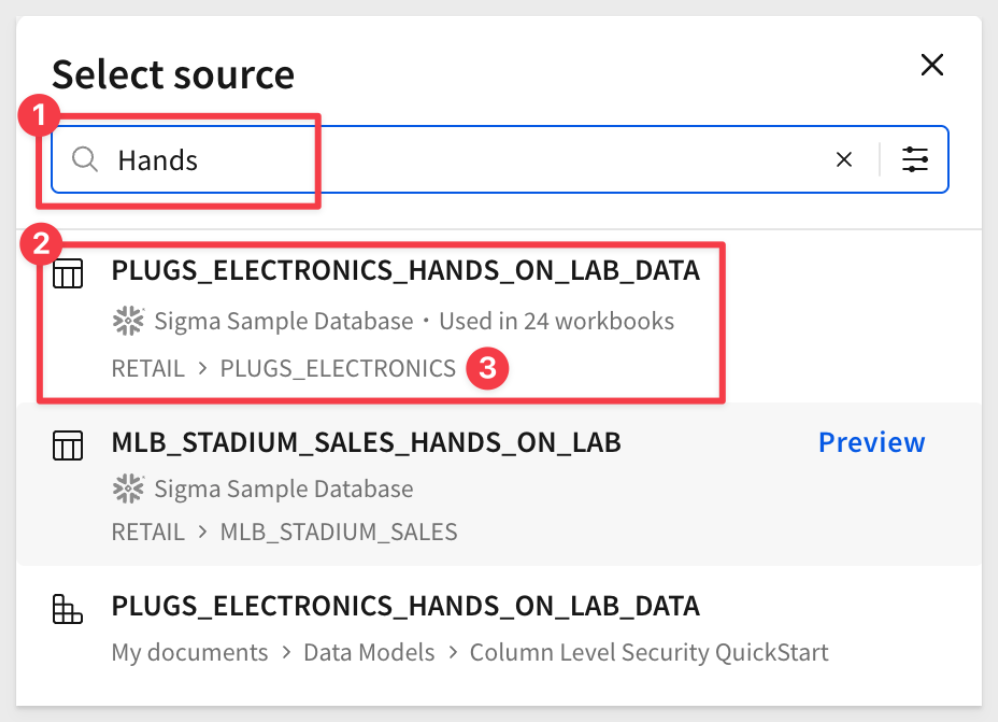
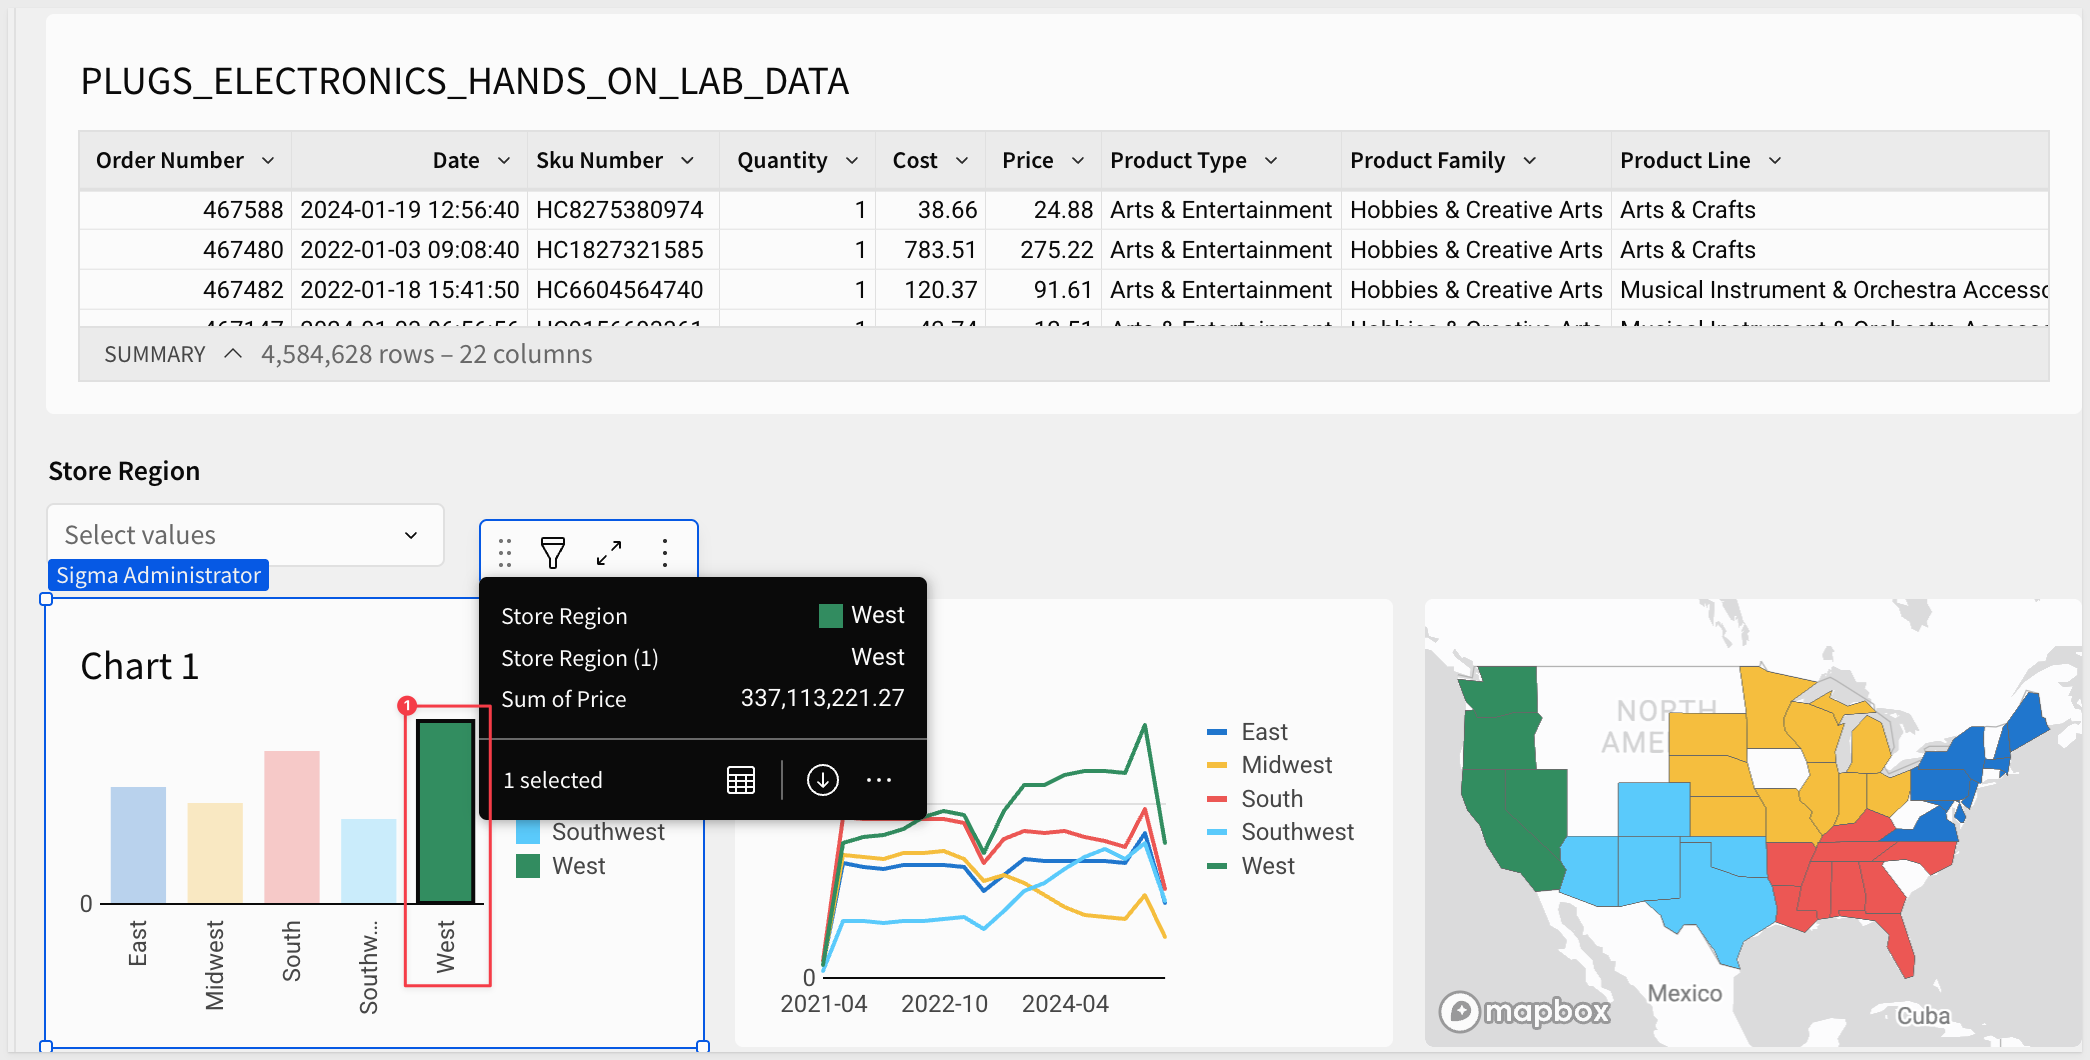
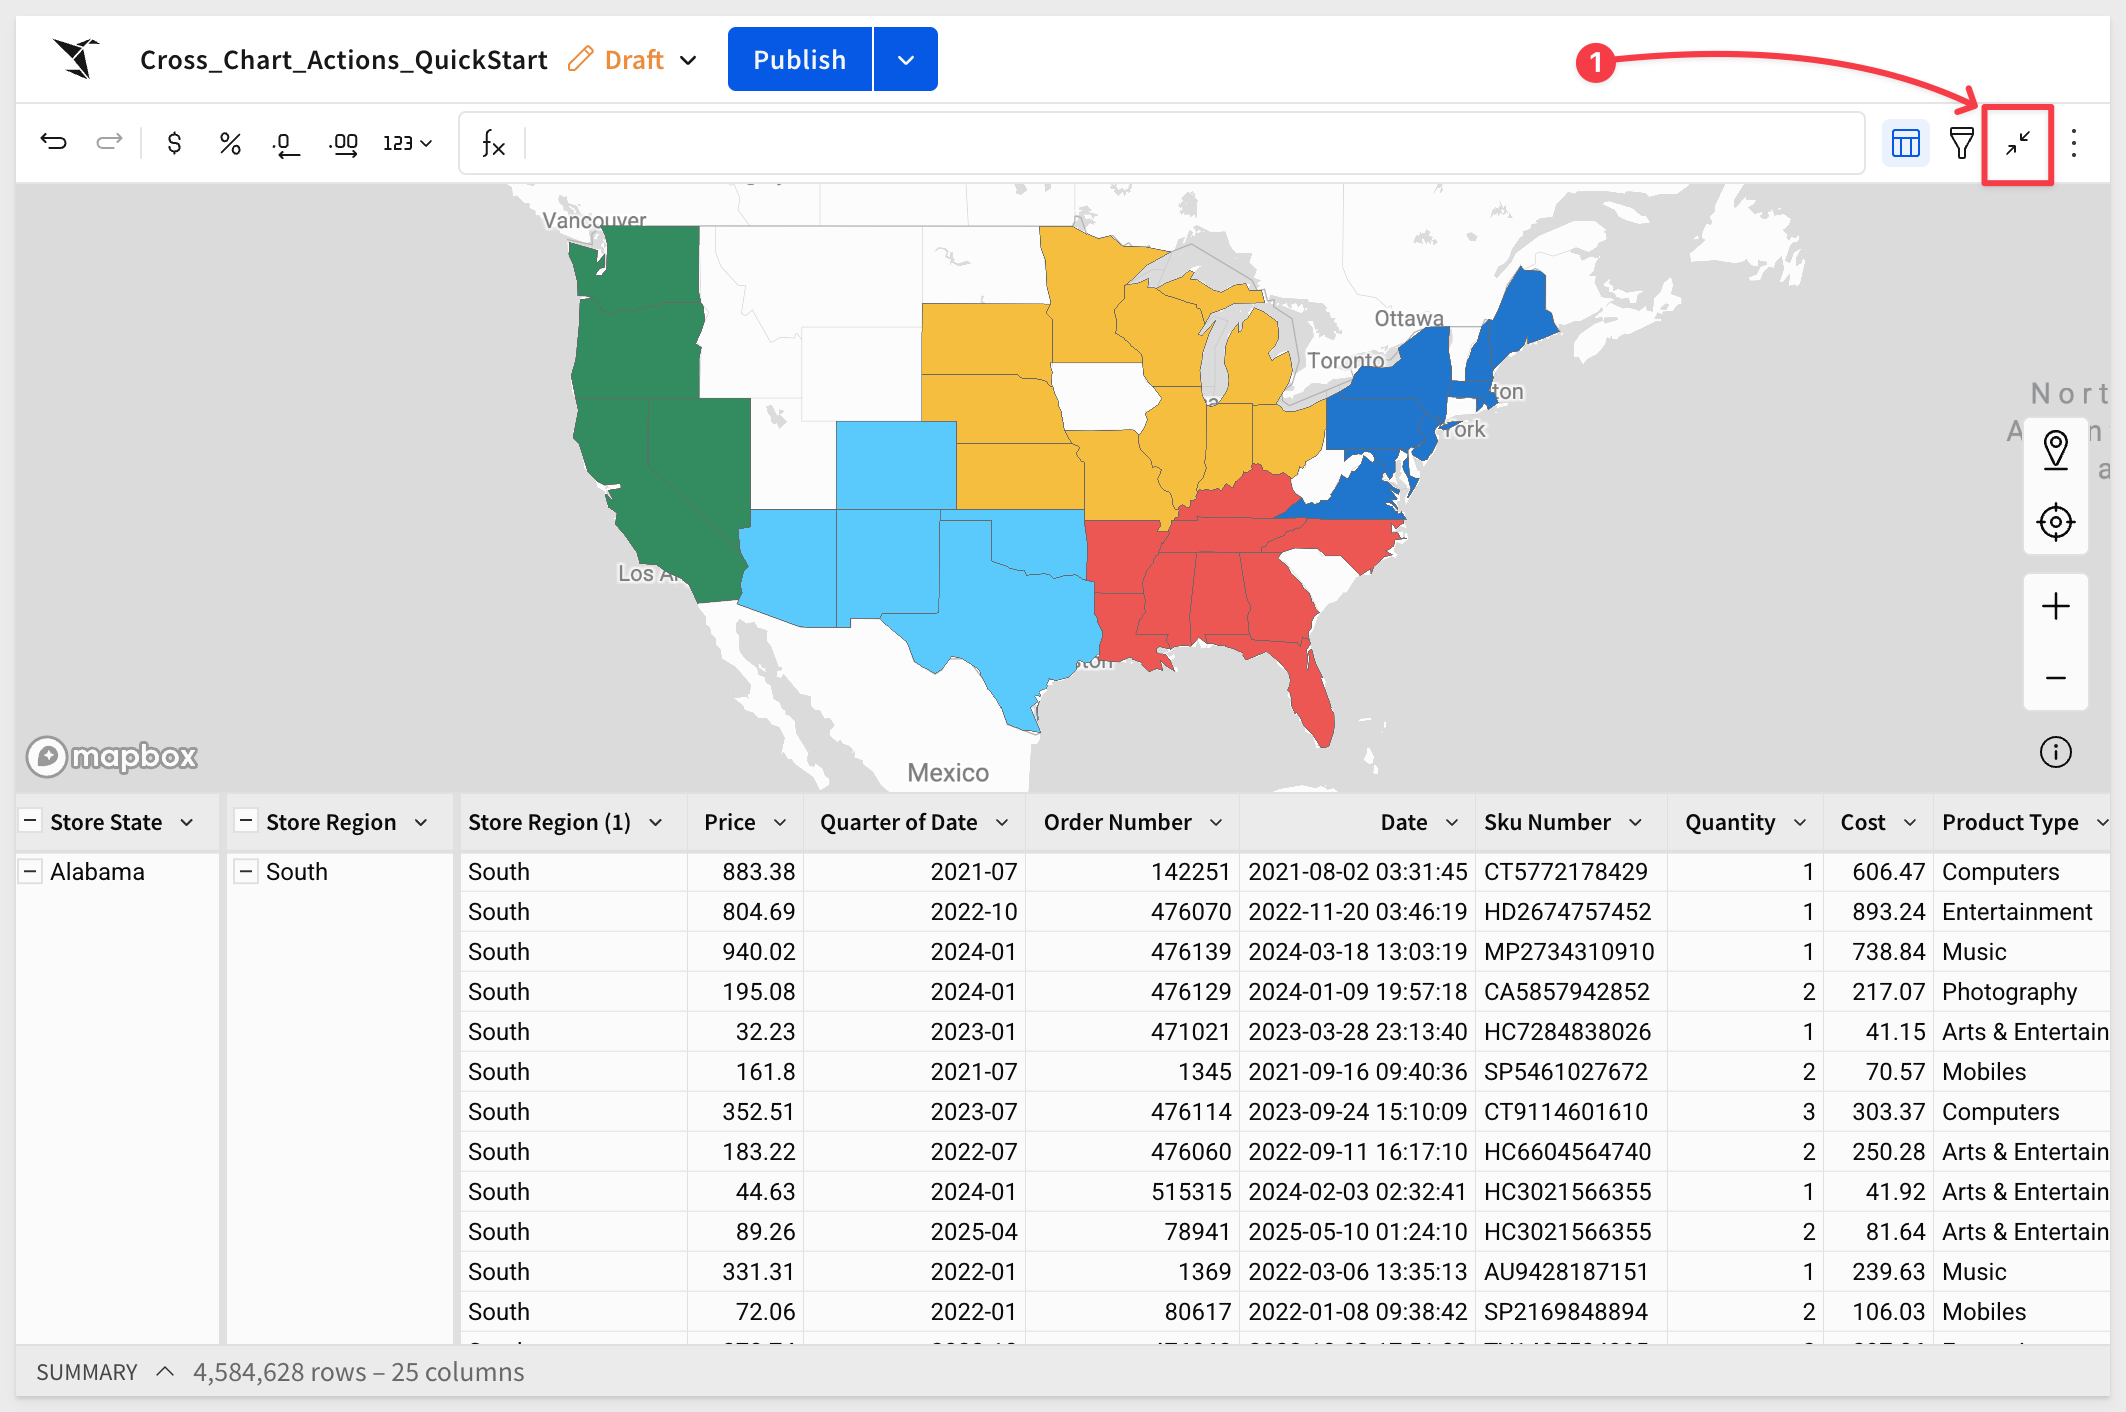
Add a new Table using the Sigma Sample Database and choose RETAIL > PLUGS ELECTRONICS > PLUGS_ELECTRONICS_HANDS_ON_LAB_DATA:
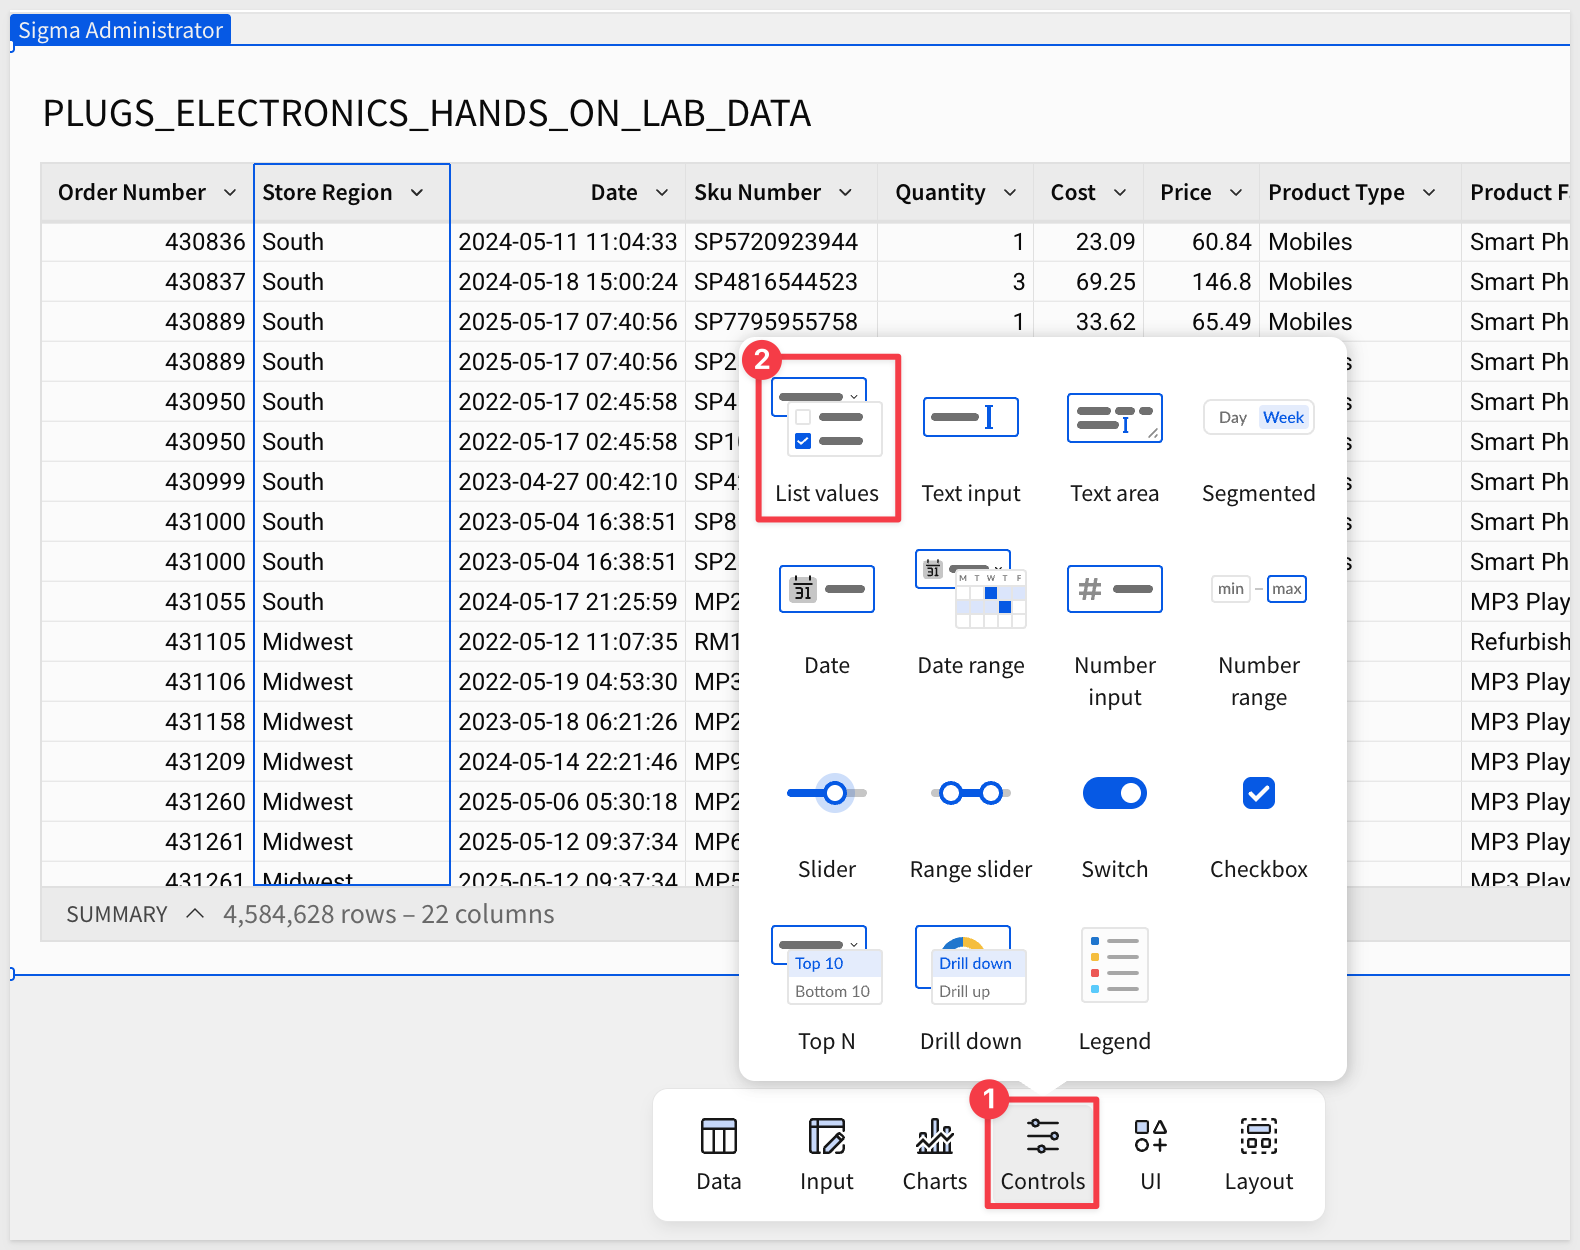
Add a new list control from Element bar > Controls :
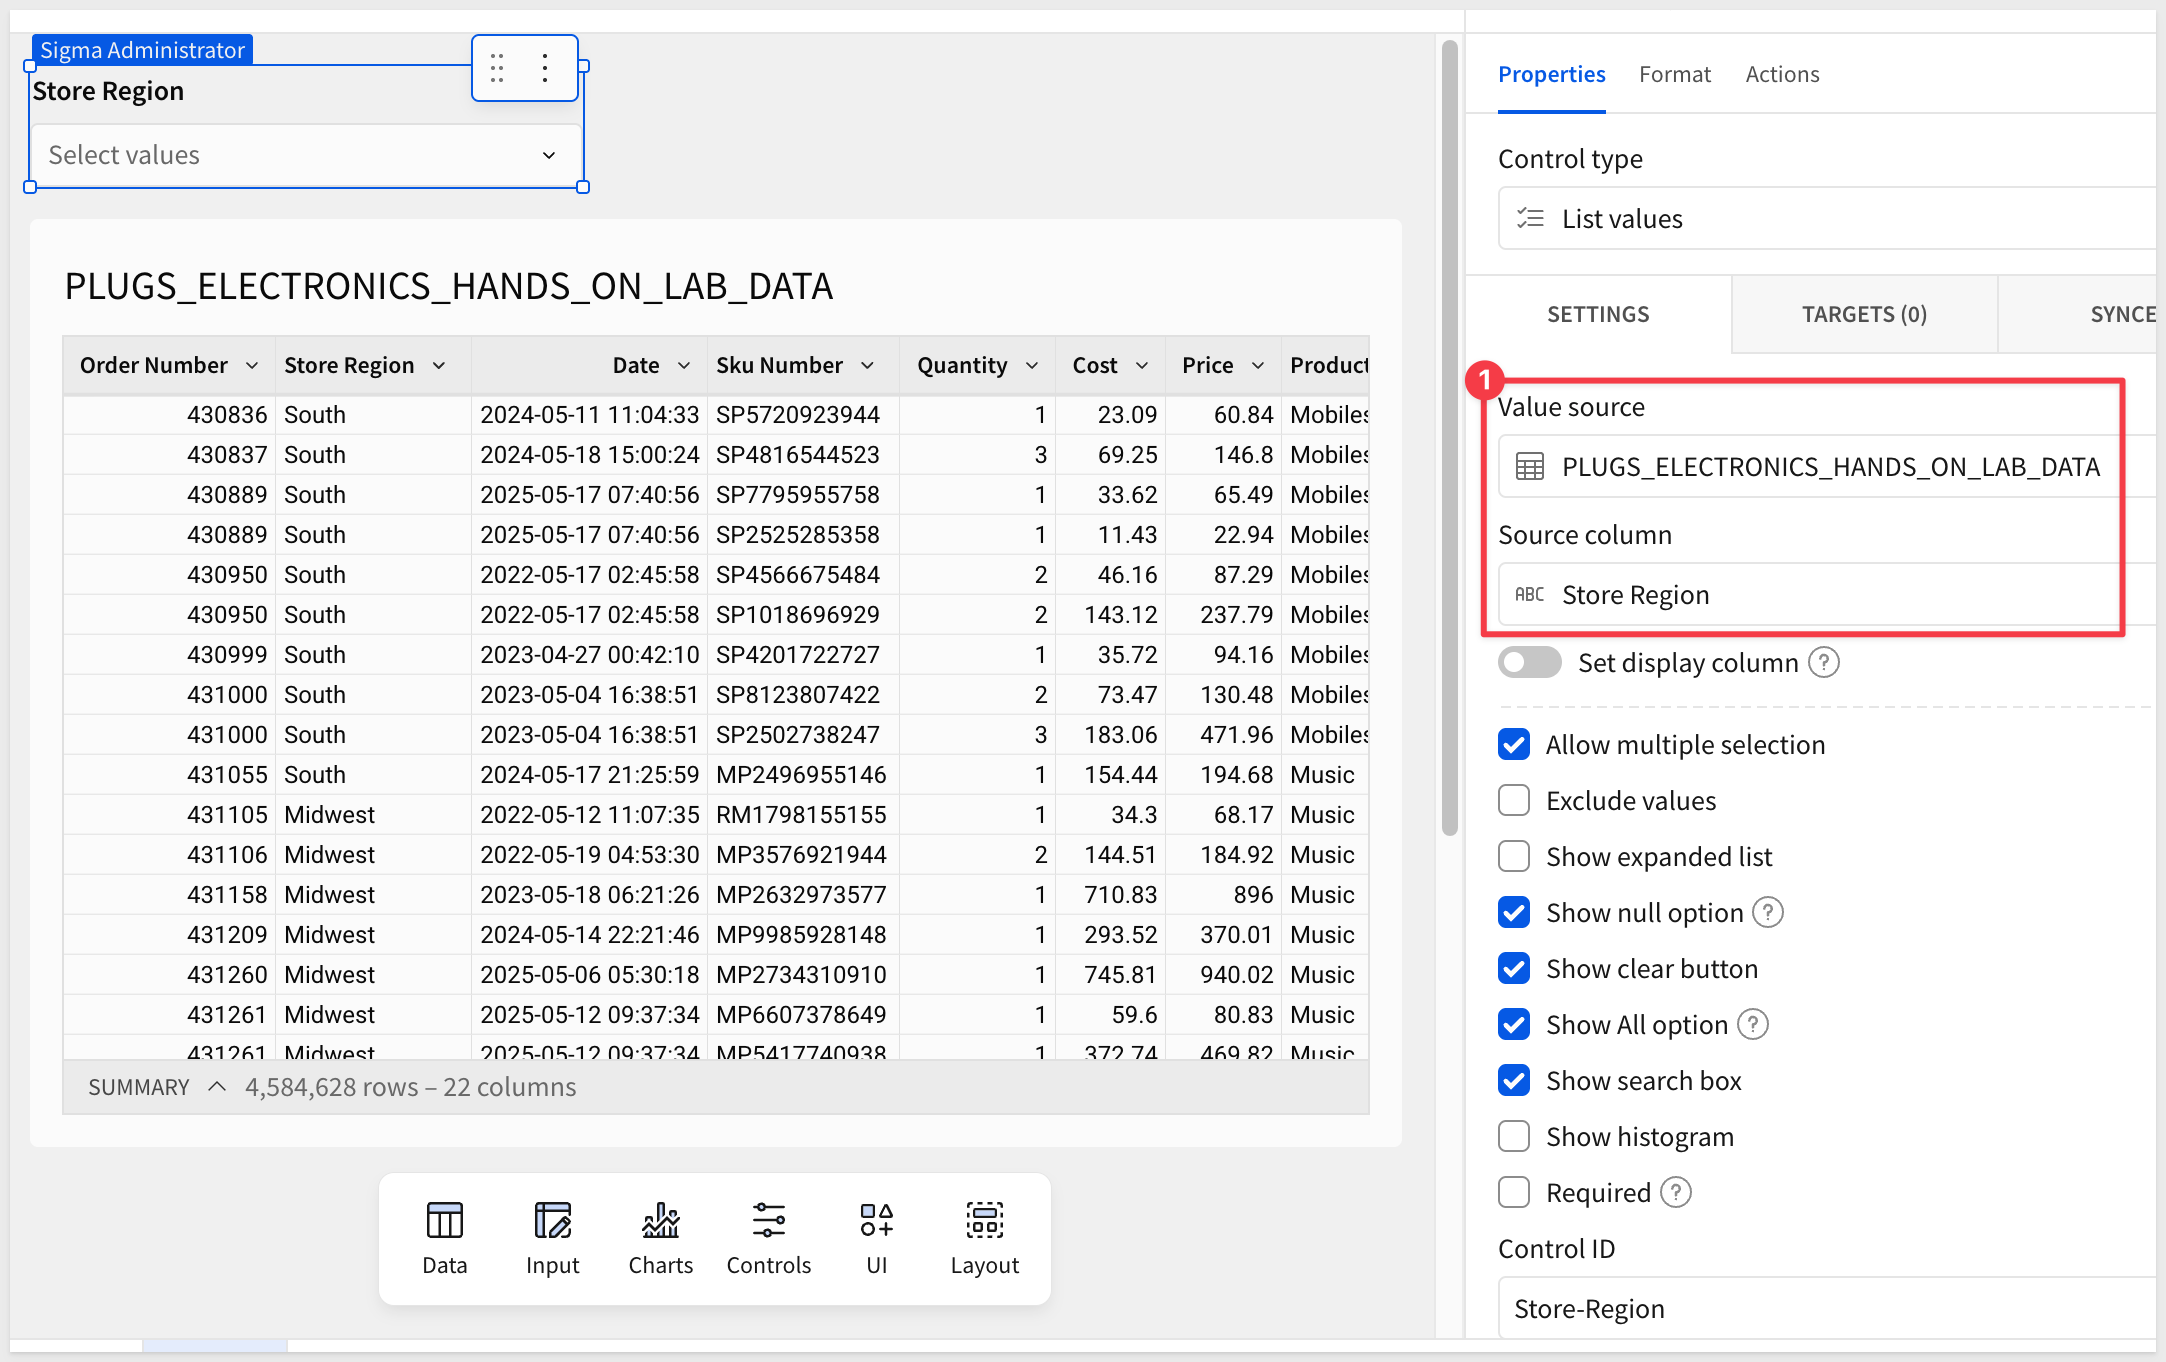
Configure the Value source to the table and the Source column to Store Region:
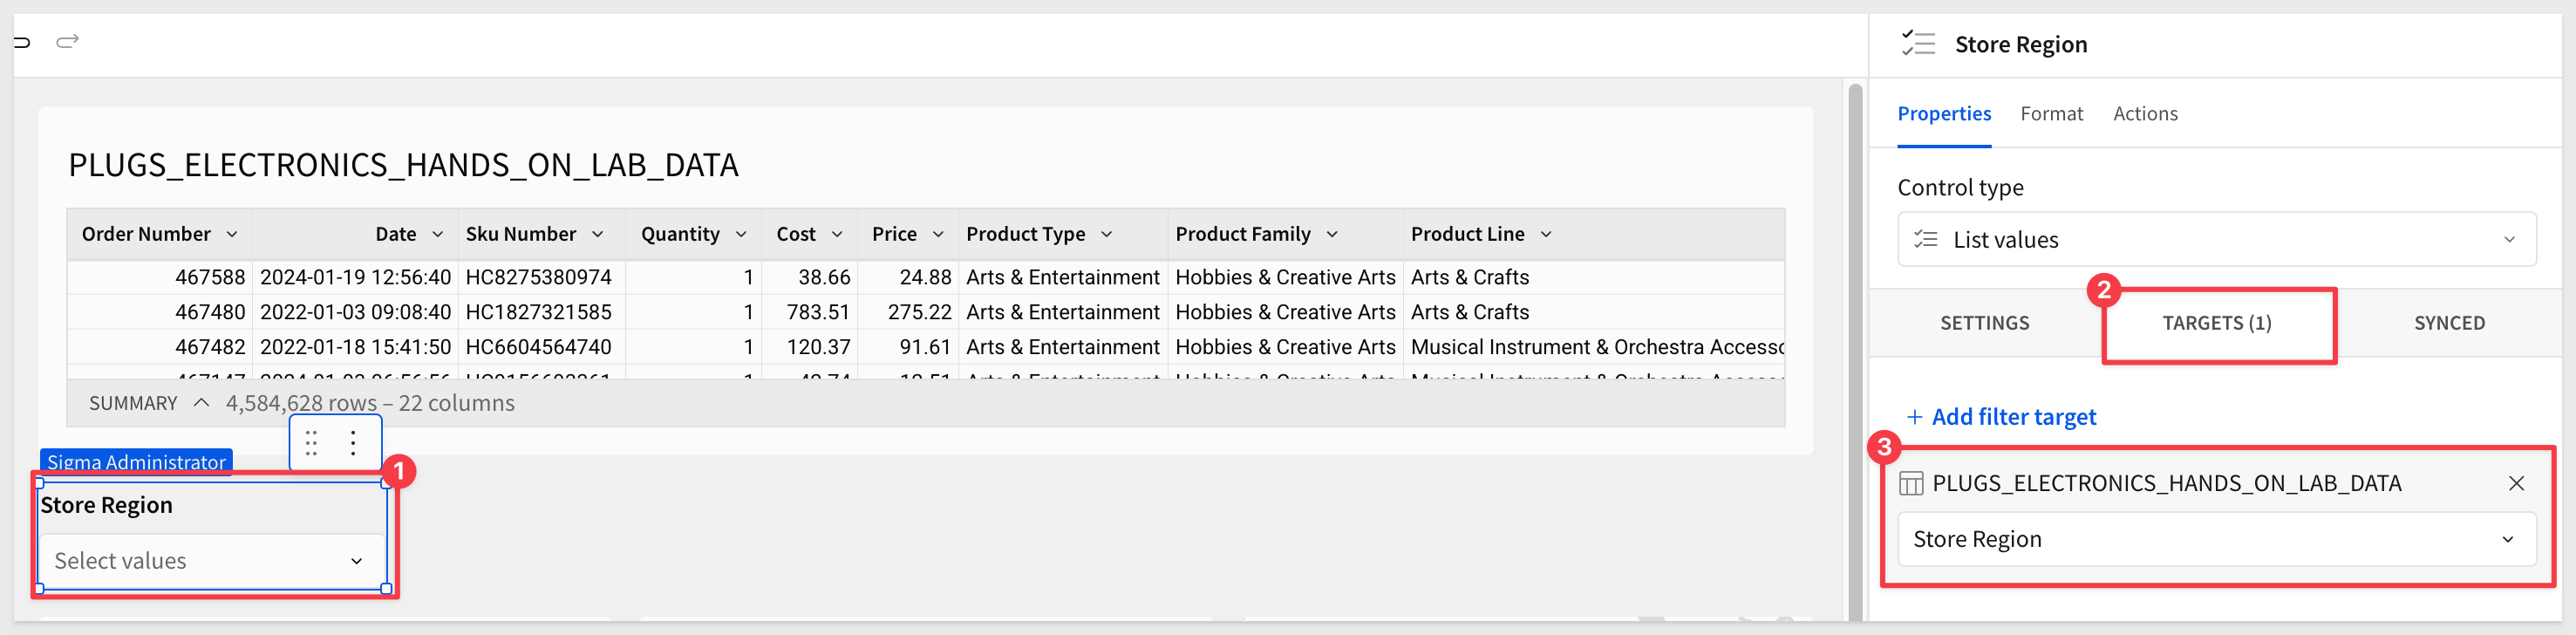
Configure the Target of the control to be the PLUGS_ELECTRONICS_HANDS_ON_LAB_DATA table > Store Region column:
Add some charts
Let's add three simple charts of different types so we can see how this works later.
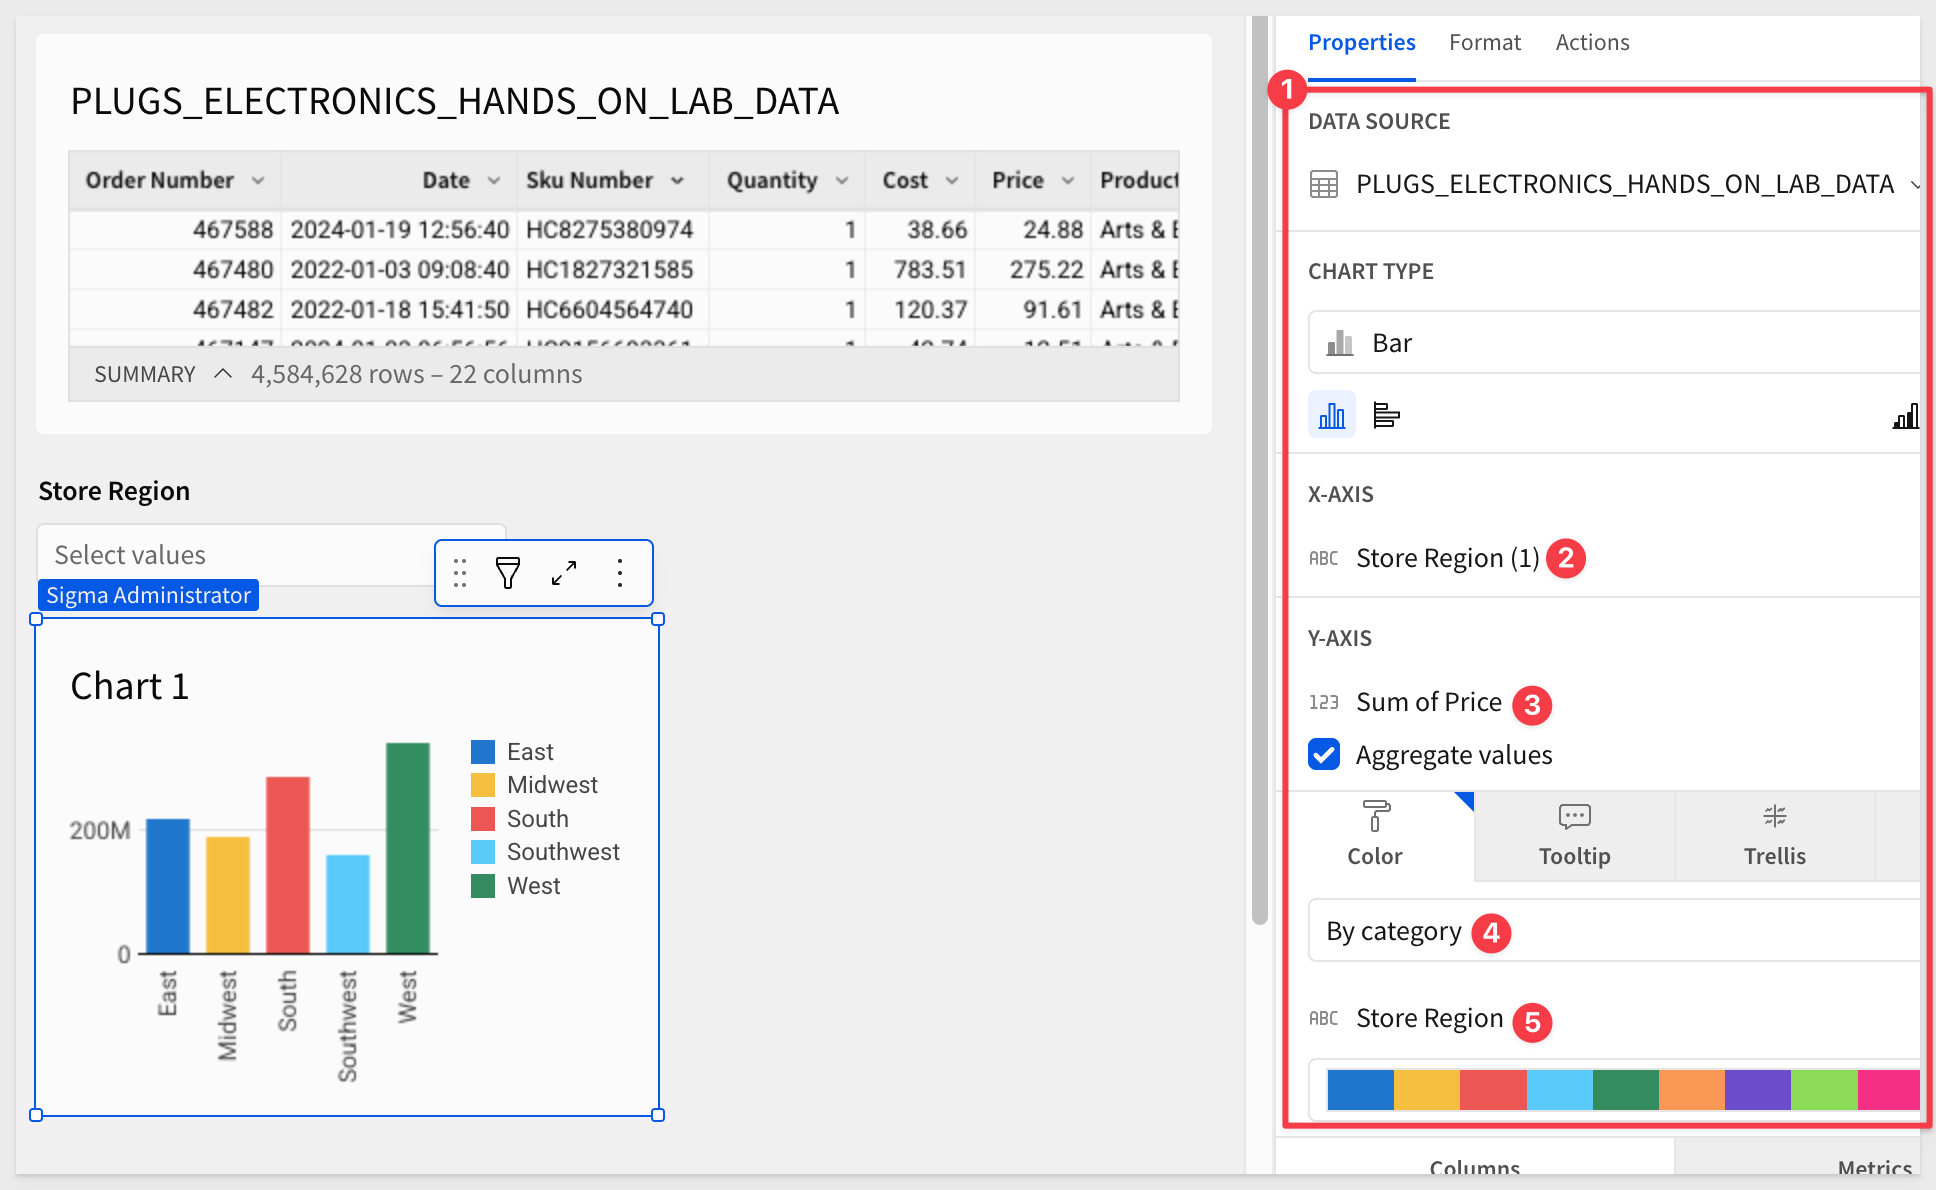
For Chart 1, create a Child element from the table, selecting Chart, and configure it as shown below.
 Make a duplicate of `Chart 1` and configure it as shown:
 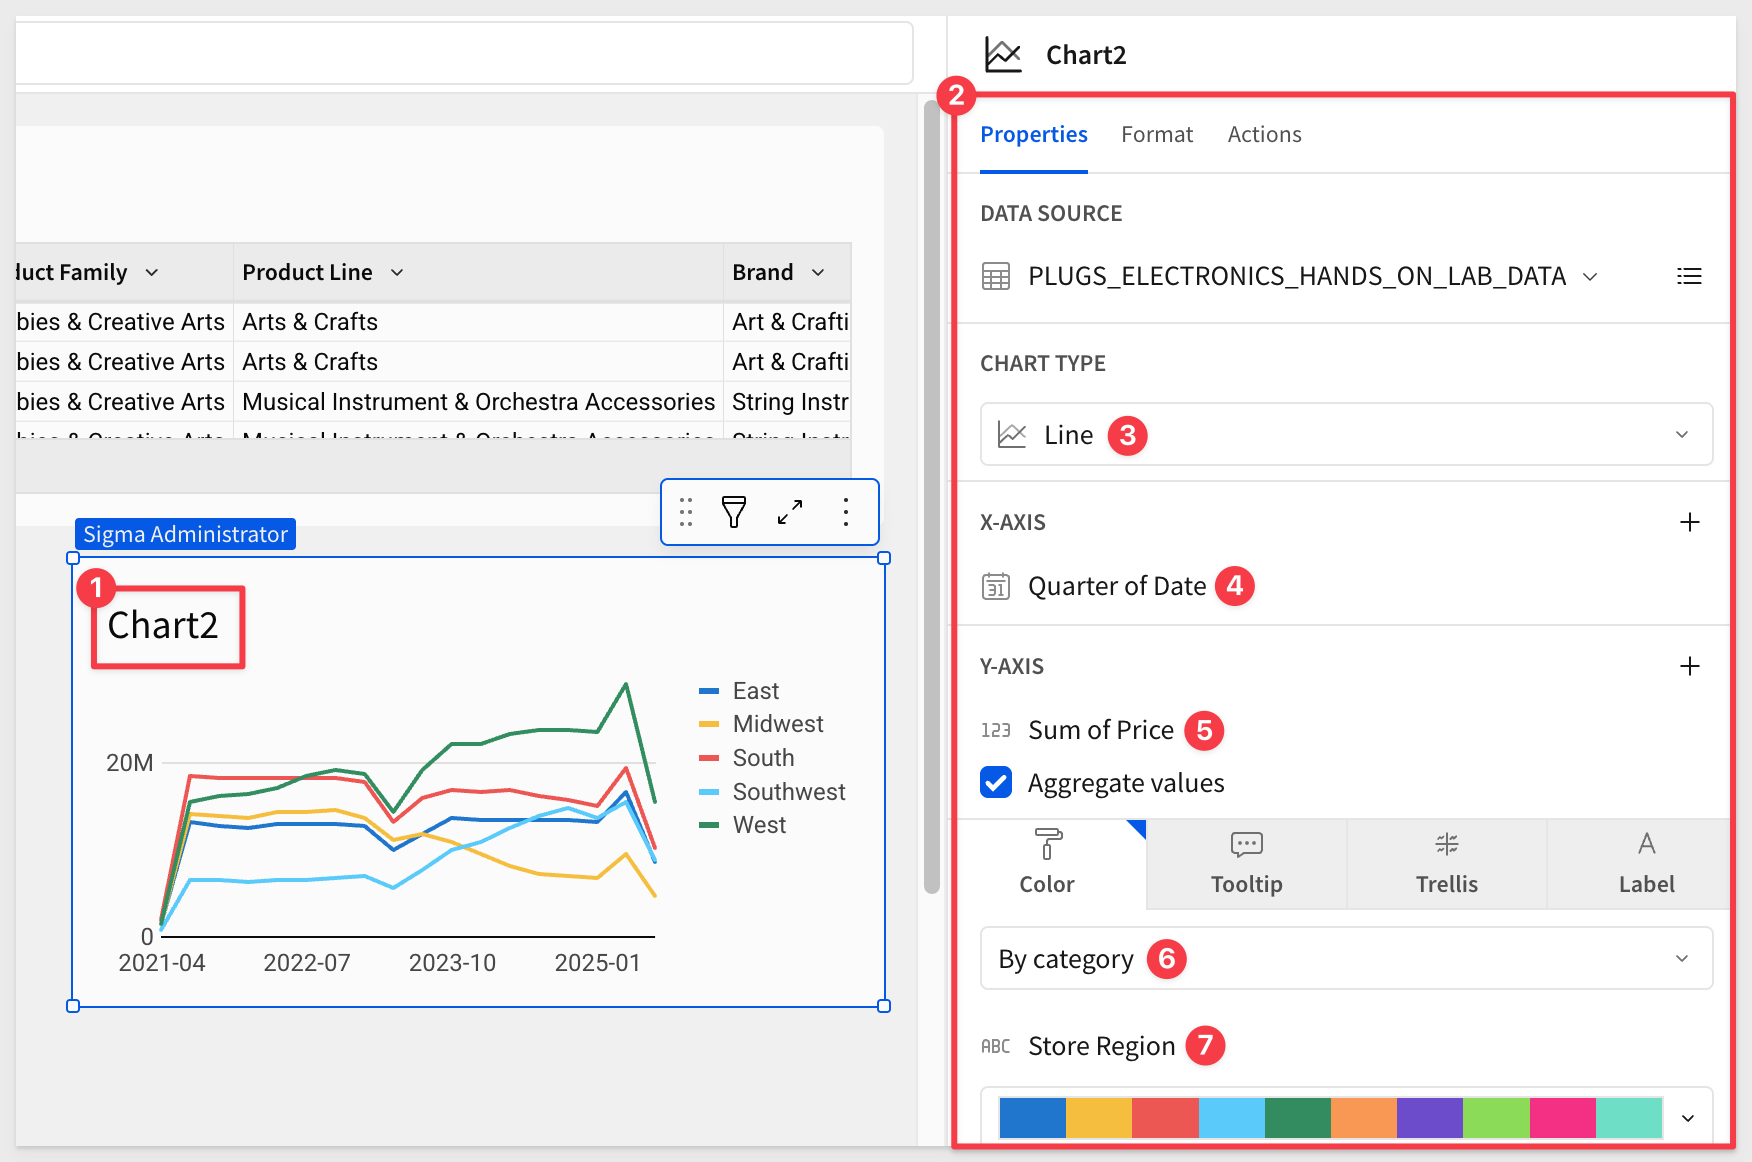 Make a duplicate of `Chart 2` and configure it as shown:
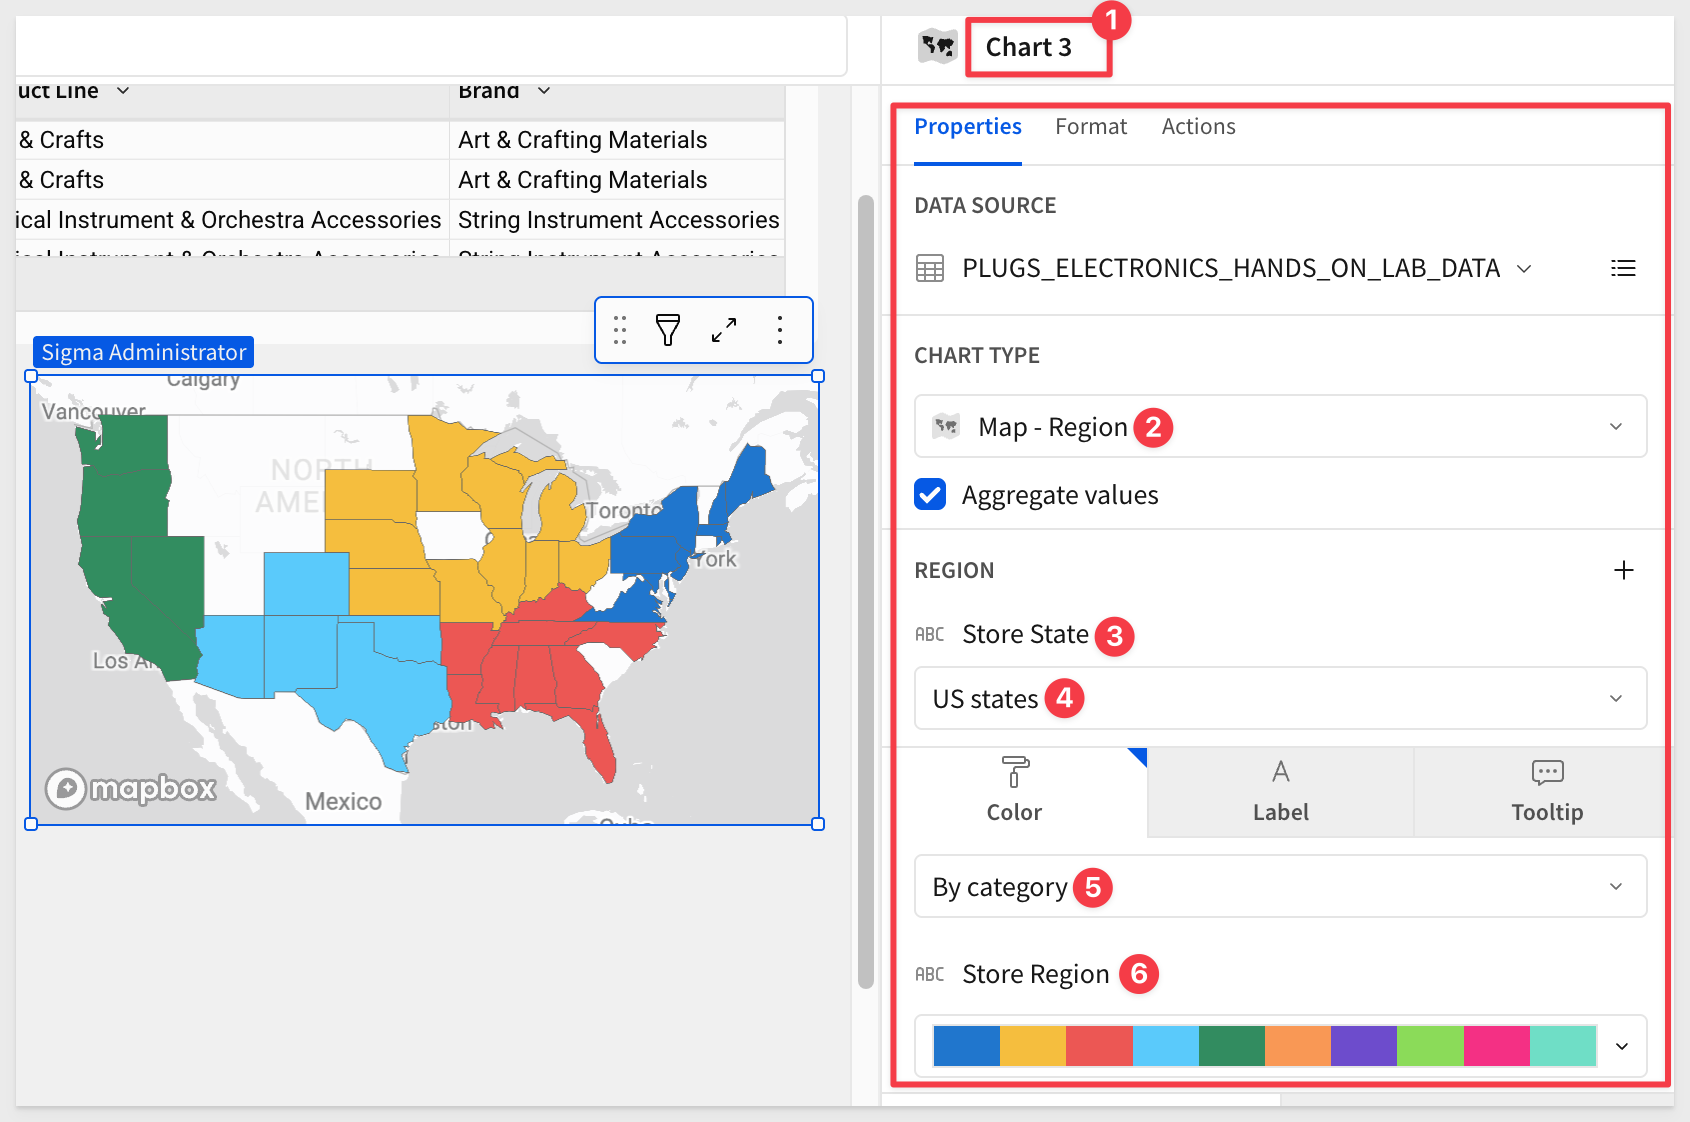
Initial test
If we select one Store Region using the page control, the table and all three charts automatically update:
That's good—but if we click on a region within any of the charts, the other charts and the table don't respond:
This is where Sigma actions come to the rescue.
Actions in Sigma are easy to use yet flexible enough to support advanced functionality. In this demonstration, we'll use just a small fraction of that power to make page elements respond to each other. This creates an intuitive, interactive UI where users can instantly see how one change affects other information.
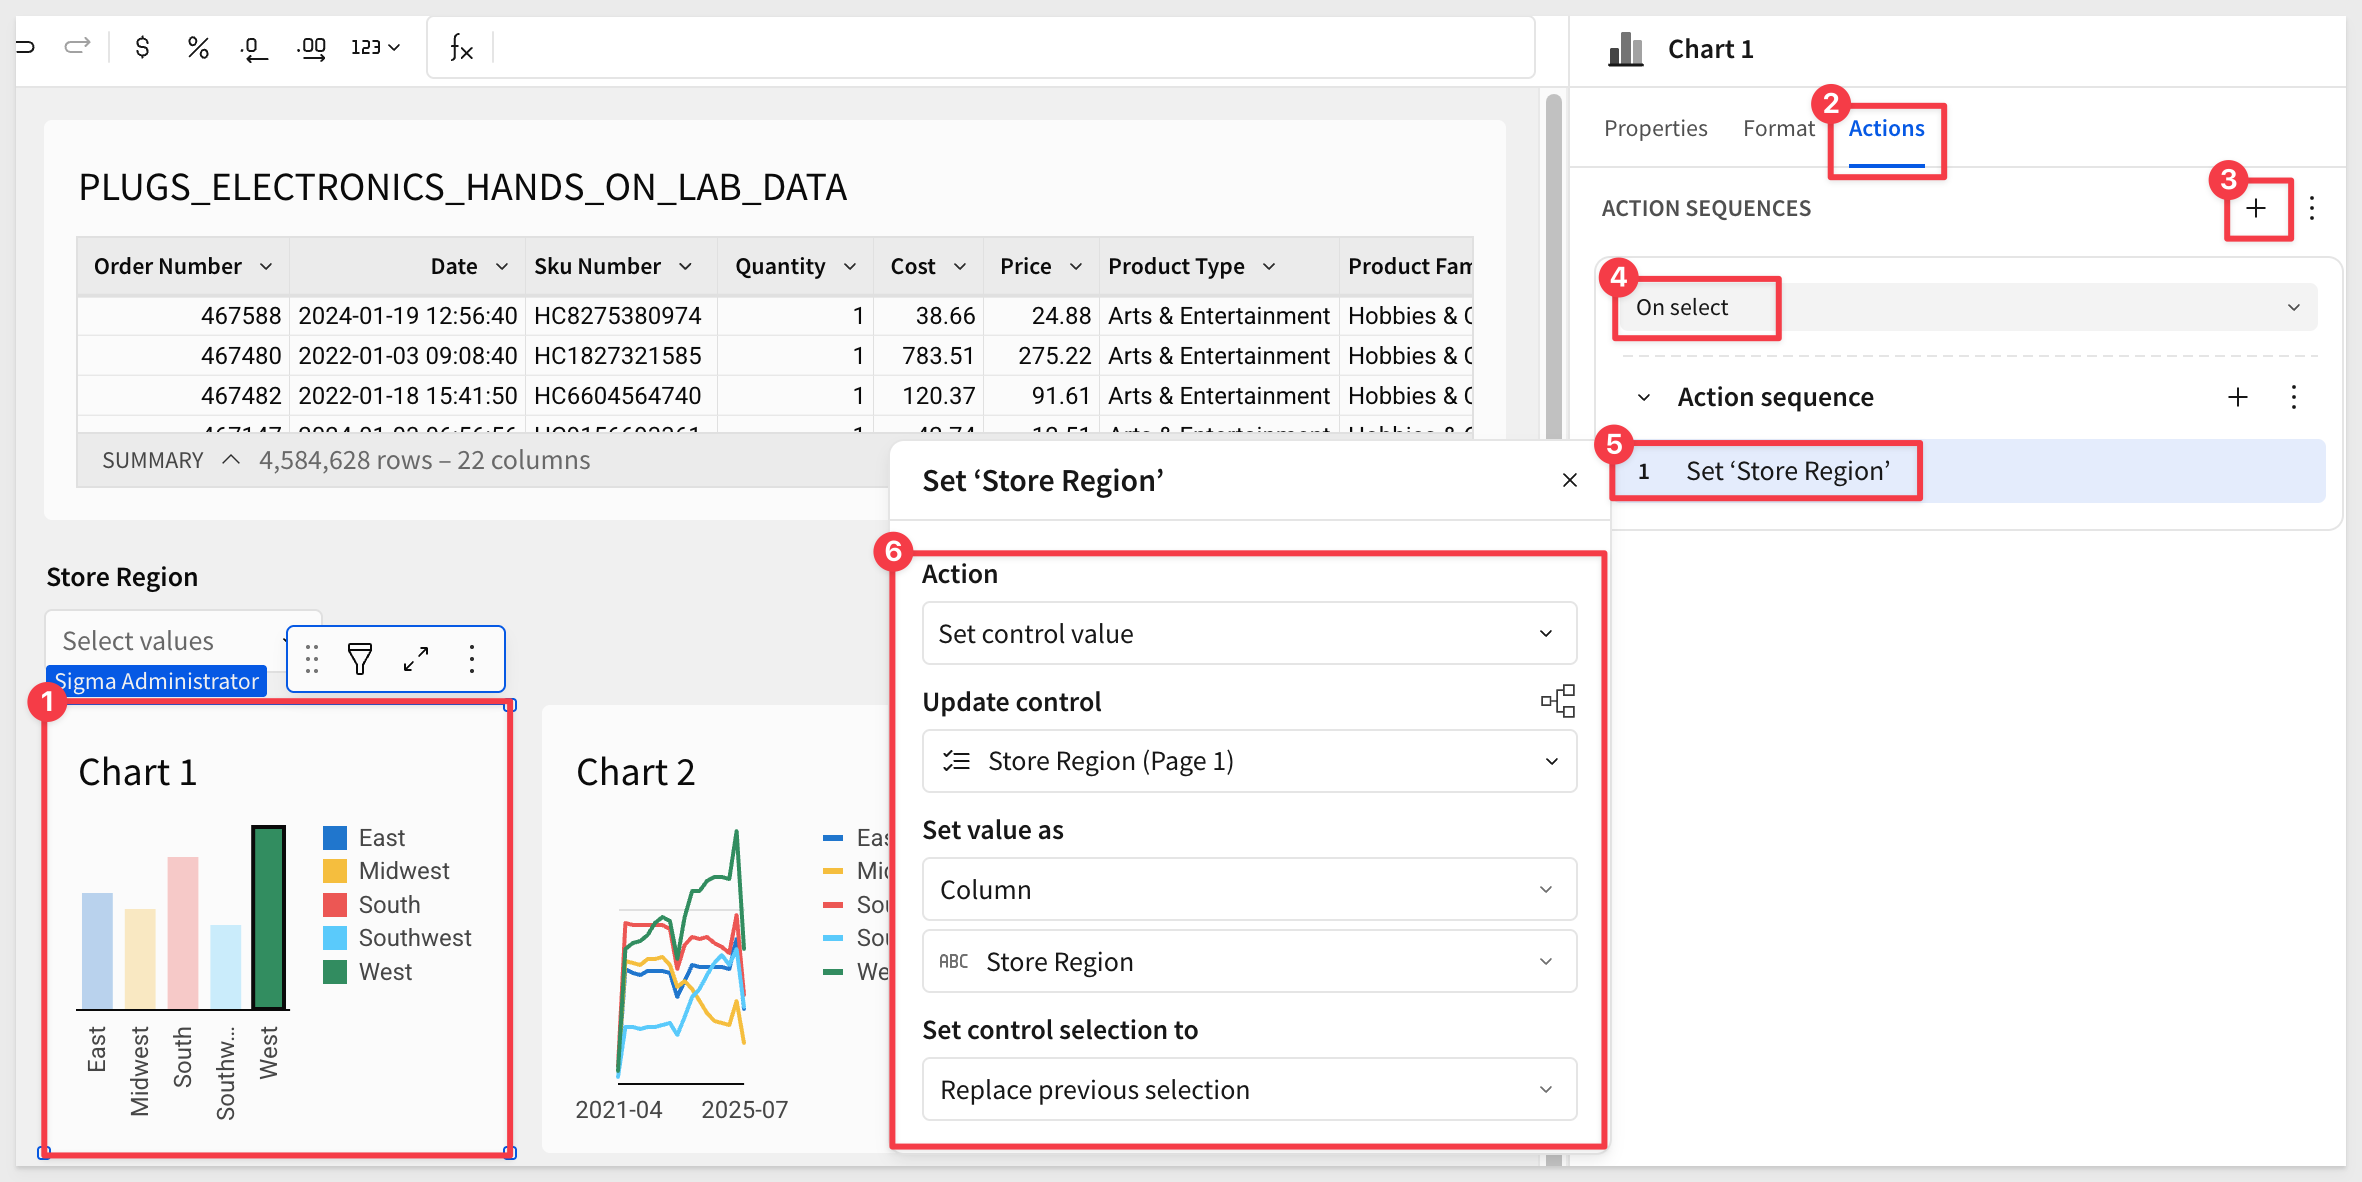
Our first action
Click on Chart 1 to select it.
From the Element panel > Actions menu, configure a single action as shown:
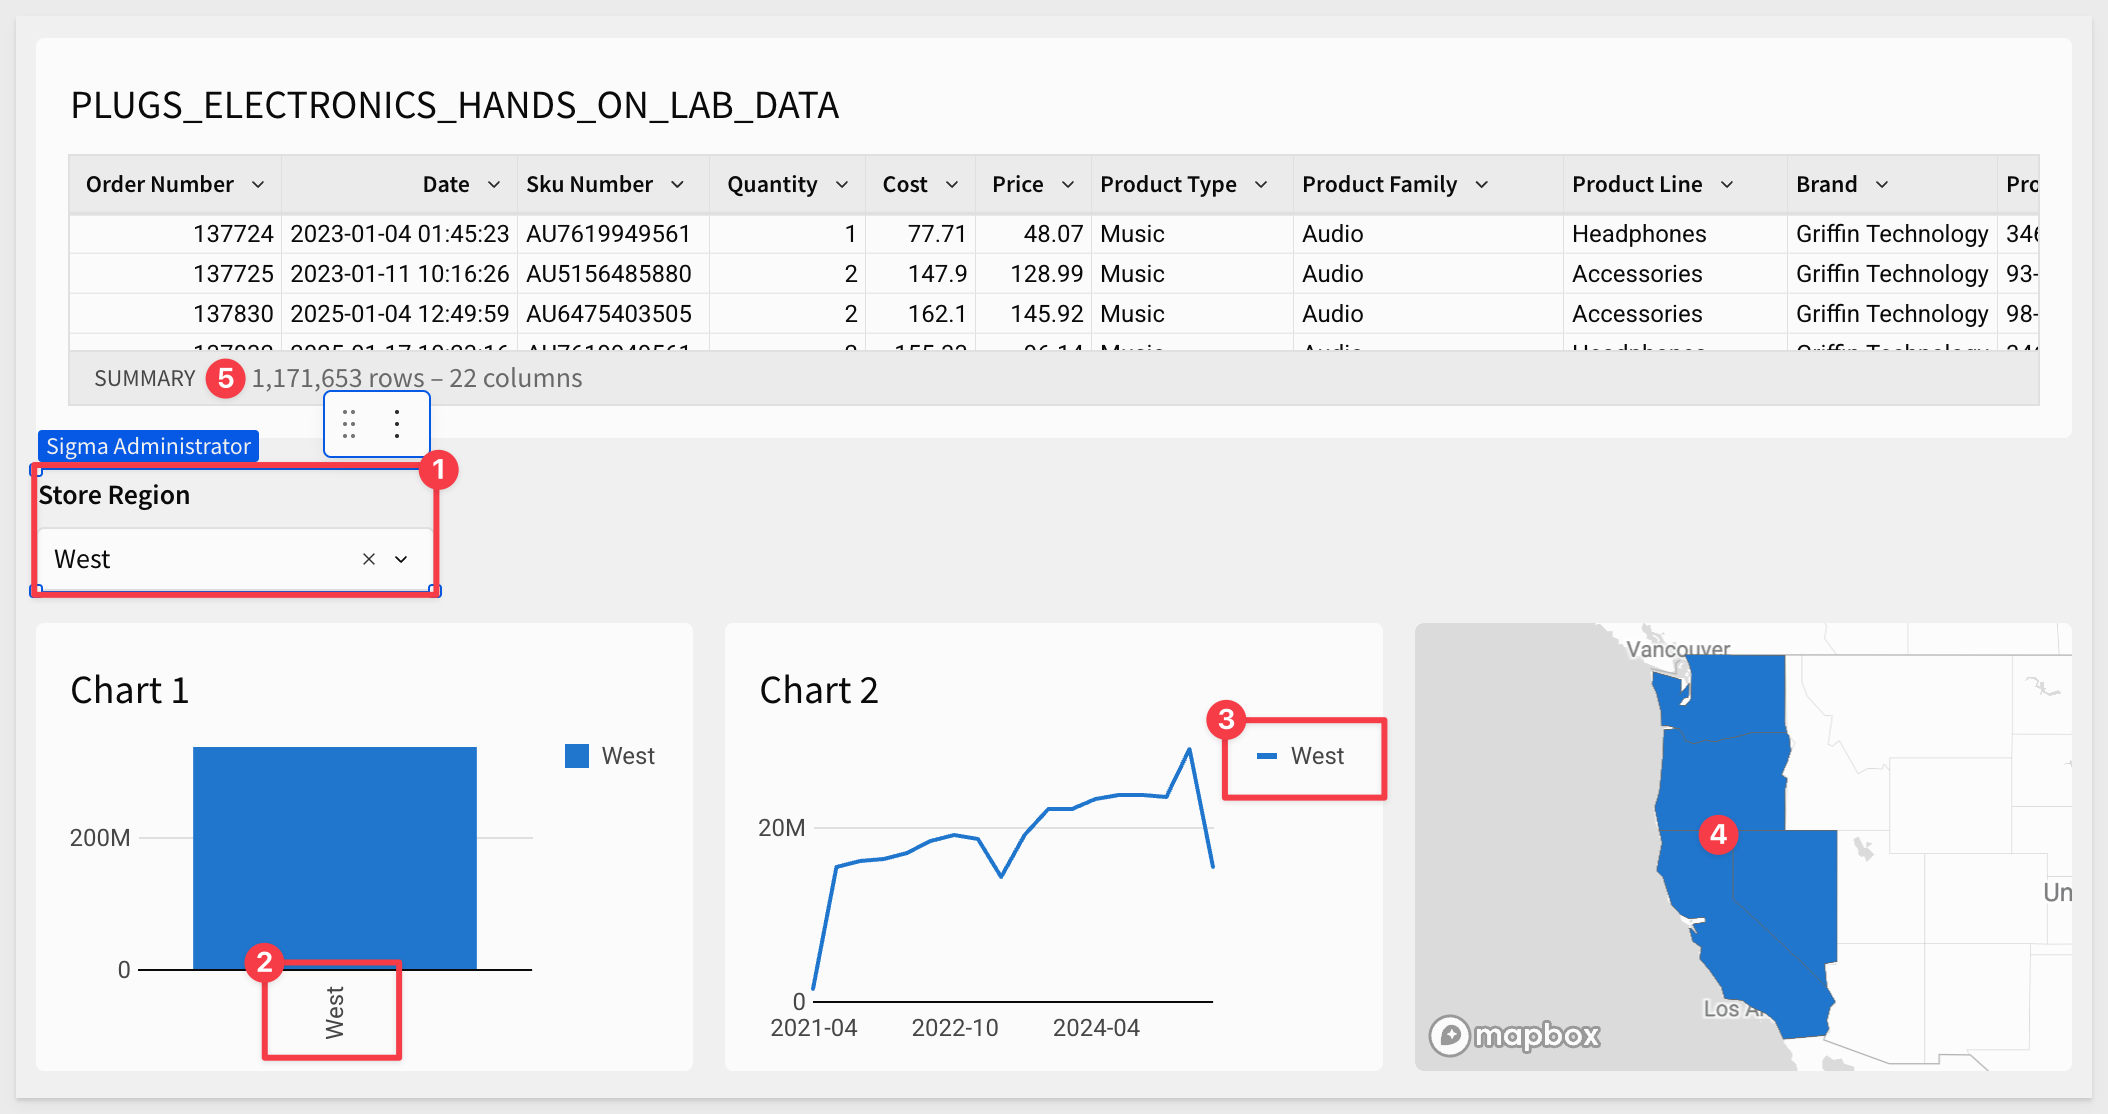
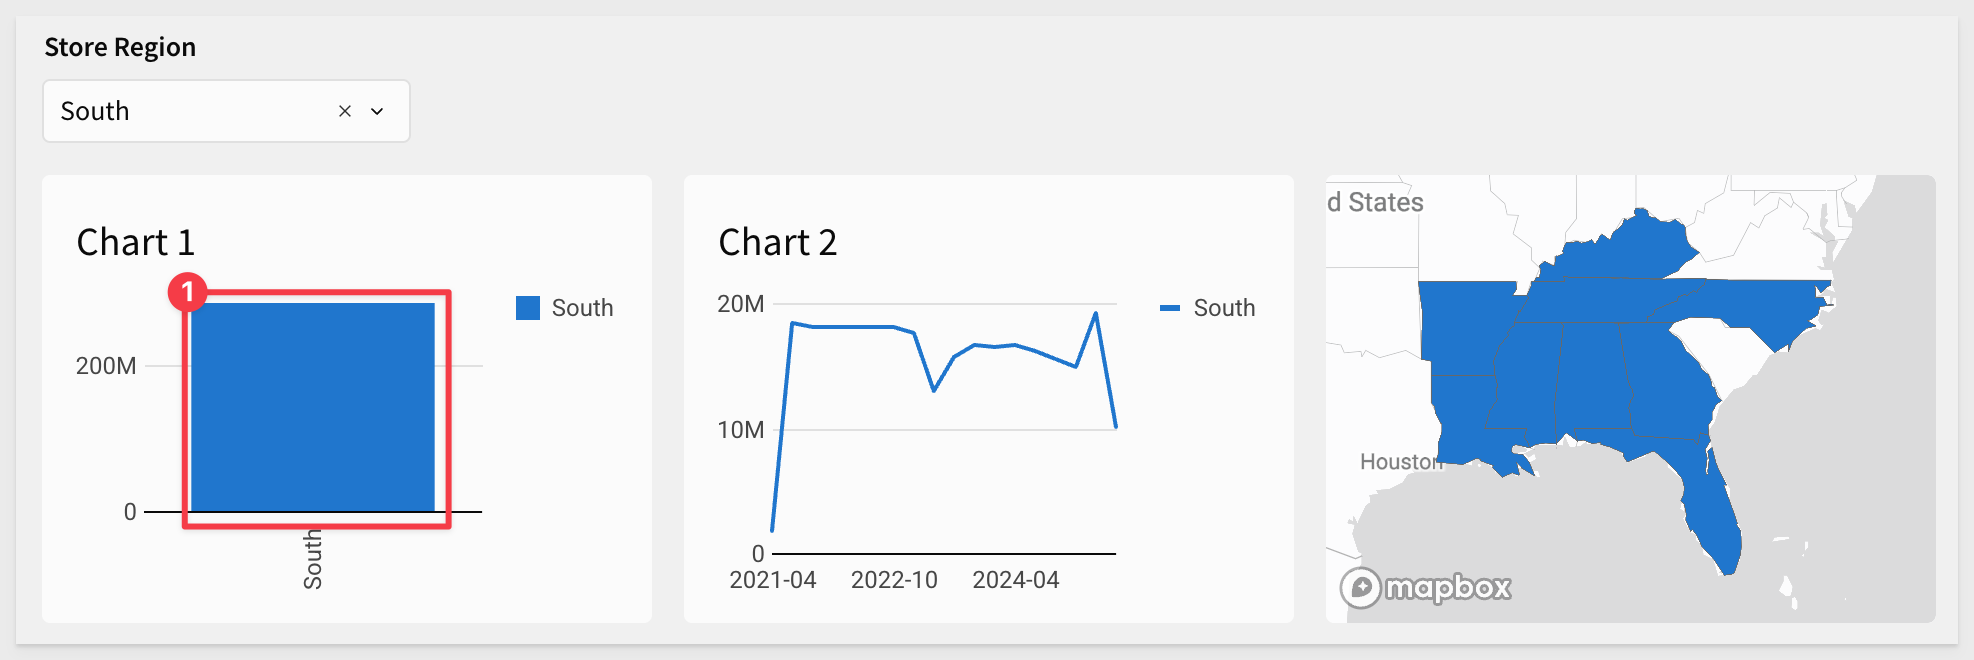
Now, when the user clicks a Store Region in Chart 1, the other charts automatically update:
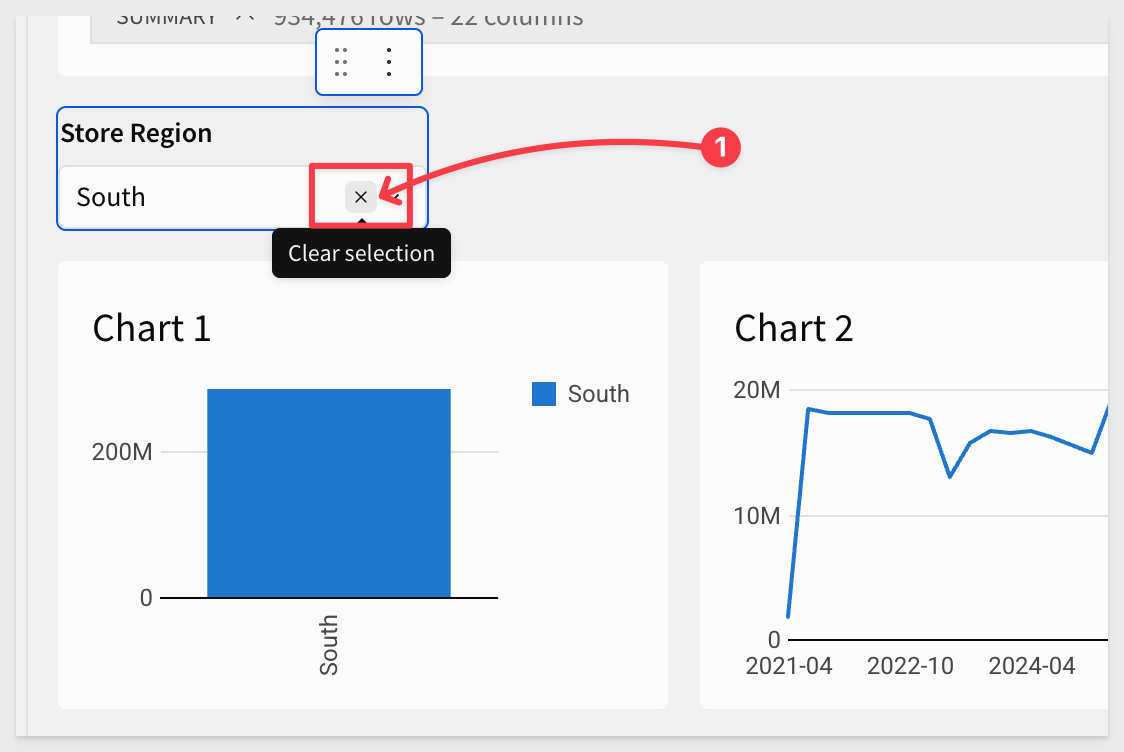
Clicking the x in the Store Region control clears the selection:
That workflow is good, but we can make it even clearer for users.
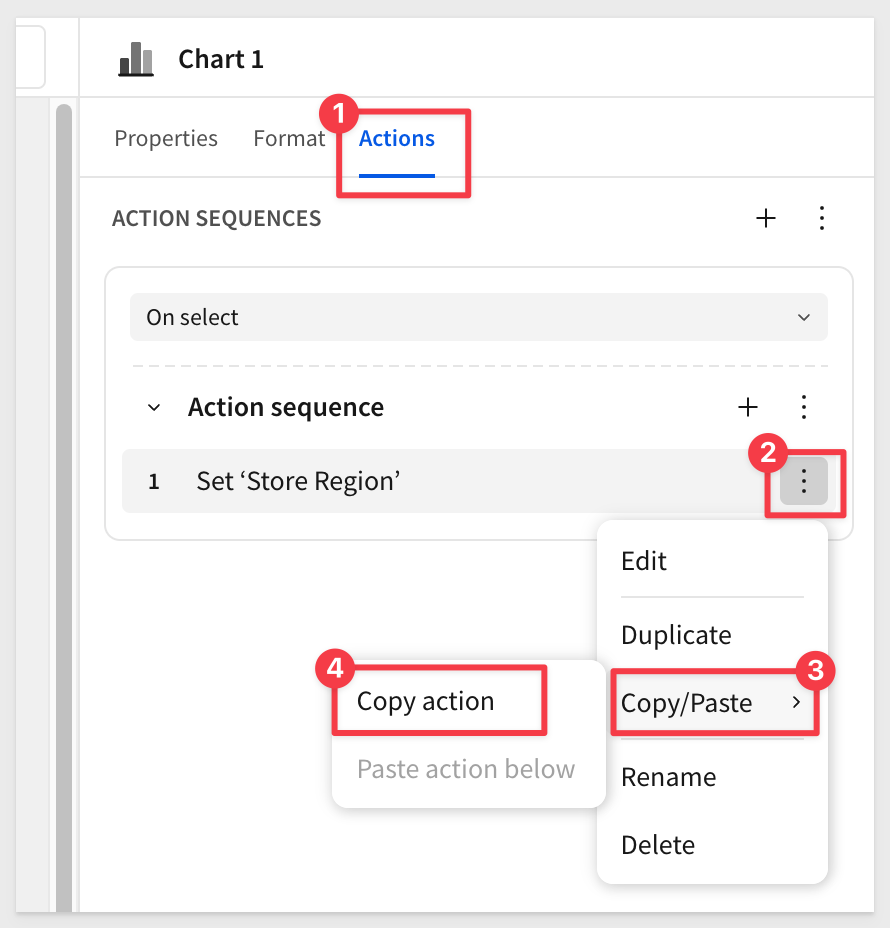
Copy actions
We need to apply the same action from Chart 1 to the other charts. Instead of recreating it manually, use the Copy action feature:
Then select Chart 2 and choose Paste action within:
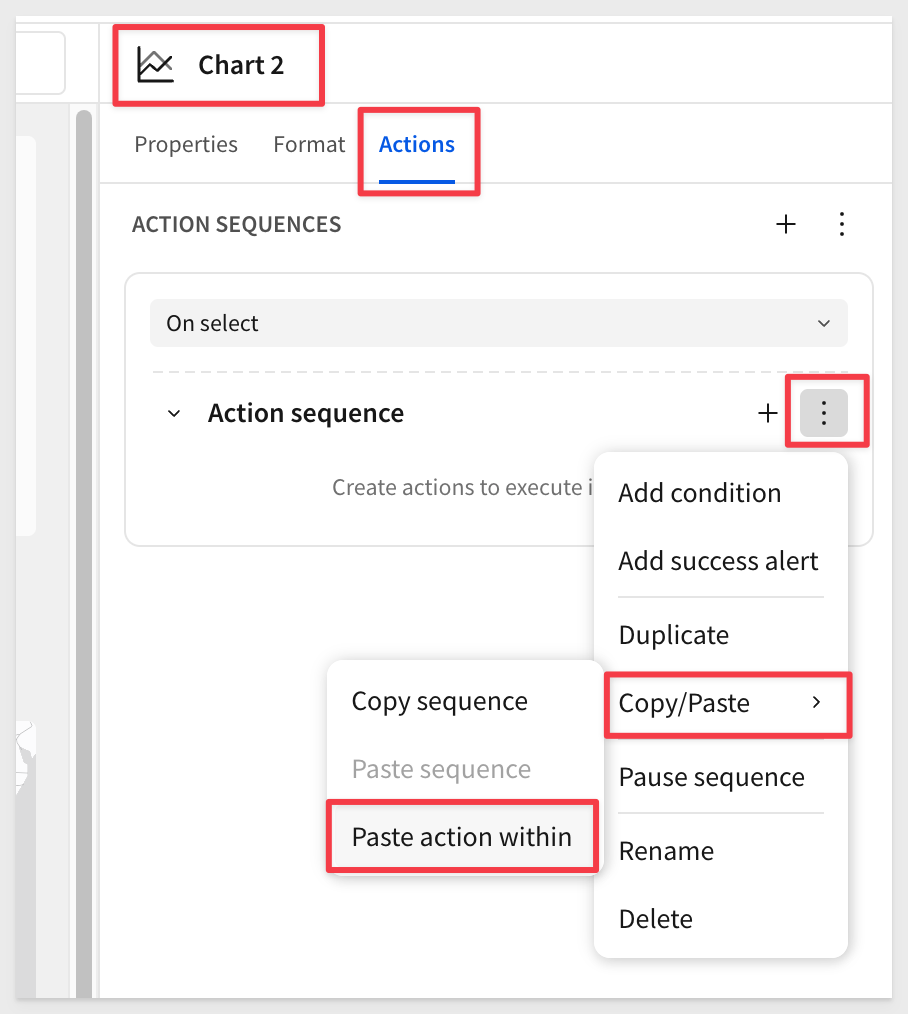
Repeat the copy/paste for the map.
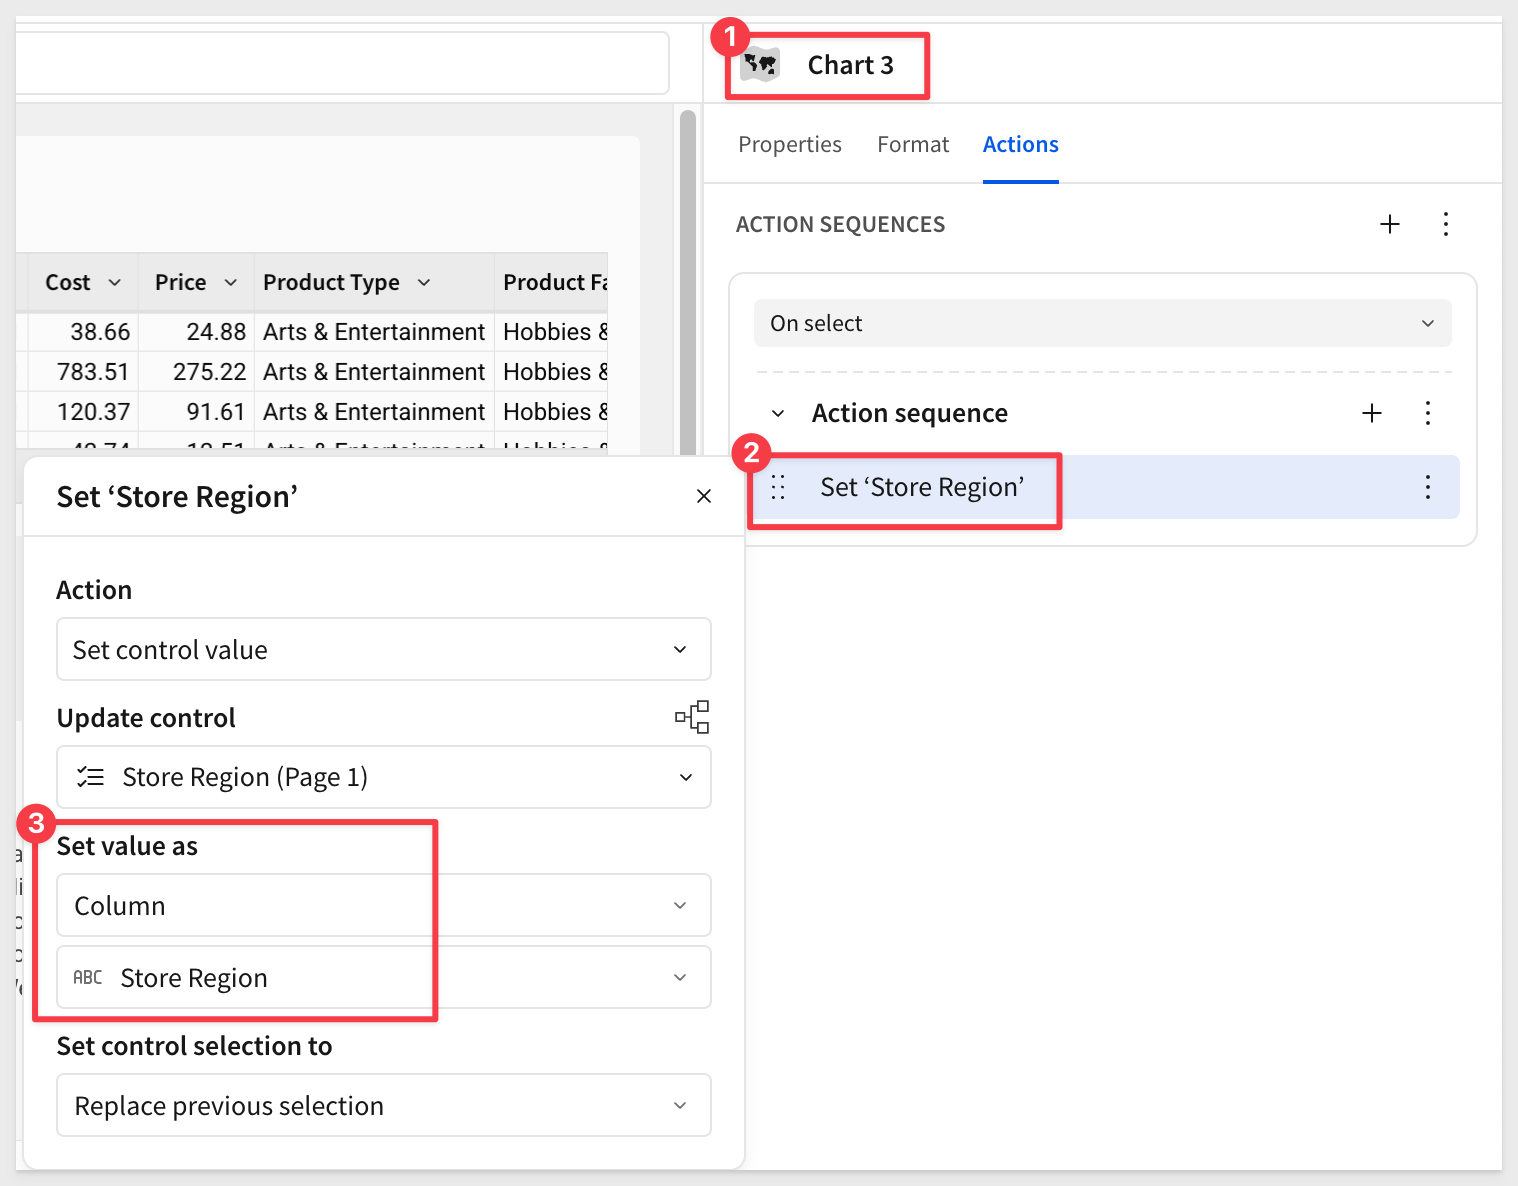
As actions get more complex, it's a good idea to verify they're configured correctly—both in terms of behavior and target elements:
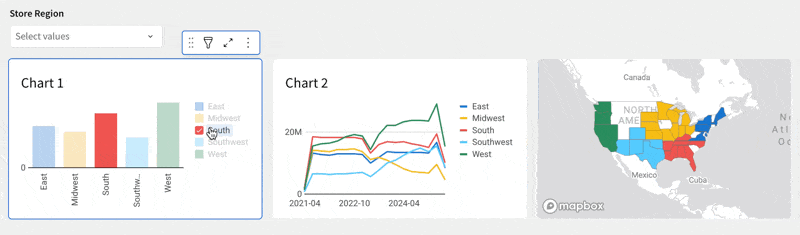
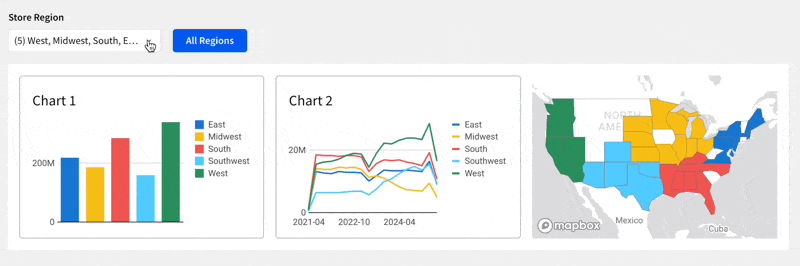
Now, clicking on any Store Region in any chart applies the selection across all charts:
Click Publish.
All charts can display the data driving them with a single click:
This allows users to drill down to the lowest level of granularity whenever they need.
Returning to the chart view is also a single click:
Next, let's clean up the interface so users know what to do at first glance.
Since we're focused on charts, let's rename the page Charts and move the PLUGS_ELECTRONICS_HANDS_ON_LAB_DATA table to a new page named Data.
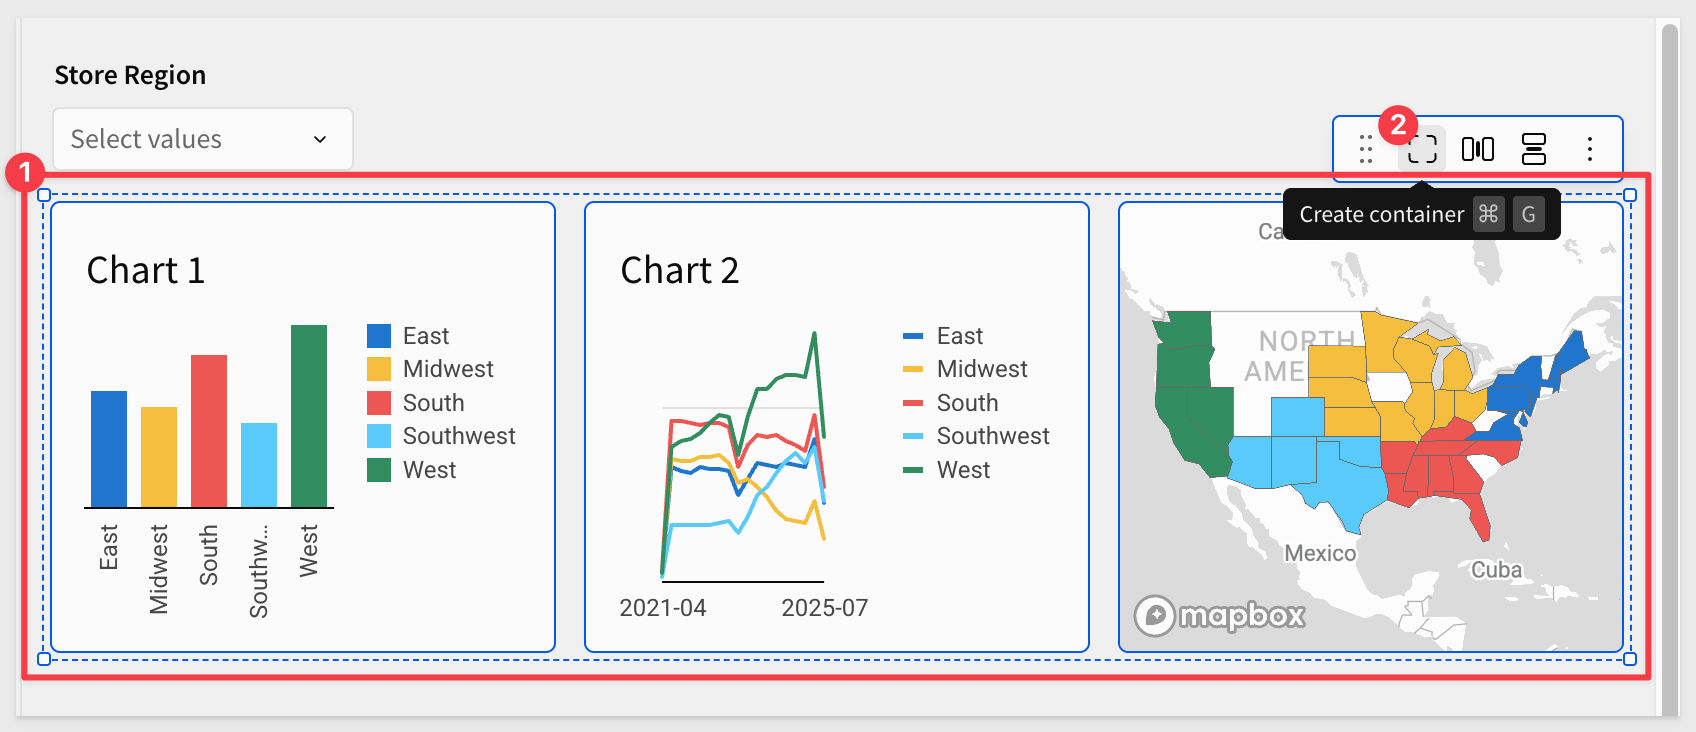
Drag the three charts to select them together, then click the Create container icon:
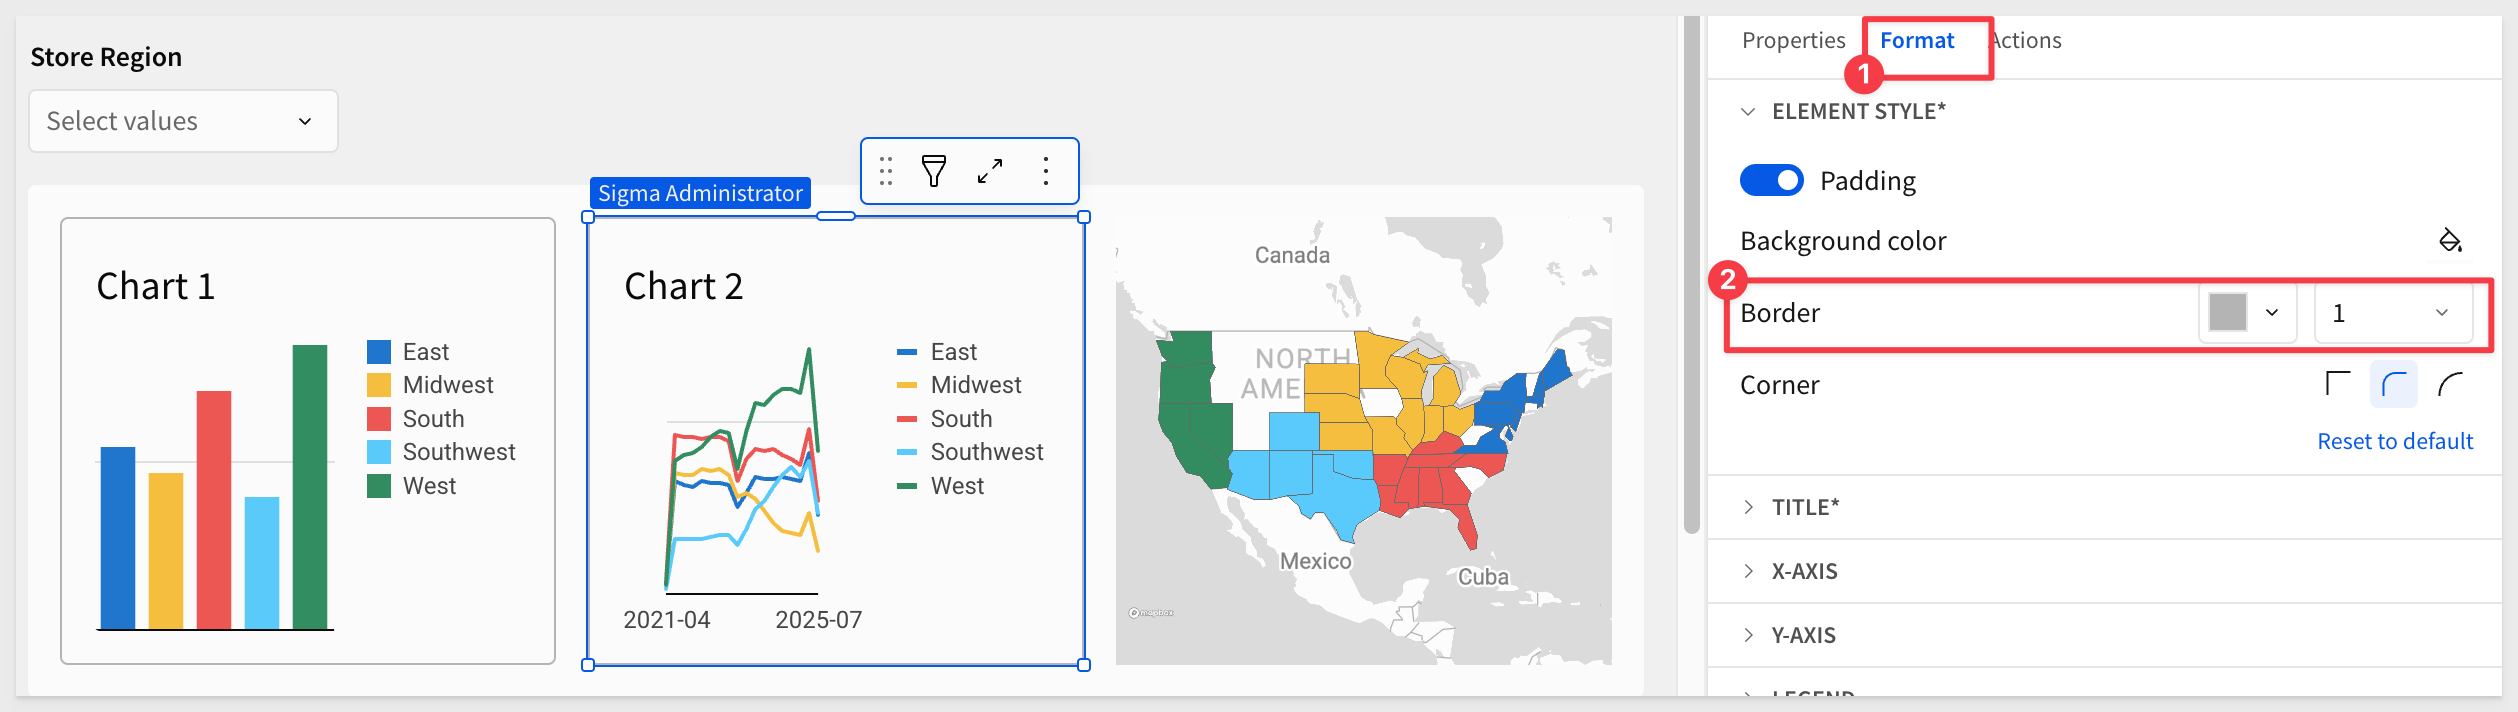
Sigma provides extensive formatting features. For example, you may want to keep a light border around the charts:
Clear filters button
The Store Region control can be reset to show all regions by either clicking the x (one click) or selecting all regions manually (two clicks). However, this may not be immediately obvious to first-time users.
To make it clearer, add a Button from the Element bar > UI group.
Configure the button's action to set the Store Region control to All:
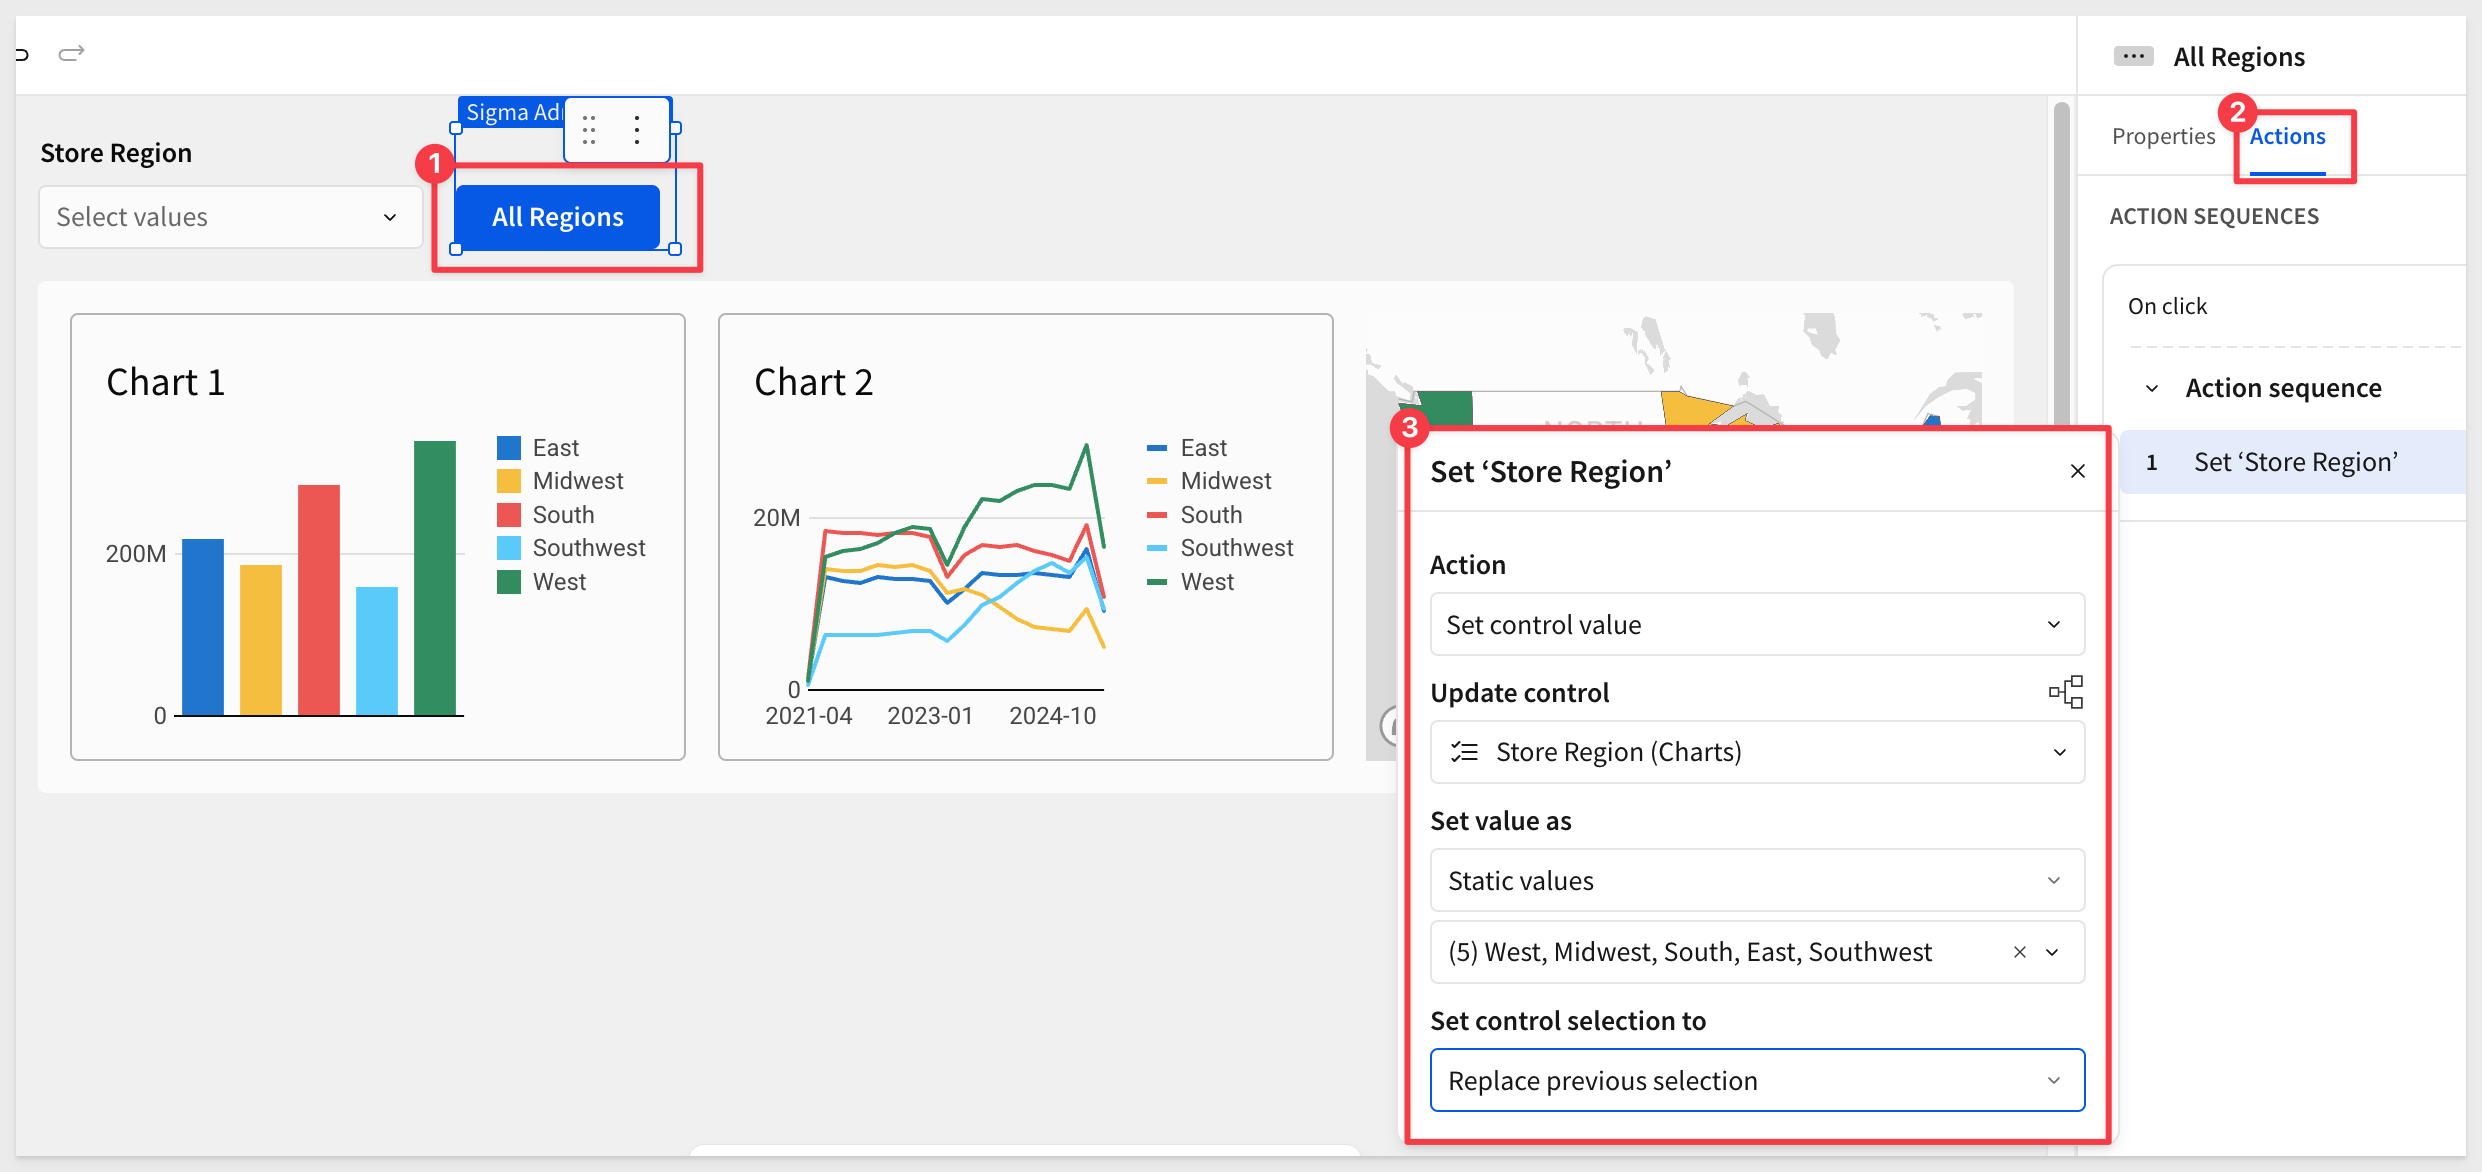
This button also resets the charts if the user has clicked into one of the chart bars:
For more information, see Intro to actions
In this QuickStart, we explored how to use Cross Chart Actions in Sigma to make dashboards more interactive and intuitive. We built a workbook with multiple charts, configured actions so charts respond to each other, and added cleanup elements like containers and a clear filters button to improve usability.
With these techniques, business users can drill into relationships in their data naturally—without relying on separate filters or complex setup.
Additional Resource Links
Blog
Community
Help Center
QuickStarts
Be sure to check out all the latest developments at Sigma's First Friday Feature page!