This QuickStart is designed to show how Sigma simplifies the process of creating an intuitive interface for managing data. Users can input, edit, and review changes in real-time, with the adjustments automatically recorded in a centralized log. The change log serves as a historical record, providing transparency and accountability for all modifications.
Key Features:
- Change Logging: Automatically capture each adjustment with details like user, timestamp, and updated values.
- Display the most recent adjusted value alongside the original value; never change the original data.
- Sigma Input Tables: Facilitate real-time data entry and updates directly in the Sigma UI.
- No knowledge of the cloud data warehouse is required, although all data will be stored there.
- Error handling
Use Cases:
This approach is ideal for scenarios where tracking manual adjustments is critical, such as:
- Inventory corrections
- Financial forecast updates
- Quality control audits
- Get creative!
By the end of this QuickStart, users will have a fully functional data app capable of handling live adjustments and maintaining a transparent change history, built entirely in Sigma.
Target Audience
Developers interested in using Sigma to build interactive data applications.
Prerequisites
- A computer with a current browser. It does not matter which browser you want to use.
- Access to your Sigma environment.
- Some familiarity with Sigma is assumed. Not all steps will be shown as the basics are assumed to be understood.
For more information on Sigma's product release strategy, see Sigma product releases.

Log into Sigma as Administrator and create a new workbook.
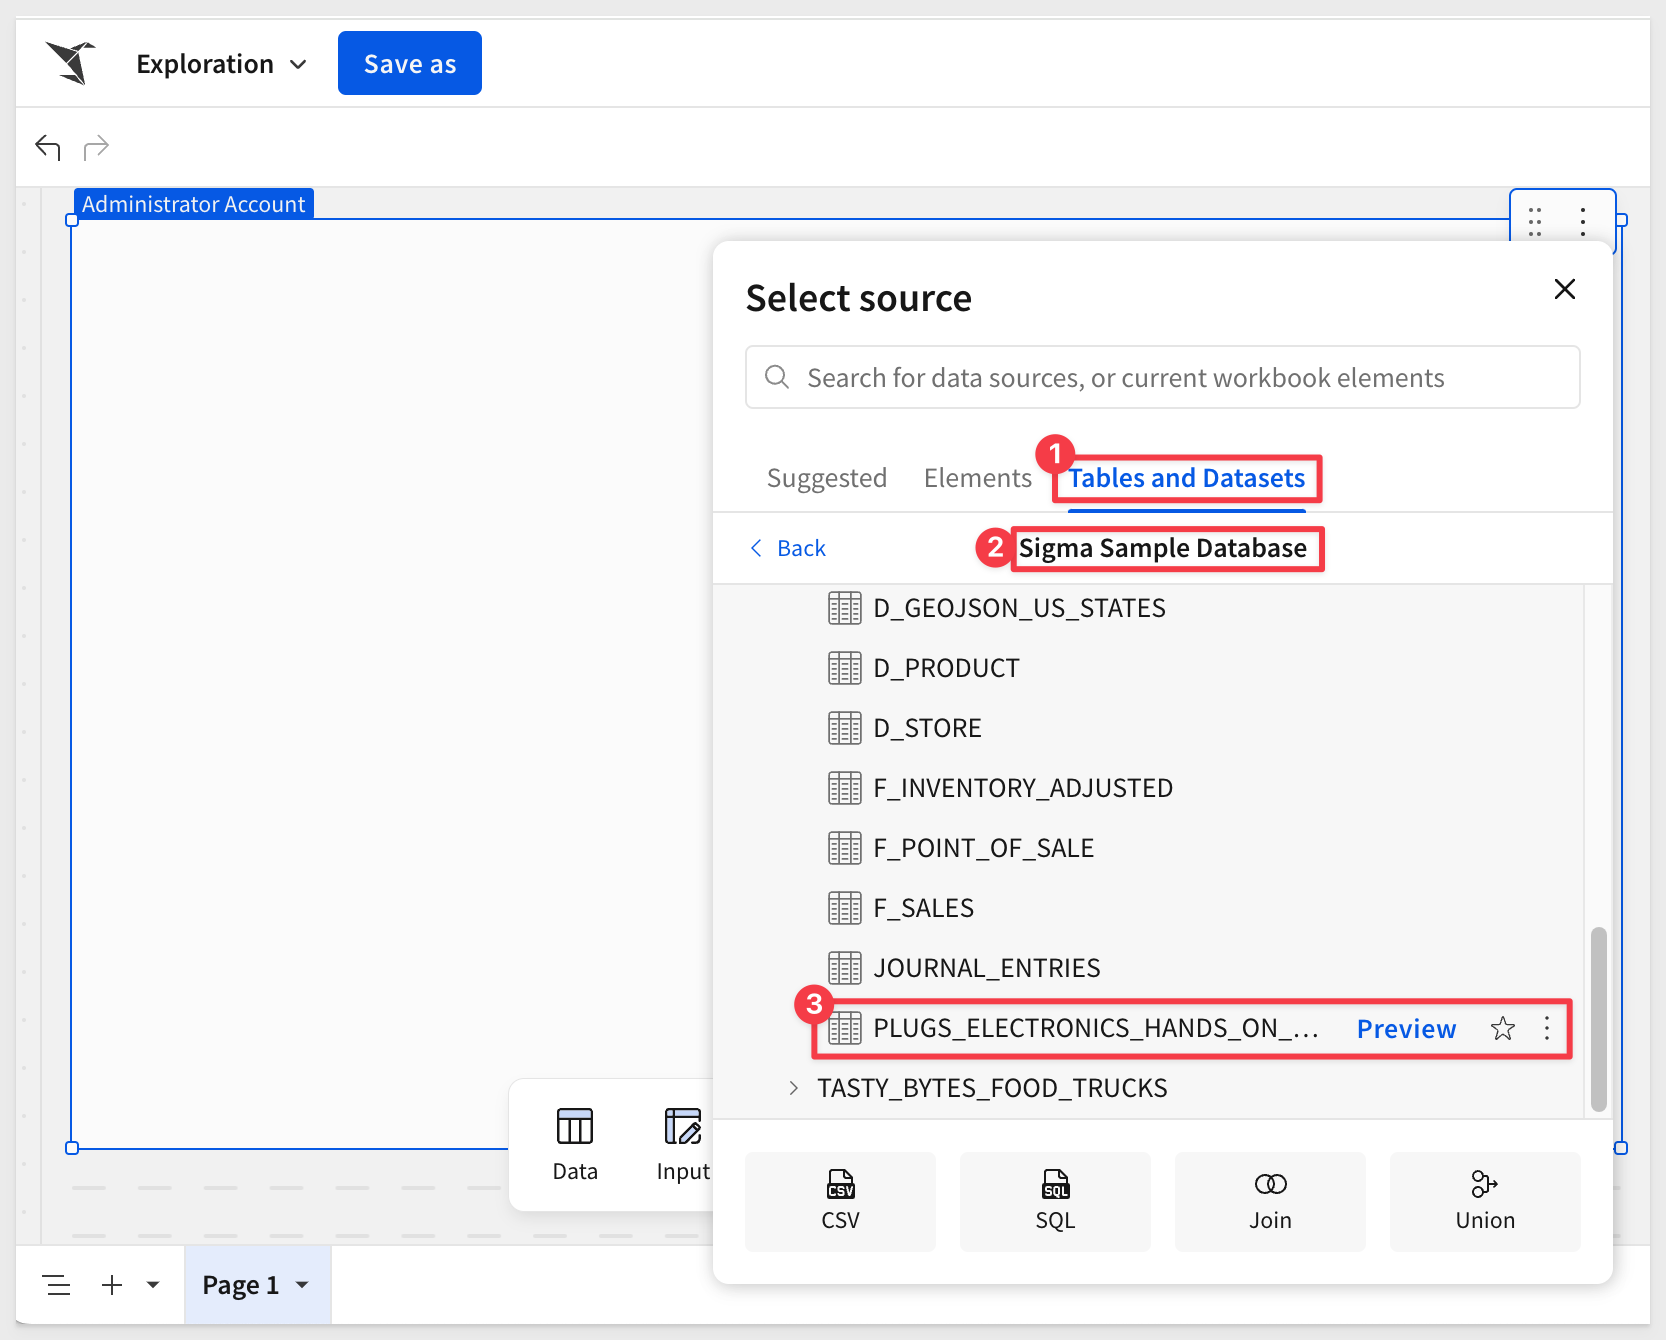
Add a new Data > Table to the page and set the source to Sigma Sample Database > RETAIL > PLUGS_ELECTRONICS > PLUGS_ELECTRONICS_HANDS_ON_LAB_DATA:
Add a new column, rename it to Revenue and set the formula to:
[Price] * [Quantity]
Add another new column, rename it to Month and set the formula to:
DateTrunc("month", [Date])
Let's cull the data down for this demonstration. We don't need 4.5 million rows to build our data app, although Sigma handles it fine anyway. There is no reason to use more data than is required and efficiency matters.
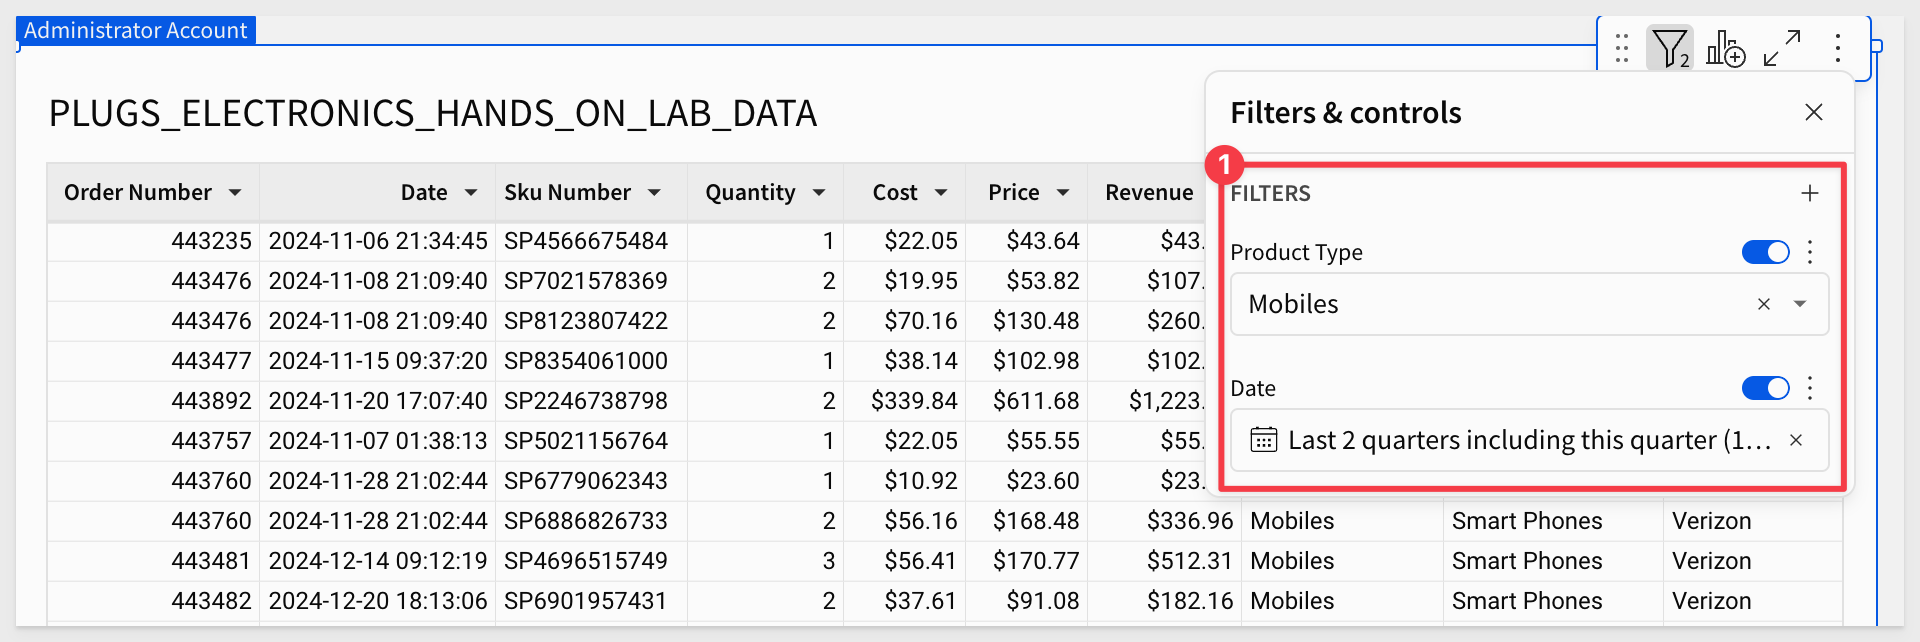
Filter the table down to just Mobiles:
Also filter the table to the Last 2 quarters:
Rename this page to Data.
Save the workbook as QuickStart - Adjustments Change Log.
Add another workbook page and rename it to Home.
On the Home page, add a new Data > Pivot Table. Set the source to the Data > PLUGS_ELECTRONICS_HANDS_ON_LAB_DATA table.
Group the table as shown in the screenshot below:
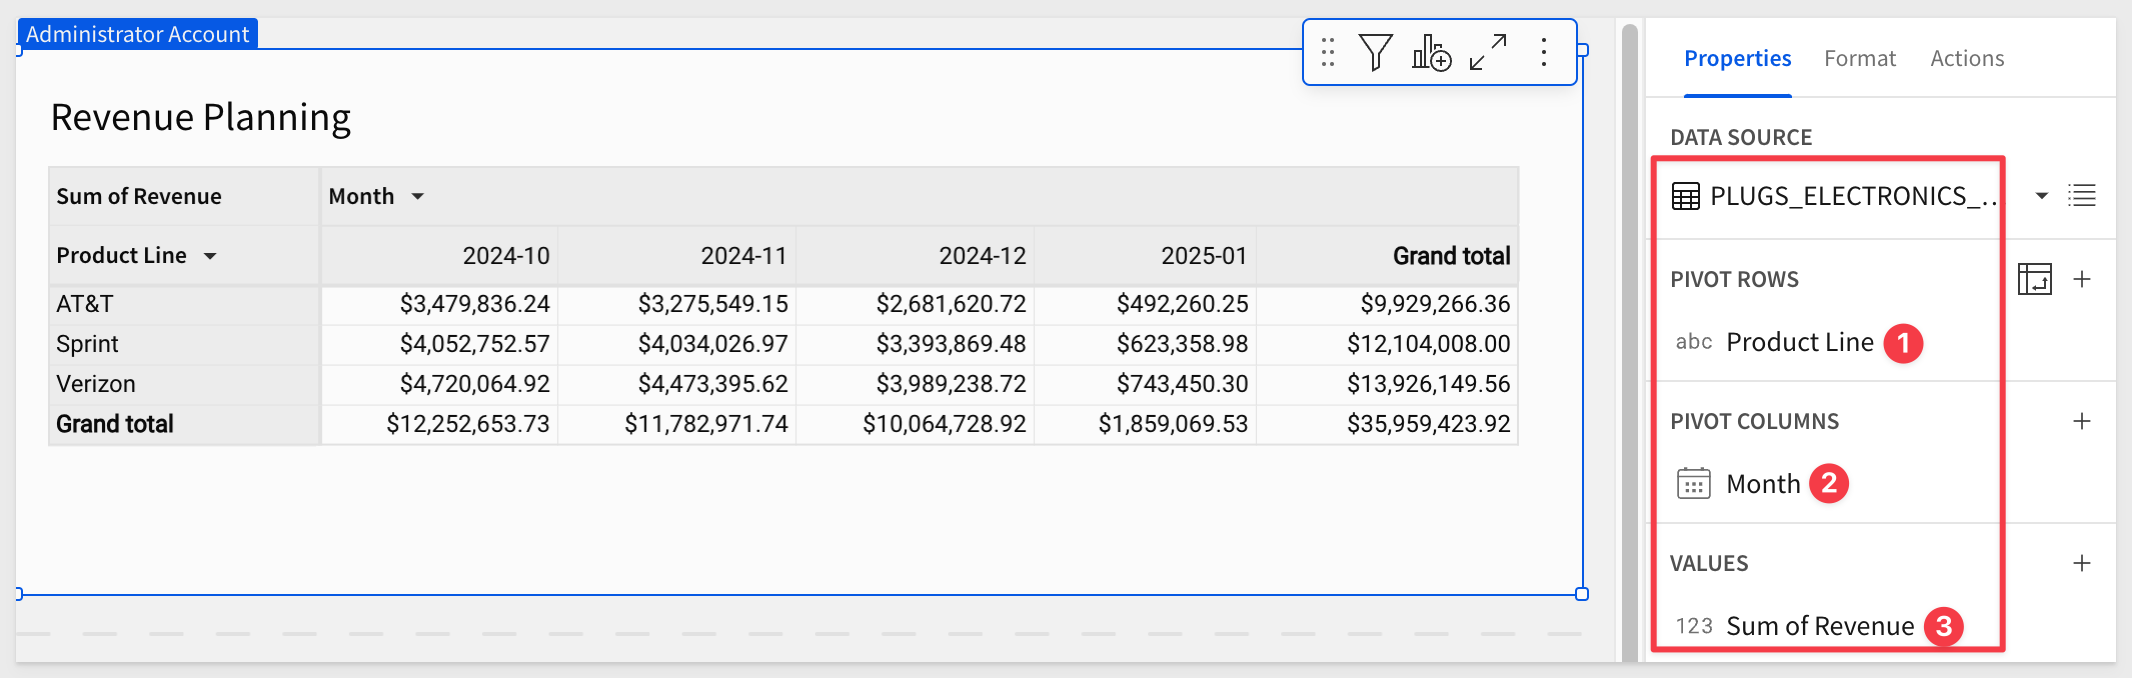
Rename the pivot table to Revenue Planning.
Create a Key Column
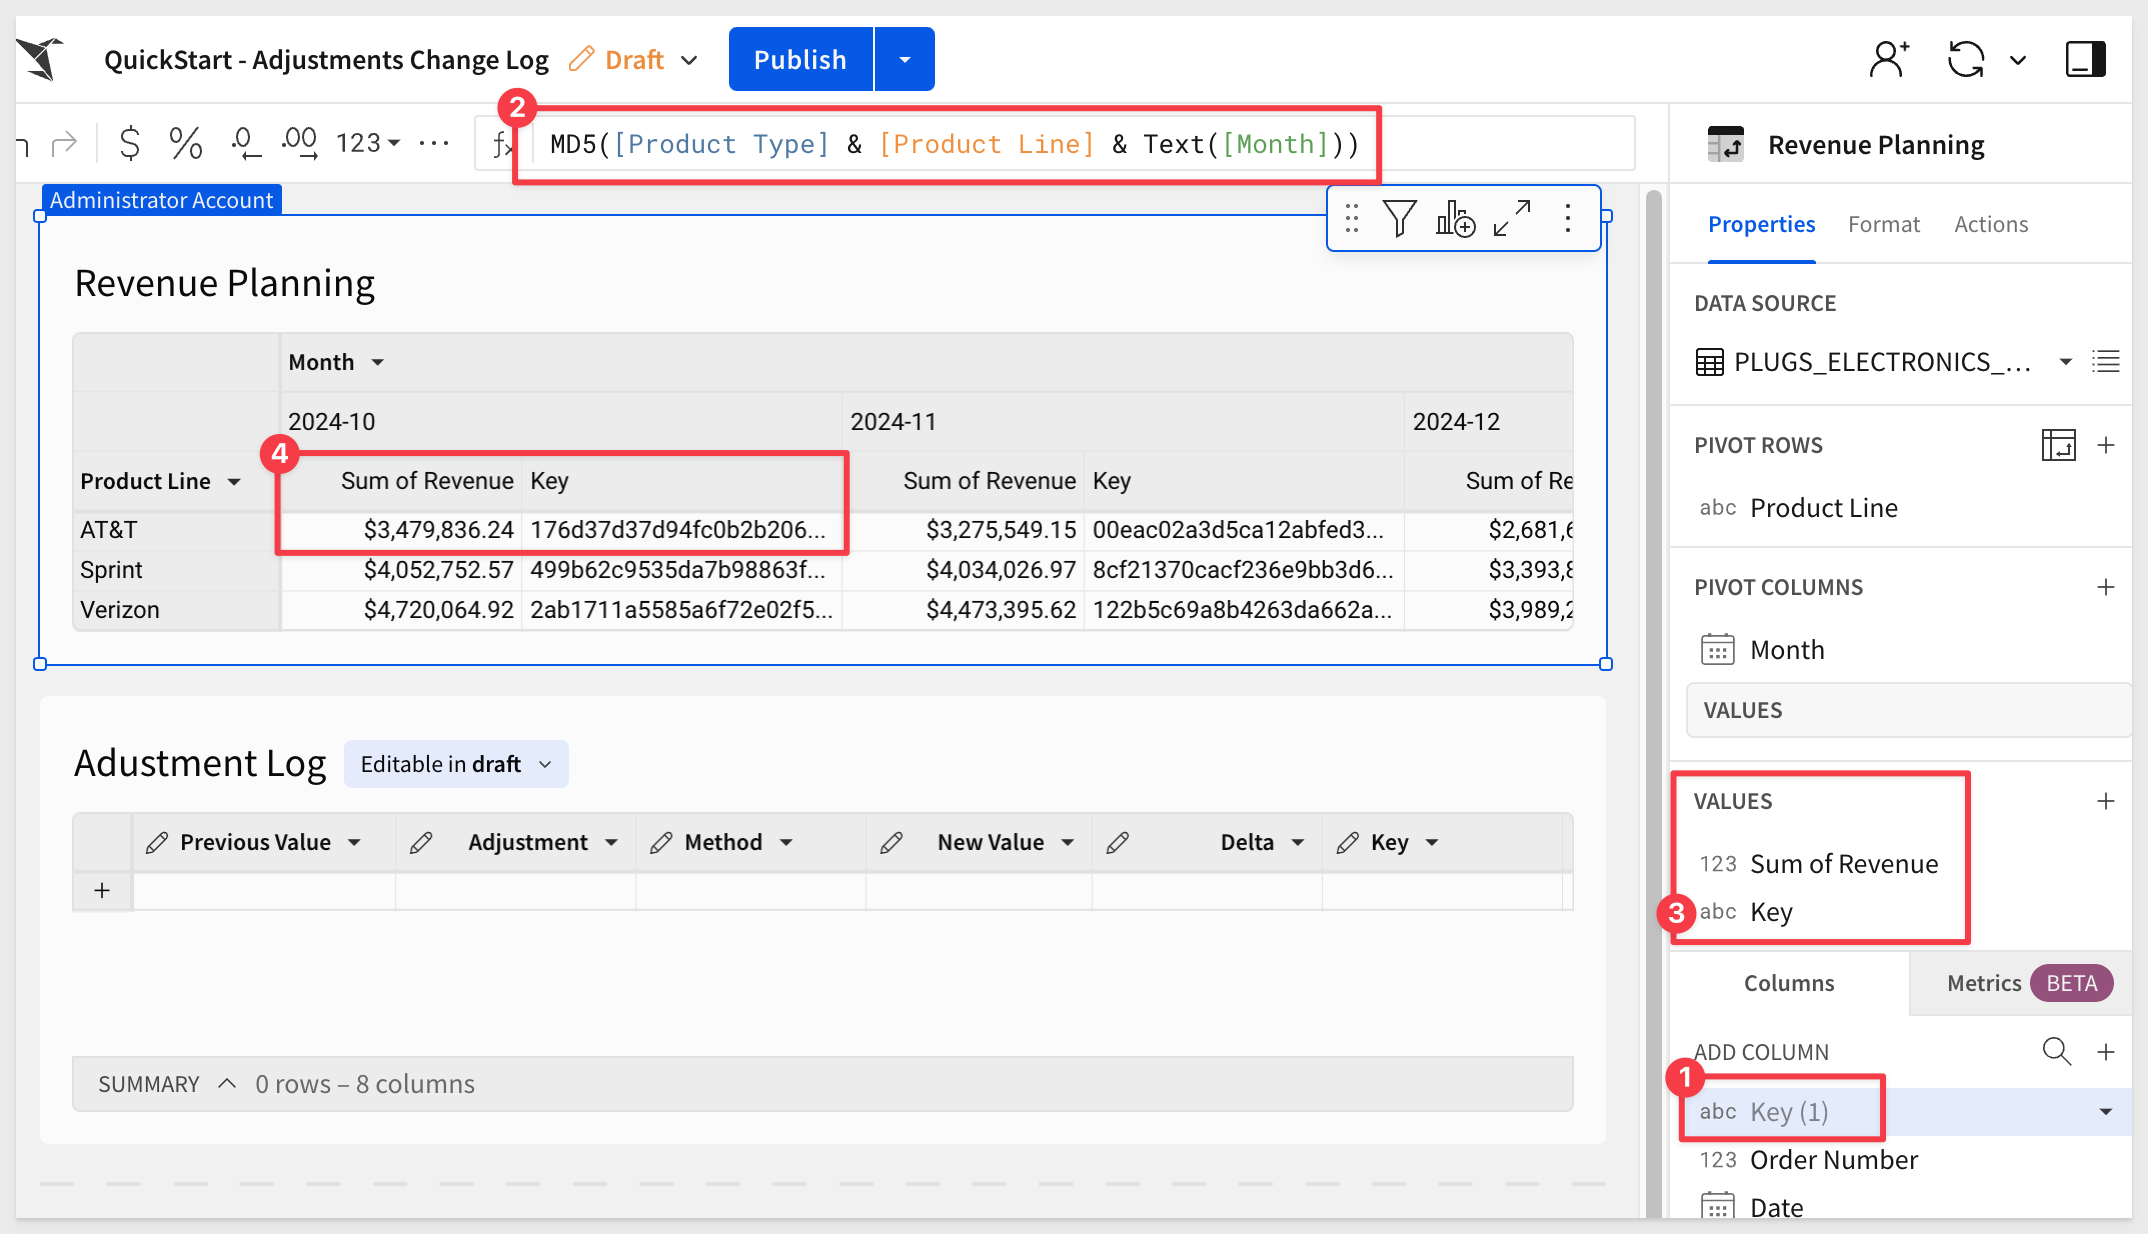
In order to uniquely identify which cell a user has clicked, we will add a column renamed to Key, and set its formula to:
MD5([Product Type] & [Product Line] & Text([Month]))
Remove the Count aggregation from Key.
Drag the Key column to the VALUES grouping and the result will be that for each Sum of Revenue value, there is a corresponding unique key.
Leave the Key in the VALUES grouping but set it to Hidden. We want to be able to reference it, but we don't need to actually see it here.
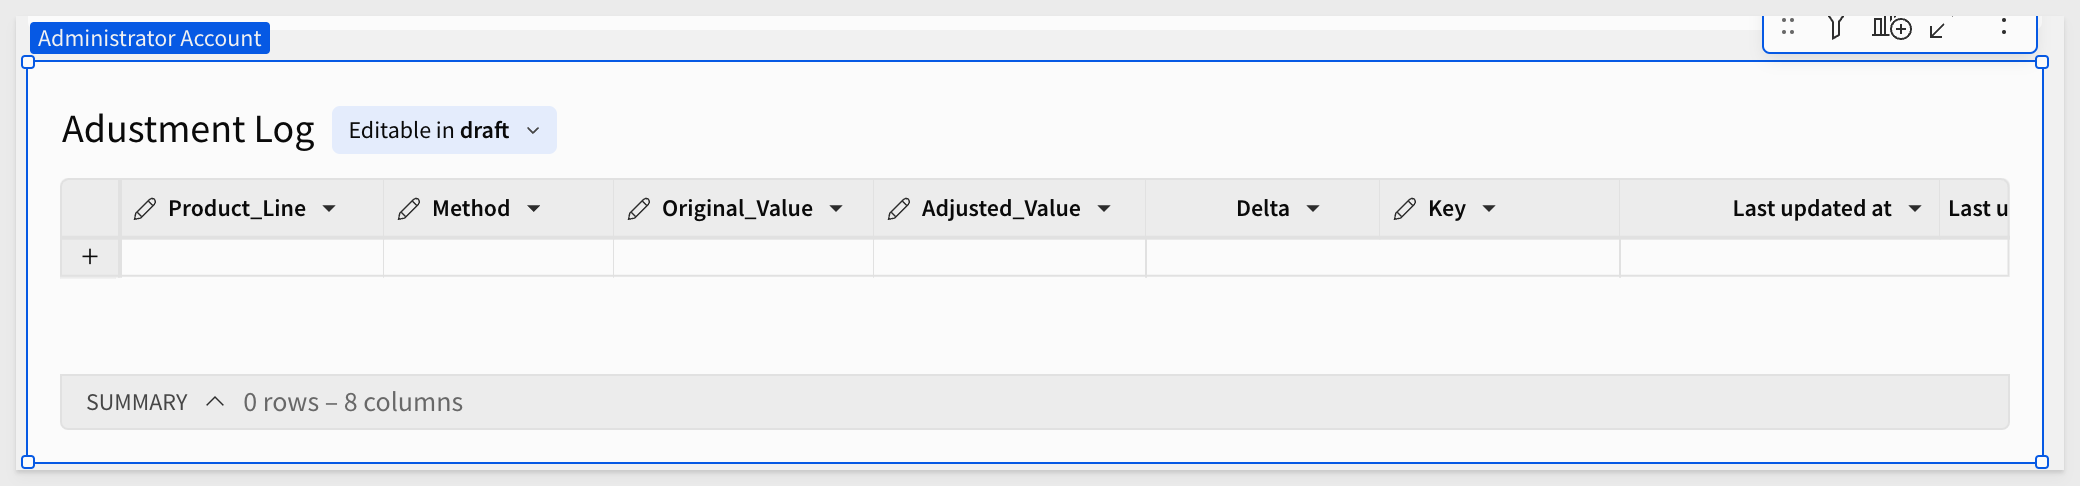
Add a Input > Empty input table under the Revenue Planning table.
Set the source connection to the Sigma Sample Database.
Add and name the following columns:
Name                Type
Product_Line        Text
Original_Value      Number
Method              Text
Adjusted_Value      Number
Delta               Add as a Caculation column
Key                 Text
Set the formula for Delta to:
[Adjusted_Value] - [Original_Value]
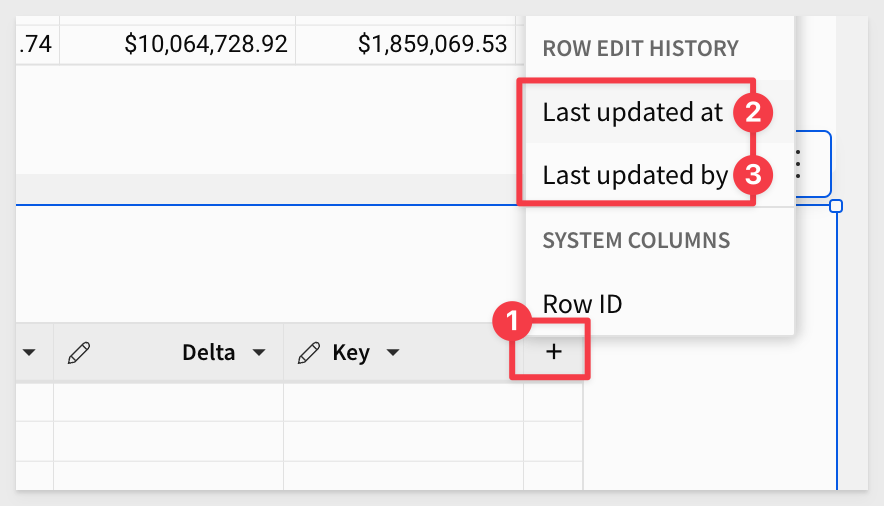
Also add the Sigma supplied columns for Last updated atand Last updated by:
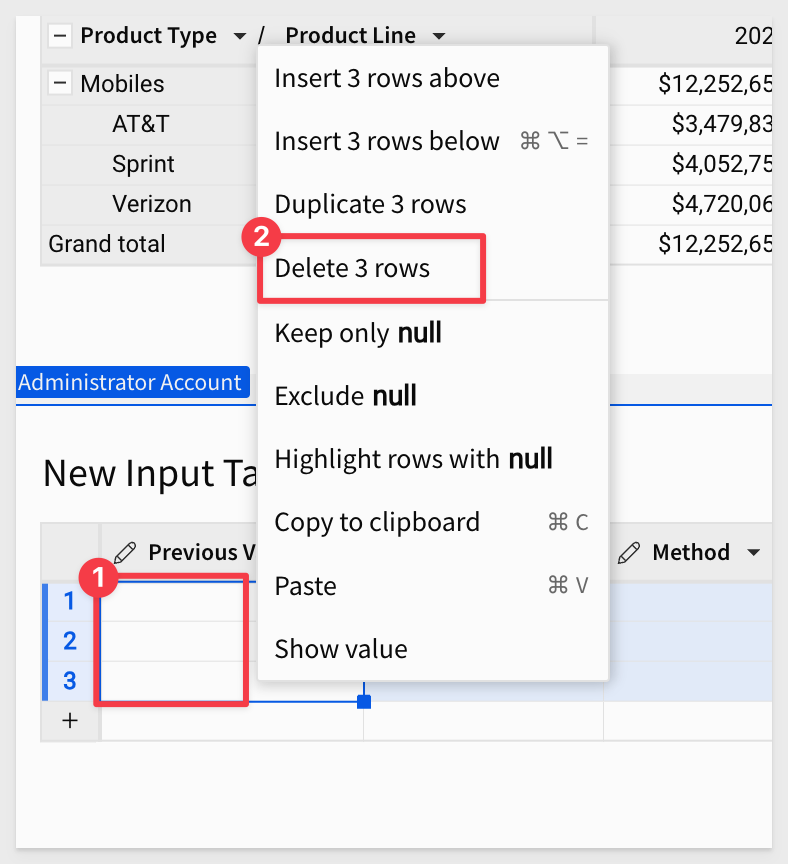
If you happen to create some blank rows, it is simple to delete them:
Rename the input table to Adjustment Log.
With the basic framework in place, we can configure some actions and create a modal (page) to allow users to input adjustments and save them.
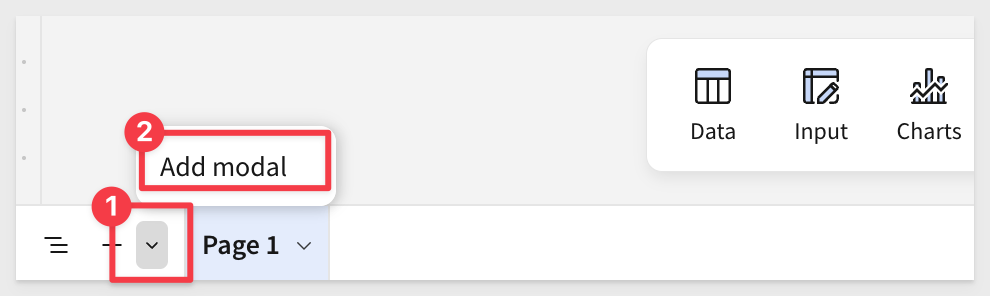
Add a modal
Add a modal from the lower left corner of the page:
Rename the modal page to Adjustments and change it's title to Adjustments too.
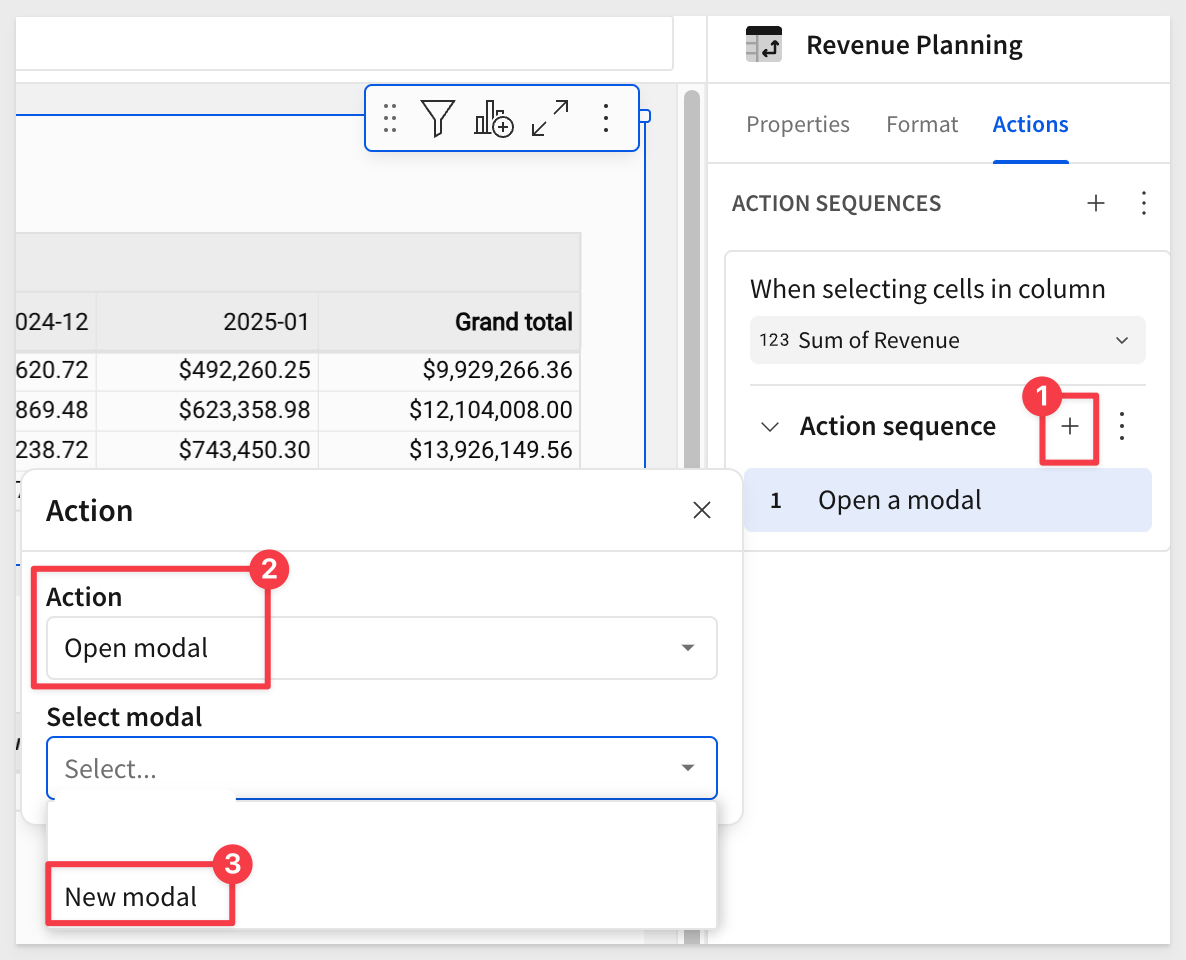
Once that change is made, return the table, open the Actions tab and click the + to add another action.
We need to change the value in the When selecting cells in column to be Sum of revenue, since that is the column in the Revenue Planning table that we want users to click.
Add an new action to the existing Action sequence and set the action to Open modal and select the New modal:
Adding Controls to the Modal
To support the required passing of user selected values, we will use a few Sigma controls on the modal.
Once the controls are in place, we will return to creating some actions to control the passing of values to them.
On the Adjustments modal, add the following controls and text elements.
Control Elements
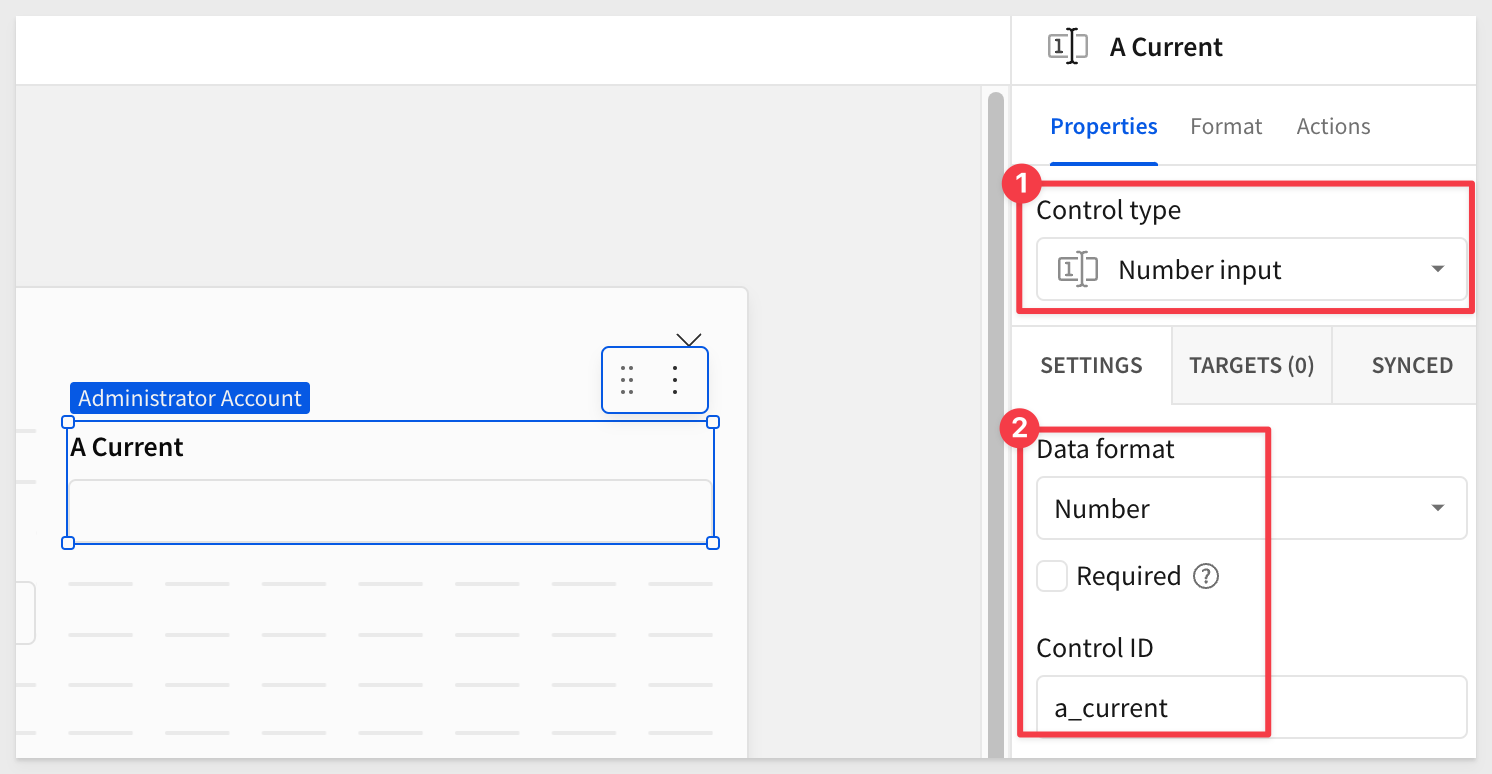
Selected value - a_current
Add a Controls > Number input control and set the Control ID to a_current. Also set the Data format to Currency.
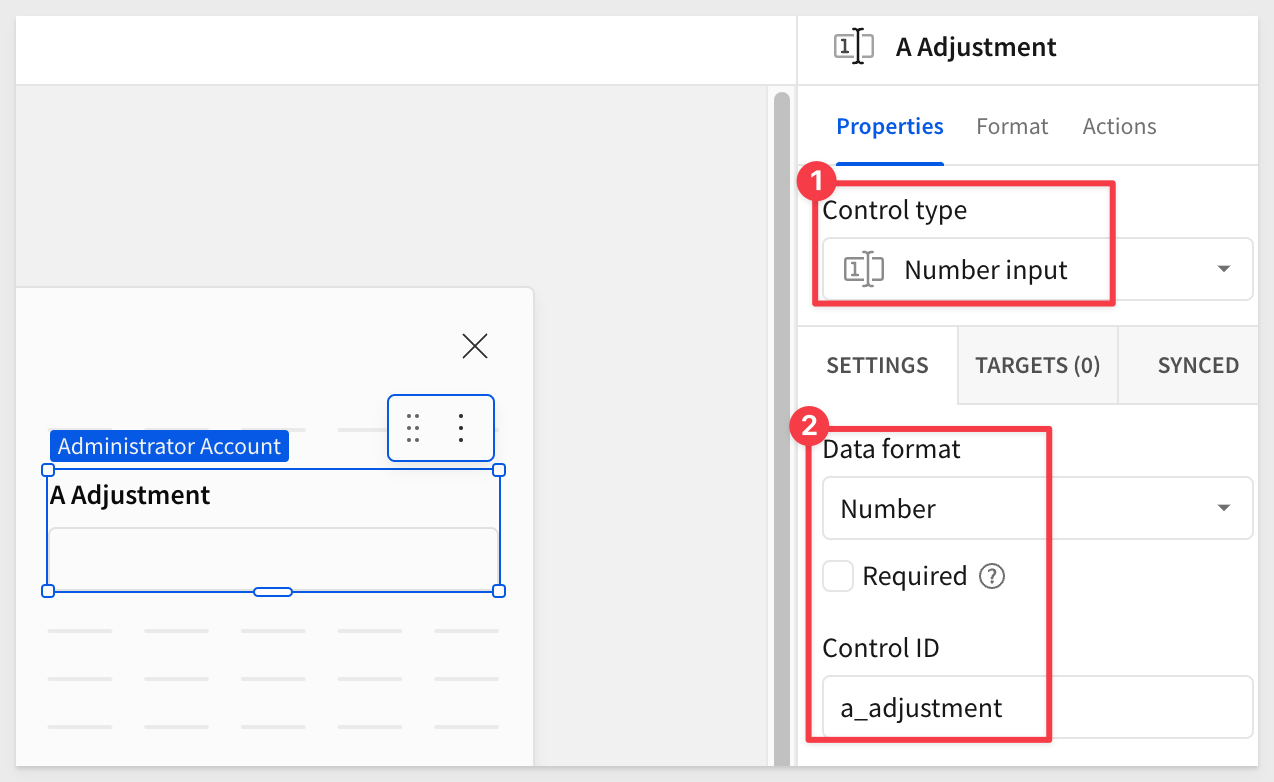
Desired Adjustment - a_adjustment
Add a Controls > Number input control and set the Control ID to a_adjustment. Also set the Data format to Number.
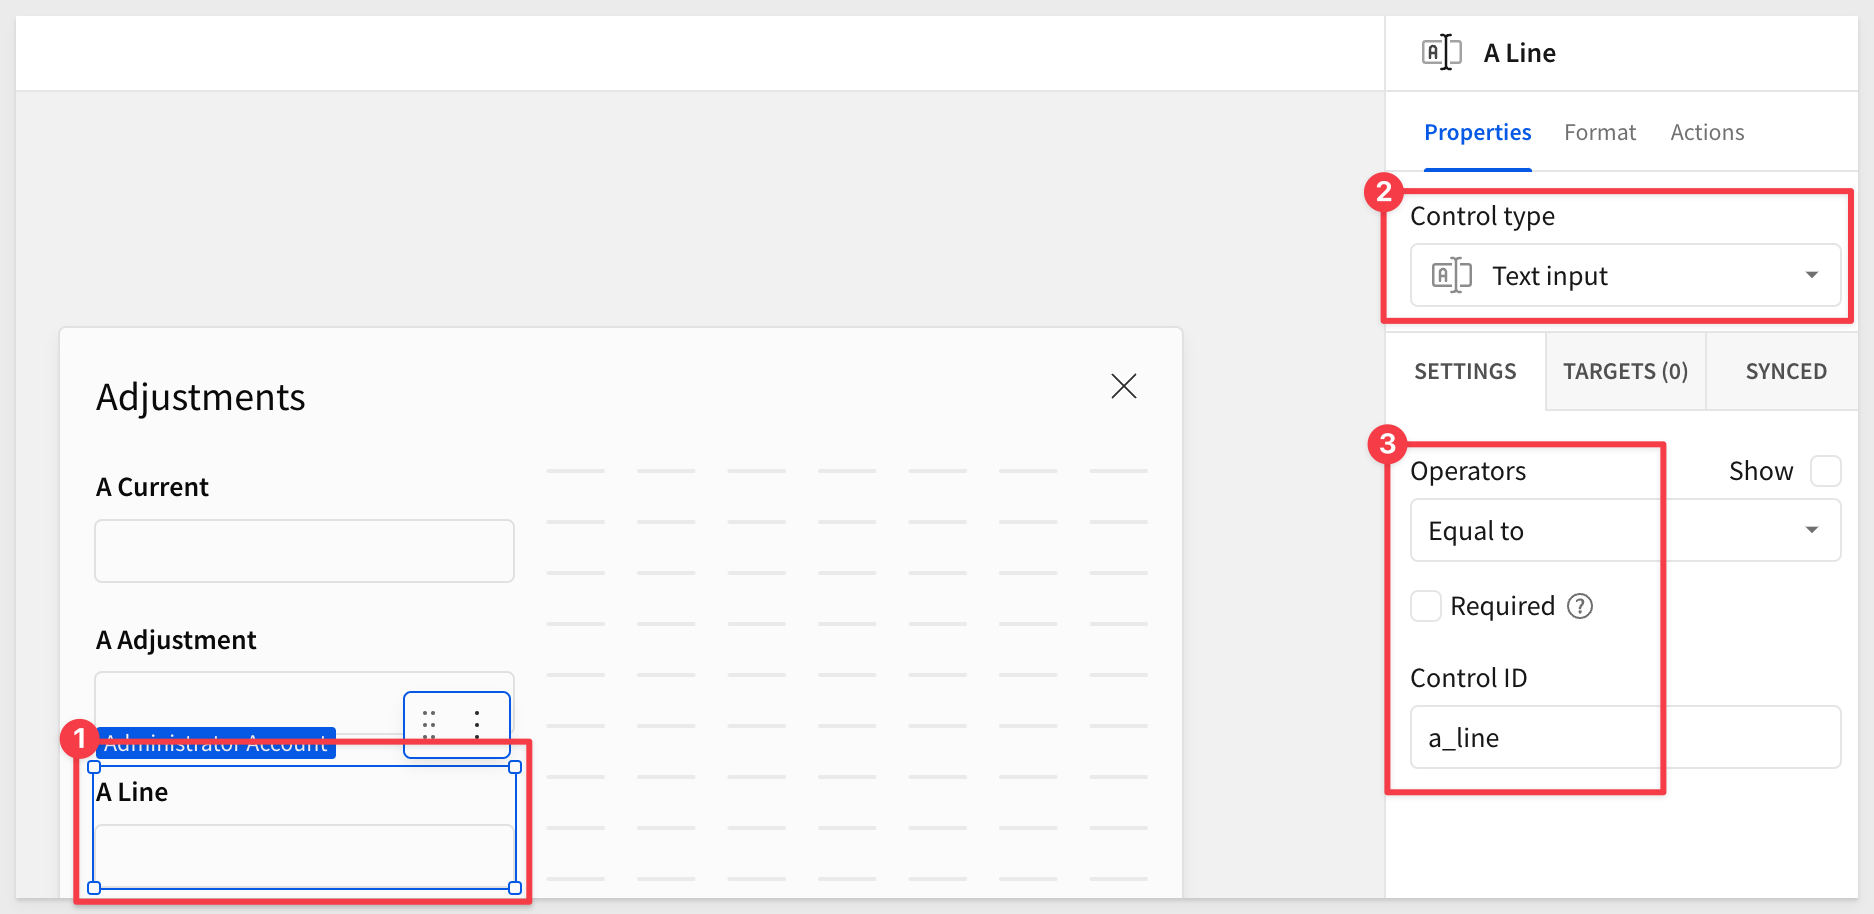
Product Line - a_line
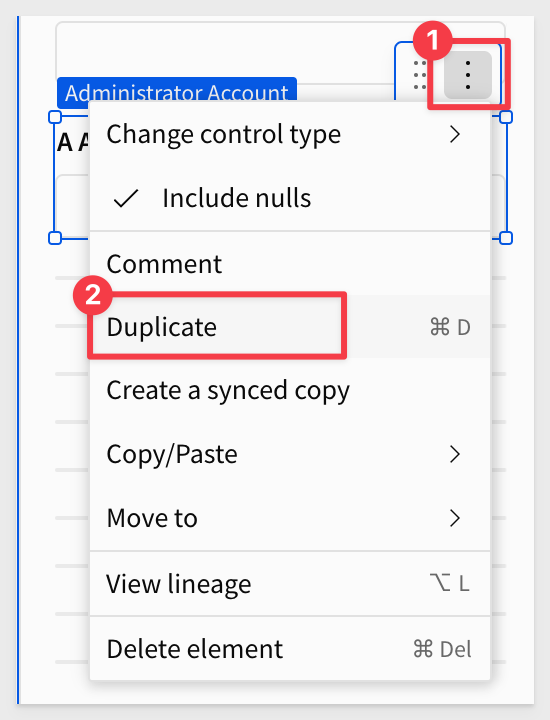
You can also duplicate existing controls and edit them as required for the product line (a_line), but make sure the Control type is set as required when duplicating from different control types.
Product Type - a_date
Add a Controls > Date control and set the Control ID to a_date.
Product Type - a_key
Add a Controls > Text input control and set the Control ID to a_key.
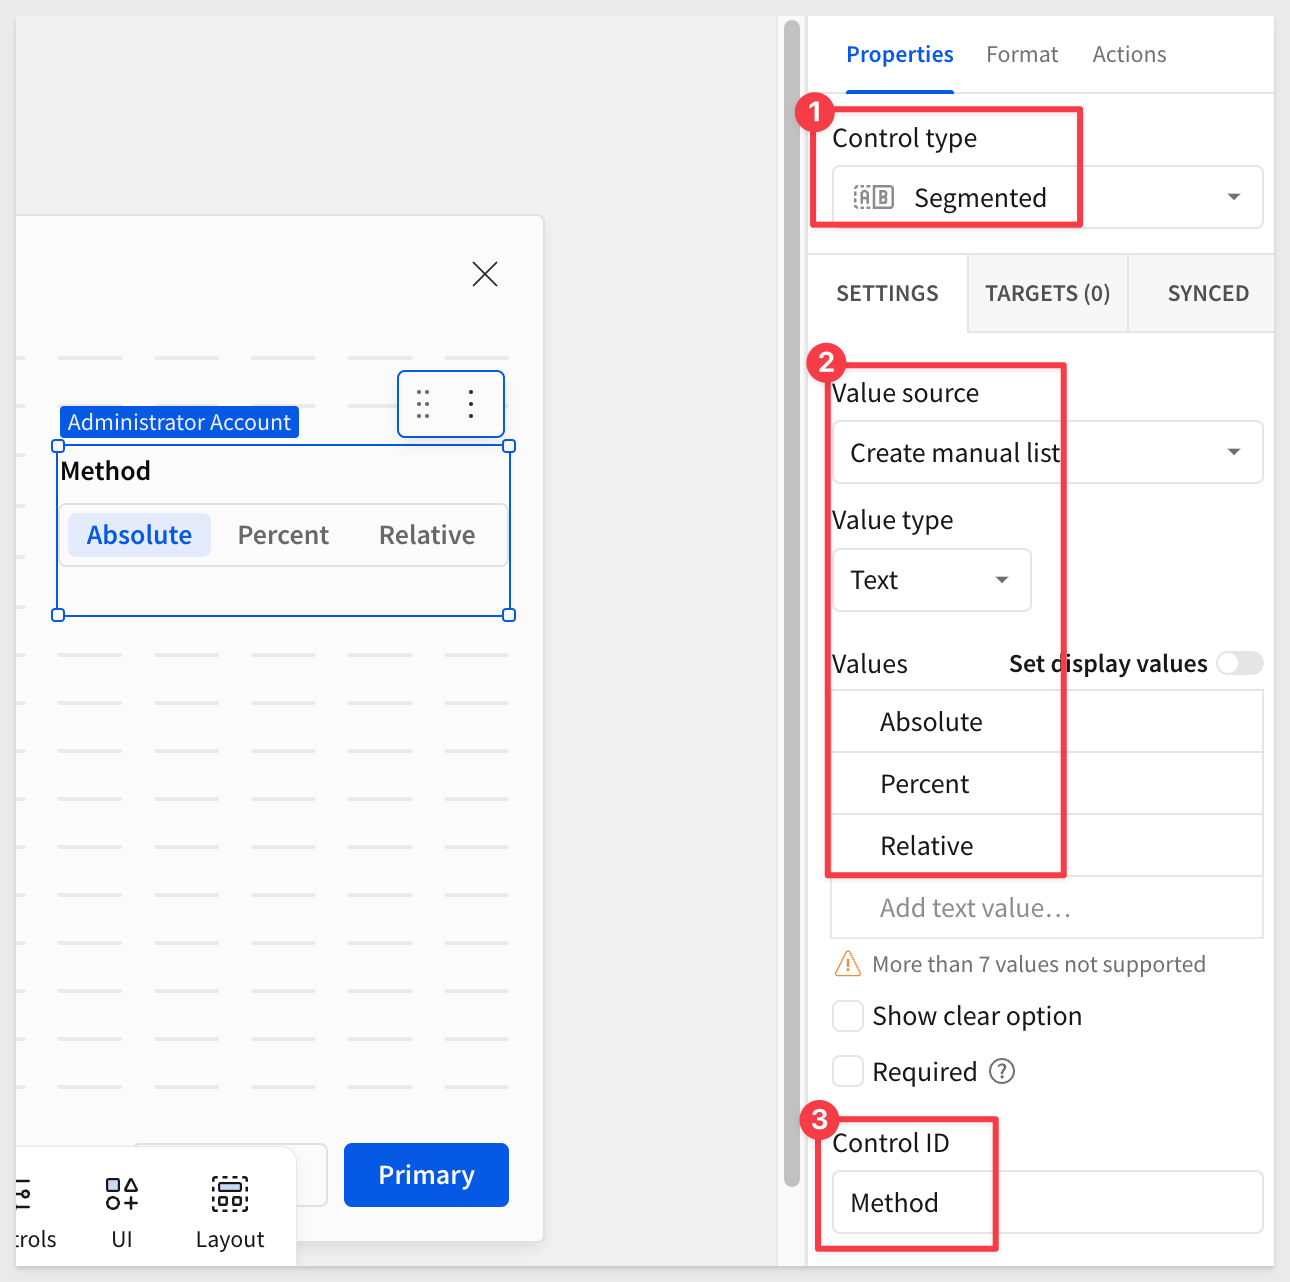
Method
Add a Controls > Segmented control and set the Control ID to Method. Set the Value source to Create manual list with these values:
Absolute
Percent
Relative
Calculated Adjustment
Add a UI > Text element and set its formula to:
Coalesce(
    Switch(
        [Method],
        "Percent", [a_current] * (1 + [a_adjustment] / 100),
        "Absolute", [a_adjustment],
        "Relative", [a_current] + [a_adjustment]
    ),
    0
)
The value normally would resolve to Null but using Coalesce will convert that to zero.
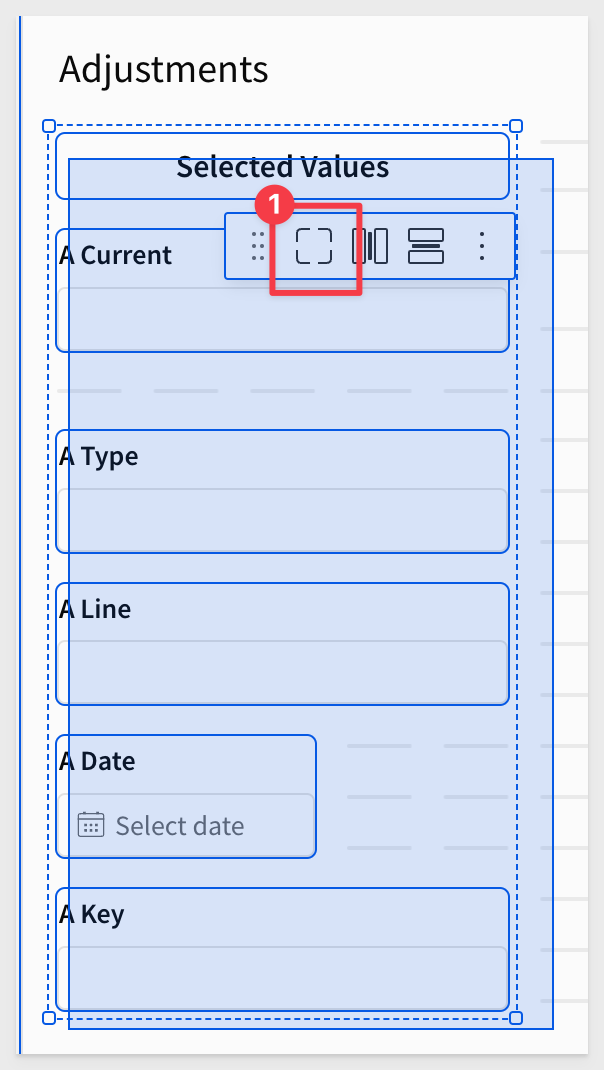
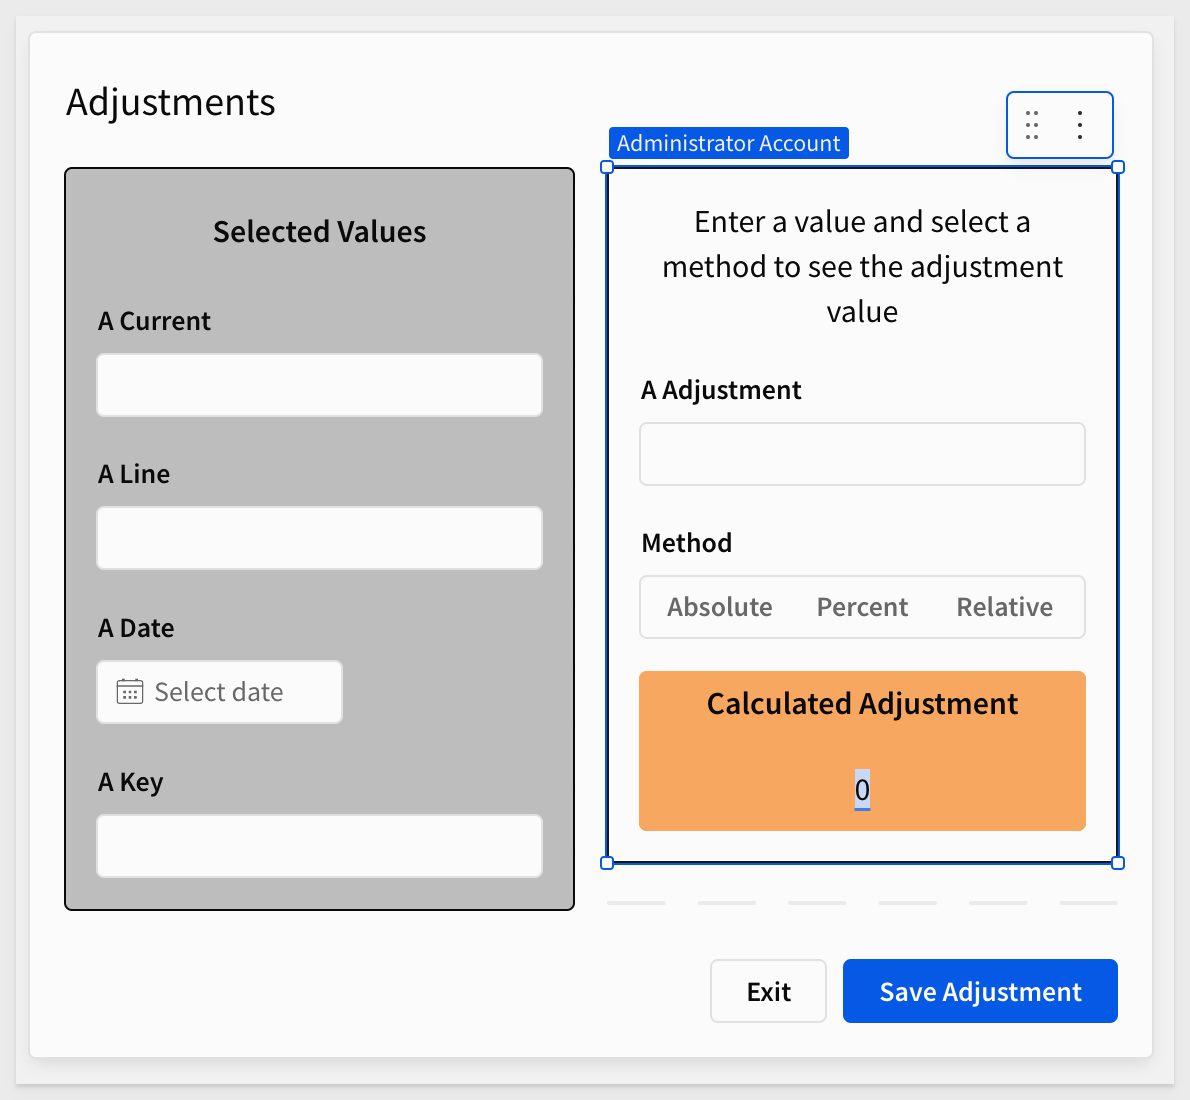
Now that we have all the elements on the modal, we can take a moment to clean up the appearance, rearranging, placing elements into containers and styling to suit:
Place the elements that are considered part of a Selected values grouping together in a container and rename the container Selected values.
Do the same for the elements that are part of a grouping that the user would use to create an adjustment, also renaming the second container to Adjustment value.
After placing some items in containers, adding some text elements and light styling, the modal looks like this:
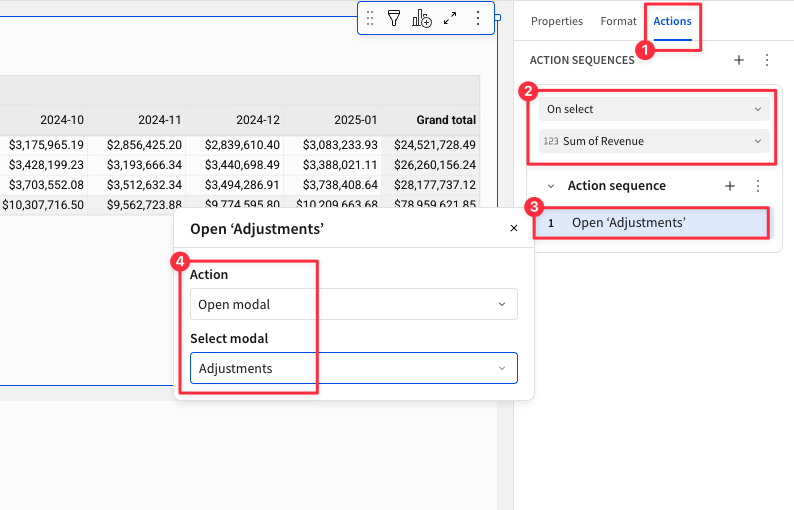
Return the the Home page and select the Revenue Planning table and open its action menu.
Make sure that the existing Open modal action is set to open the Adjustments modal:
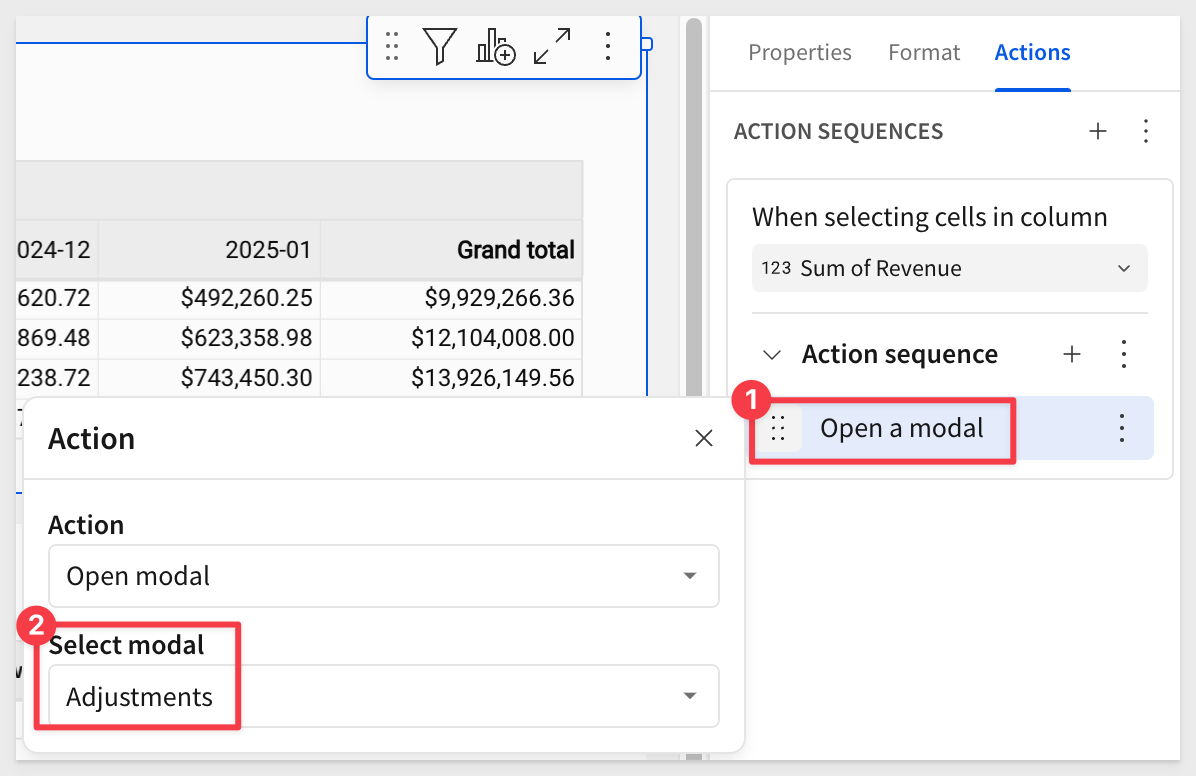
At this point if we click on any value in the Revenue Planning pivot table, the modal will appear.
However, we need to still configure other actions to pass the required values, based on the cell the user selects.
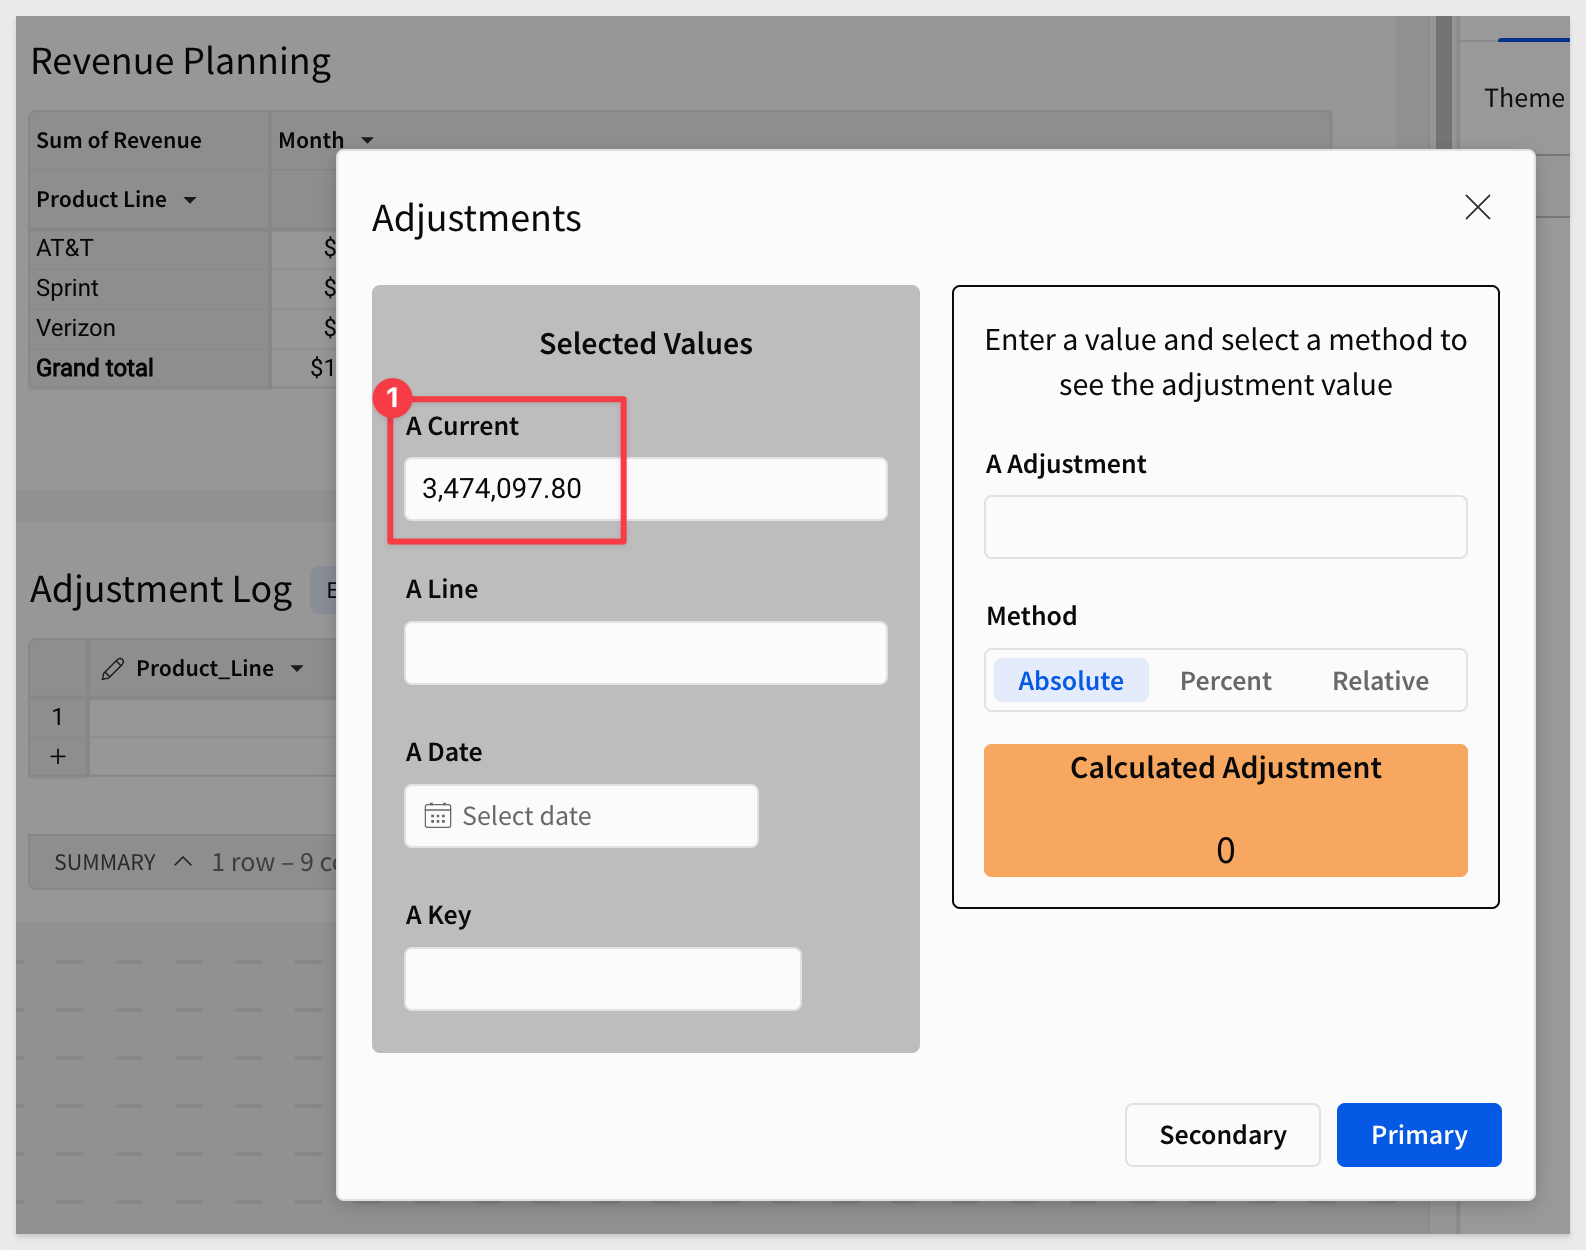
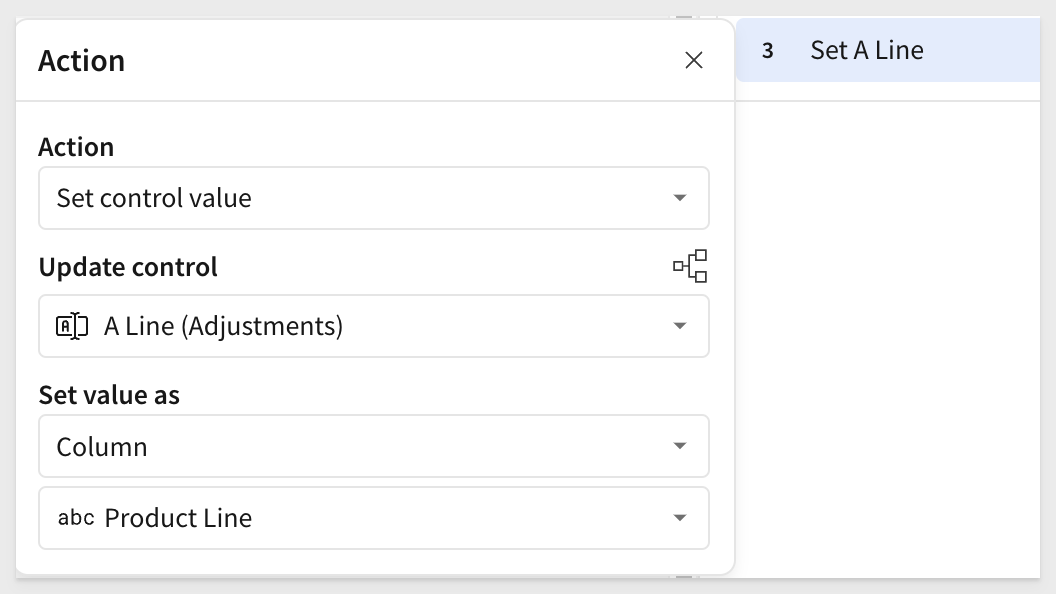
Add another action and set it to pass the value the user has selected from the Sum of Revenue column to the A Current control:
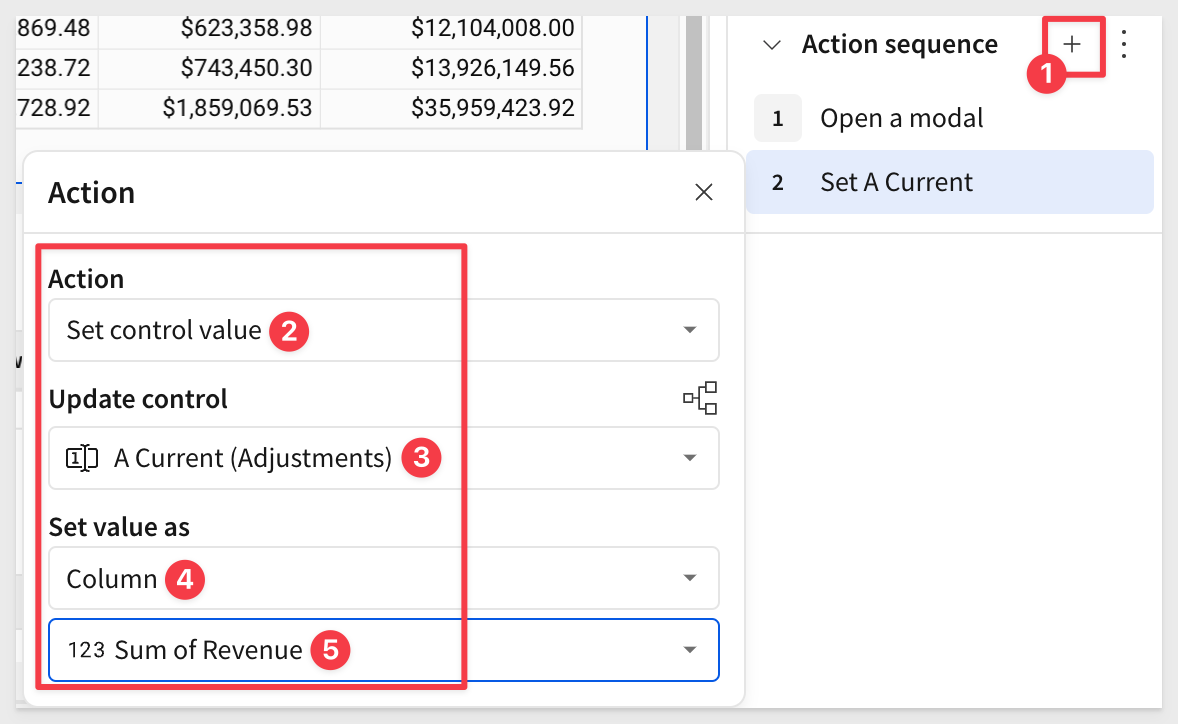
Now if we click a cell, the value is passed to the modal as expected:
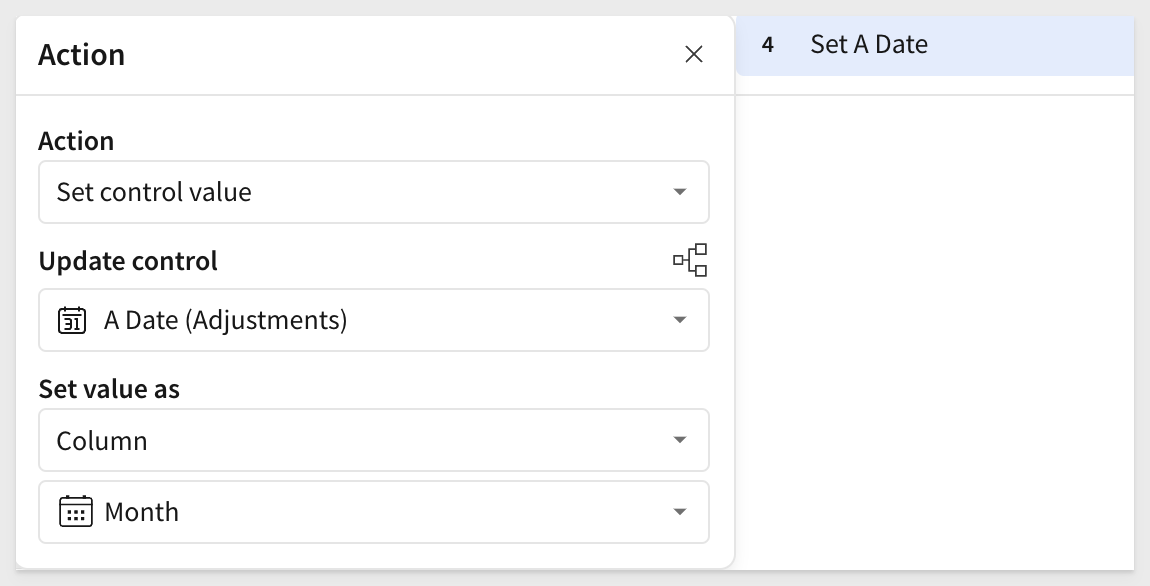
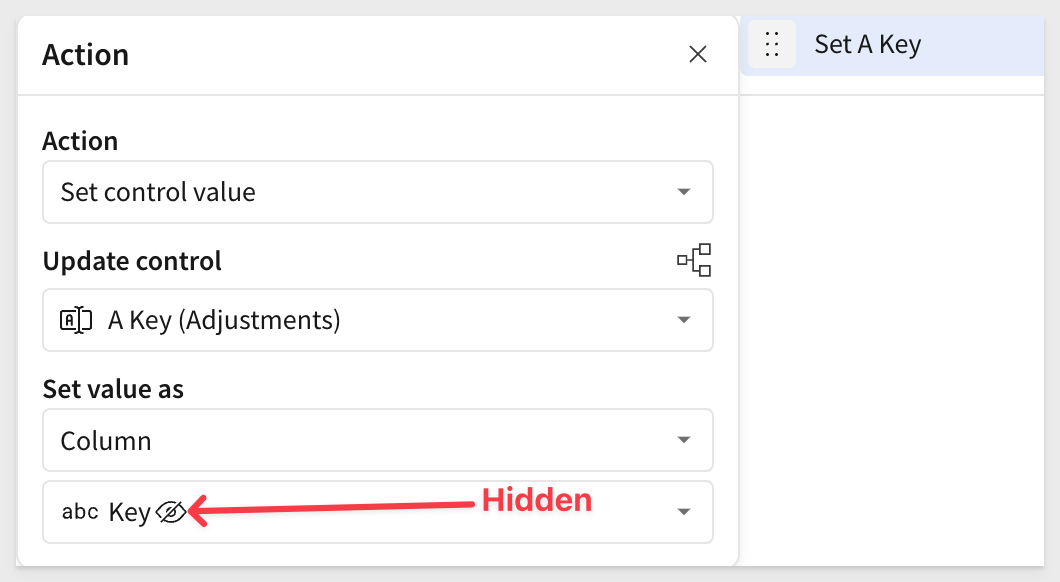
We simply need to add more Set control value actions for each element on the modal we want to pass data to.
Product Line
Month (Date)
Key
Give it a test
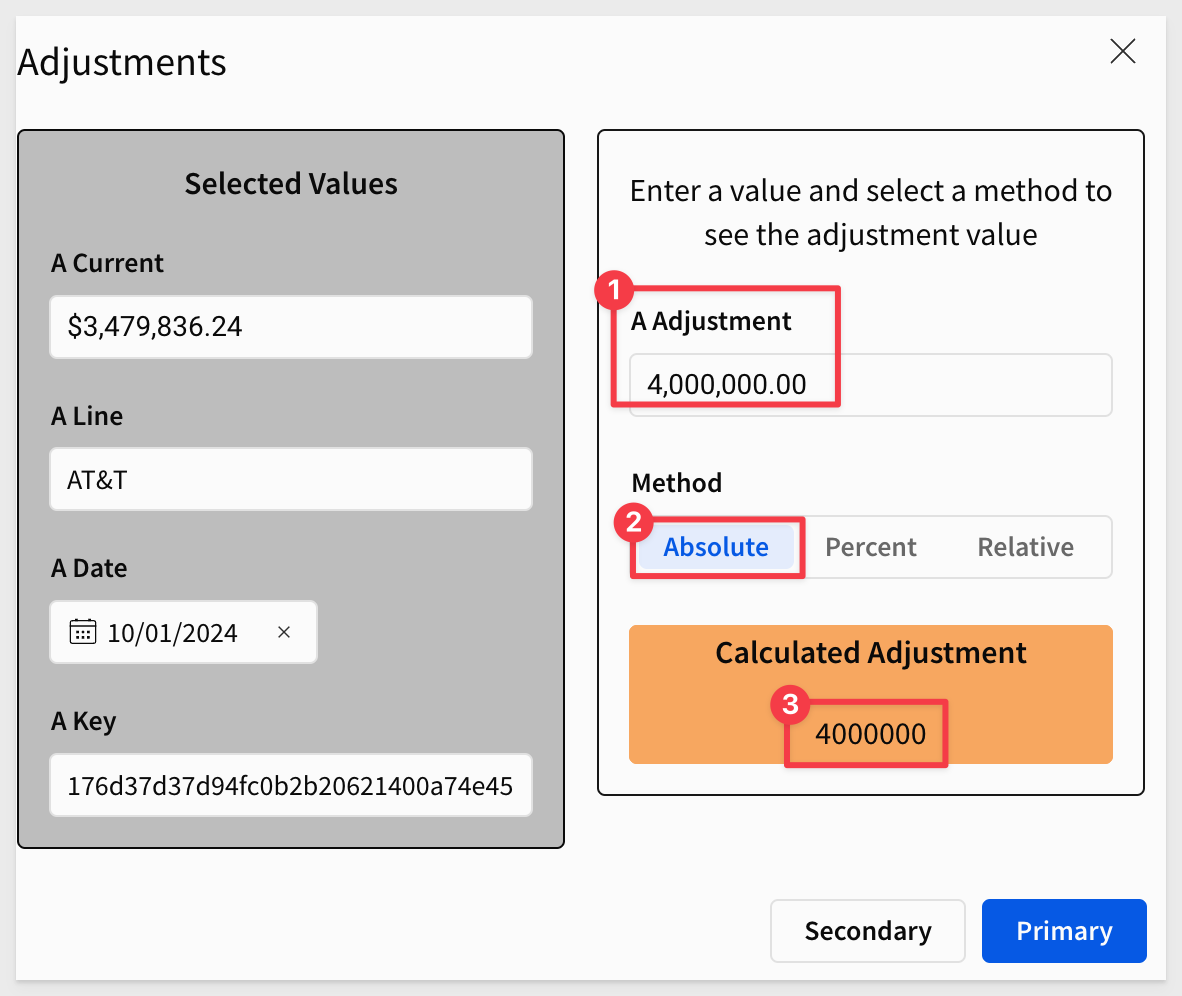
Clicking a value in the Revenue Planning workbook, entering a value in A Adjustment and clicking Absolute should produce a calculated adjustment:
Now we need to configure some actions on the modals footer buttons (Secondary and Primary) to exit or save the adjustment.
On the Adjustments modal page, uncheck the Show close icon and configure the text to appear on each footer button:
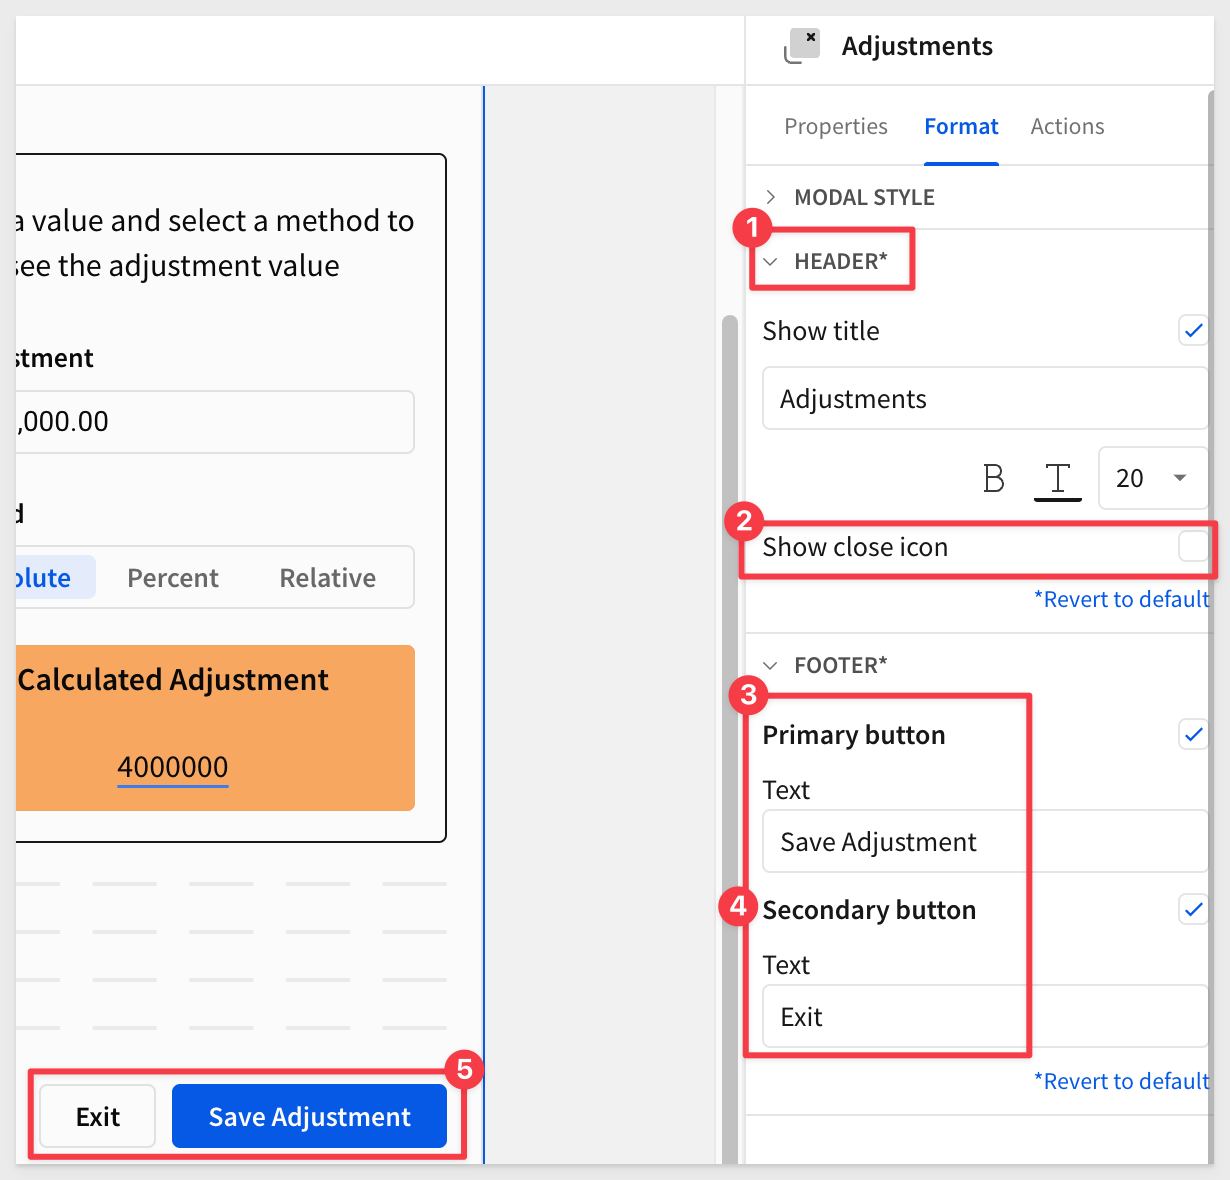
Secondary button (Exit)
Moving to the Actions menu now.
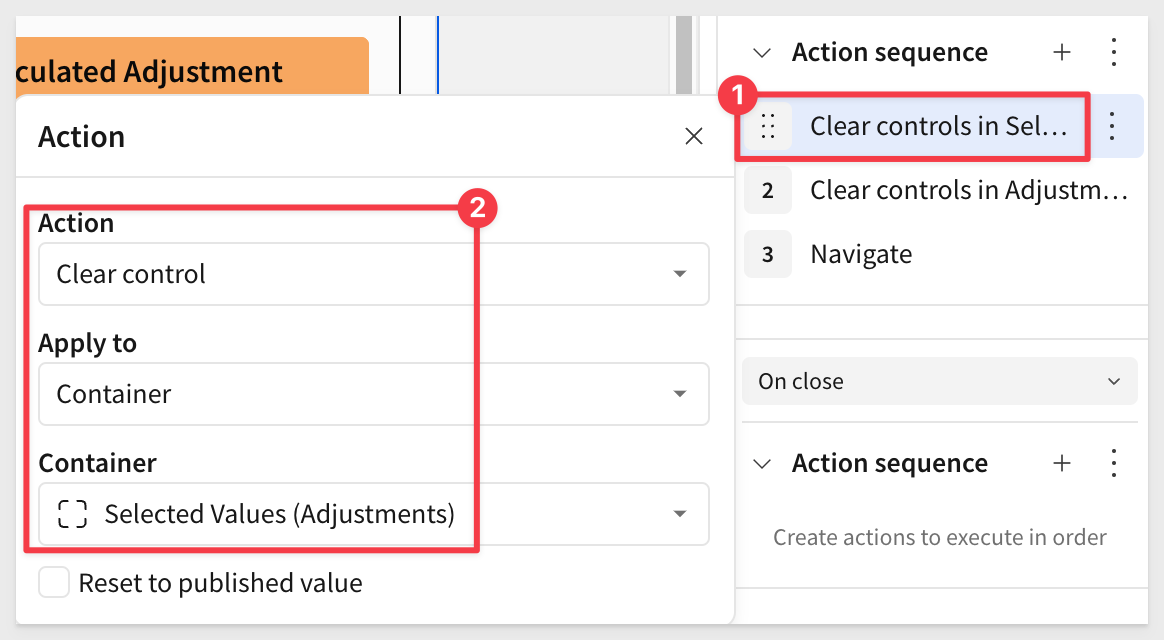
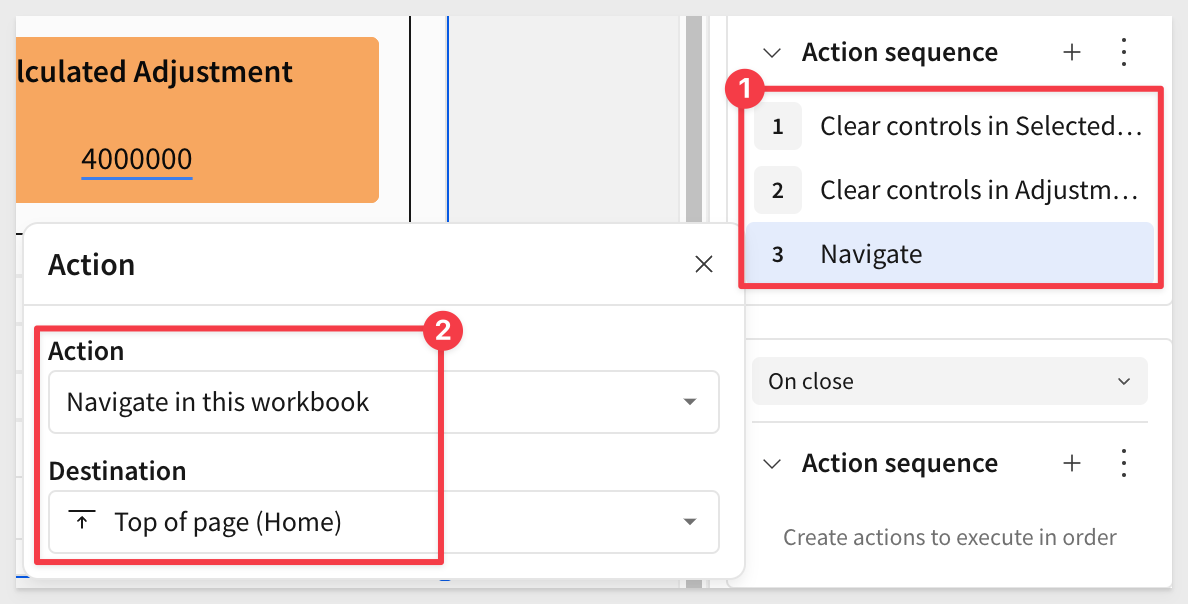
On the On click - secondary action, add three actions, two to clear the modals containers and one to navigate back Home:
Primary button (Save Adjustment)
We need to handle this button a bit different to account for things that might happen.
For example, if the user does not enter a value for A Adjustment but clicks Save, what should happen?
To handle this Sigma provides Action Sequences and Action conditions
First, we will handle the case where A Adjustment is left empty.
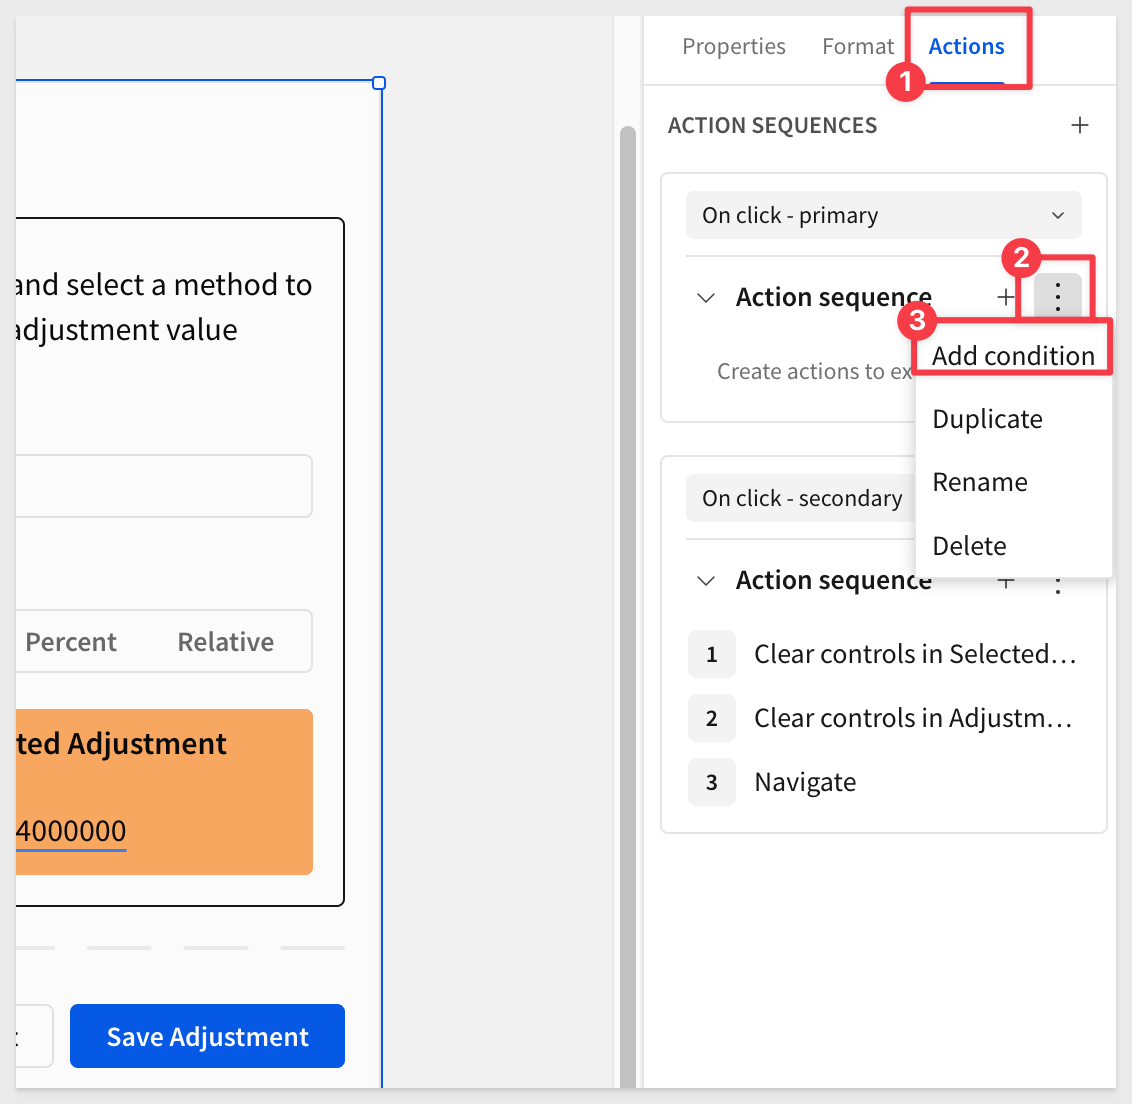
Still on the modal, open its Actions menu.
Click as shown in the screenshot below and select Add condition:
Select Custom formula and use this formula:
IsNull([a_adjustment])
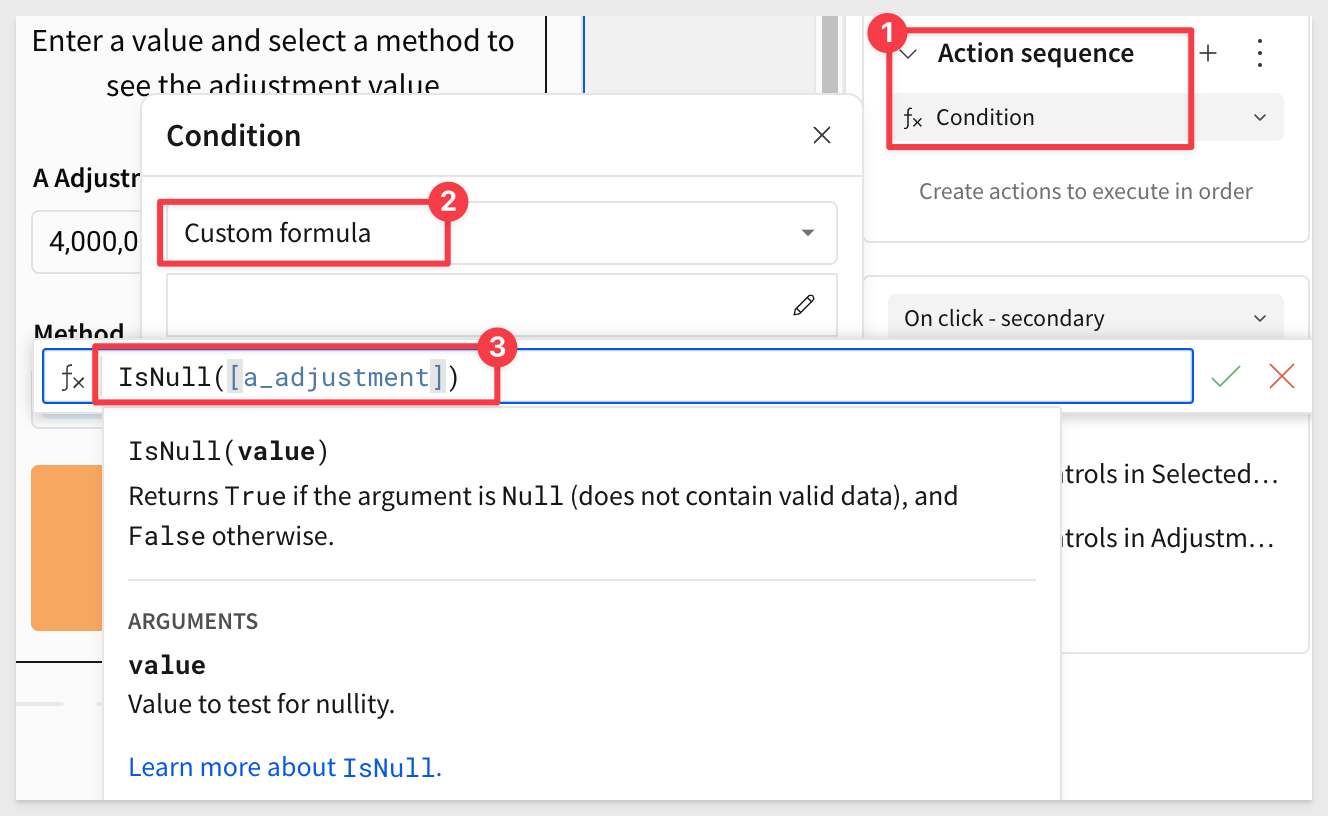
This will check if A Adjustment is empty and if so, process the next action in the sequence.
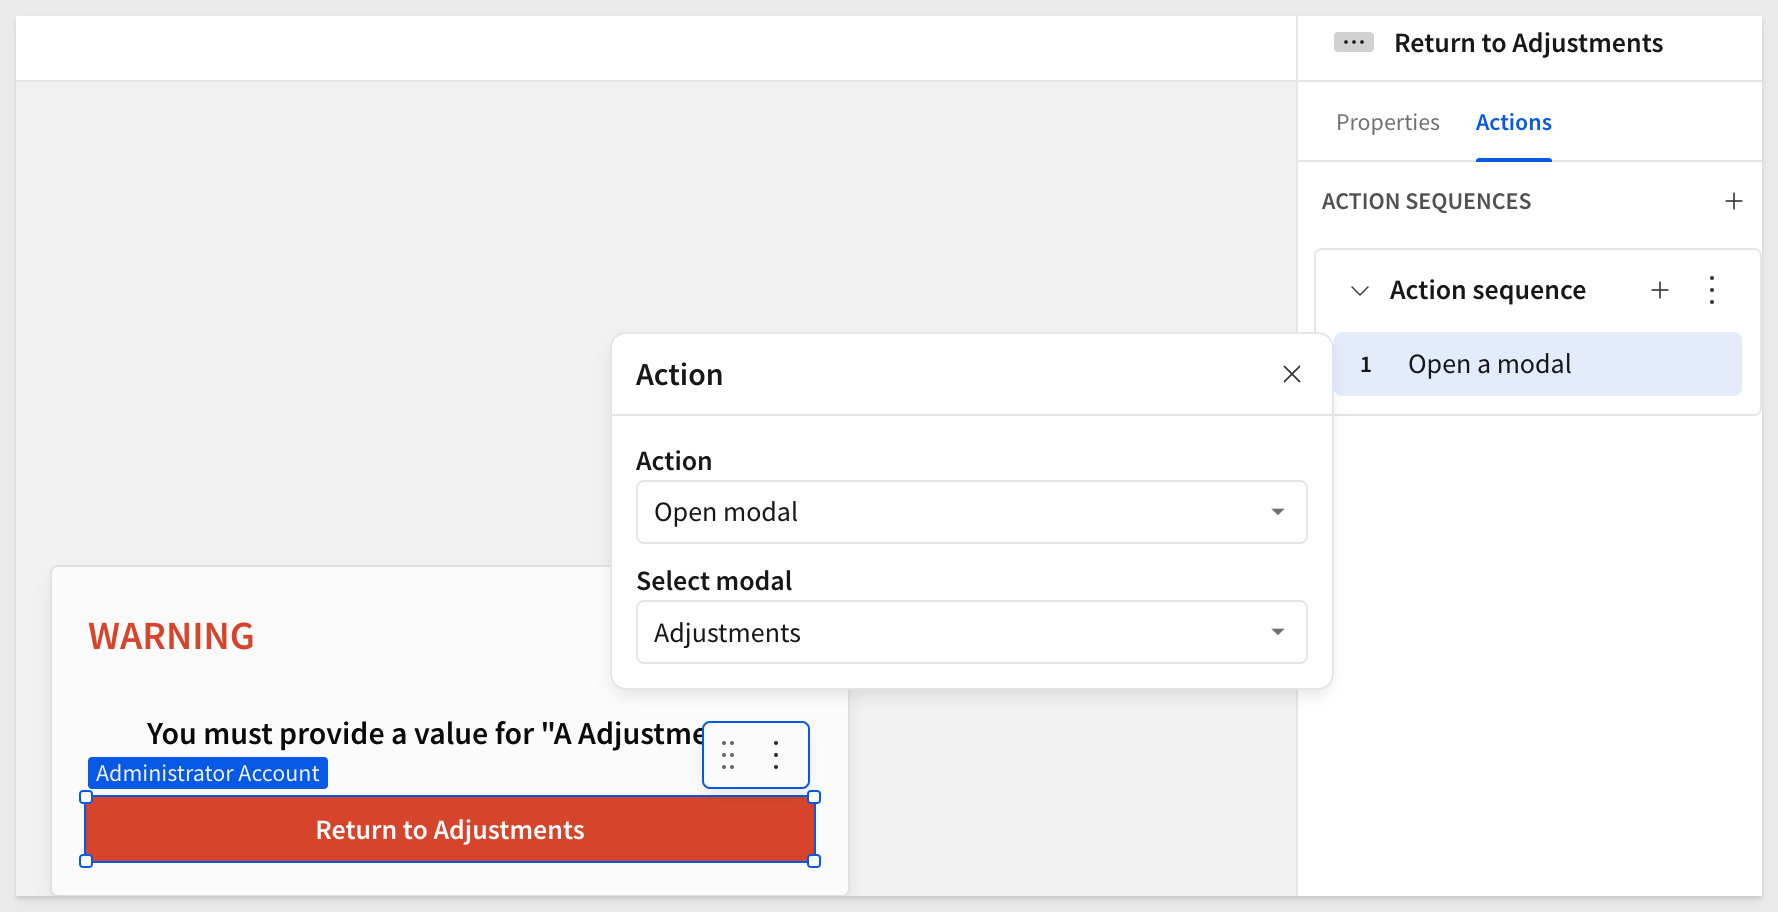
There are few things we could do here to provide feedback to the user. For example, we may want to display another modal with a warning like this:
Add second action sequence
With that out of the way, let's set up recording the adjustment into our Adjustment Log input table.
Create (or duplicate the existing) action sequence (as shown in the screenshot below) and set its condition to execute if there is a value in
IsNotNull([a_adjustment])
Add an Insert a row action and configure it as shown:
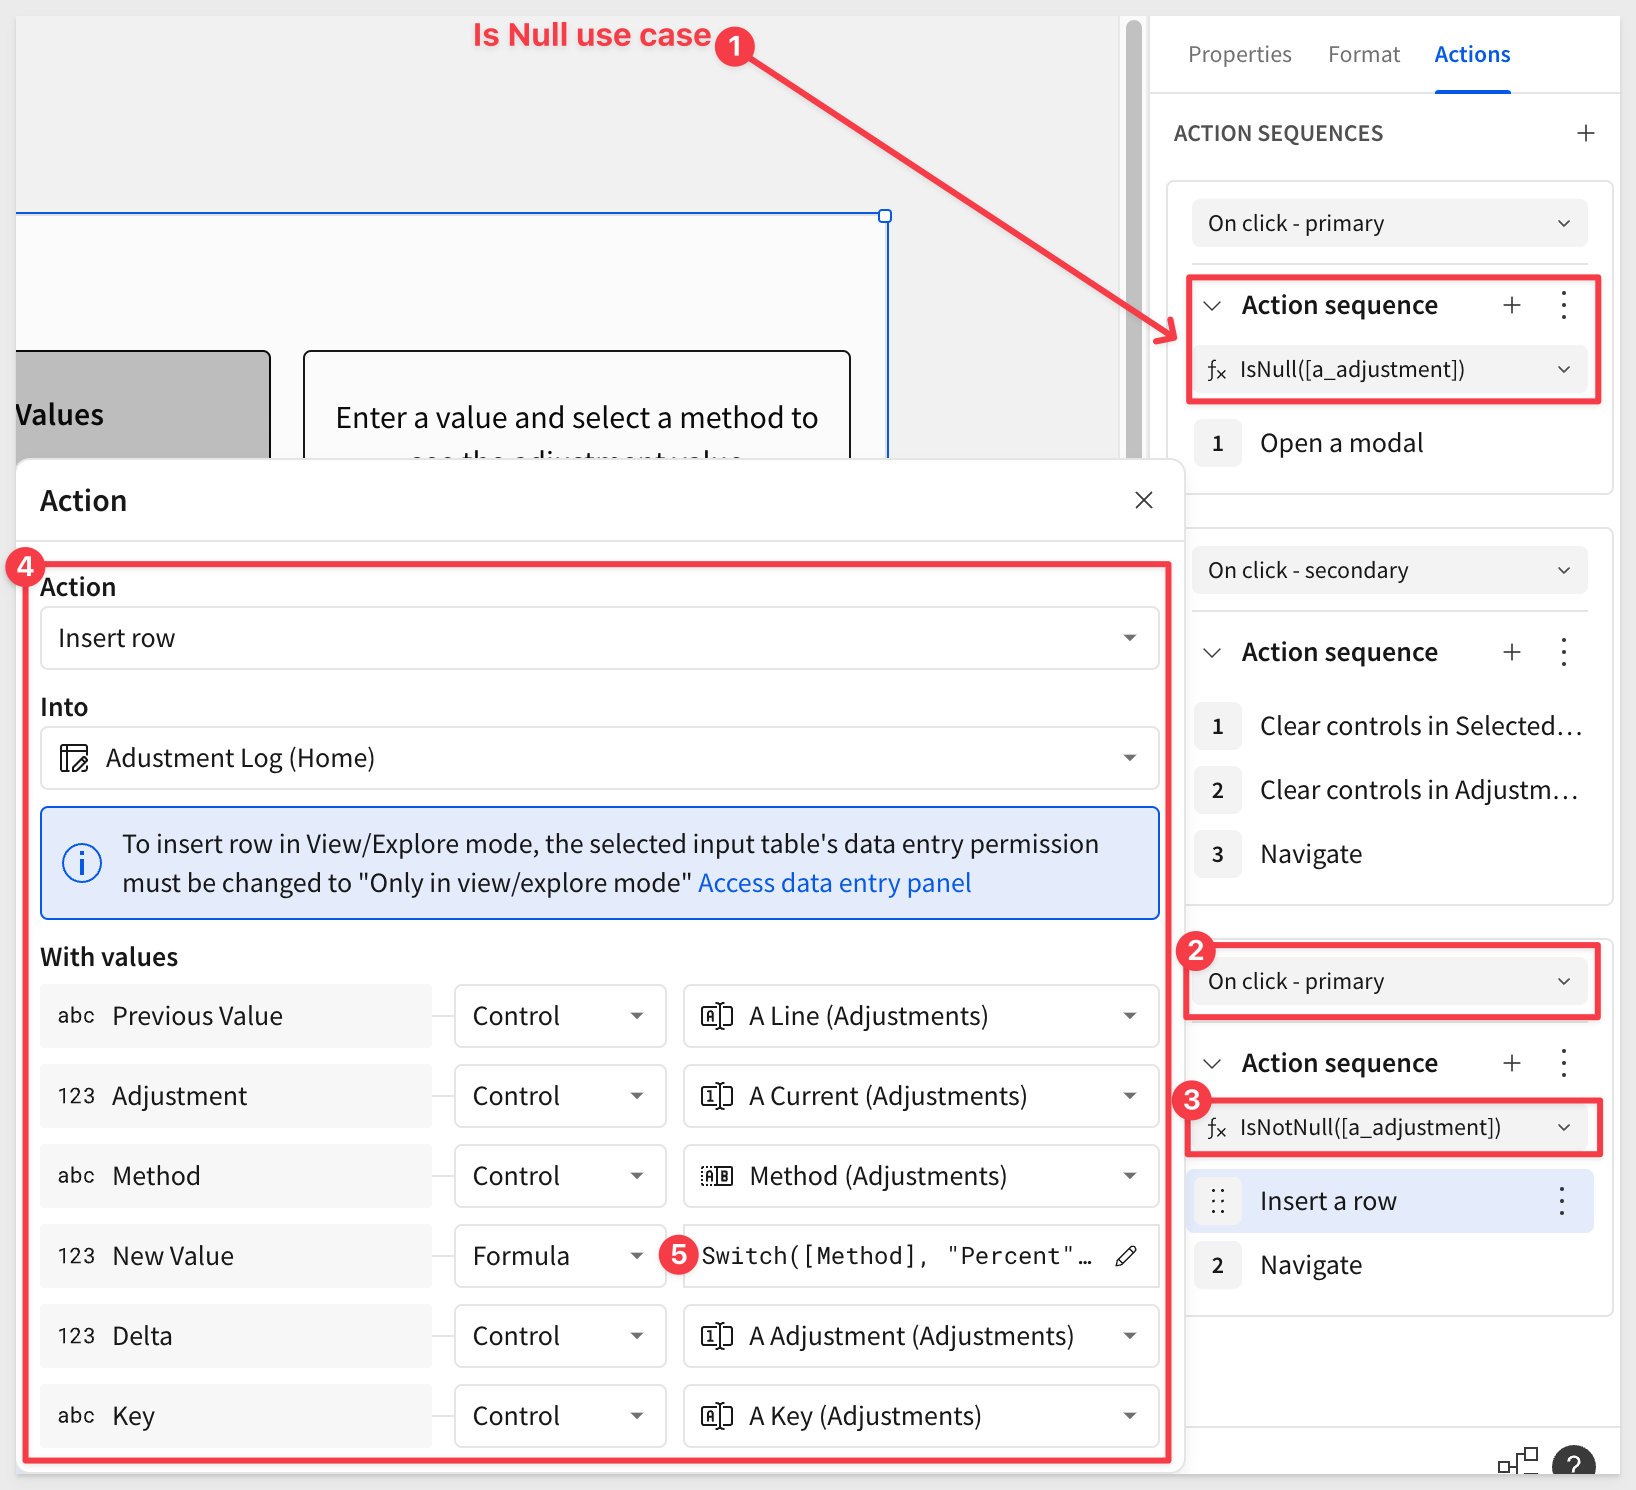
We need to make one change from the defaults for the Adjusted_Value control. For that, we need to pass the value of the final calculation but since that is not in a control for us to just "grab", we have to set a formula instead.
We can just reuse the same formula as the modal already uses to do the adjustment calculation:
Switch([Method], "Percent", [a_current] * (1 + [a_adjustment] / 100), "Absolute", [a_adjustment], "Relative", [a_current] + [a_adjustment])
Add another action to Navigate back to Home.
Click Publish.
Give it a test; does it work? Notice anything in the workflow?
In data apps, testing can and will expose problems and areas where users might get in trouble too.
For example, in testing the first time, it worked fine but on the second pass we noticed that the value for A Adjustment was held over from the first test.
This is easy enough to correct. Let's keep it simple for demonstration.
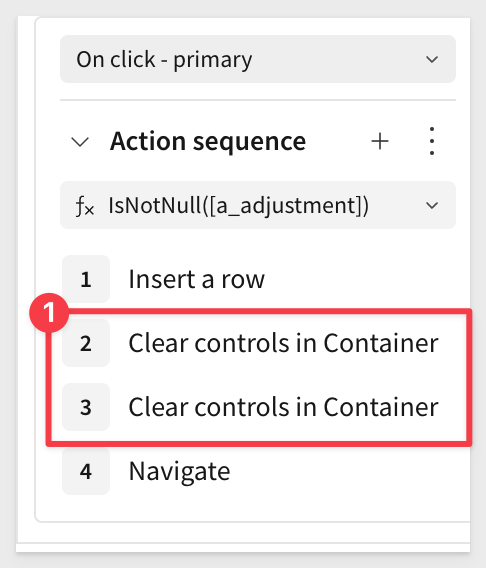
On the Save Adjustment action, we just need to add two actions to clear the values from each container on the Adjustments modal. That will solve it!
Input table governance
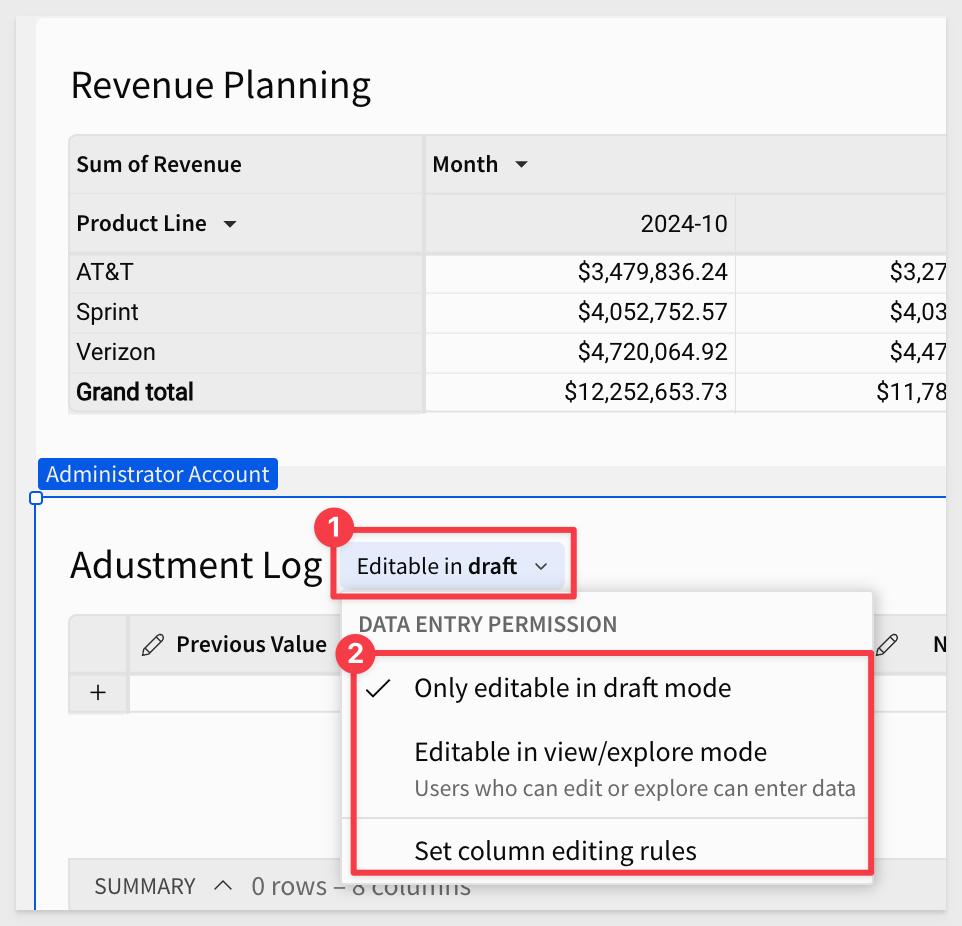
Sigma allows you to preserve data integrity and enhance security in input tables through data validation, column protection, and customizable data entry permissions.
During our configuration and testing work our input table was set to Only editable in draft mode. This is fine for building and testing. However, if we want to test in Published mode, we need to first set the input table to Editable in view/explore mode and also click Publish.
It is fine to switch between modes when we are building. We just want to make sure the functionality is understood.
For more information, see Data governance options in input tables.
Before we start this, delete all the test adjustments you may have made from the Adjustment Log.
We need to determine the most recent adjustment for each Product Line and Month, so we will use the data in the Adjustment Log to accomplish this, without changing the table itself.
Create a child table from the Adjustment Log:
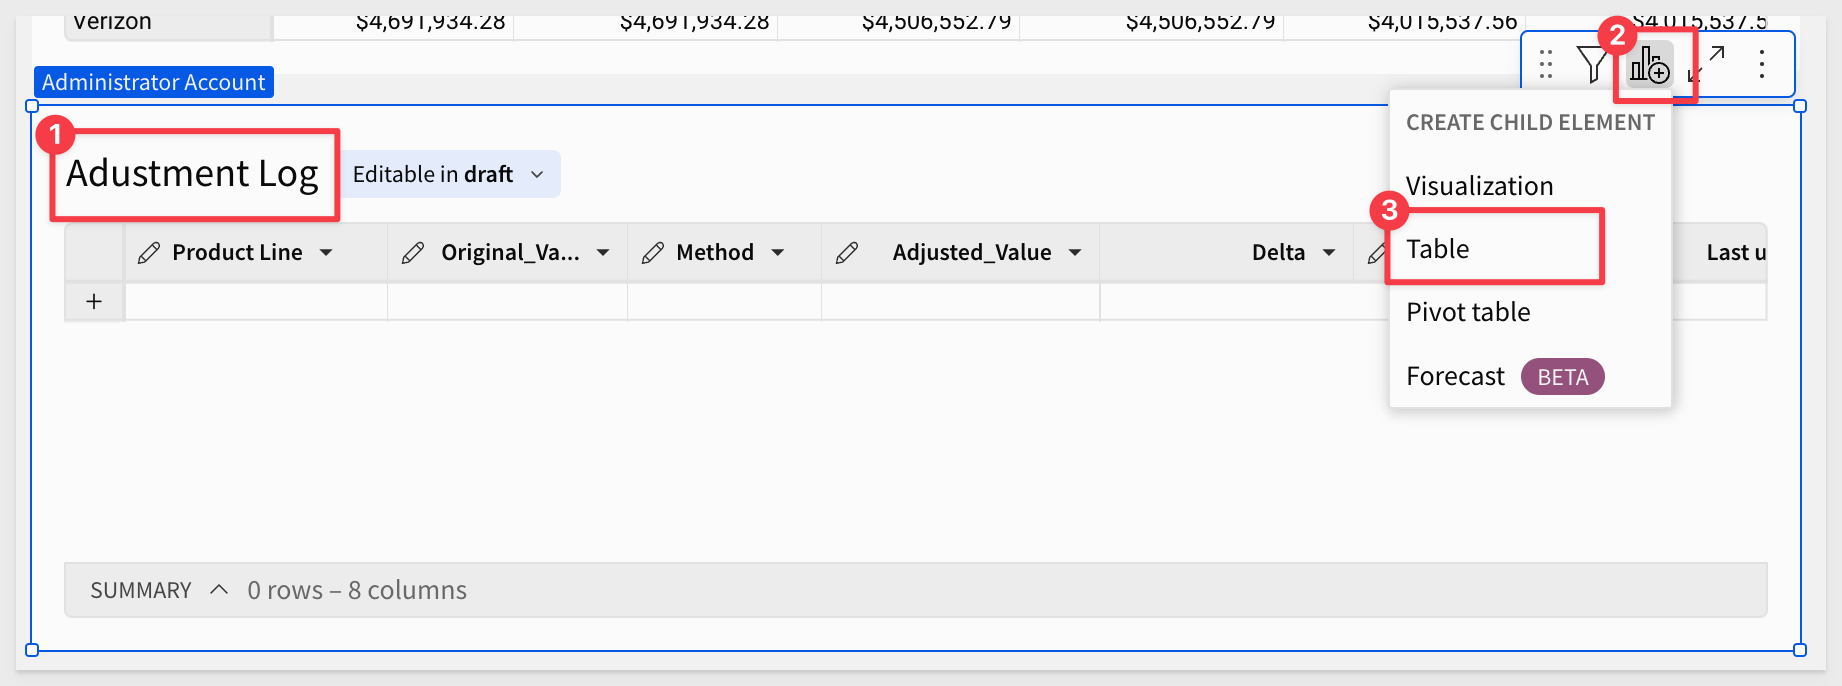
Rename the new table to Most Most Recent Adjustments.
Group the table by the Key column.
Drag Last updated at to the CALCULATIONS grouping and set its aggregation to MAX:
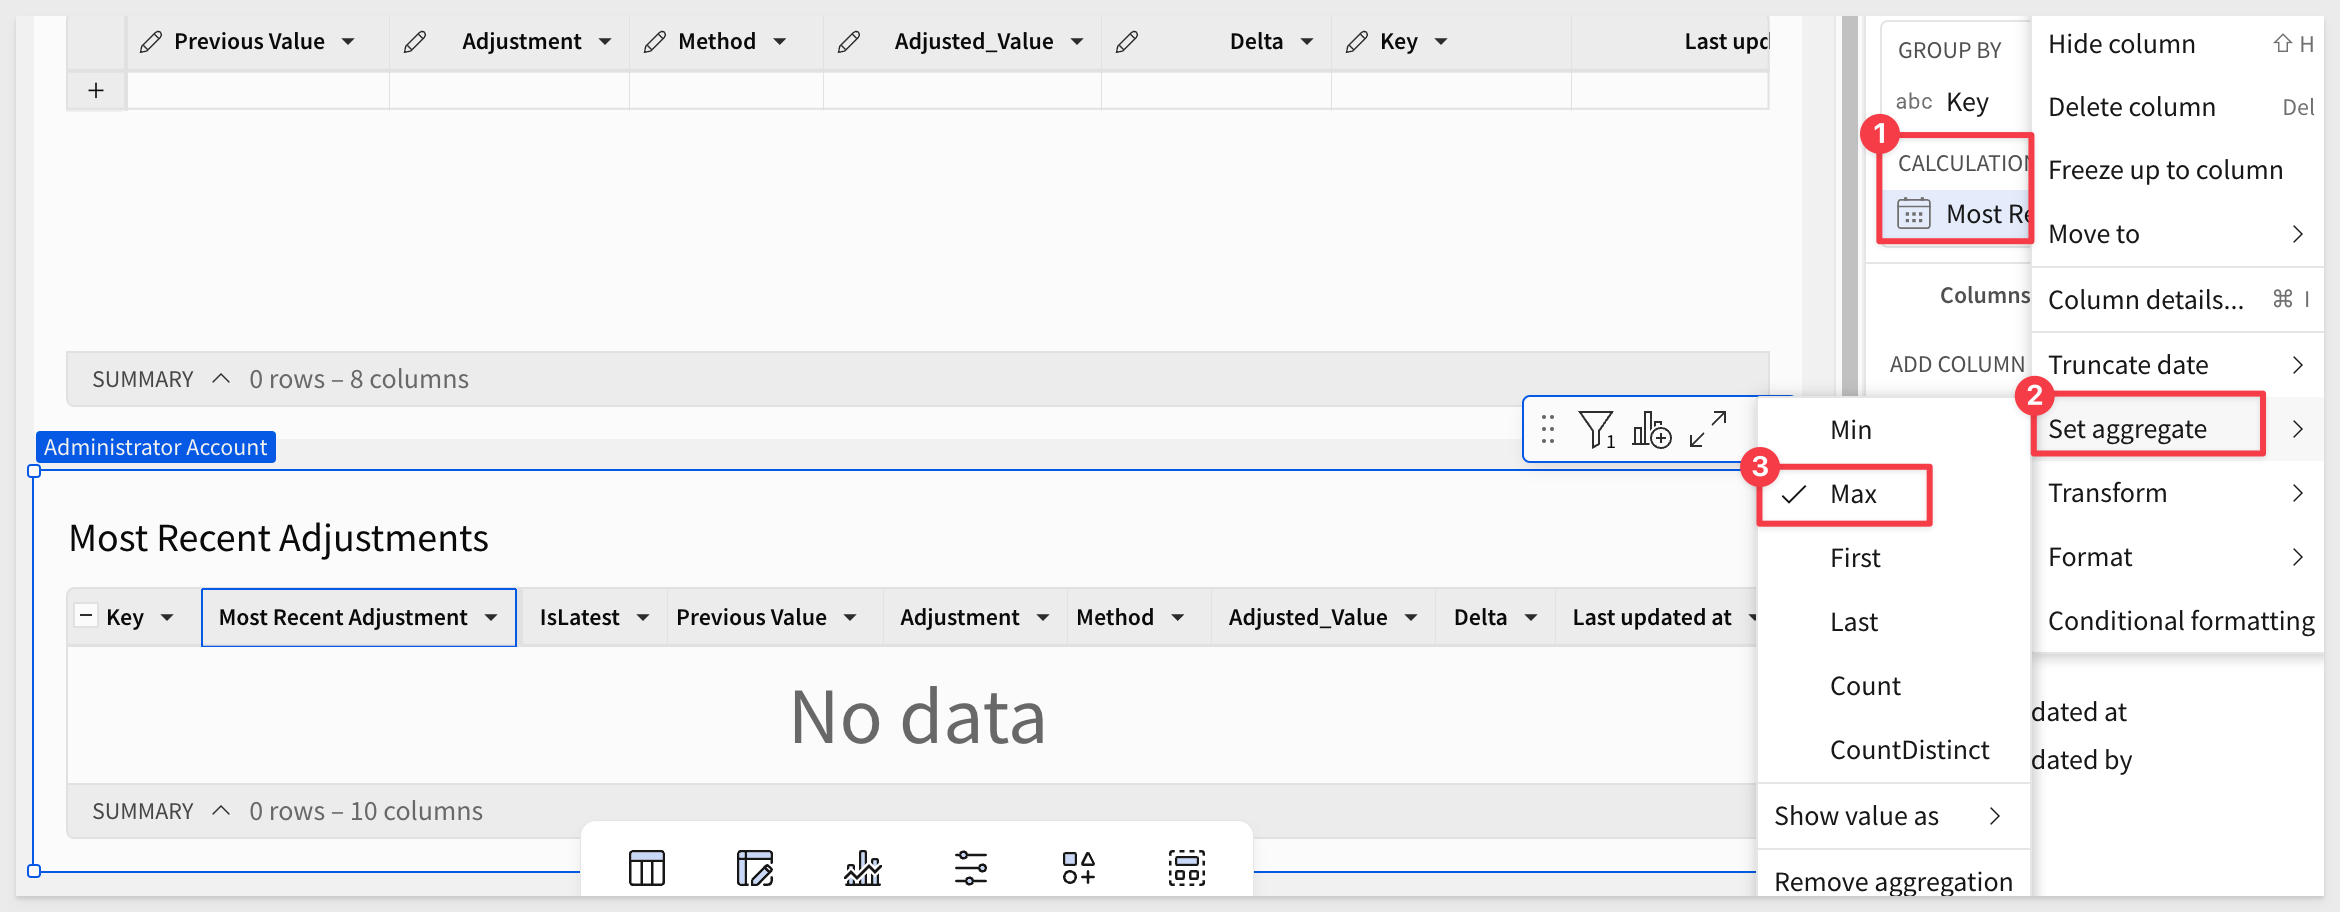
Rename the column to Most Recent Adjustment.
Add another new column and rename it to IsLatest and set its formula to:
If([Last updated at] = [Most Recent Adjustment], True)
Filter IsLatest to only show True values.
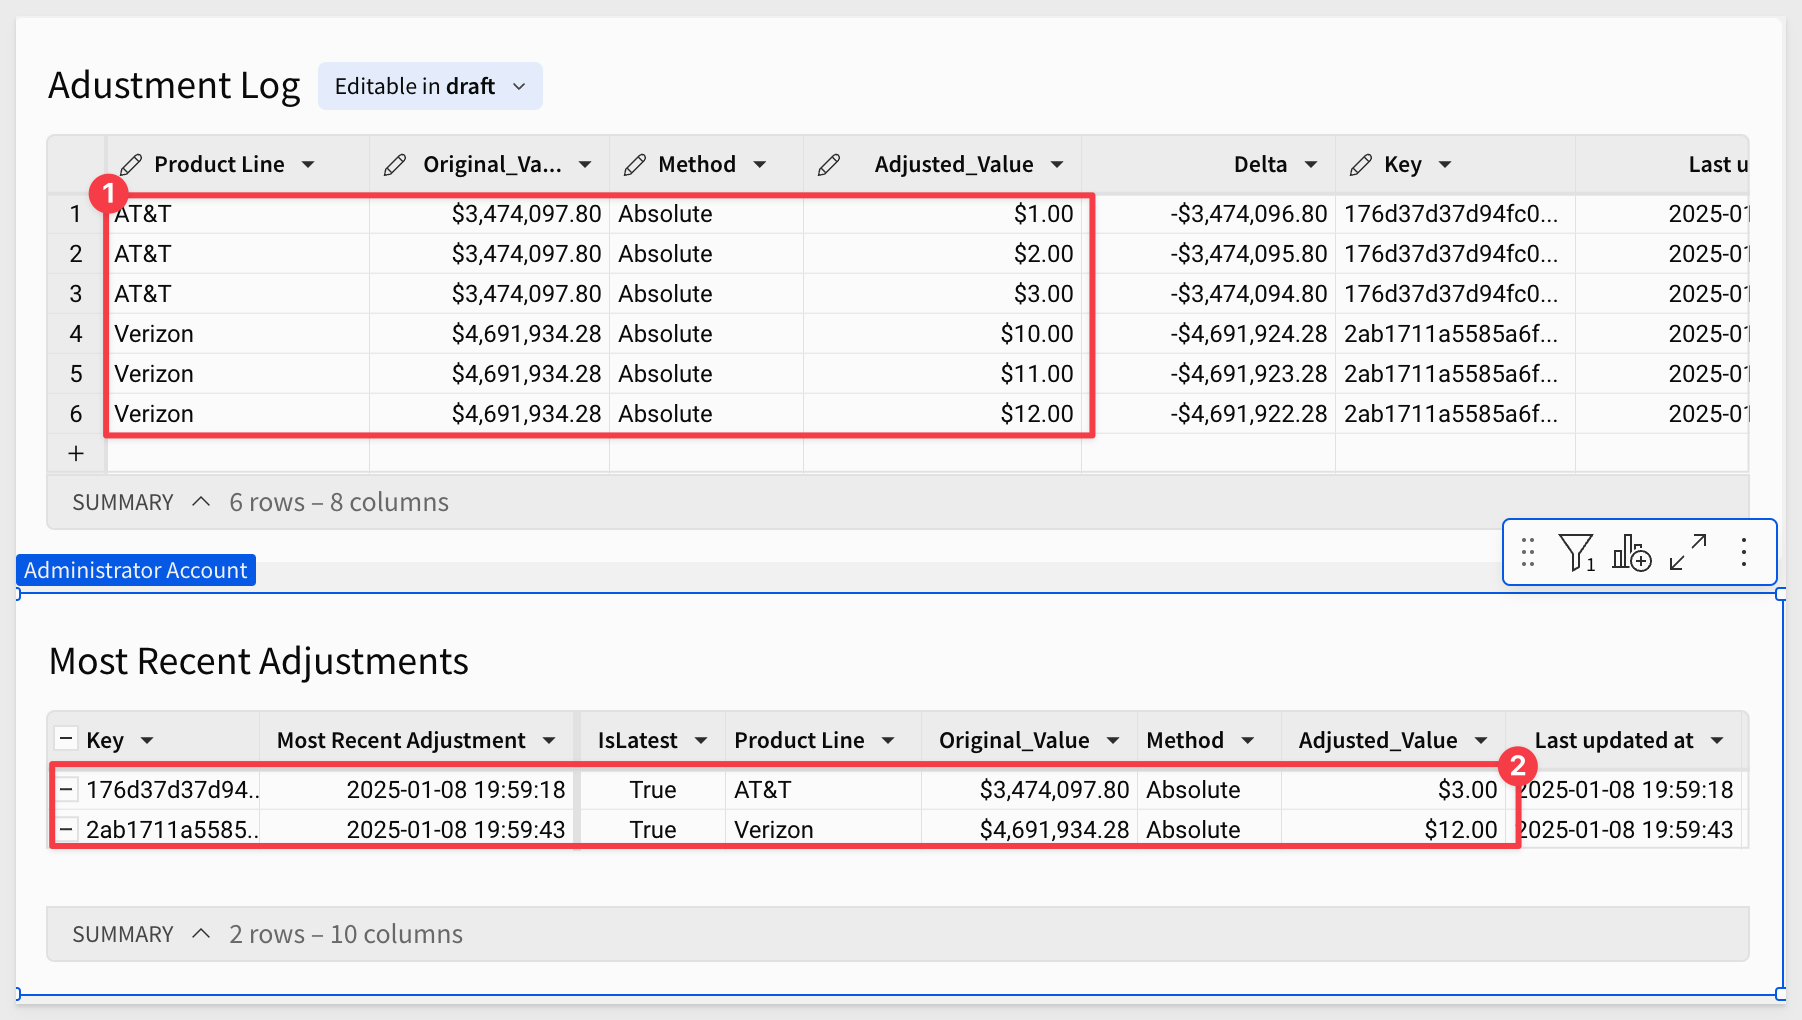
Let's do some test adjustments so that we have some data. Make sure to adjust the same cell a few times so we are sure only the most recent one appears. For example, we did six adjustments on two cells, in two Product Lines. The Most Recent Adjustments table only shows the two most recent adjustments as expected:
With that configured, we now want the latest adjustment to appear in the Revenue Planning table, in the correct cell.
In the Revenue Planning table, add a new column, rename it to the Latest Adjustment and set the formula to:
Coalesce(Lookup([Most Recent Adjustments/Adjusted_Value], [Key], [Most Recent Adjustments/Key]), [Sum of Revenue])
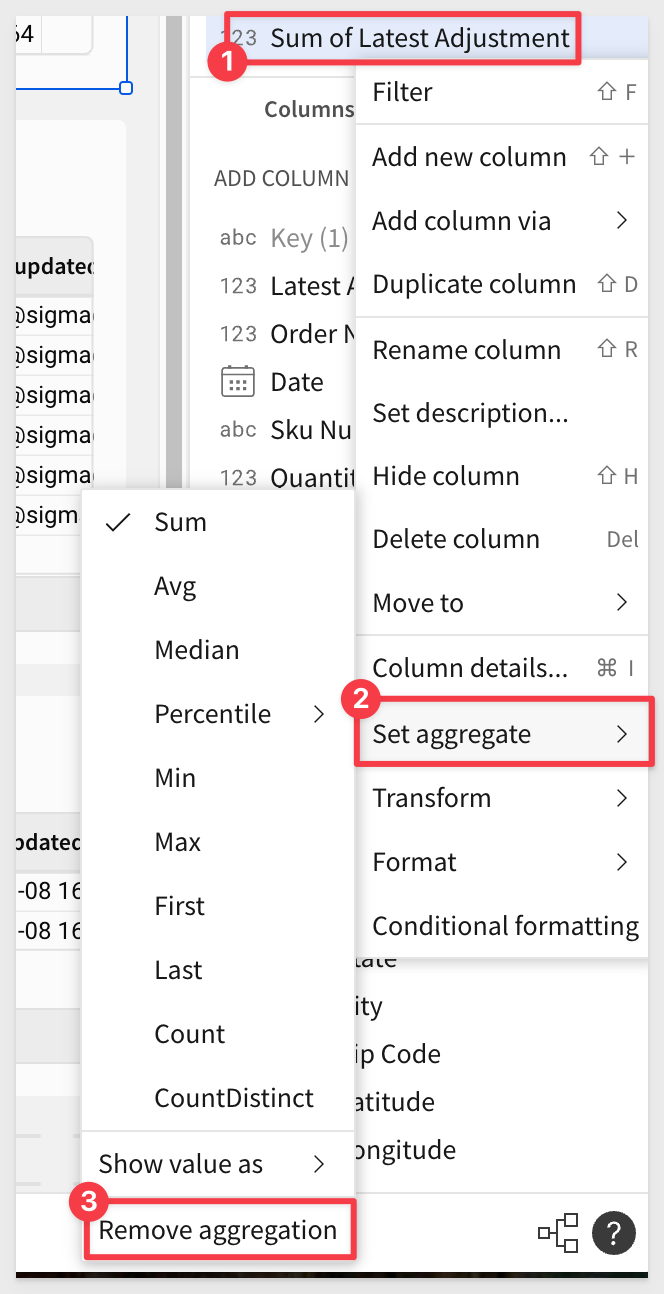
Drag the new column to the CALCULATIONS grouping and set its Aggregation to Remove Aggregation:
Now when there is a matching record in the Most Recent Adjustments table, the value is shown in Revenue Planning in the Latest Adjustment column. When there is no match, the current value is shown instead.
Here is a demo of a using the data app to make some adjustments from scratch (using the Published version):
By now we hope you see just how easy and powerful the combination of Sigma and data apps can be.
In this QuickStart, we built out a process that allows users to make real-time adjustments to revenue with all work being done in Sigma.
Additional Resource Links
Blog
Community
Help Center
QuickStarts
Be sure to check out all the latest developments at Sigma's First Friday Feature page!