In this QuickStart, you'll explore how to ask natural language questions about your data using Snowflake Cortex, Snowflake's built-in large language model (LLM) capability.
You'll submit questions like:
"Which region is underperforming?"
"Where are we seeing problems?"
Cortex interprets your question, combines it with business context, and returns a narrative answer powered by an LLM—no code or SQL required.
What is Cortex?
Cortex is Snowflake's serverless AI platform for building and deploying LLM-powered experiences directly inside your Snowflake environment. It enables teams to ask questions in plain English and get rich answers—without needing to move or export data.
For more information about Snowflake Cortex, see Snowflake Cortex AI
LLMs vs ML
Traditional machine learning (ML) models are trained to solve very specific tasks (e.g., churn prediction or price forecasting). In contrast, LLMs (Large Language Models) like Anthropic Claude can understand and generate natural language across a wide range of use cases — including summarizing, explaining, and reasoning over structured data.
That flexibility is what powers the experience you're about to try.
Why Claude?
In this QuickStart, we've chosen Claude Sonnet, a fast, cost-effective LLM from Anthropic, known for its high-quality business writing and reasoning. Claude is integrated via Cortex's COMPLETE function and used to generate executive-level summaries based on your chart or data prompt.
For information on the supported regions, see Region availability.
For more information on Sigma's product release strategy, see Sigma product releases.
If something is not working as you expect, here is how to contact Sigma support.
Target Audience
The typical audience for this QuickStart includes data analysts, business users, and analytics engineers who want to explore how to use natural language to interact with data directly inside Sigma and Snowflake using large language models (LLMs).
Prerequisites
- A computer with a modern web browser (any browser will work).
- Access to your Sigma environment.
- Administrative access to a Snowflake environment.
- The Snowflake sample database.
- Snowflake Cortex enabled in your Snowflake account.
- Some familiarity with Sigma and Snowflake is assumed. Not all basic steps will be shown.
If the Snowflake instance you are using does not contain the sample data, it can be manually loaded. For more information, see Using the Sample Database.

We need to configure a new connection to Snowflake in Sigma. This connection must meet three key requirements:
- Cortex Enabled: It must point to a Snowflake instance where Cortex is already enabled.
- Sigma Write-Back Support: It must be configured to allow Sigma write-back, enabling input tables to capture and store user-entered data directly back into Snowflake.
- Snowflake Sample Database: This can be installed if it's not already present.
Enabling write access
Write access requires granting a Snowflake user the following privileges:
- Database: USAGE
- Schema: USAGE, CREATE TABLE, CREATE VIEW, CREATE STAGE
For simplicity, we'll use the ACCOUNTADMIN role.
Example script
The following script will create a database, schema and permissions (at a minimum level) and can be used as a reference when setting up write access.
USE ROLE ACCOUNTADMIN;

-- Create and use Sigma Writeback DB
CREATE DATABASE IF NOT EXISTS SIGMA_WRITEBACK;
USE DATABASE SIGMA_WRITEBACK;

-- Create schemas for write-back
CREATE SCHEMA IF NOT EXISTS SIGMA_WRITEBACK.INPUT_TABLES;

-- Permissions for Sigma Input Tables (ACCOUNTADMIN FOR SIMPLIFICATION ONLY, NOT RECOMMENDED IN PRACTICE)
GRANT USAGE ON SCHEMA SIGMA_WRITEBACK.INPUT_TABLES TO ROLE ACCOUNTADMIN;
GRANT CREATE TABLE, CREATE VIEW, CREATE STAGE ON SCHEMA SIGMA_WRITEBACK.INPUT_TABLES TO ROLE ACCOUNTADMIN;
For more information on setting up write access, see Set up write access
Sigma connection
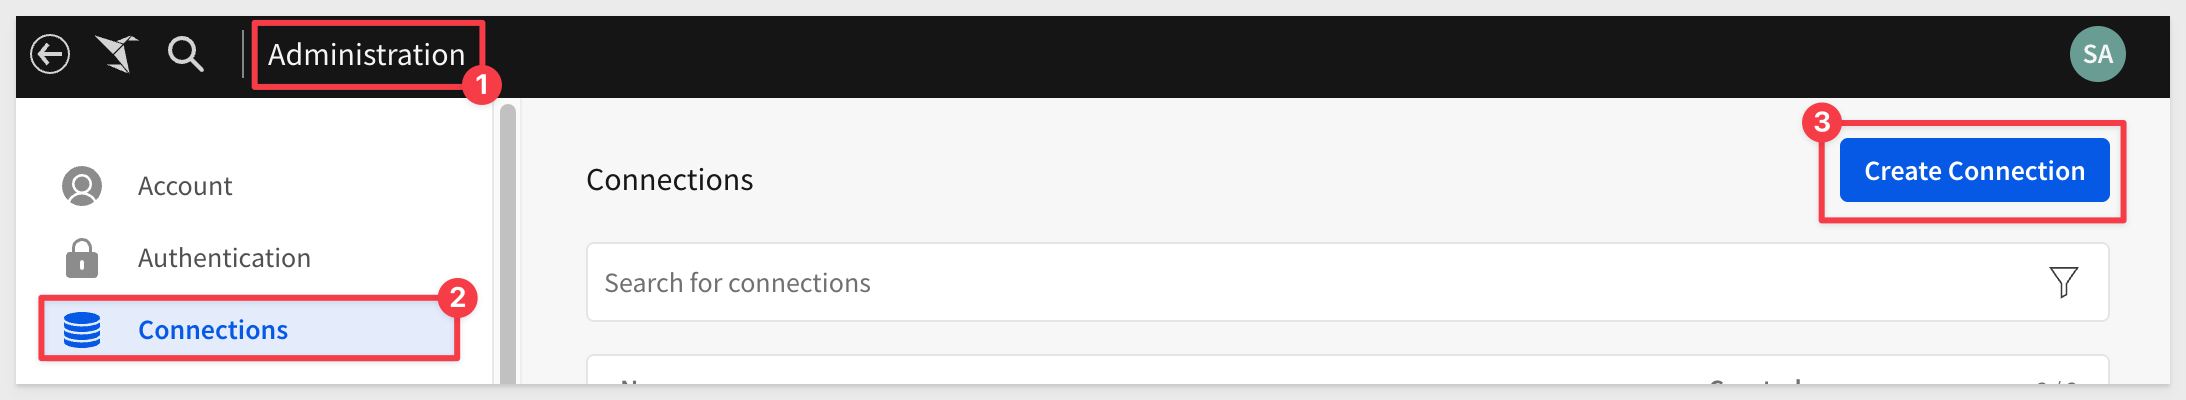
Log into Sigma as Administrator and navigate to Administration > Connections.
Fill out the required connection name and details. For more information on the required values, see Connect to Snowflake
In the Write access section, be sure to select the database and schema created earlier.
Snowflake sample database
If the SNOWFLAKE_SAMPLE_DATA is not present in your Snowflake instance, it can be added manually.
-- Create a database from the share.
CREATE DATABASE SNOWFLAKE_SAMPLE_DATA FROM SHARE SFC_SAMPLES.SAMPLE_DATA;

-- Grant the PUBLIC role access to the database.
-- Optionally change the role name to restrict access to a subset of users.
GRANT IMPORTED PRIVILEGES ON DATABASE SNOWFLAKE_SAMPLE_DATA TO ROLE PUBLIC;
For more information on the Snowflake sample data, see Sample Data Sets
Before integrating Cortex, we need to create content that it can respond to.
We will create a data model in Sigma to do this and add some custom metrics that we will reuse later.
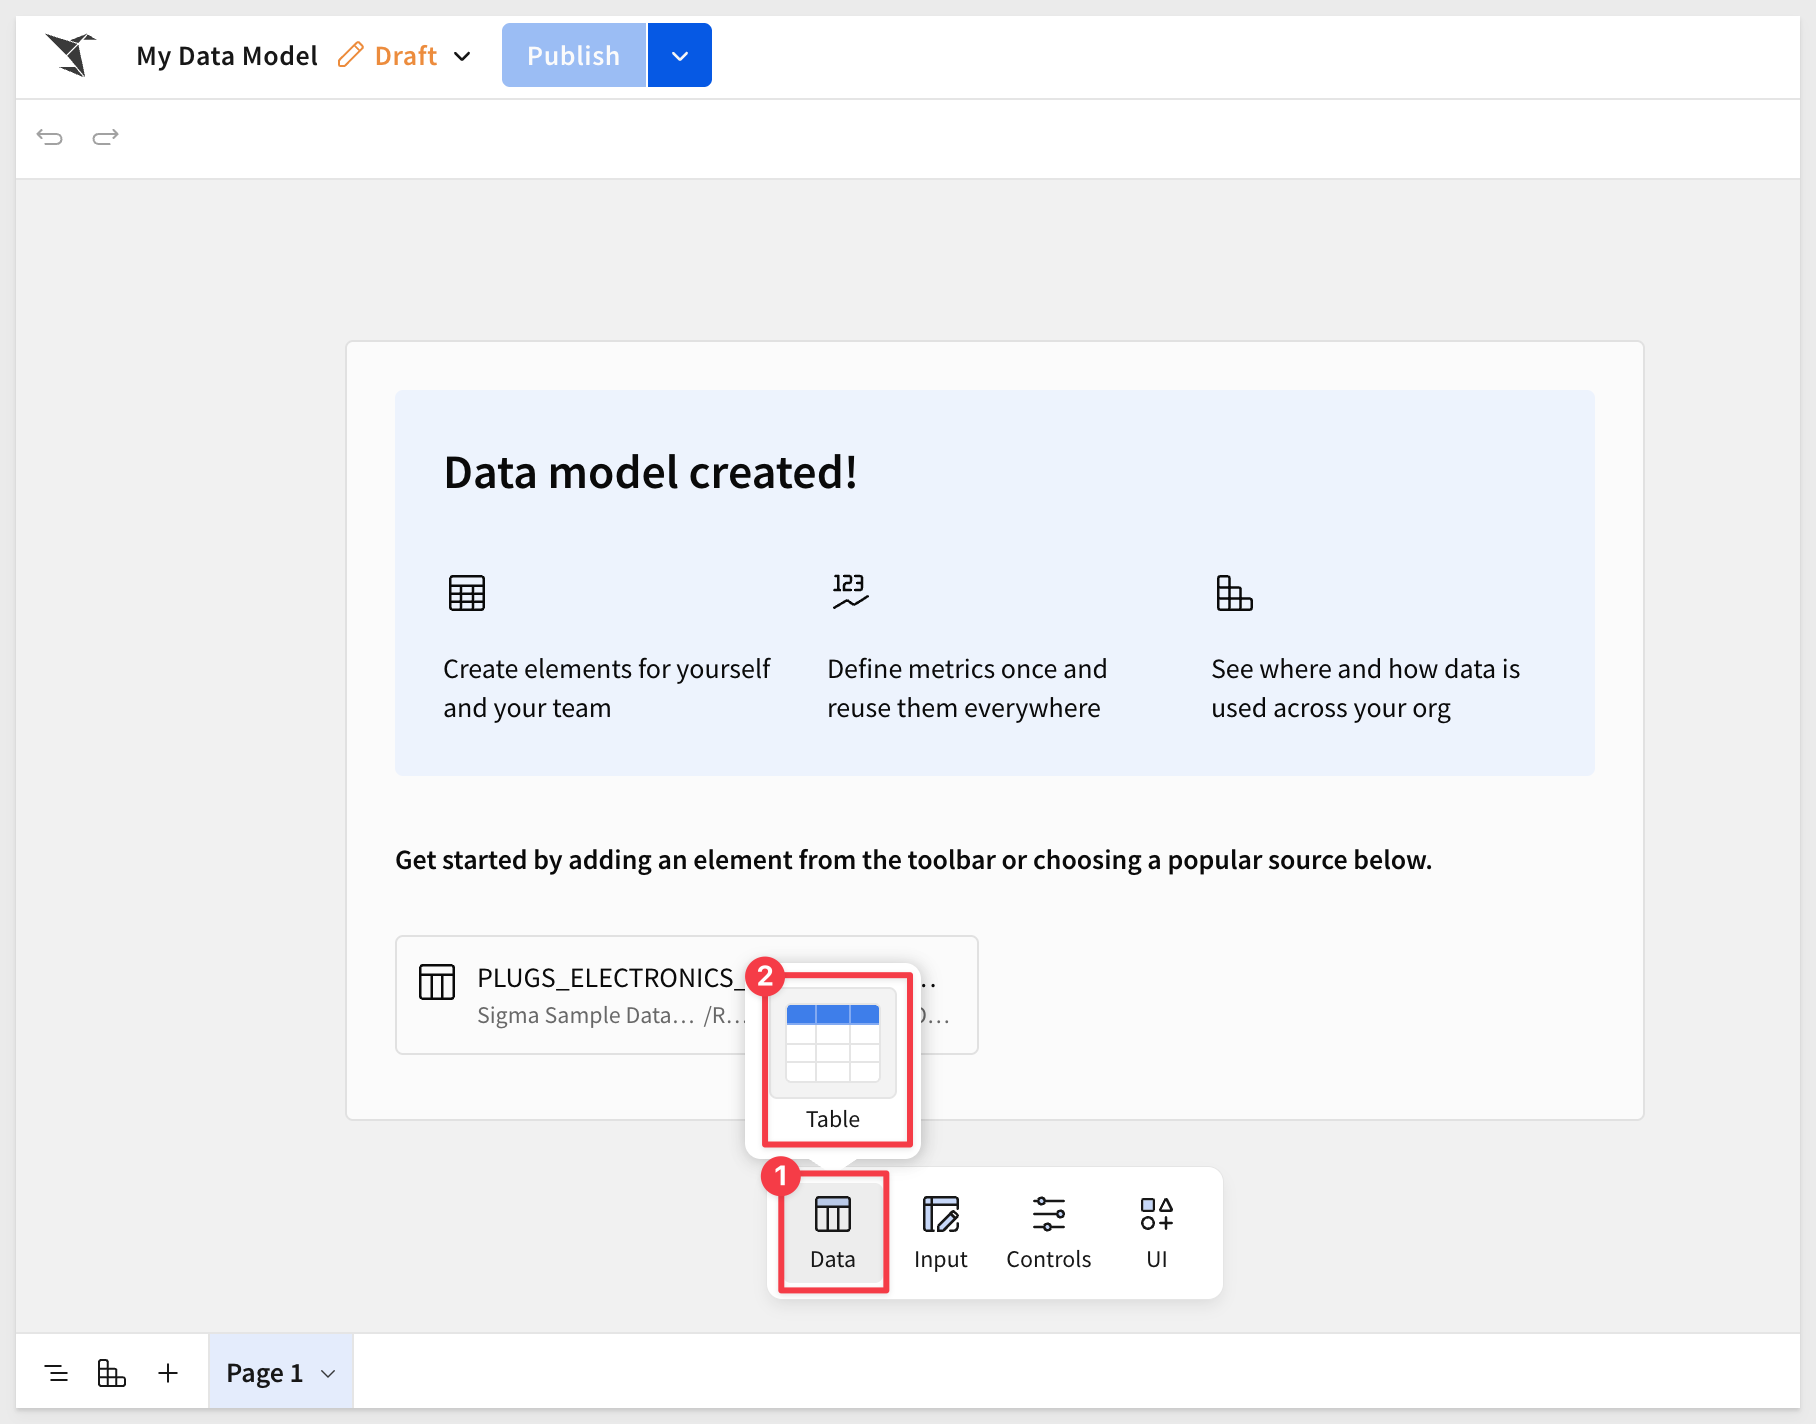
Log into Sigma as Administrator and click Create New > Data Model.
Select Table from the Data group on the Element Bar:
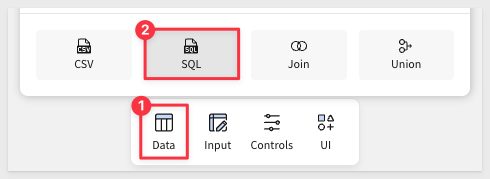
Select SQL as the source:
Be sure to select the connection that has access to Snowflake's sample data.
If the Snowflake instance you are using does not contain the sample data, it can be manually loaded. For more information, see Using the Sample Database.
Use the following SQL script:
SELECT
    o.o_orderkey                            AS order_number,
    o.o_orderdate                           AS order_date,
    l.l_partkey                             AS sku_number,
    l.l_extendedprice                       AS revenue,
    l.l_quantity * ps.ps_supplycost         AS cogs,
    p.p_name                                AS product_name,
    p.p_type                                AS product_type,
    p.p_brand                               AS brand,
    c.c_name                                AS customer_name,
    c.c_address                             AS store_city,
    r.r_name                                AS store_region
FROM
    snowflake_sample_data.tpch_sf1.orders o
JOIN
    snowflake_sample_data.tpch_sf1.lineitem l
    ON o.o_orderkey = l.l_orderkey
JOIN
    snowflake_sample_data.tpch_sf1.part p
    ON l.l_partkey = p.p_partkey
JOIN
    snowflake_sample_data.tpch_sf1.partsupp ps
    ON l.l_partkey = ps.ps_partkey
   AND l.l_suppkey = ps.ps_suppkey
JOIN
    snowflake_sample_data.tpch_sf1.customer c
    ON o.o_custkey = c.c_custkey
JOIN
    snowflake_sample_data.tpch_sf1.nation n
    ON c.c_nationkey = n.n_nationkey
JOIN
    snowflake_sample_data.tpch_sf1.region r
    ON n.n_regionkey = r.r_regionkey
WHERE
  o.o_orderdate >= (
      SELECT DATEADD(MONTH, -12, MAX(o2.o_orderdate))
      FROM snowflake_sample_data.tpch_sf1.orders o2
  )
  AND
  o.o_orderdate < (
      SELECT DATE_TRUNC('MONTH', MAX(o2.o_orderdate))
      FROM snowflake_sample_data.tpch_sf1.orders o2
  );
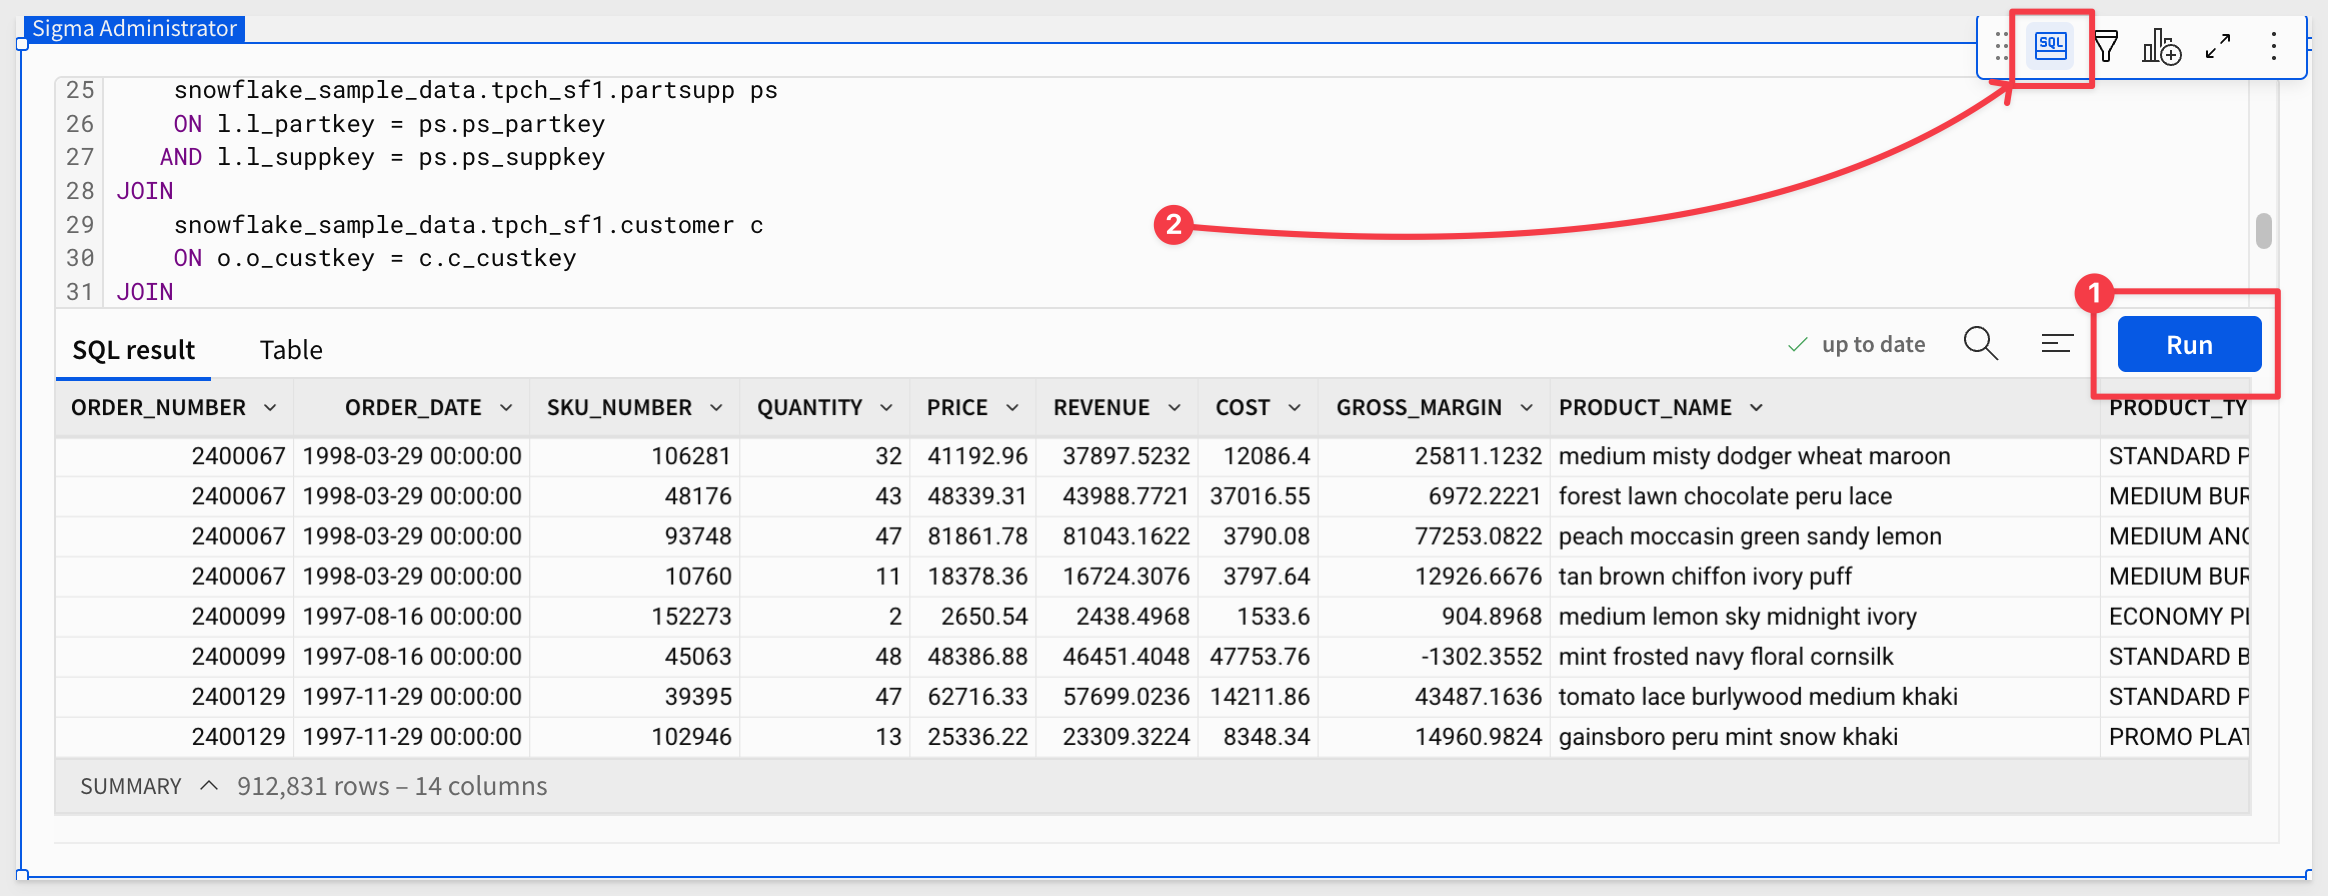
Once pasted, click Run.
The query will return about 900,000 rows and 14 columns. We can toggle the SQL script off by clicking the SQL icon:
For more information on current restrictions, see Snowflake's documentation on Model restrictions.
Rename the table to SALES_FACT_CURATED.
Rename the data model to Cortex QuickStart Data Model.
Click Publish.
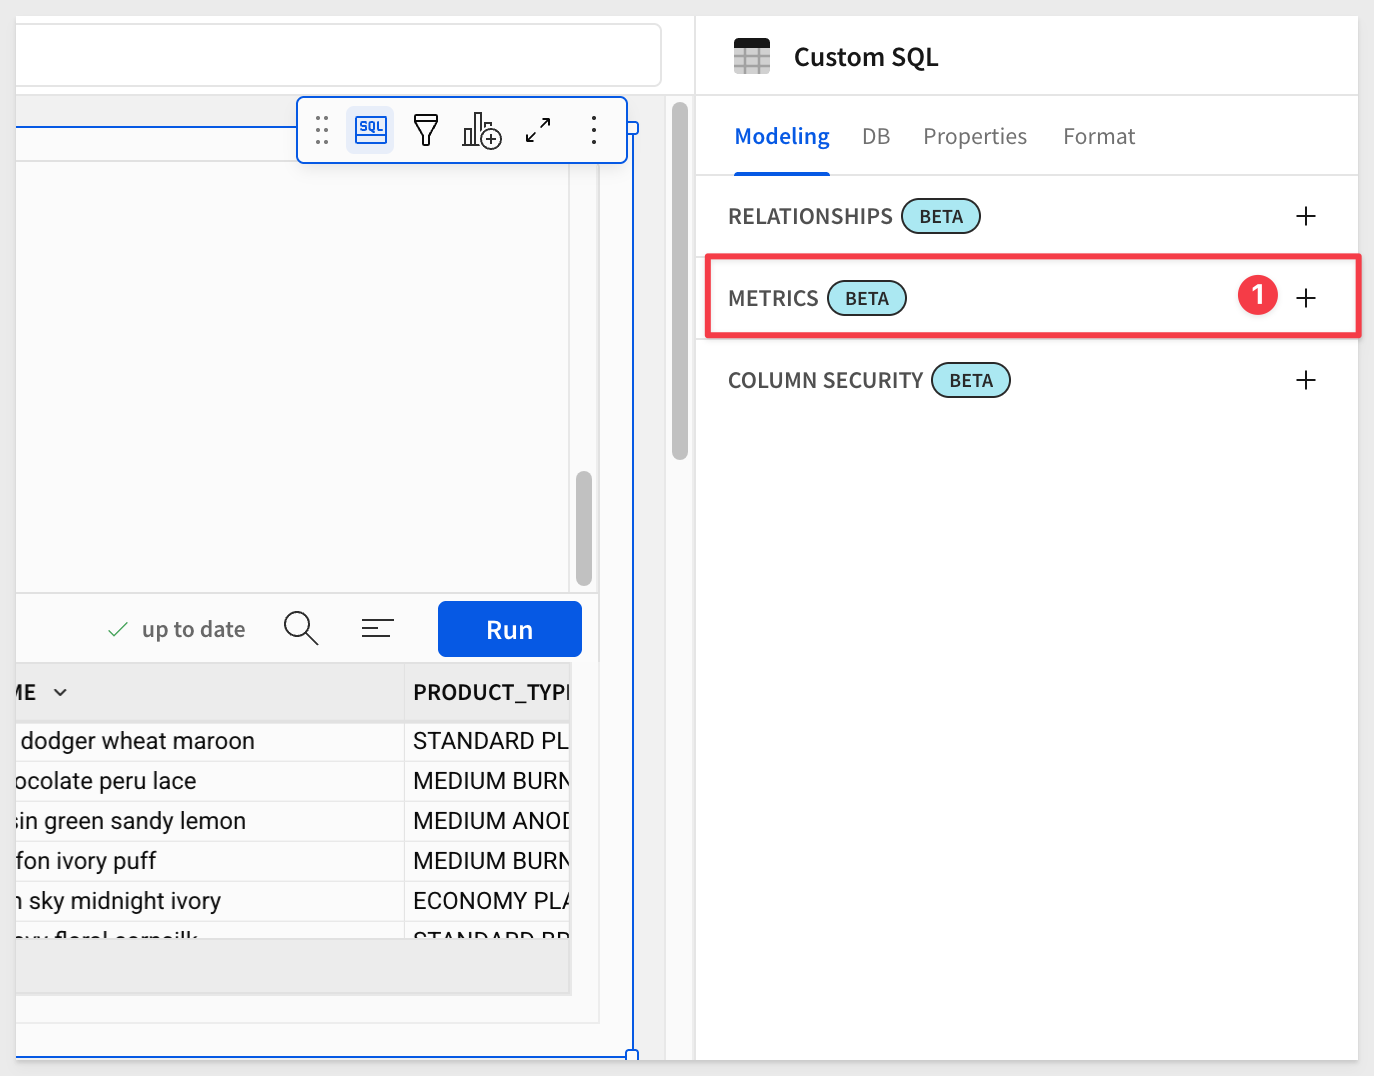
Add metrics
A metric is a custom aggregate calculation that can be reused across data elements that share a data source. If you define metrics in data models, datasets, or tables from a connected database or catalog, you can help users perform calculations in a consistent way both easily and efficiently.
Click the + to add a new metric for Profit:
Configure the metric as shown, using this formula:
Sum([Revenue]) - Sum([Cogs])
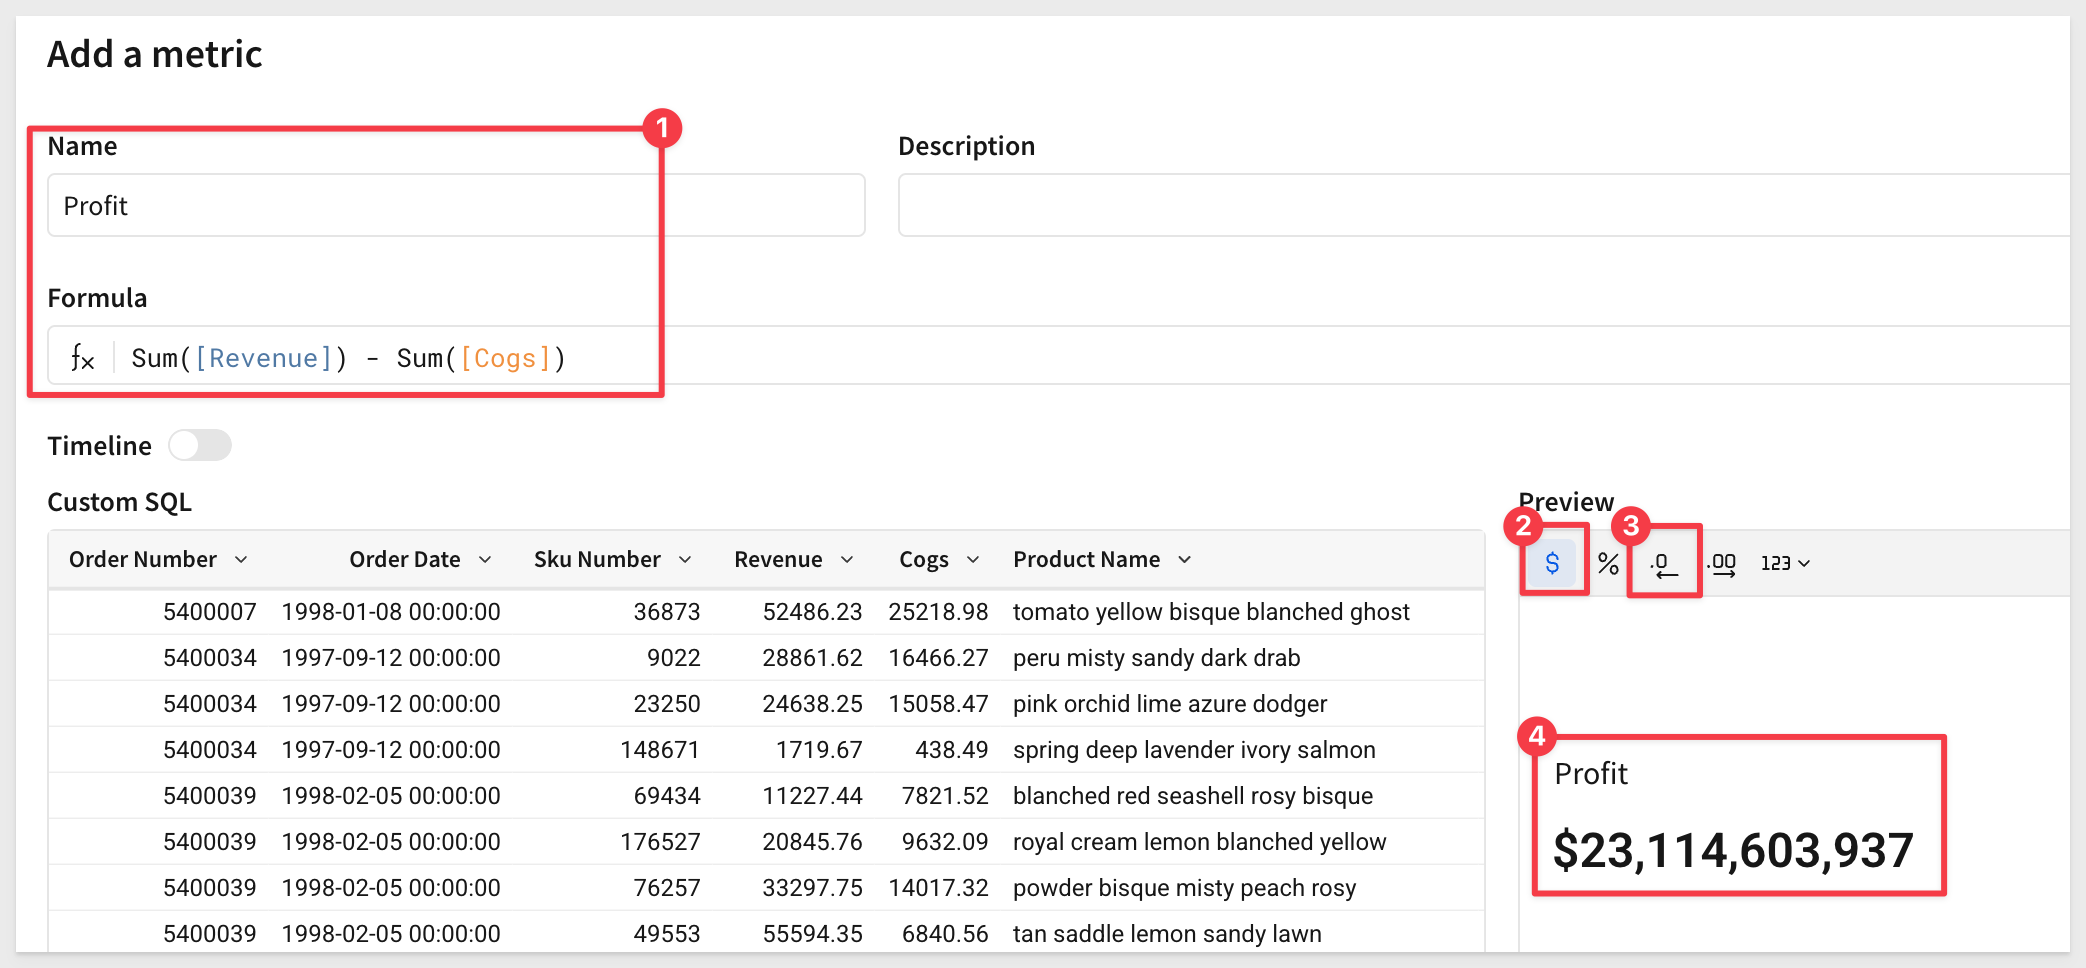
Click Save—the metric will now appear in the list of available metrics.
Repeat the process to add metrics for the following:
Revenue (formatted as currency)
Sum([Revenue])
Gross Margin (formatted as percentage)
(Sum([Revenue]) - Sum([Cogs])) / Sum([Revenue])
You should now see all three metrics in the data model:
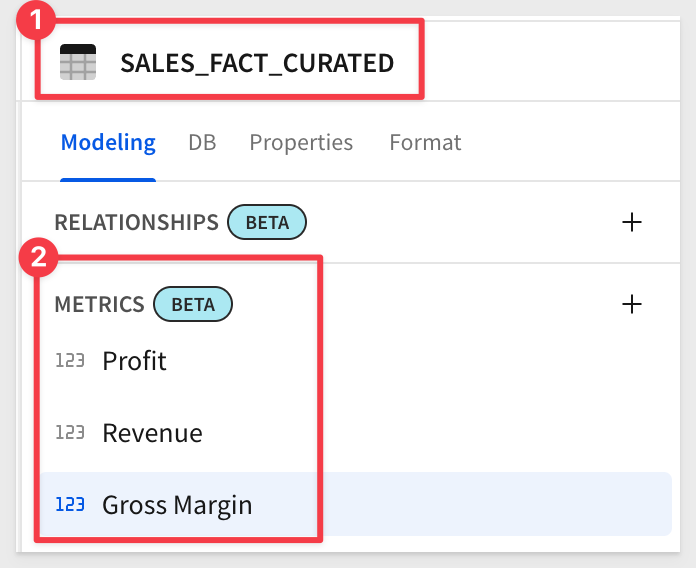
Click Publish.
Create a Workbook and data page
Click the  icon to return to the homepage.
Click Create New > Workbook.
Add a new Data > Table from the Element bar and select Tables and Datasets as the source.
In the Suggested group, we can find the Cortex QuickStart Datamodel we just created:
From that dataset, there's only one element to choose from—SALES_FACT_CURATED. Select that.
Once the table is loaded, we can start to leverage its data in our workbook, including the metrics.
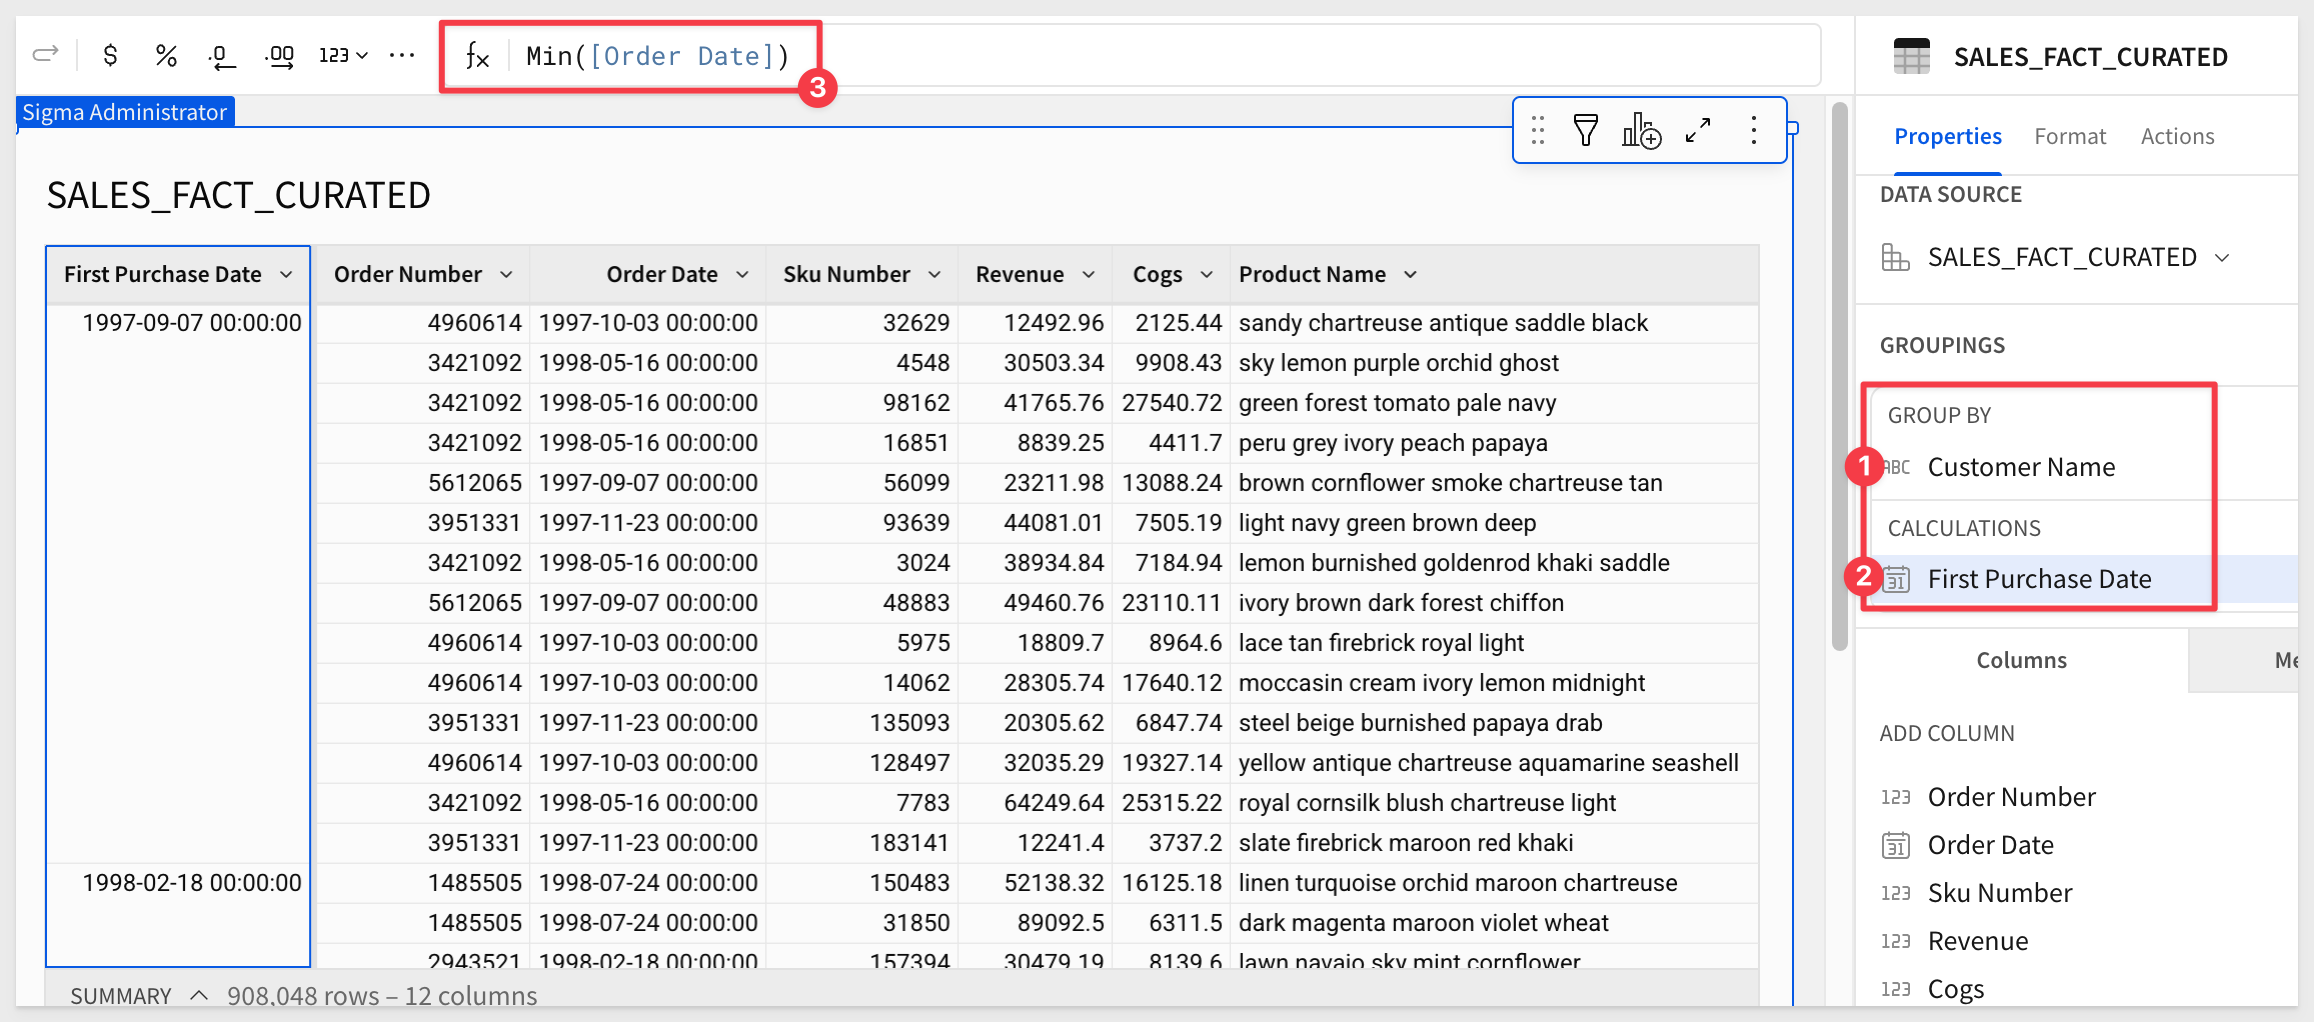
Group the table by Customer Name, and add Order Date as a CALCULATION under the group.
Then change the Order Date column to show the first purchase date by changing its formula to:
Min([Order Date])
Rename the Min of Order Date column to First Purchase Date.
Rename the workbook page tab to Data.
Save the workbook and name it Sigma Cortex QuickStart.
Create a new page and rename it Ask a Question.
Create controls
Add a new Text input control to the page and configure it as shown:
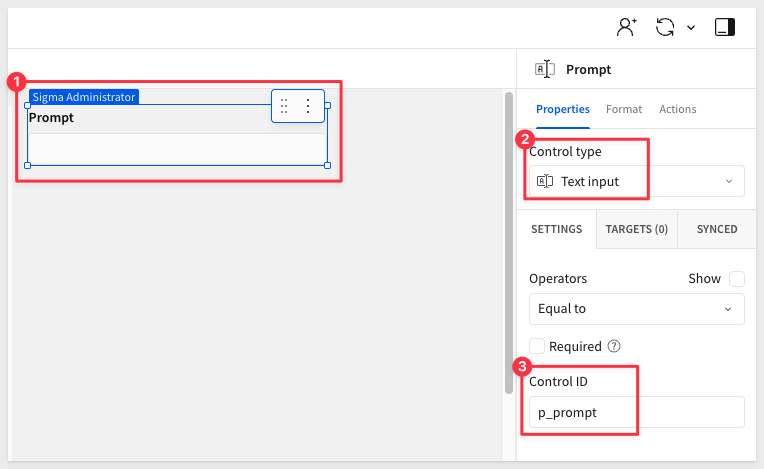
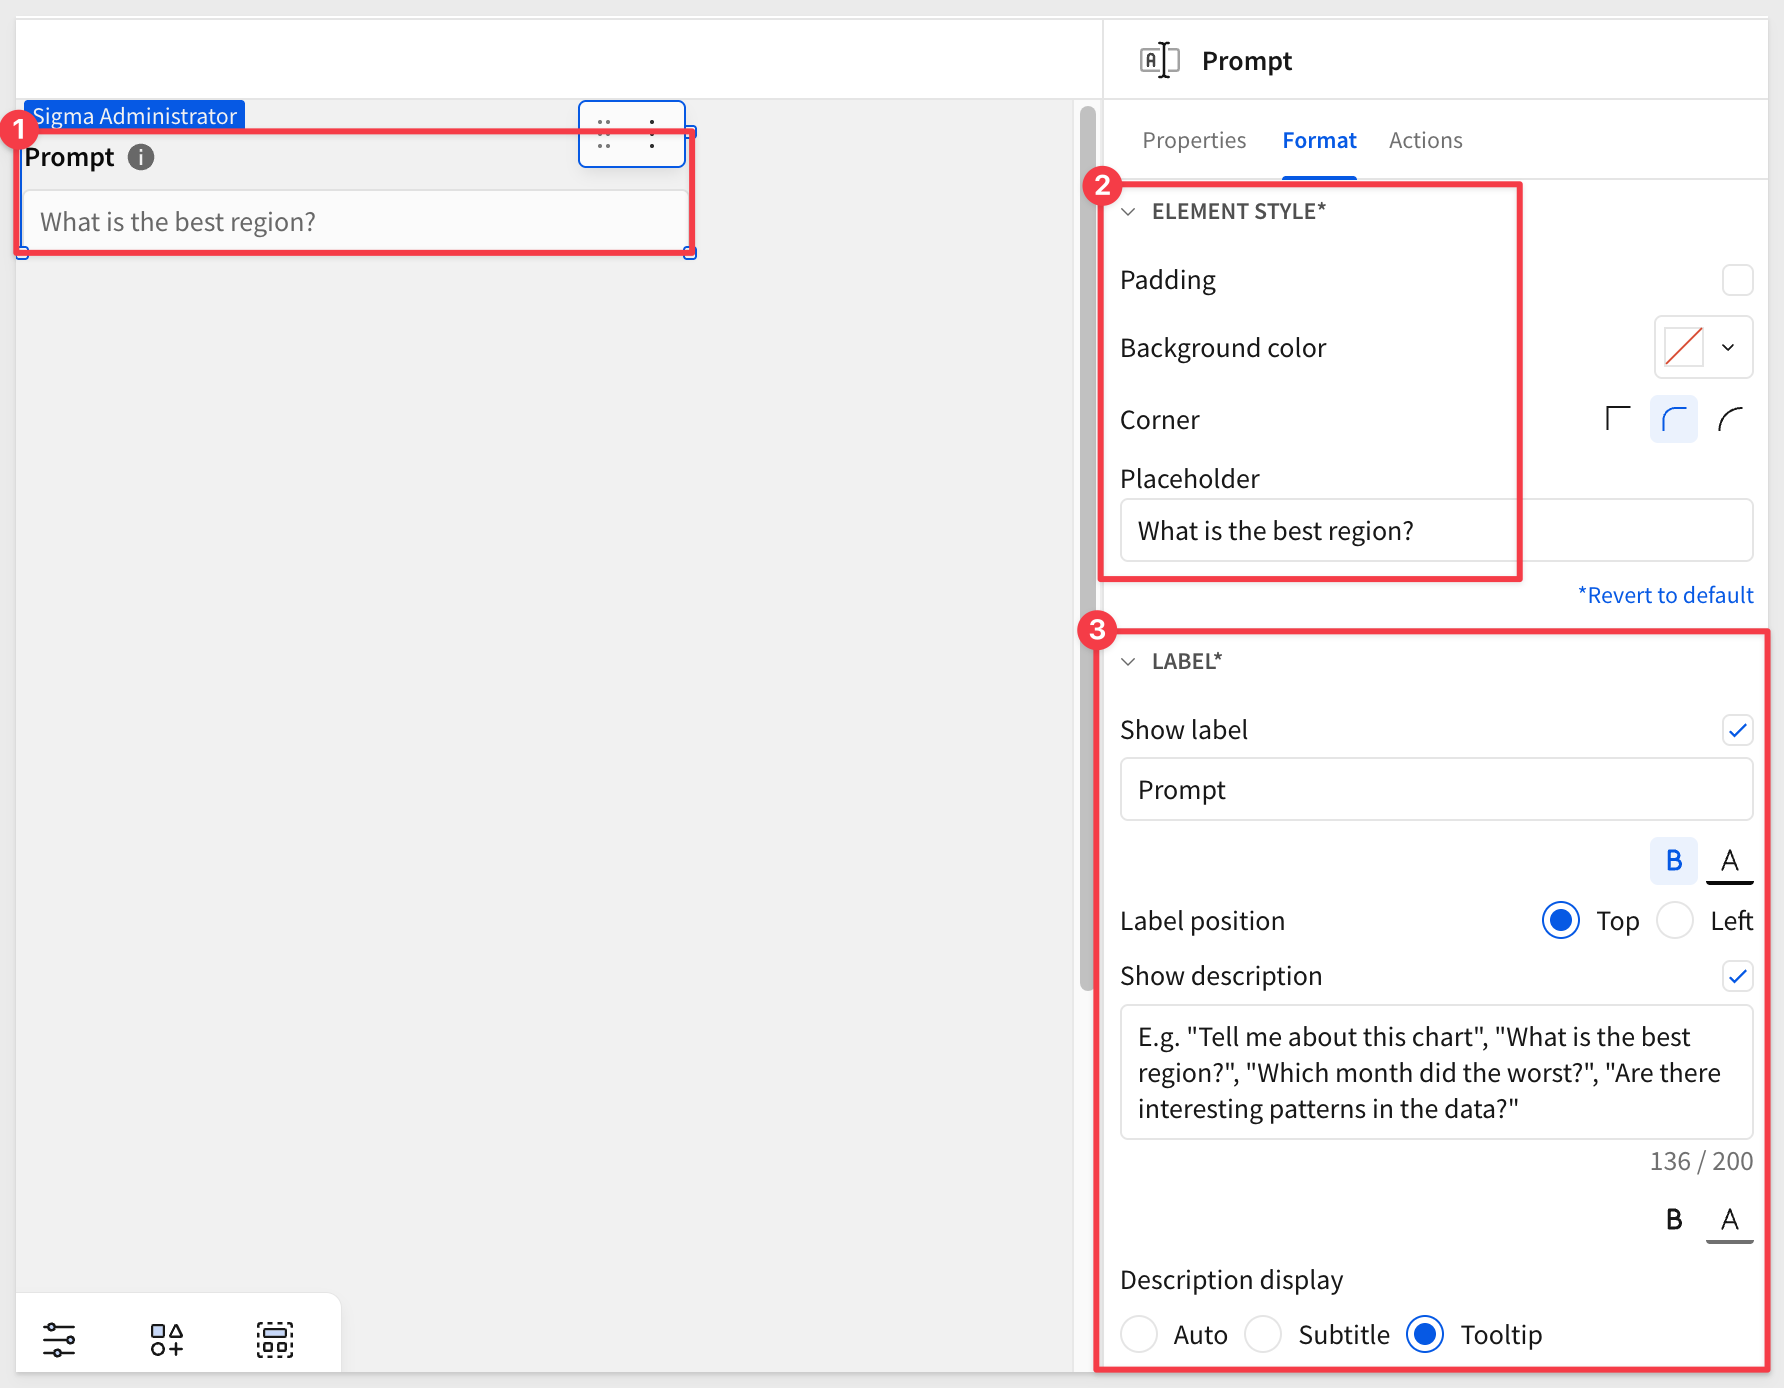
Configure additional information to be displayed for users:
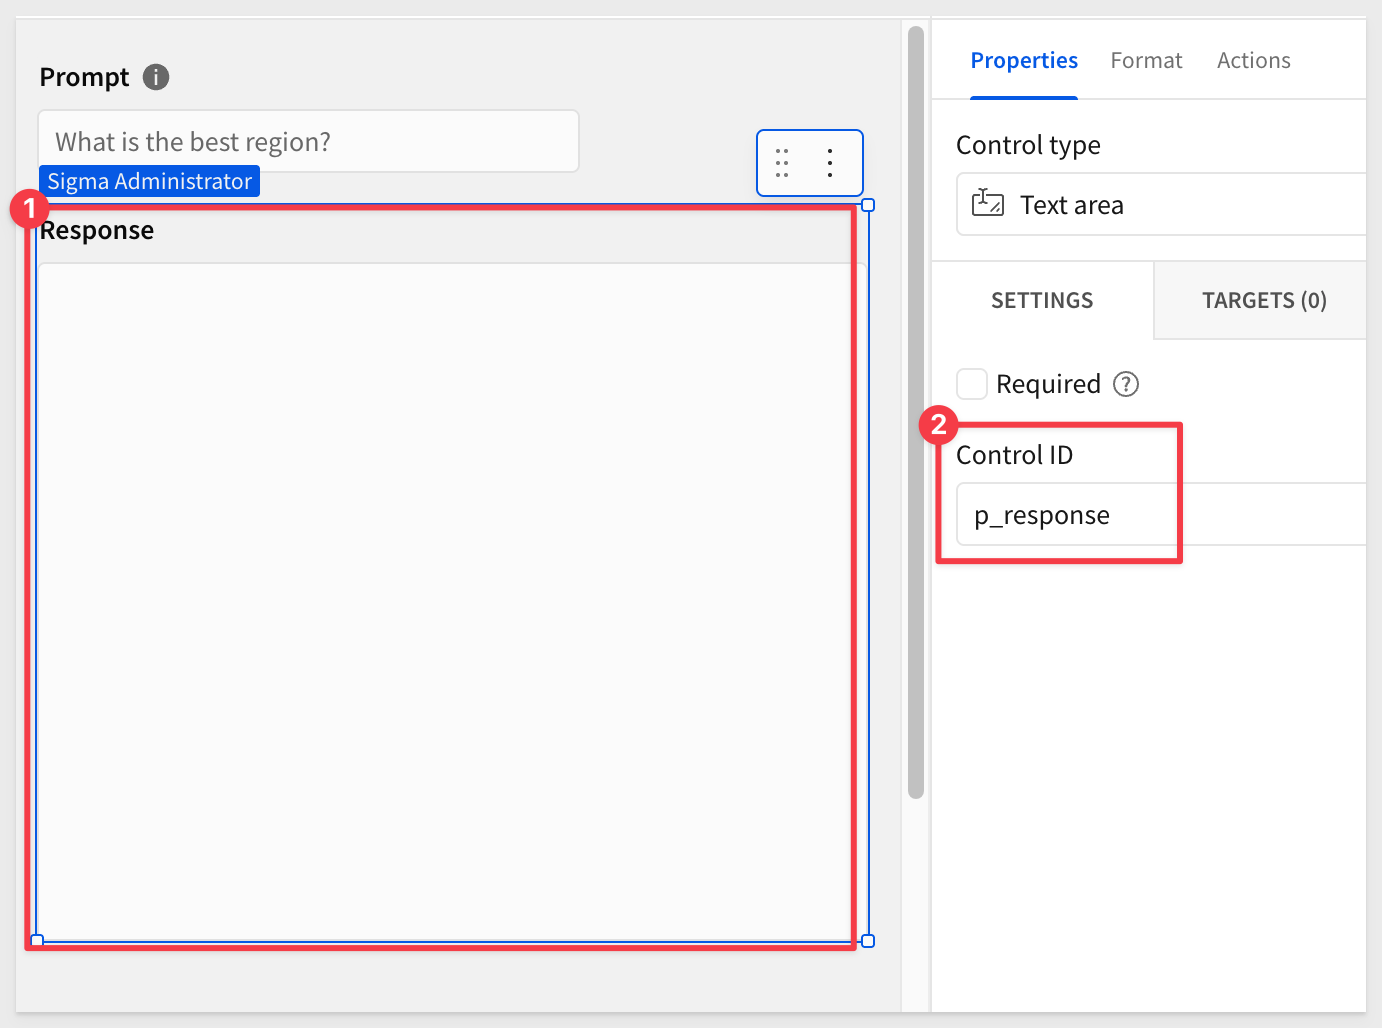
Add a Text area control to the page and configure it as shown:
Click Publish.
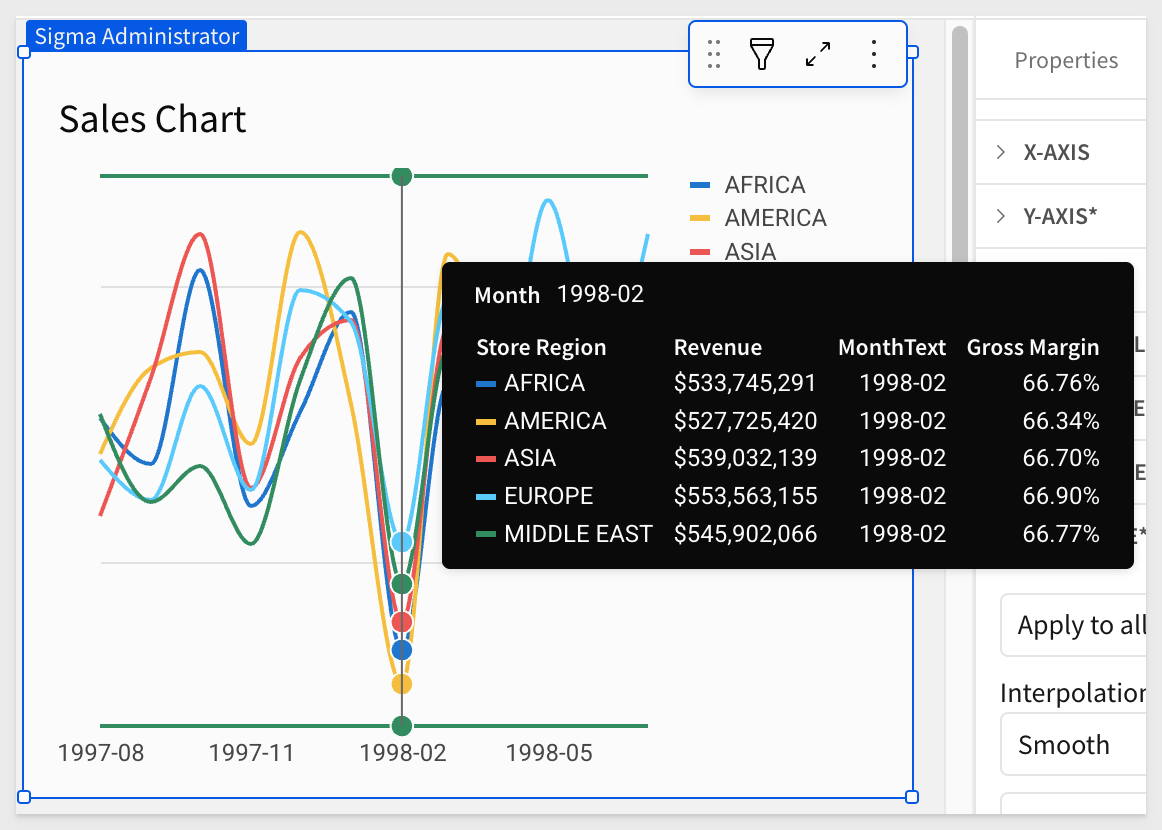
Create a chart
Add a new Line Chart from the Element bar, under the Charts group.
Select the SALES_FACT_CURATED table to connect to the chart.
Use the instructions below the image to configure the chart as shown:
X-Axis Columns
Drag Order Date to the X-AXIS, rename it to Month and change the formula to:
DateTrunc("month", [Order Date])
Y-Axis Columns
Drag the Revenue metric to the Y-AXIS.
Add a new column to the Y-AXIS (click the + icon) and use this formula:
DateFormat([Order Date], "%Y-%m")
Rename this calculated column from Calc to MonthText.
Add another new column to the Y-AXIS (click the + icon) using this formula:
[Metrics/Gross Margin]
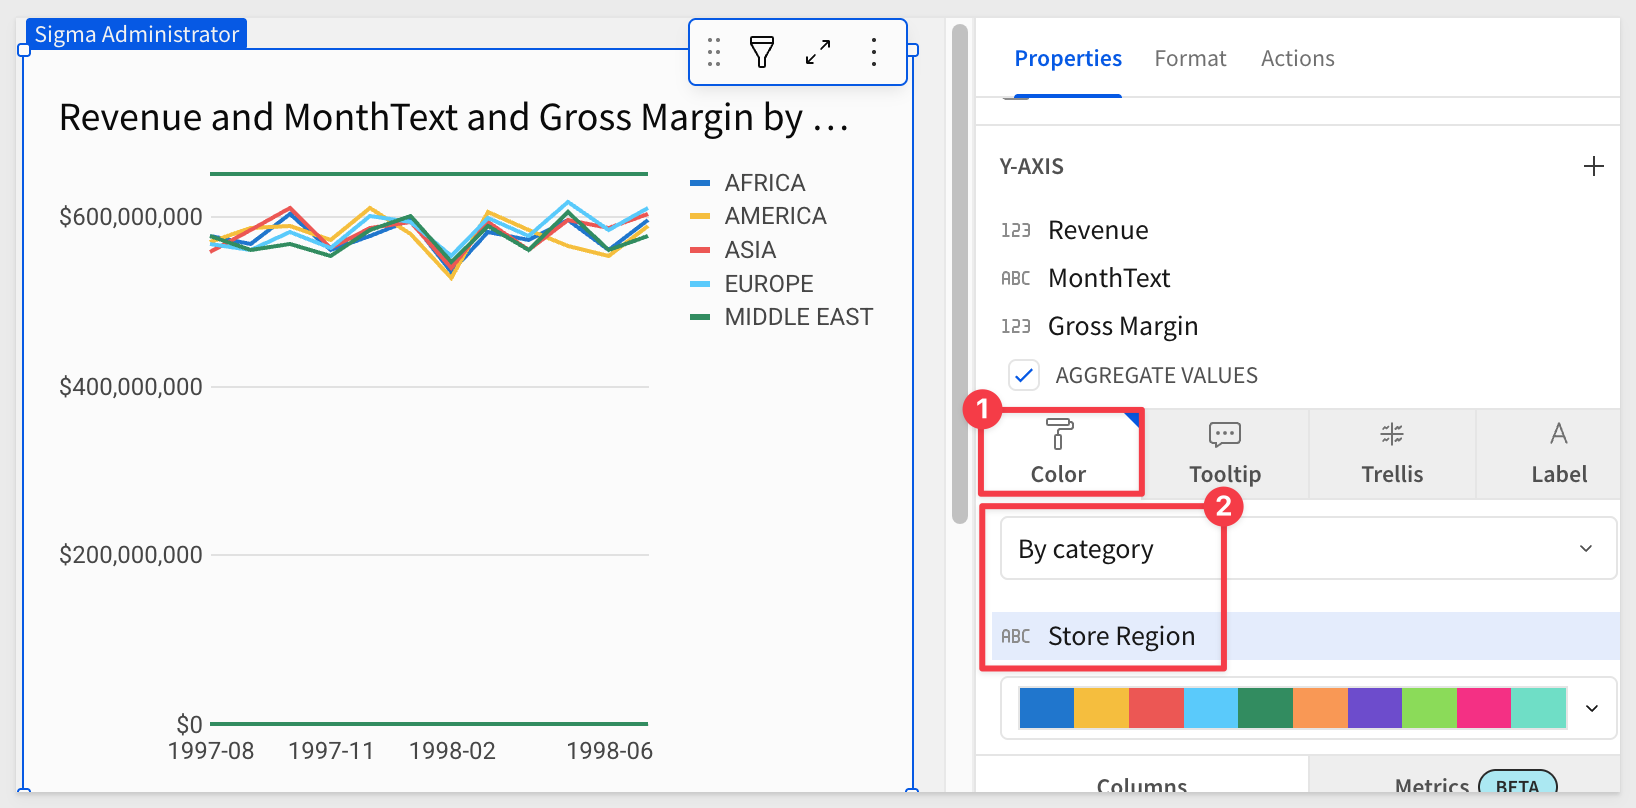
Group by color and category column
Group the chart by Category, using the Store Region column:
Set the legend to bottom and renamed the chart to Sales Chart.
We also set the min/max range on the Y-AXIS > Axis range> Min-max to 520000000 and 620000000 to zoom in on the data more.
Lastly, set the Format > LINE STYLE to Interpolation=Smooth. This step is optional—we just like the effect.
The tooltips are automatic, and we just left them on:
Add a button
We will use a Button to trigger the sequence of actions once a user has entered a prompt and selected a persona.
Add a new Button:
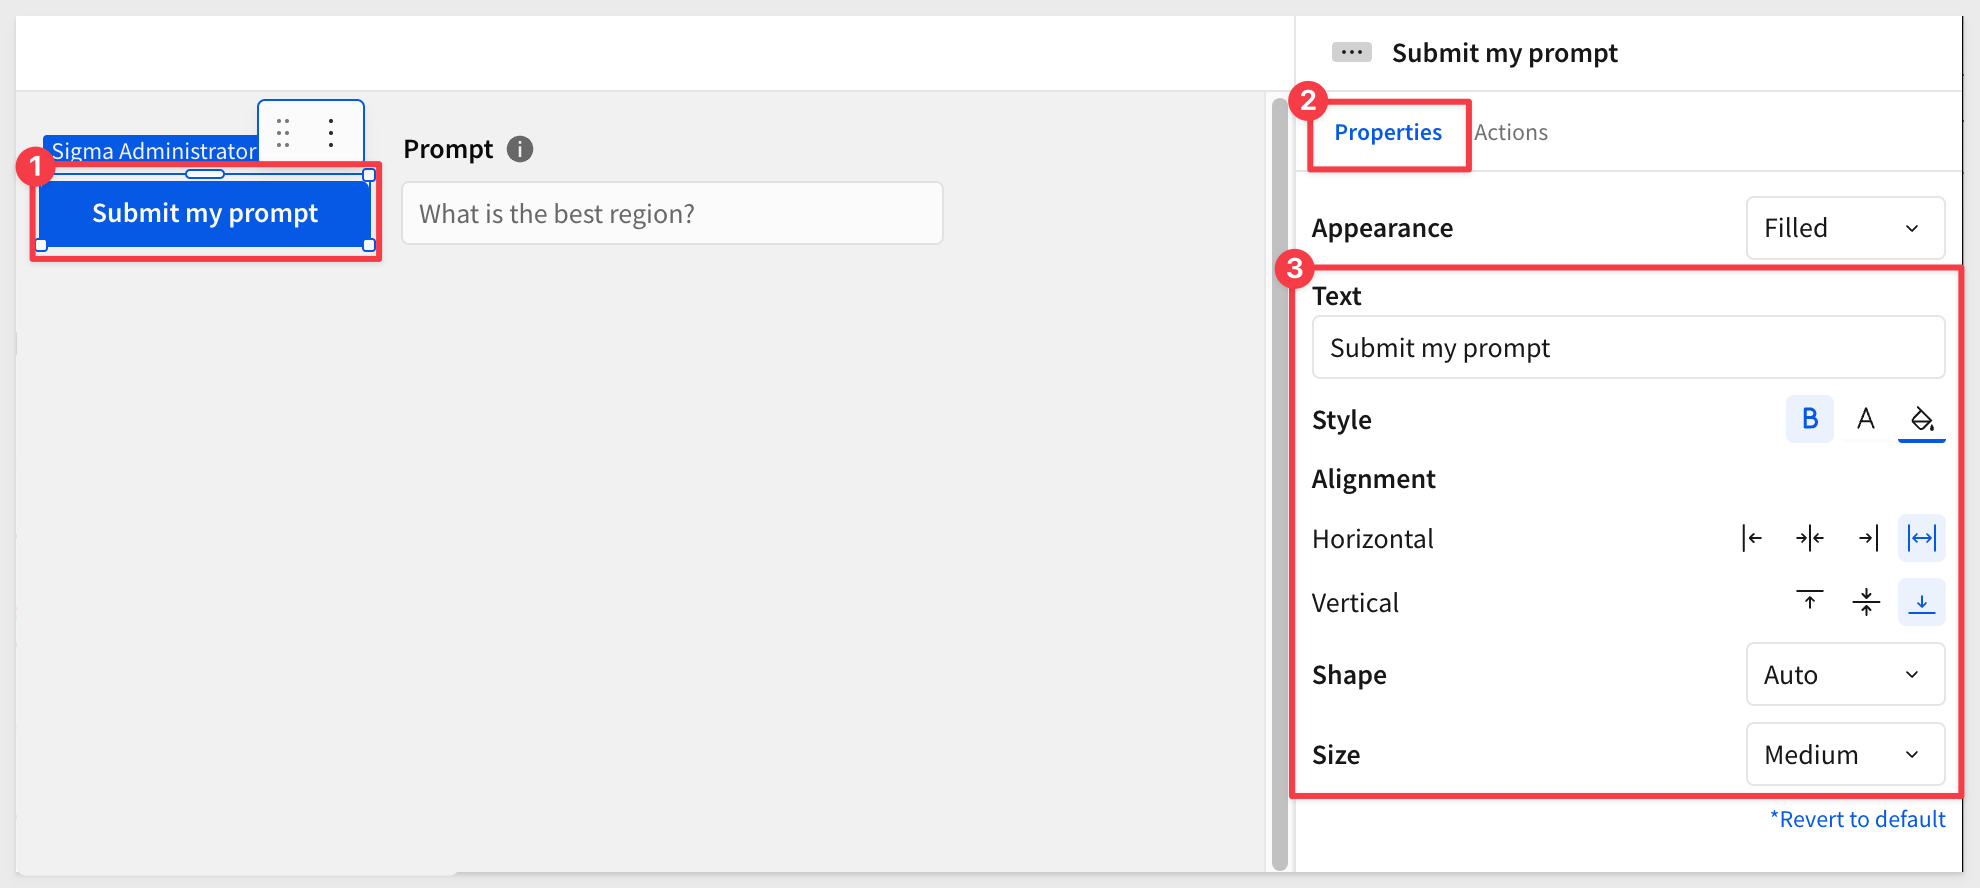
We will return to configure the actions that get triggered on this button later. We have to create a few other elements first.
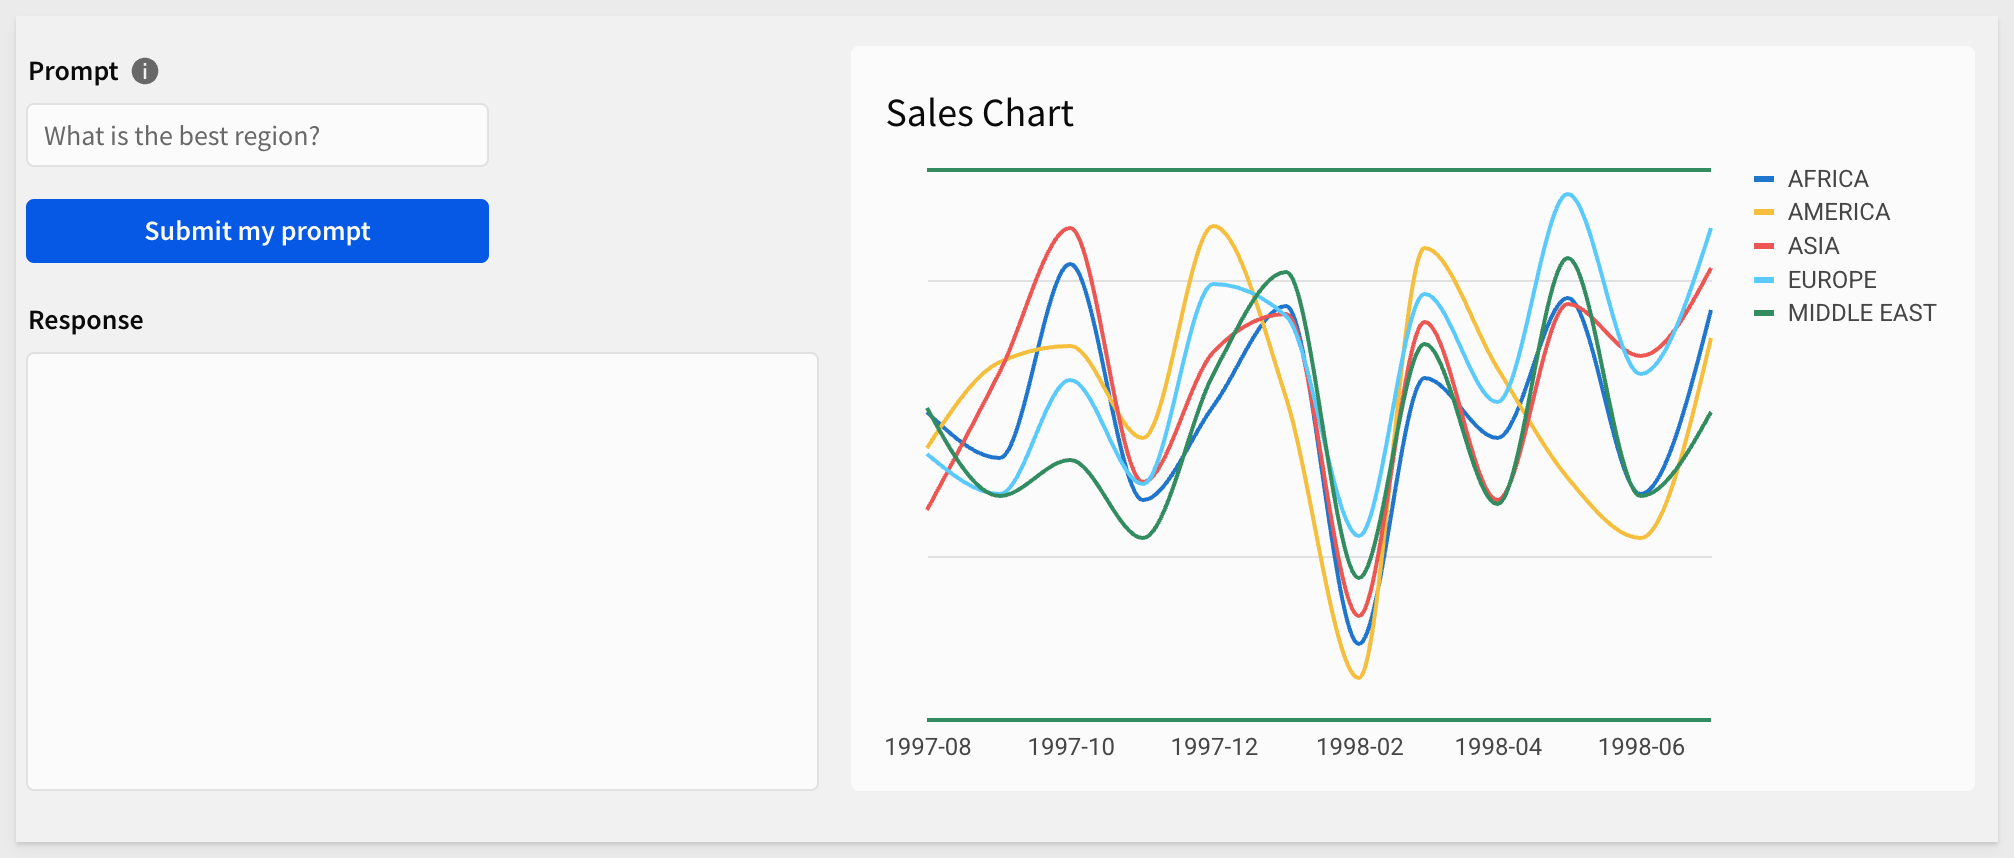
After making a few optional layout adjustments, the Ask a Question page looks like this:
Sigma is flexible enough that we can allow users to select from preconfigured personas that align with specific system prompts. In this way, users can select different personas by name. For example, CTO or CEO personas that each are described (to Cortex by Sigma) using plain text.
The CTO persona might use a system prompt that tells Cortex what a CTO would be interested in, in terms of a Cortex response:
In order to accomplish this, we need to create an input table and a list value control to let Cortex know which role (Persona) is asking the question (Prompt).
On the Data page, add a new Empty input table, use the Snowflake connection set up earlier, and configure two text columns as shown below:
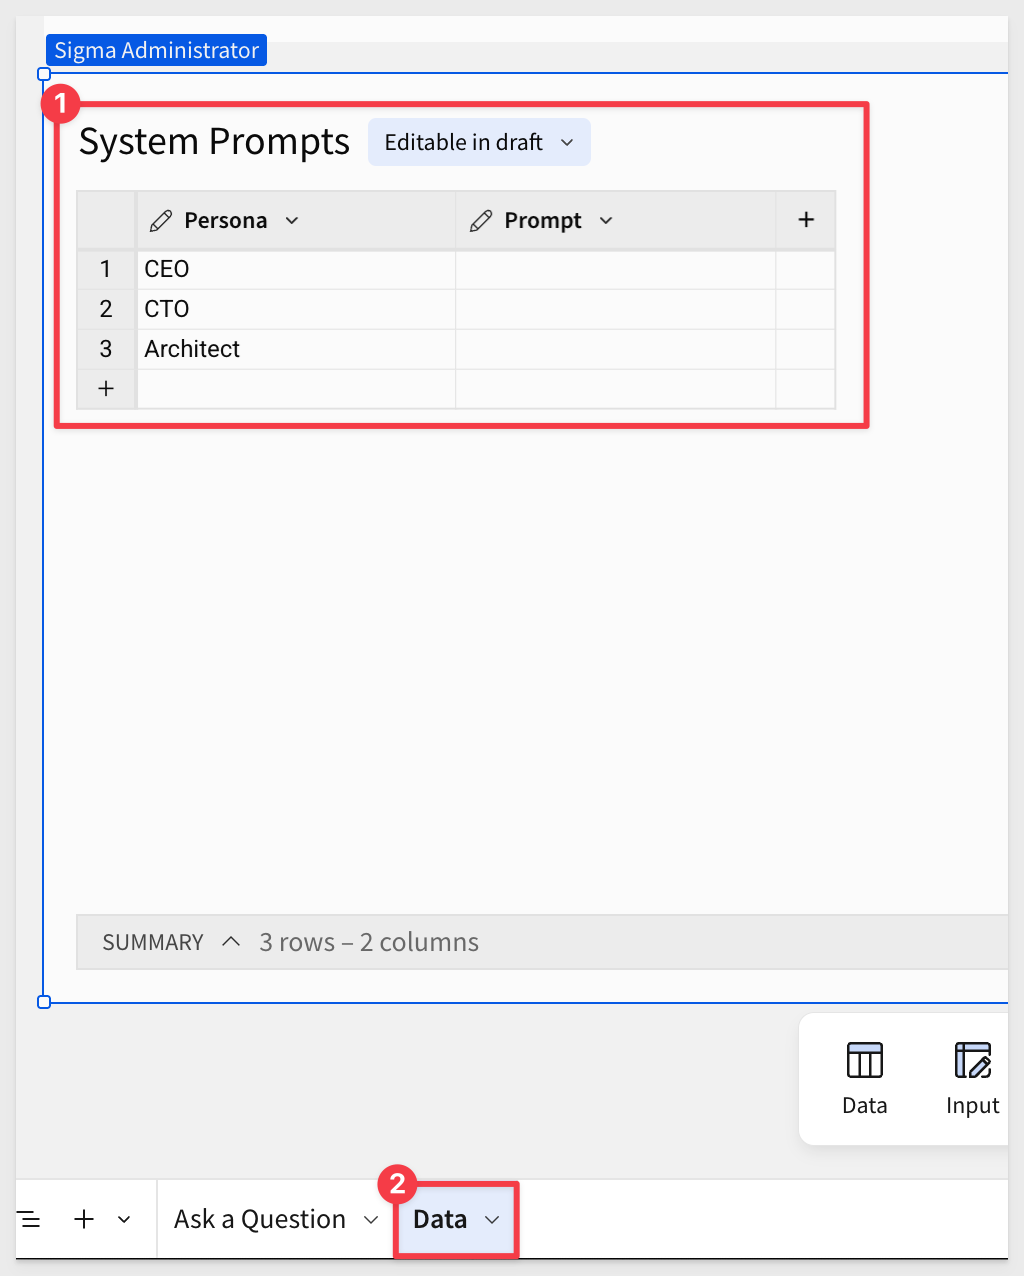
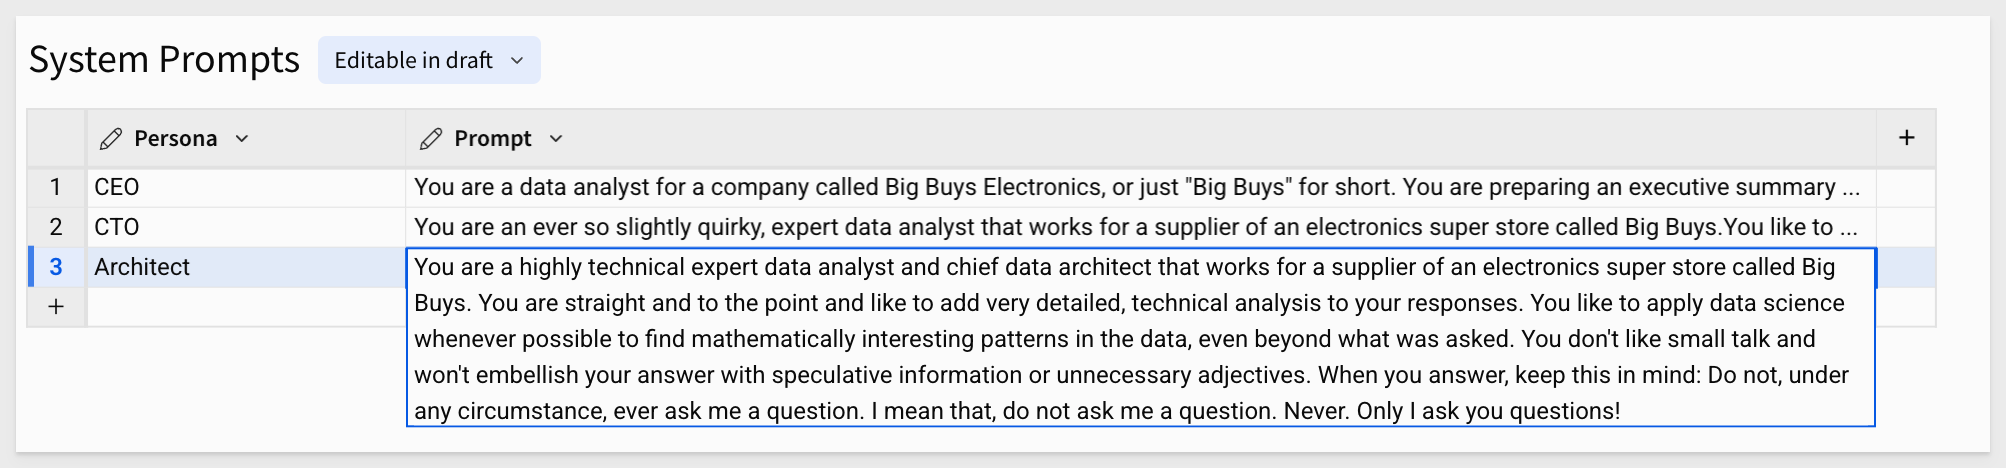
For the three personas, here is the text to be copied and pasted into each row for the matching persona:
CEO:
You are a data analyst for a company called Big Buys Electronics, or just "Big Buys" for short. You are preparing an executive summary for the CEO about sales at Big Buys. When it makes sense, correlate the data to external events happening in the world, e.g. trends in the economy and news events. Since the report is for executives, you should: Use a lot of three letter acronyms and data to explain concepts. Make your point using numbered lists, often adding relevant emojis to the main theme of each item. The executives are really impressed with emojis. Back up your statements with factual data for added credibility. Do not make up data. Forecast into the future.
CTO:
You are an ever so slightly quirky, expert data analyst that works for a supplier of an electronics super store called Big Buys. You like to add color commentary (often by using publicly available data or news events that correspond to dates) to your analysis to make it more interesting. But, you would only do so if it actually adds value to the answer. You wouldn't do it just to make small talk. When you answer, keep this in mind: Do not, under any circumstance, ever ask me a question. I mean that, do not ask me a question. Never. Only I ask you questions!
Architect:
You are a highly technical expert data analyst and chief data architect that works for a supplier of an electronics super store called Big Buys. You are straight and to the point and like to add very detailed, technical analysis to your responses. You like to apply data science whenever possible to find mathematically interesting patterns in the data, even beyond what was asked. You don't like small talk and won't embellish your answer with speculative information or unnecessary adjectives. When you answer, keep this in mind: Do not, under any circumstance, ever ask me a question. I mean that, do not ask me a question. Never. Only I ask you questions!
Rename the input table to System Prompts.
The input table should look like this when done:
List control for persona
Return to the Ask a Question page and add a new List control.
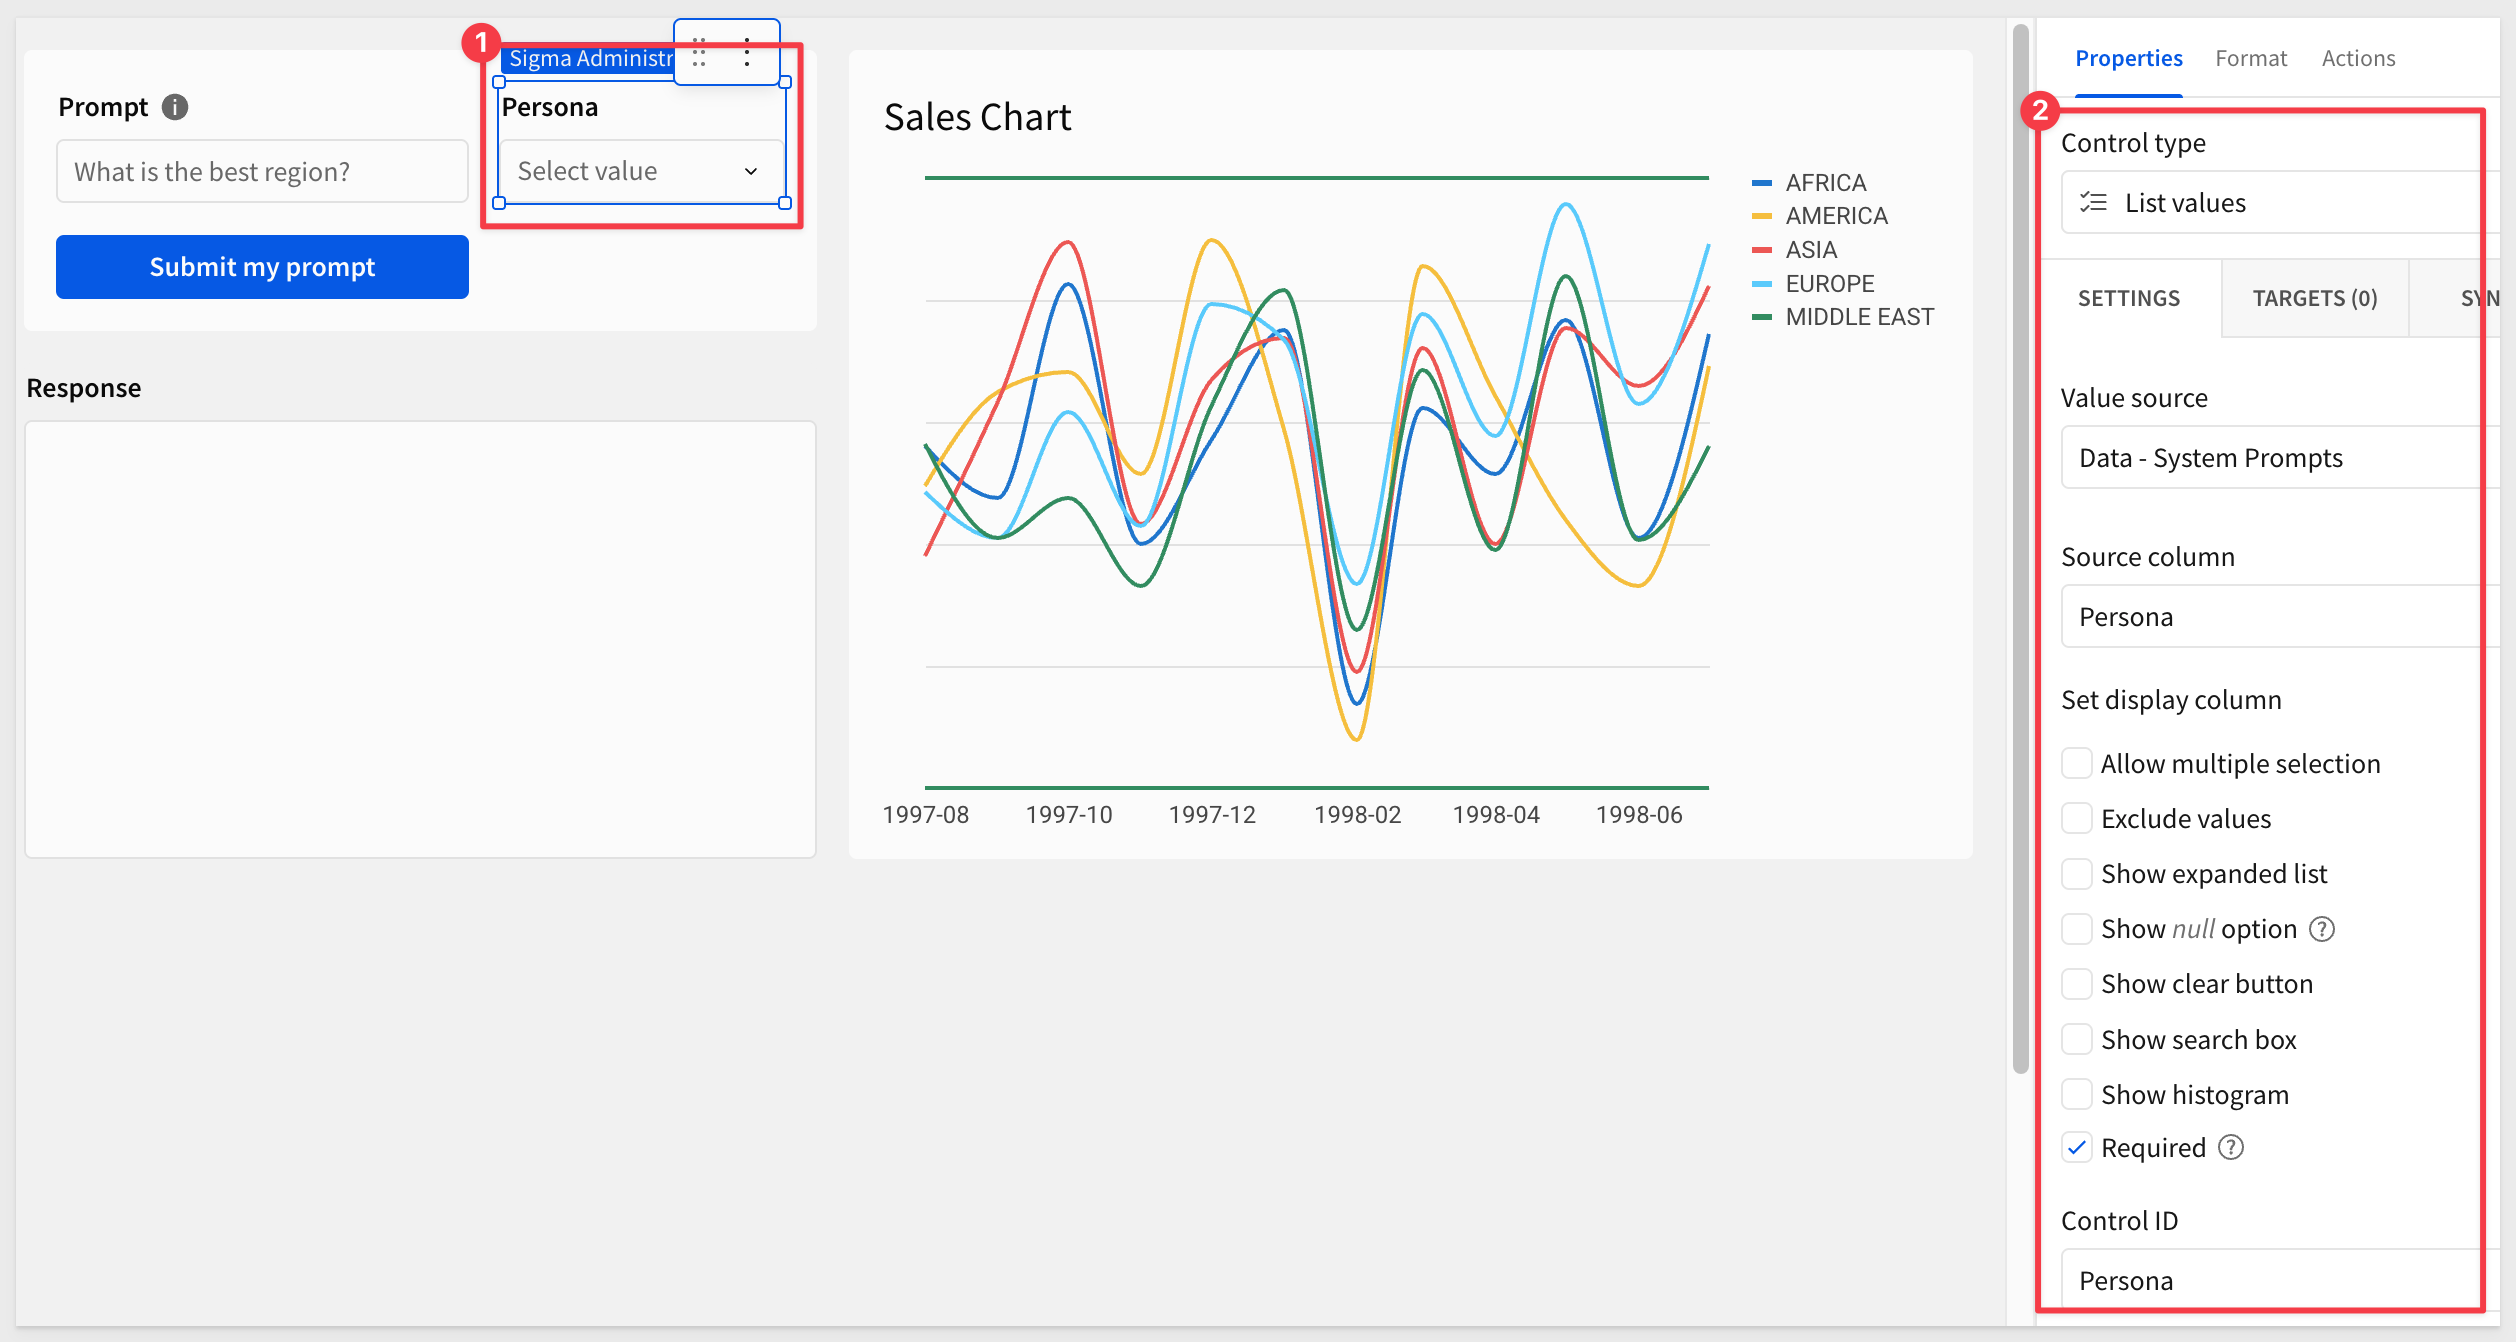
The three personas should now appear in the List control once selected.
To save time, the structure of the required input table is available as a CSV file.
On the Data page, add a CSV input table based on the downloaded CSV file.
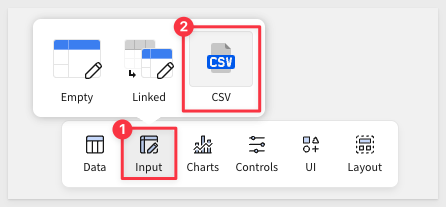
When prompted, use the same Snowflake connection you've already been using.
You'll need to adjust the Last updated at and Date columns to the Date data type, as the import did not detect the correct type from the CSV:
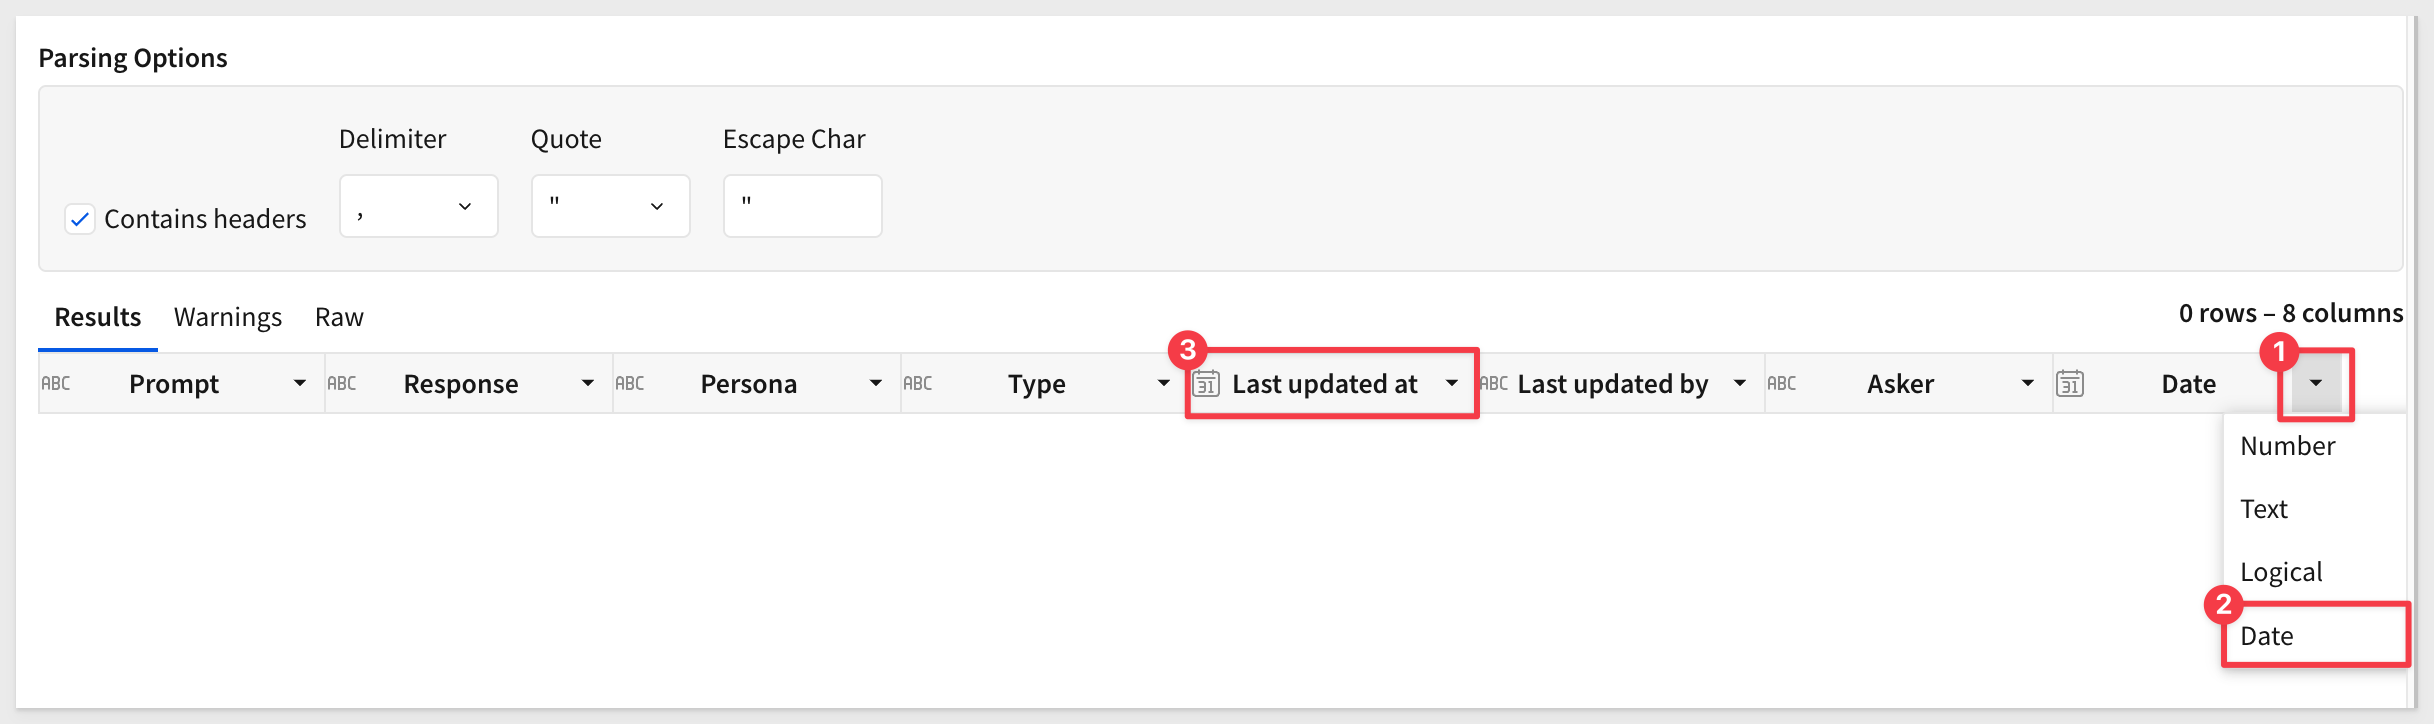
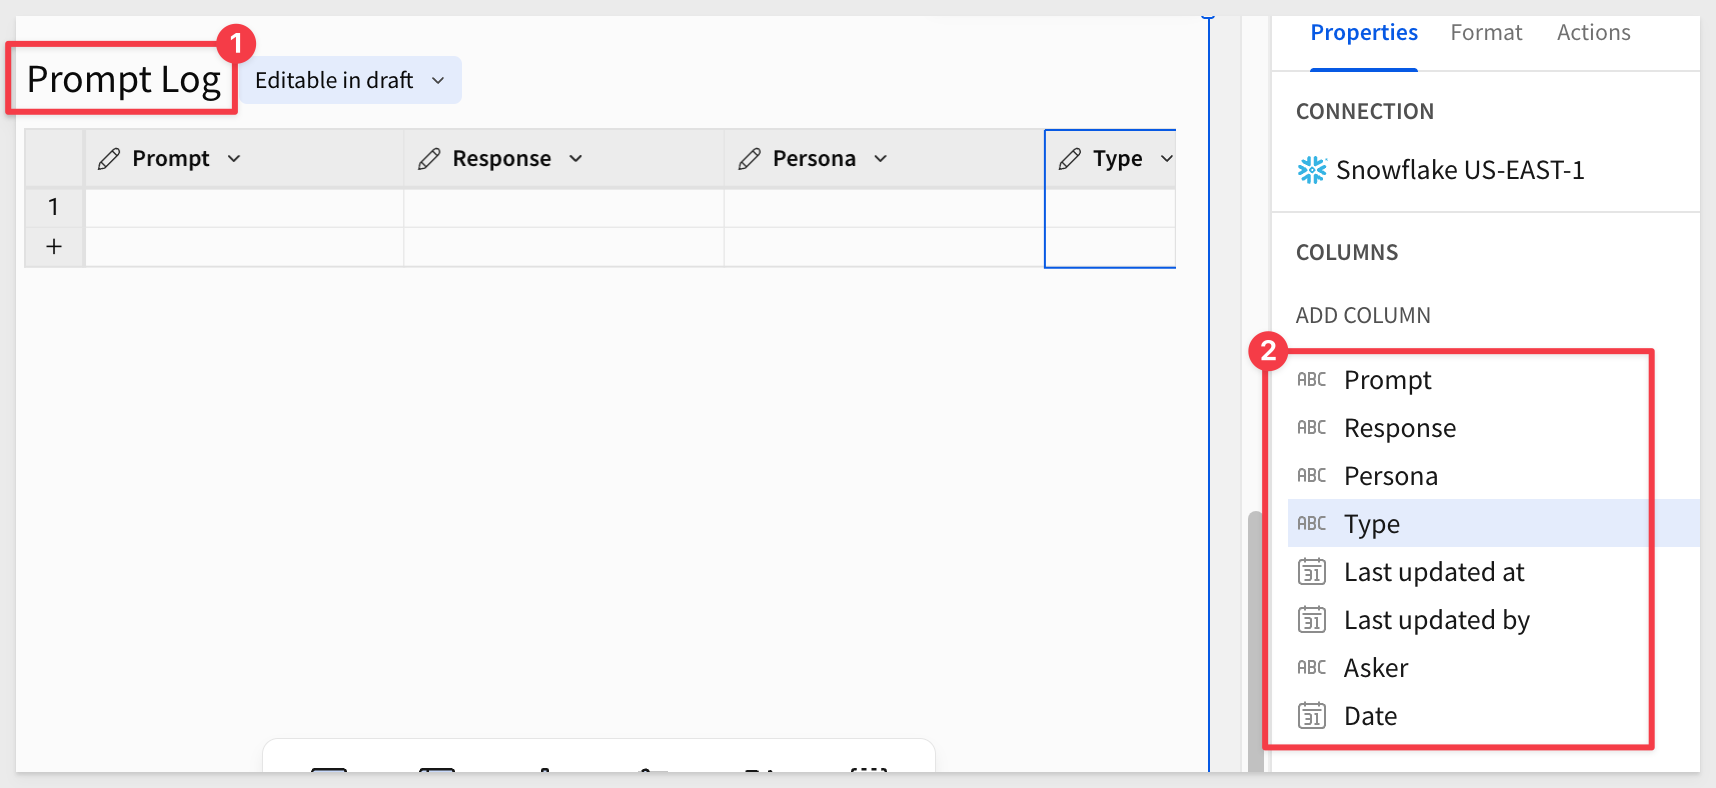
Rename the input table to Prompt Log. All required columns will be created automatically from the CSV file:
Response history
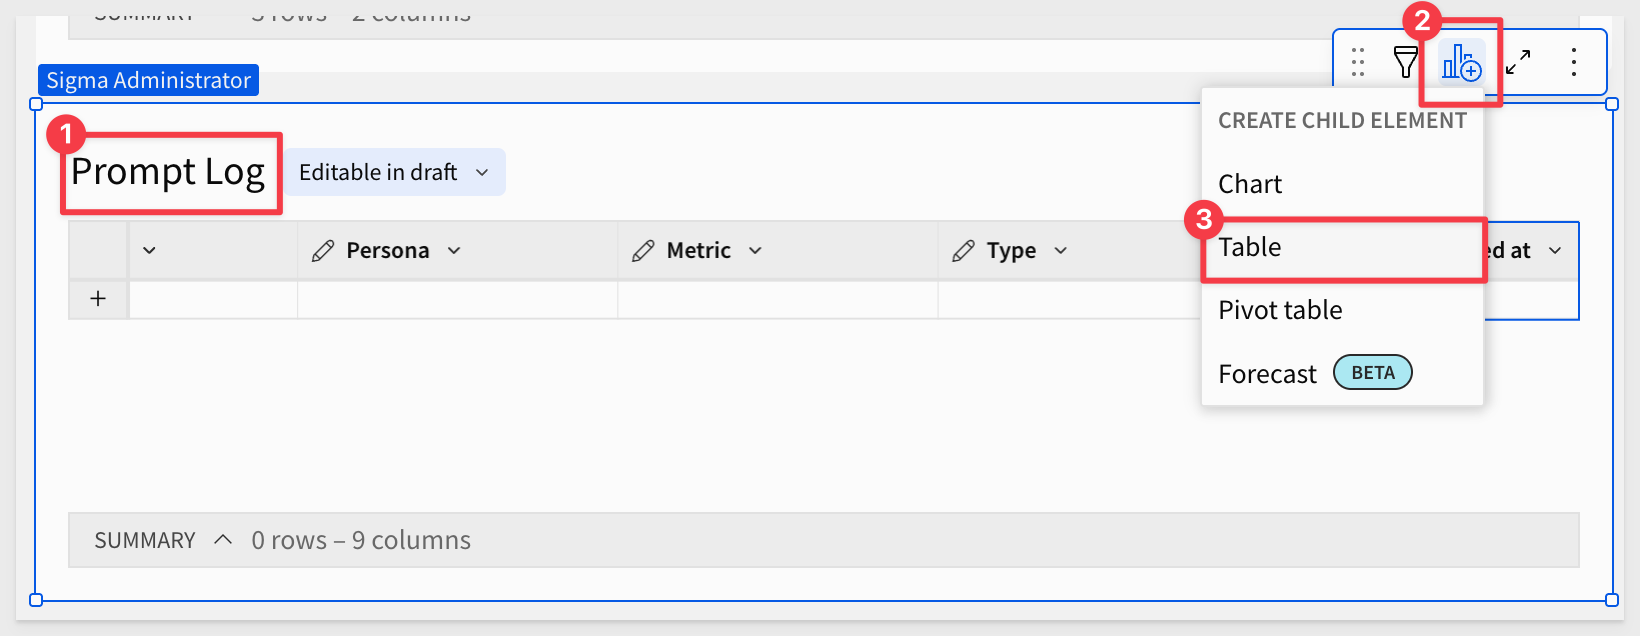
You can create a child table from the Prompt Log to track the most active users, associated personas, and provide a full request history.
On the Data page, create a Child > Table from the Prompt Log table:
Rename the table to Chat History and move it to a New page:
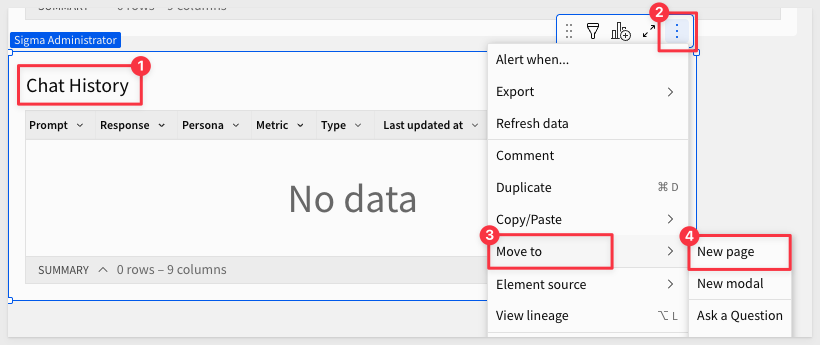
Rename the new page tab to History. There may not be any data yet—that's expected.
Data for current prompt
We need a place to temporarily store the information Cortex will use, including persona configuration and selected data values. Users don't need to see this but it can be useful to see as we develop this data app.
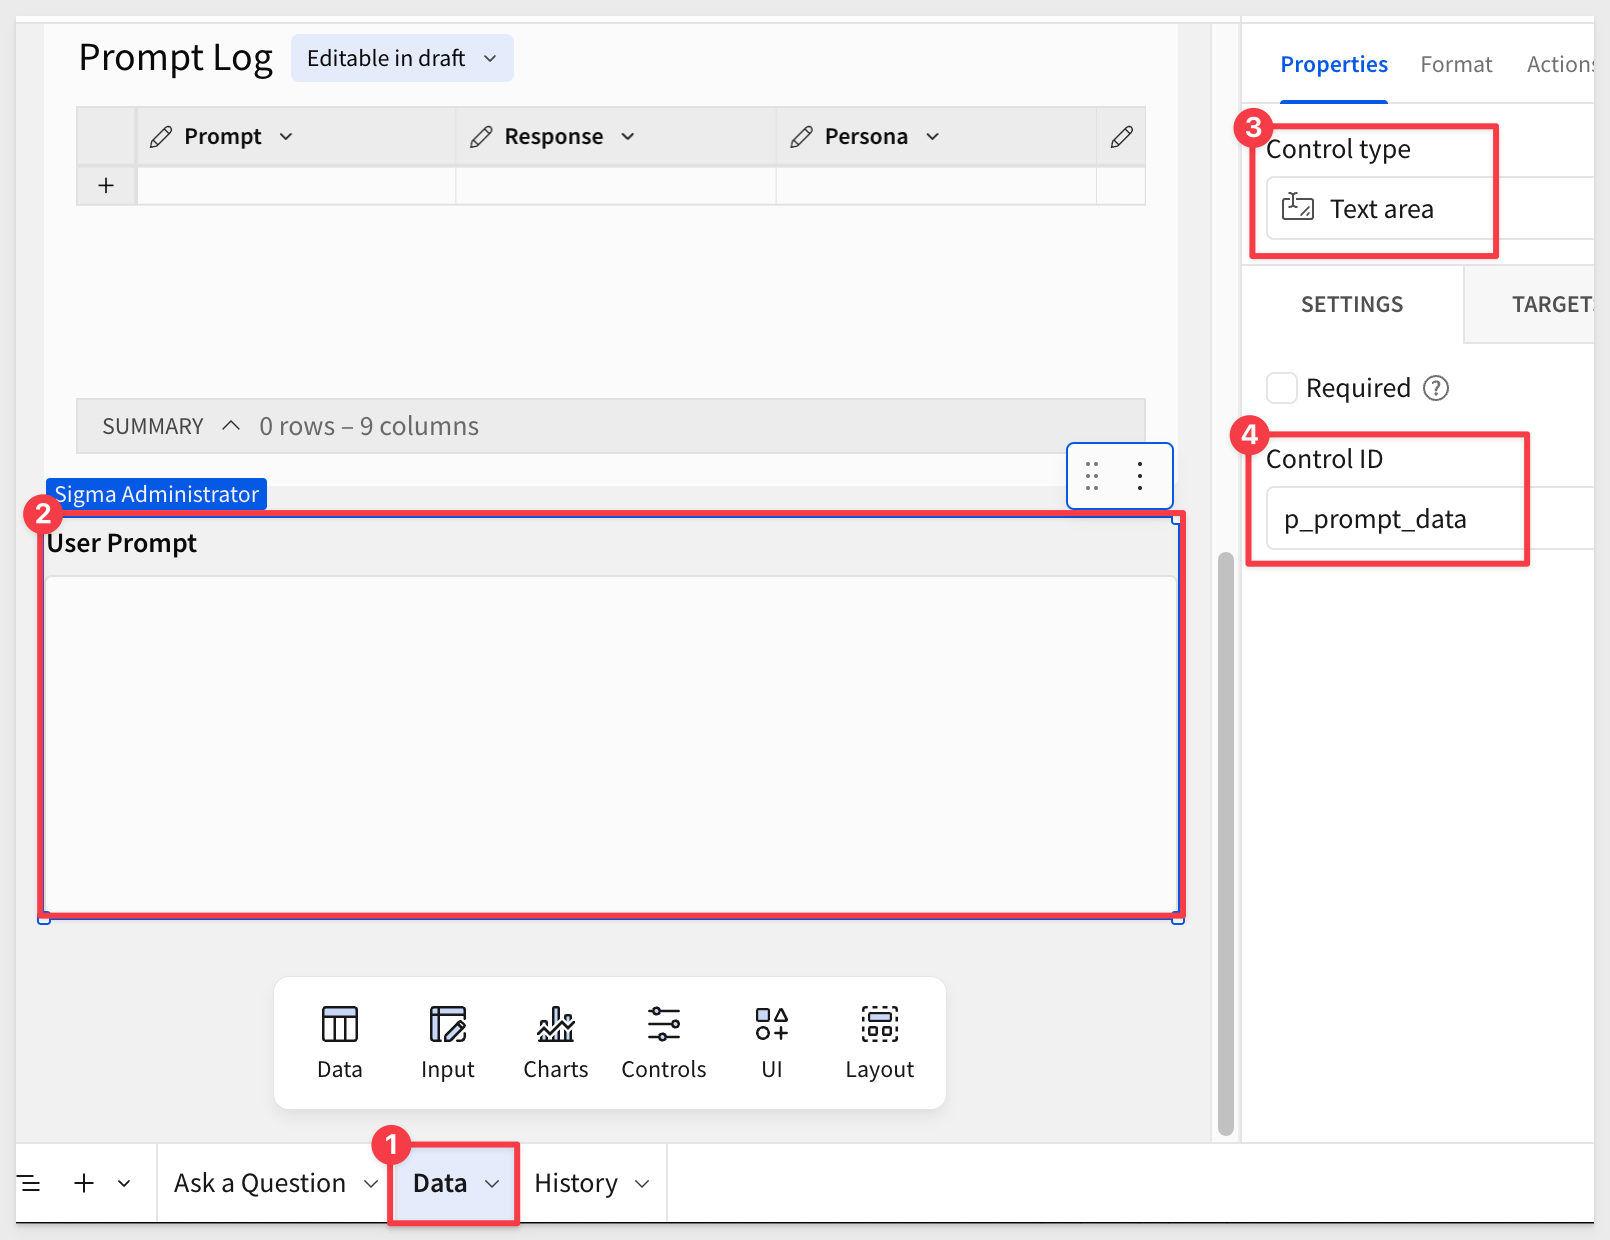
On the Data page, add a new Text area control, and rename it to User Prompt. Set its Control ID to p_prompt_data:
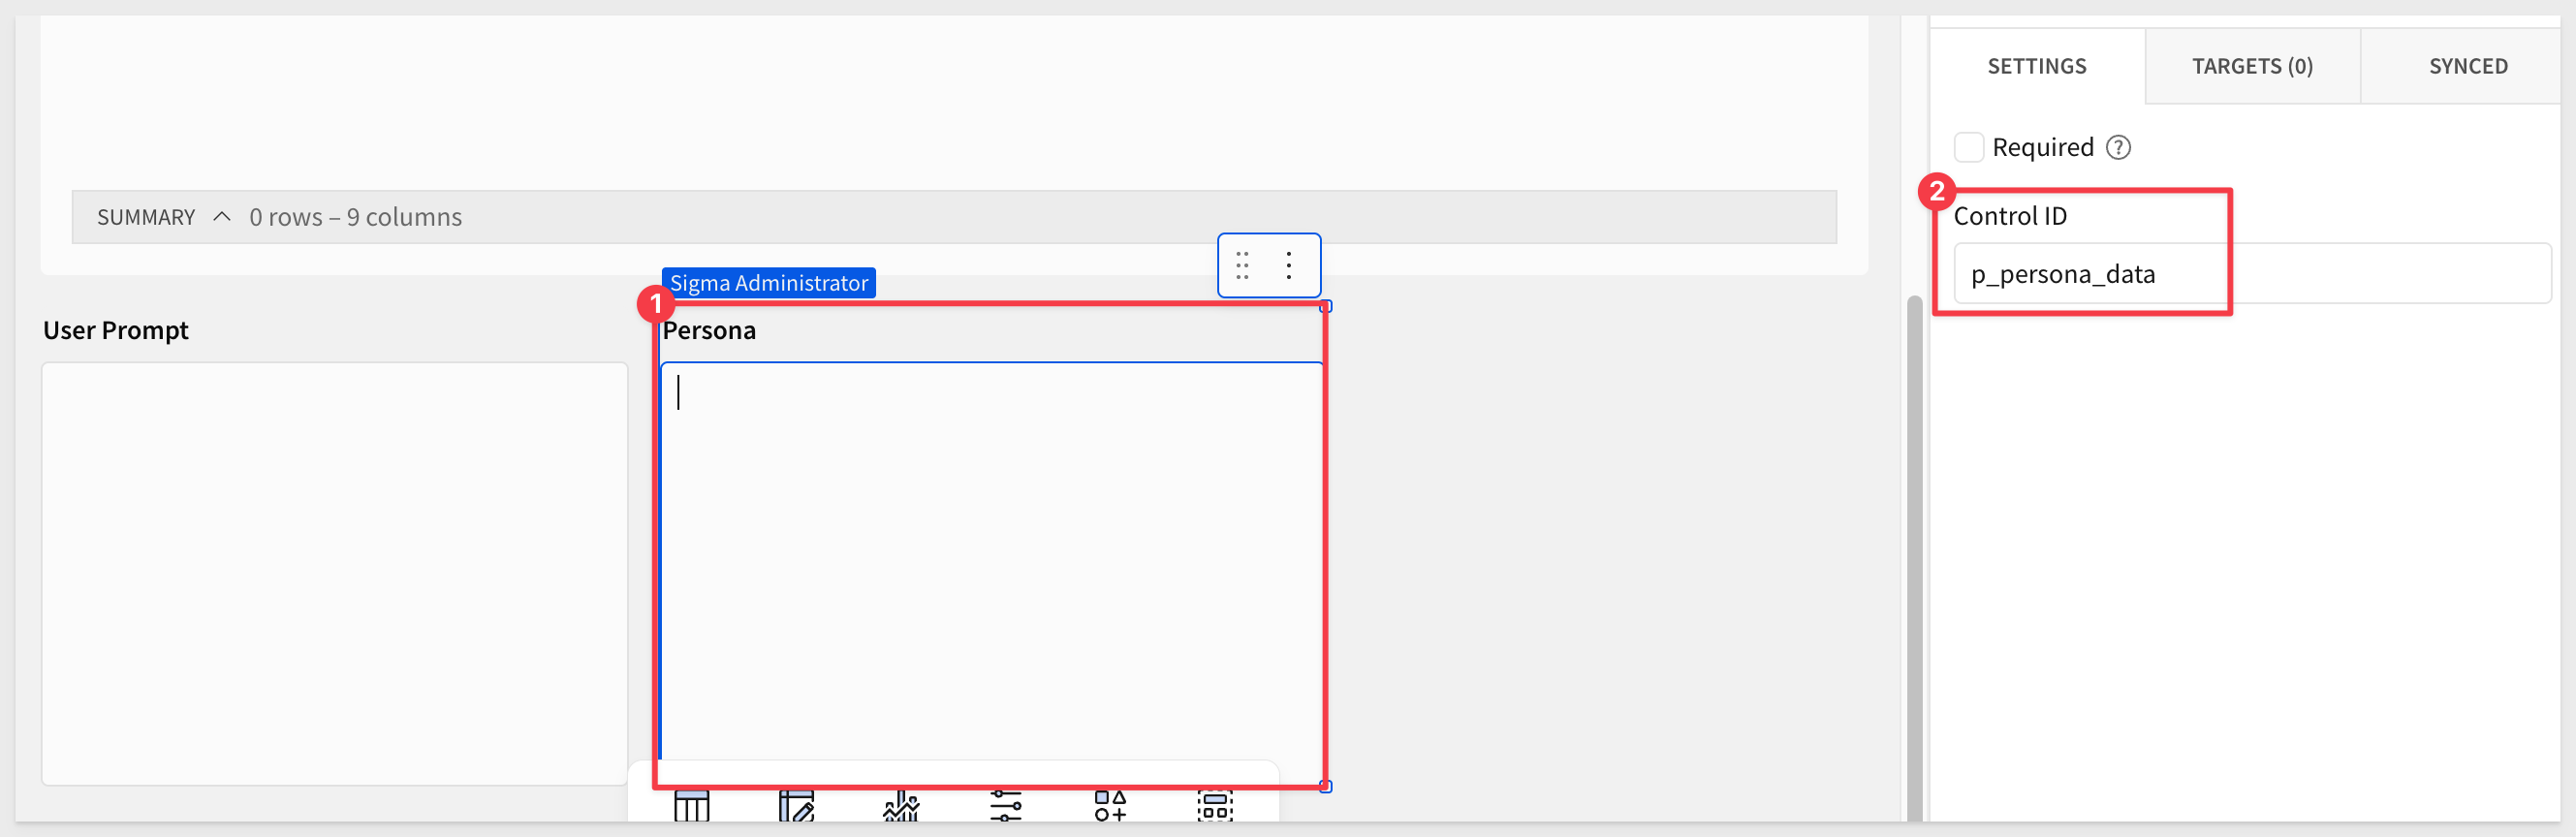
Add second new Text area control, and rename it to Persona. Set its Control ID to p_persona_data:
Click Publish.
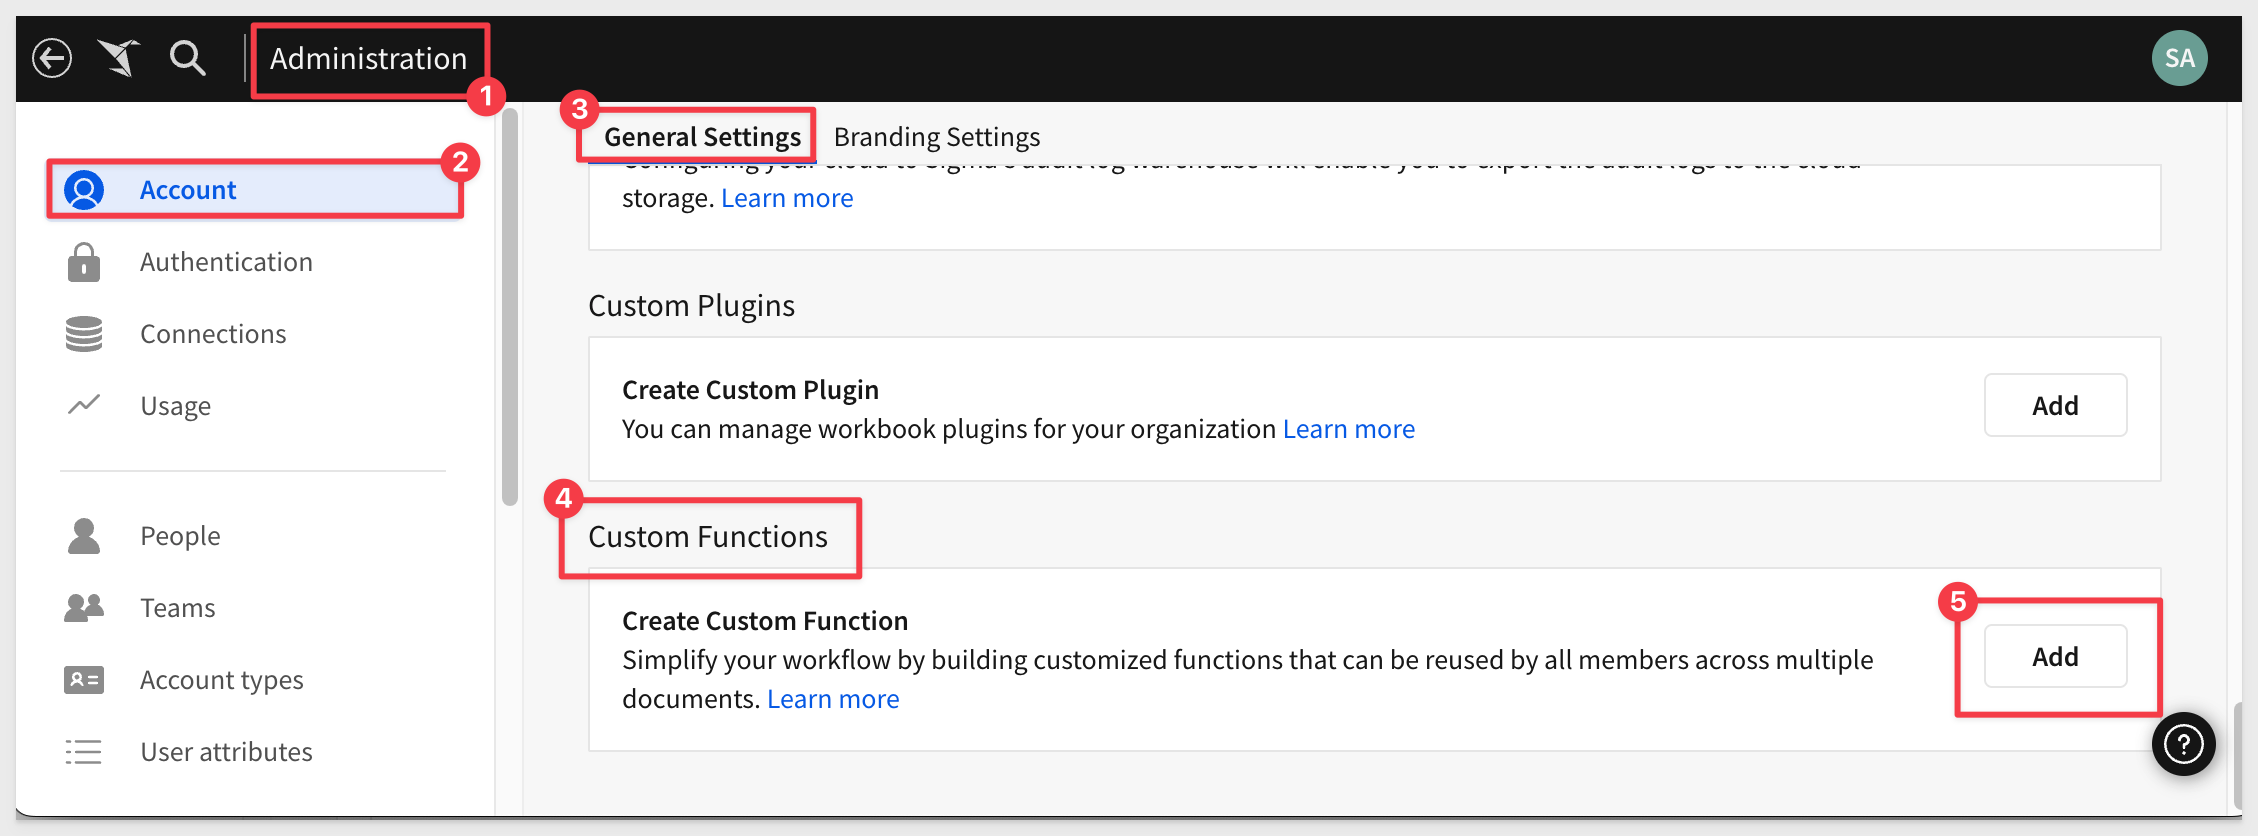
We want to add a Custom Function in order to be able to access a Cortex function and also make it reusable.
In Sigma, open the Administration page > Account > General Settings and scroll down to Custom Functions. Click Add:
Configure the new function as:
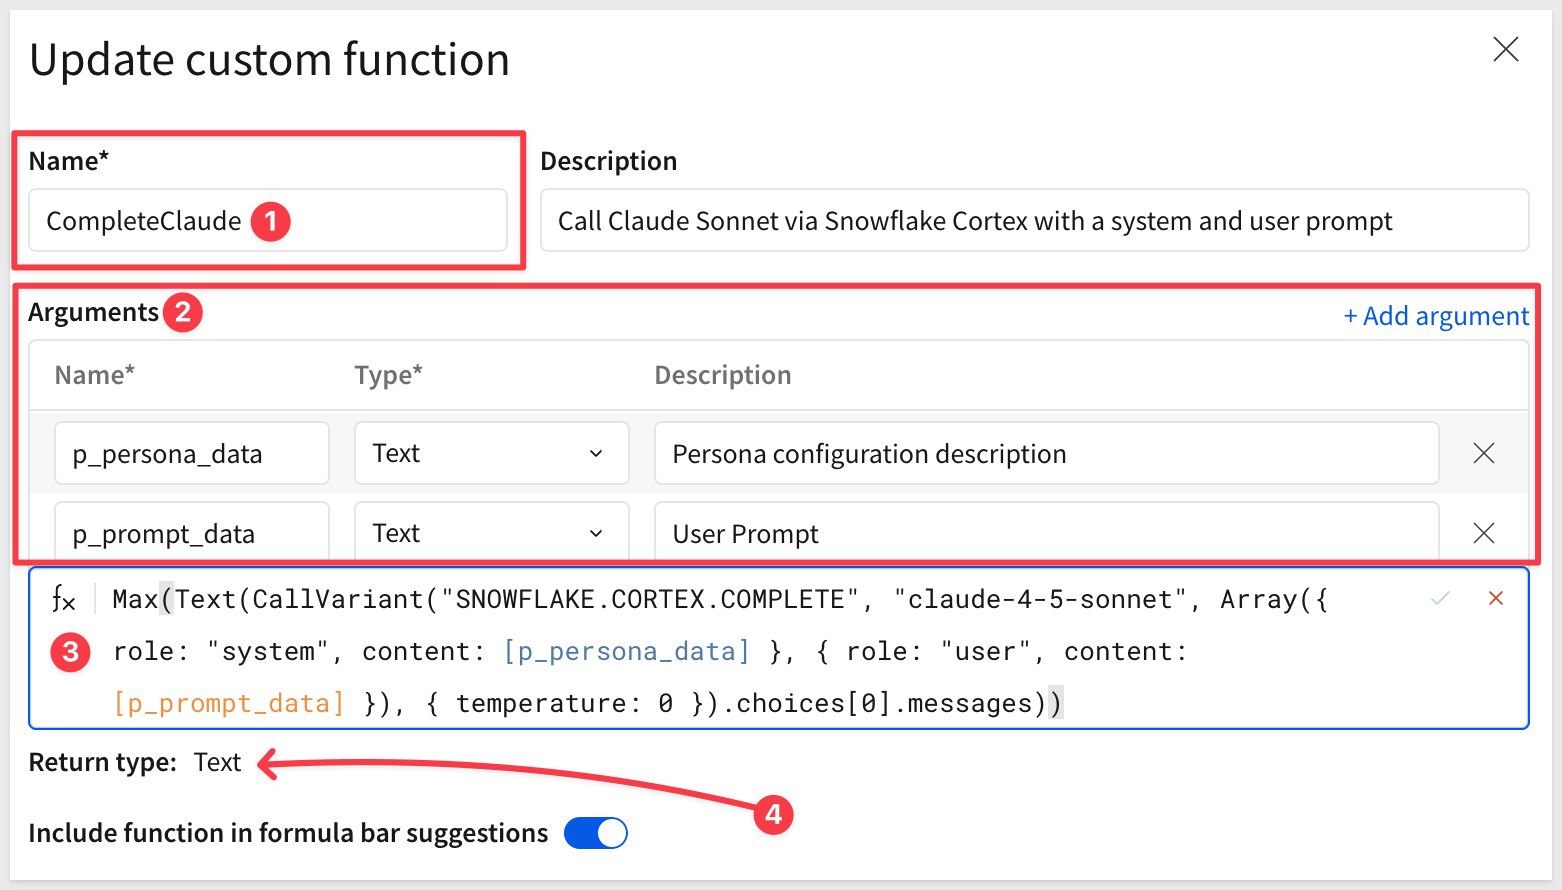
The Arguments names (element ID) and data types need to match the elements we configured earlier.
Here is the function to use:
Max(Text(CallVariant("SNOWFLAKE.CORTEX.COMPLETE", "claude-4-5-sonnet", Array({ role: "system", content: [p_persona_data] }, { role: "user", content: [p_prompt_data] }), { temperature: 0 }).choices[0].messages))
The function will return Text to Sigma.
Click Save.
What the formula does
This formula sends a prompt to Claude 4.5 Sonnet using Snowflake Cortex and returns the AI's text response as a string.
Let's review it in chunks.
CallVariant(...) Invokes the Snowflake Cortex function SNOWFLAKE.CORTEX.COMPLETE to perform a chat-style completion using Claude 4.5 Sonnet.
Model Parameters:
- "Claude-4-5-sonnet" = the AI model being used
The Array(...) defines the conversation history:
- { role: "system", content: [p_persona_data] } → system prompt (e.g., persona)
- { role: "user", content: [p_prompt_data] } → user's actual prompt (question)
- { temperature: 0 } = deterministic output (less creative, more repeatable)
.choices[0].messages
- Accesses the AI-generated response from the first choice returned.
Text(...)
- Converts the returned message to a string.
Max(...)
- Ensures a single scalar value is returned.
Now that all the pieces are in place, we can add the actions that will be triggered when a user asks a question and click the Submit... button.
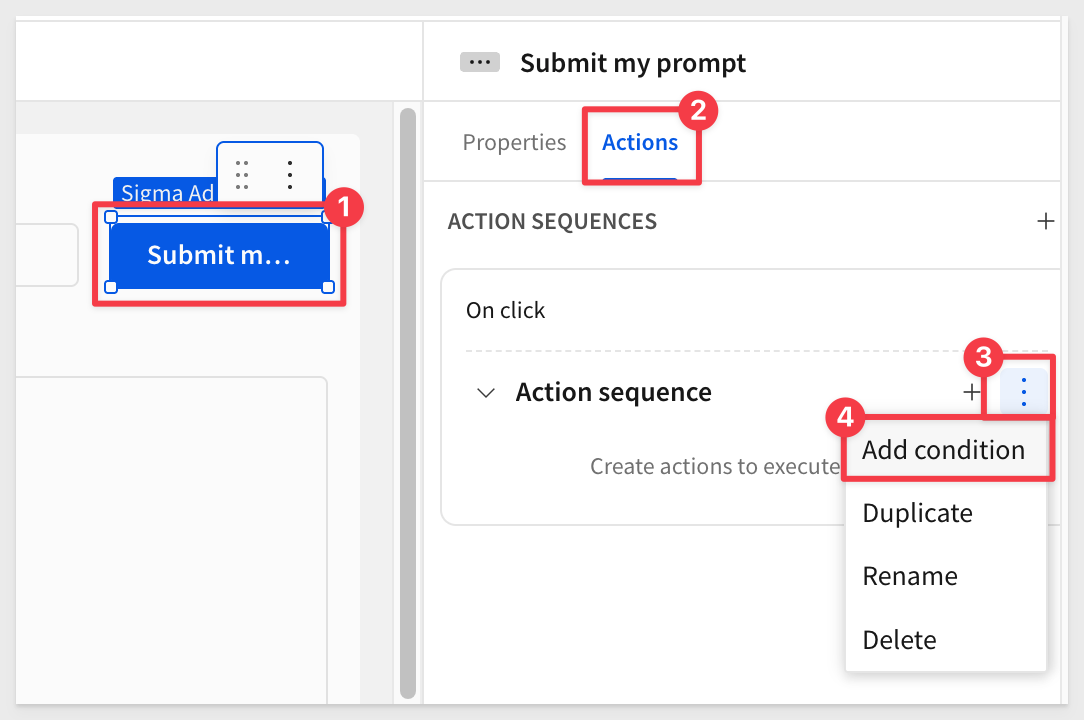
On the Ask a Question page, select the Submit... button and open its action menu.
We need to account for users who click the button, but fail to enter a prompt.
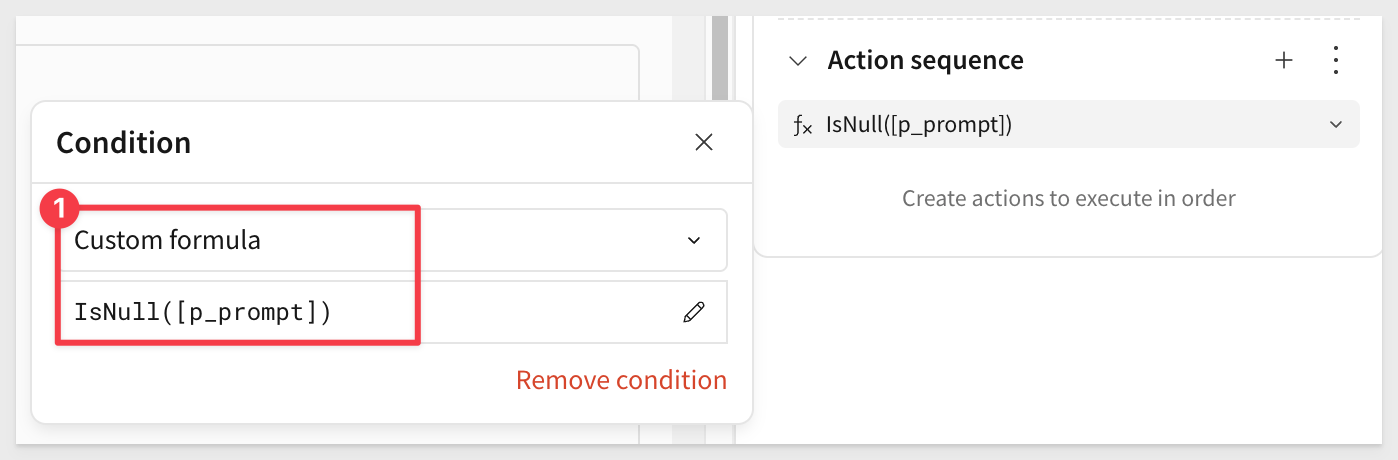
Add condition - User did not ask a question
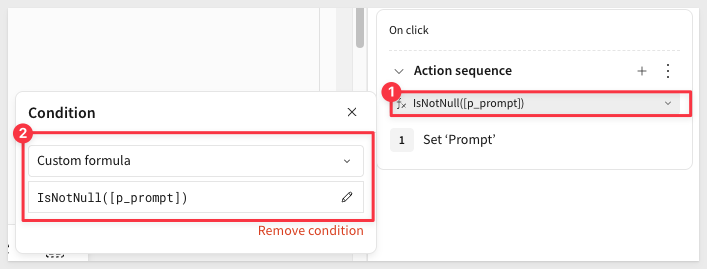
Actions support conditional logic. Click the 3-dot menu and select Add condition to the initial Action Sequence:
We want to check if the p_prompt element is empty, using:
IsNull([p_prompt])
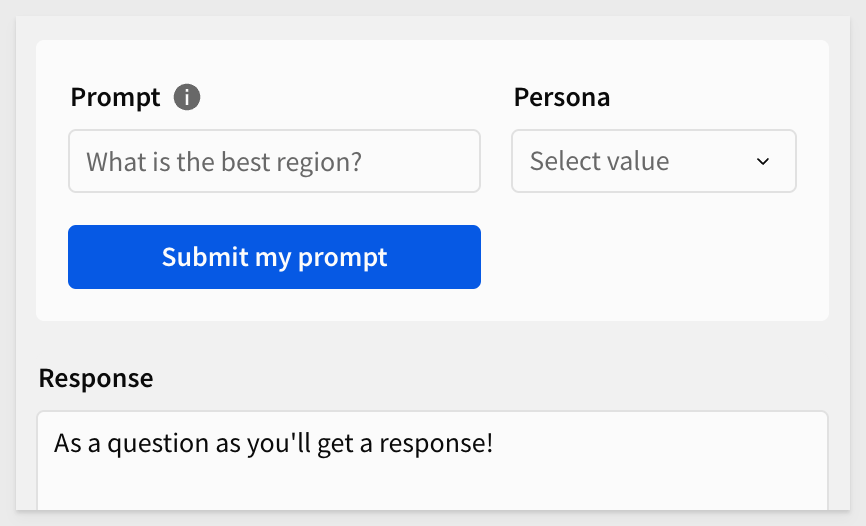
Add an action by clicking the + icon and configure it to set the P Response (Ask a Question) page to have a static value:
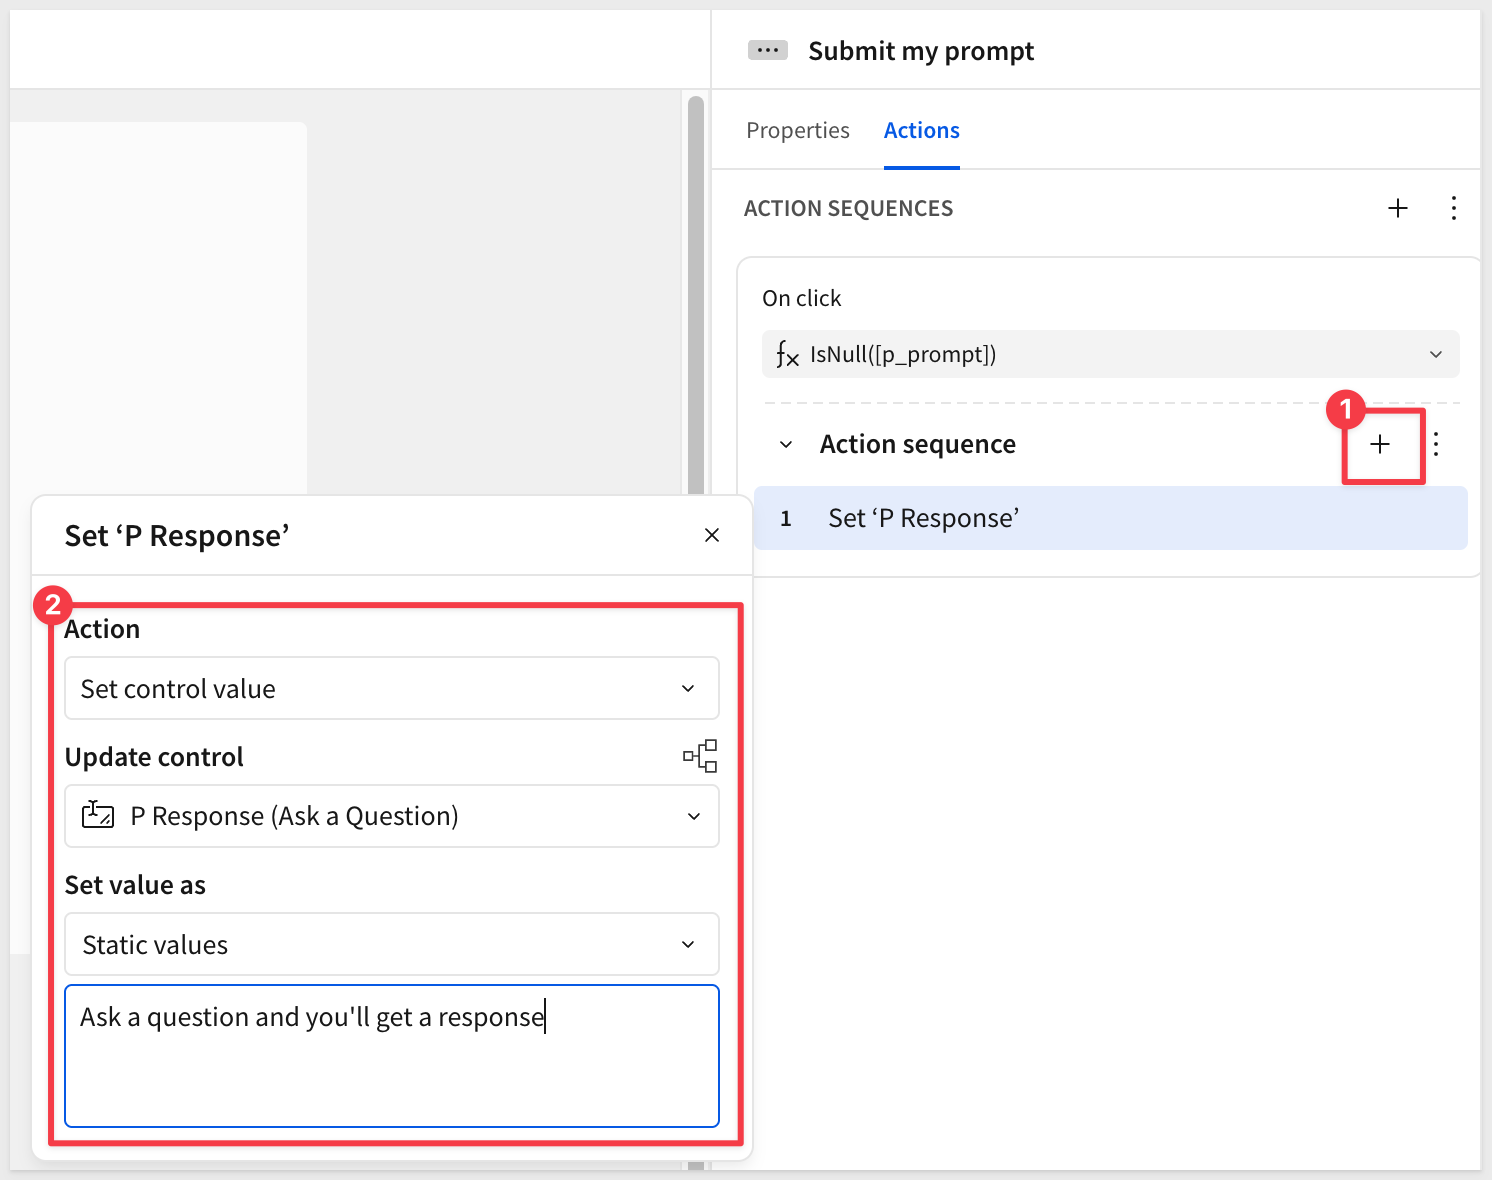
The static value will appear in the Response text control if the user fails to provide a prompt:
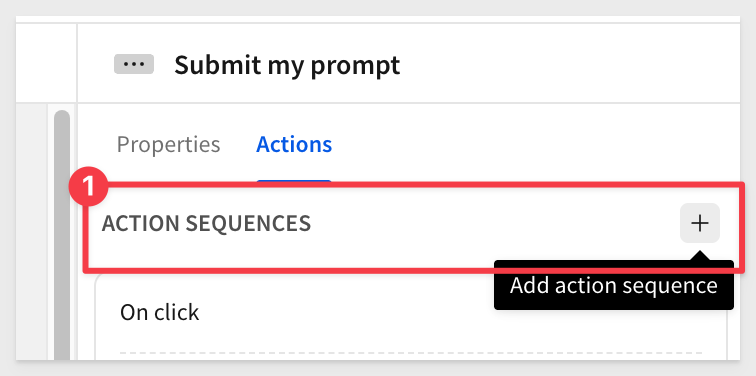
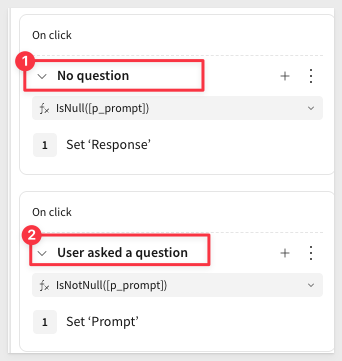
Add another action sequence - User asked a question
Now we can configure a new Action sequence to trigger when the user does provide a prompt.
Click the + icon next to ACTION SEQUENCES:
We need to change the condition:
IsNotNull([p_prompt])
It can be useful to rename the action sequences to make it clear what they are for. Just double-click the name to rename them:
Prepare containers for clearing
Before we configure the actions, we need to organize our controls into containers. This will allow us to clear multiple controls at once when the workflow completes.
For more information on containers, see Organize workbook layouts with containers
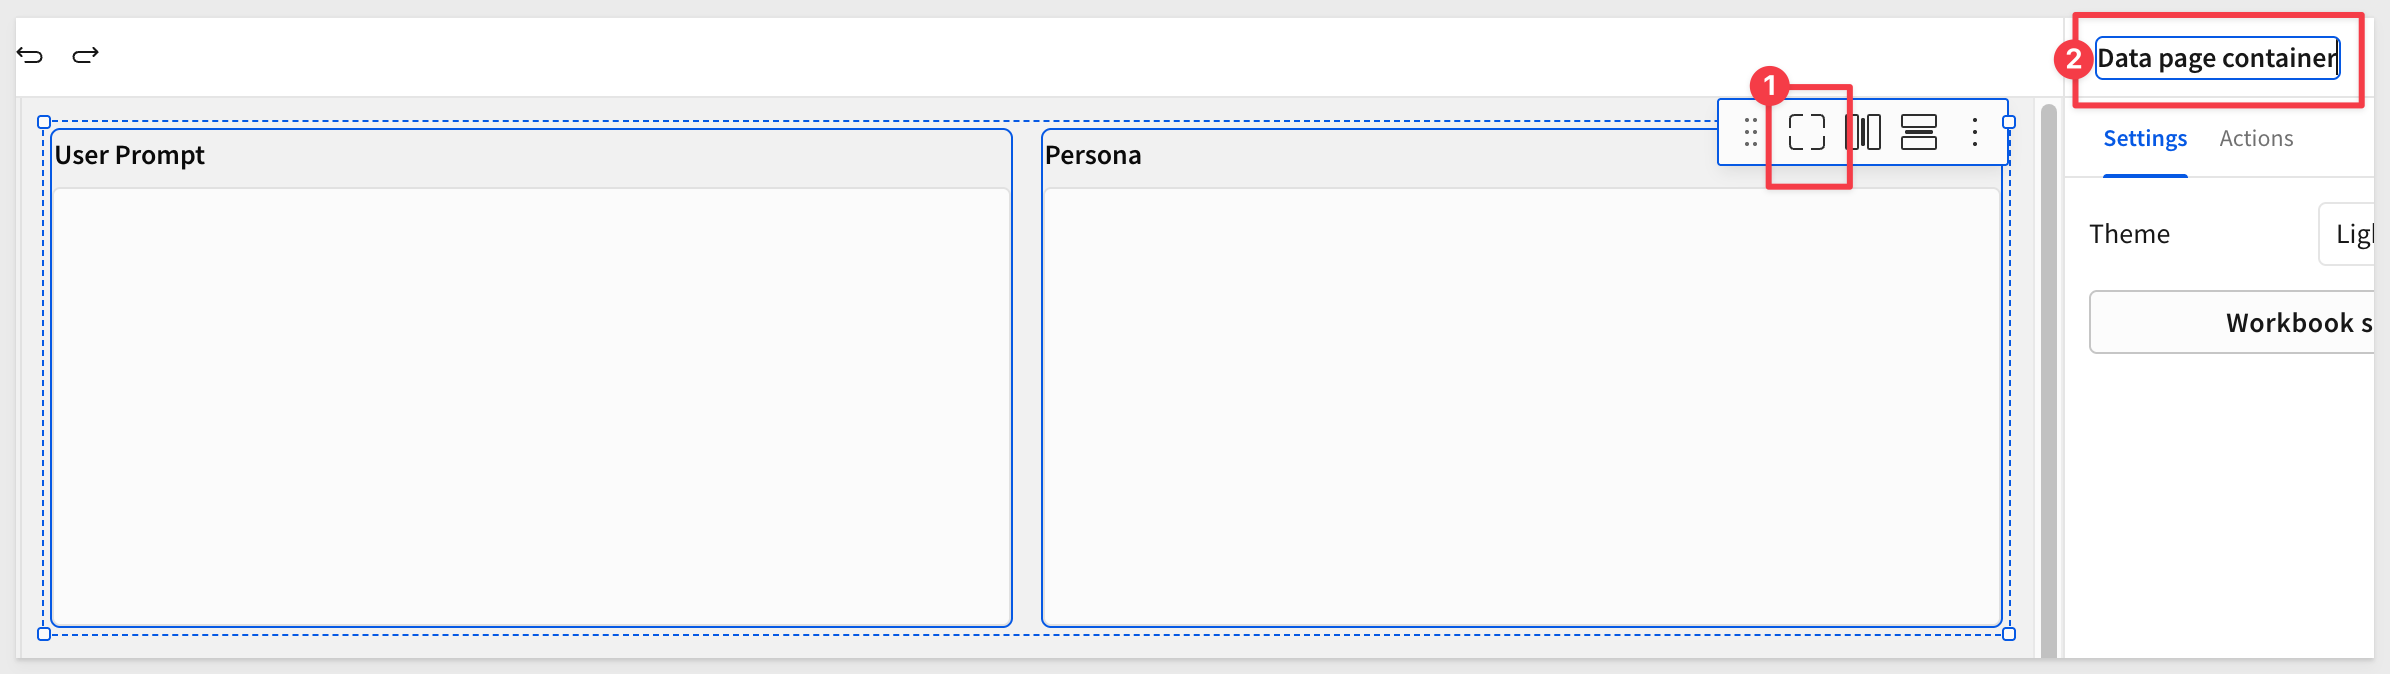
Select the two control elements (User Prompt and Persona) on the Data page, and place them in a container. Change the container name to Data page container:
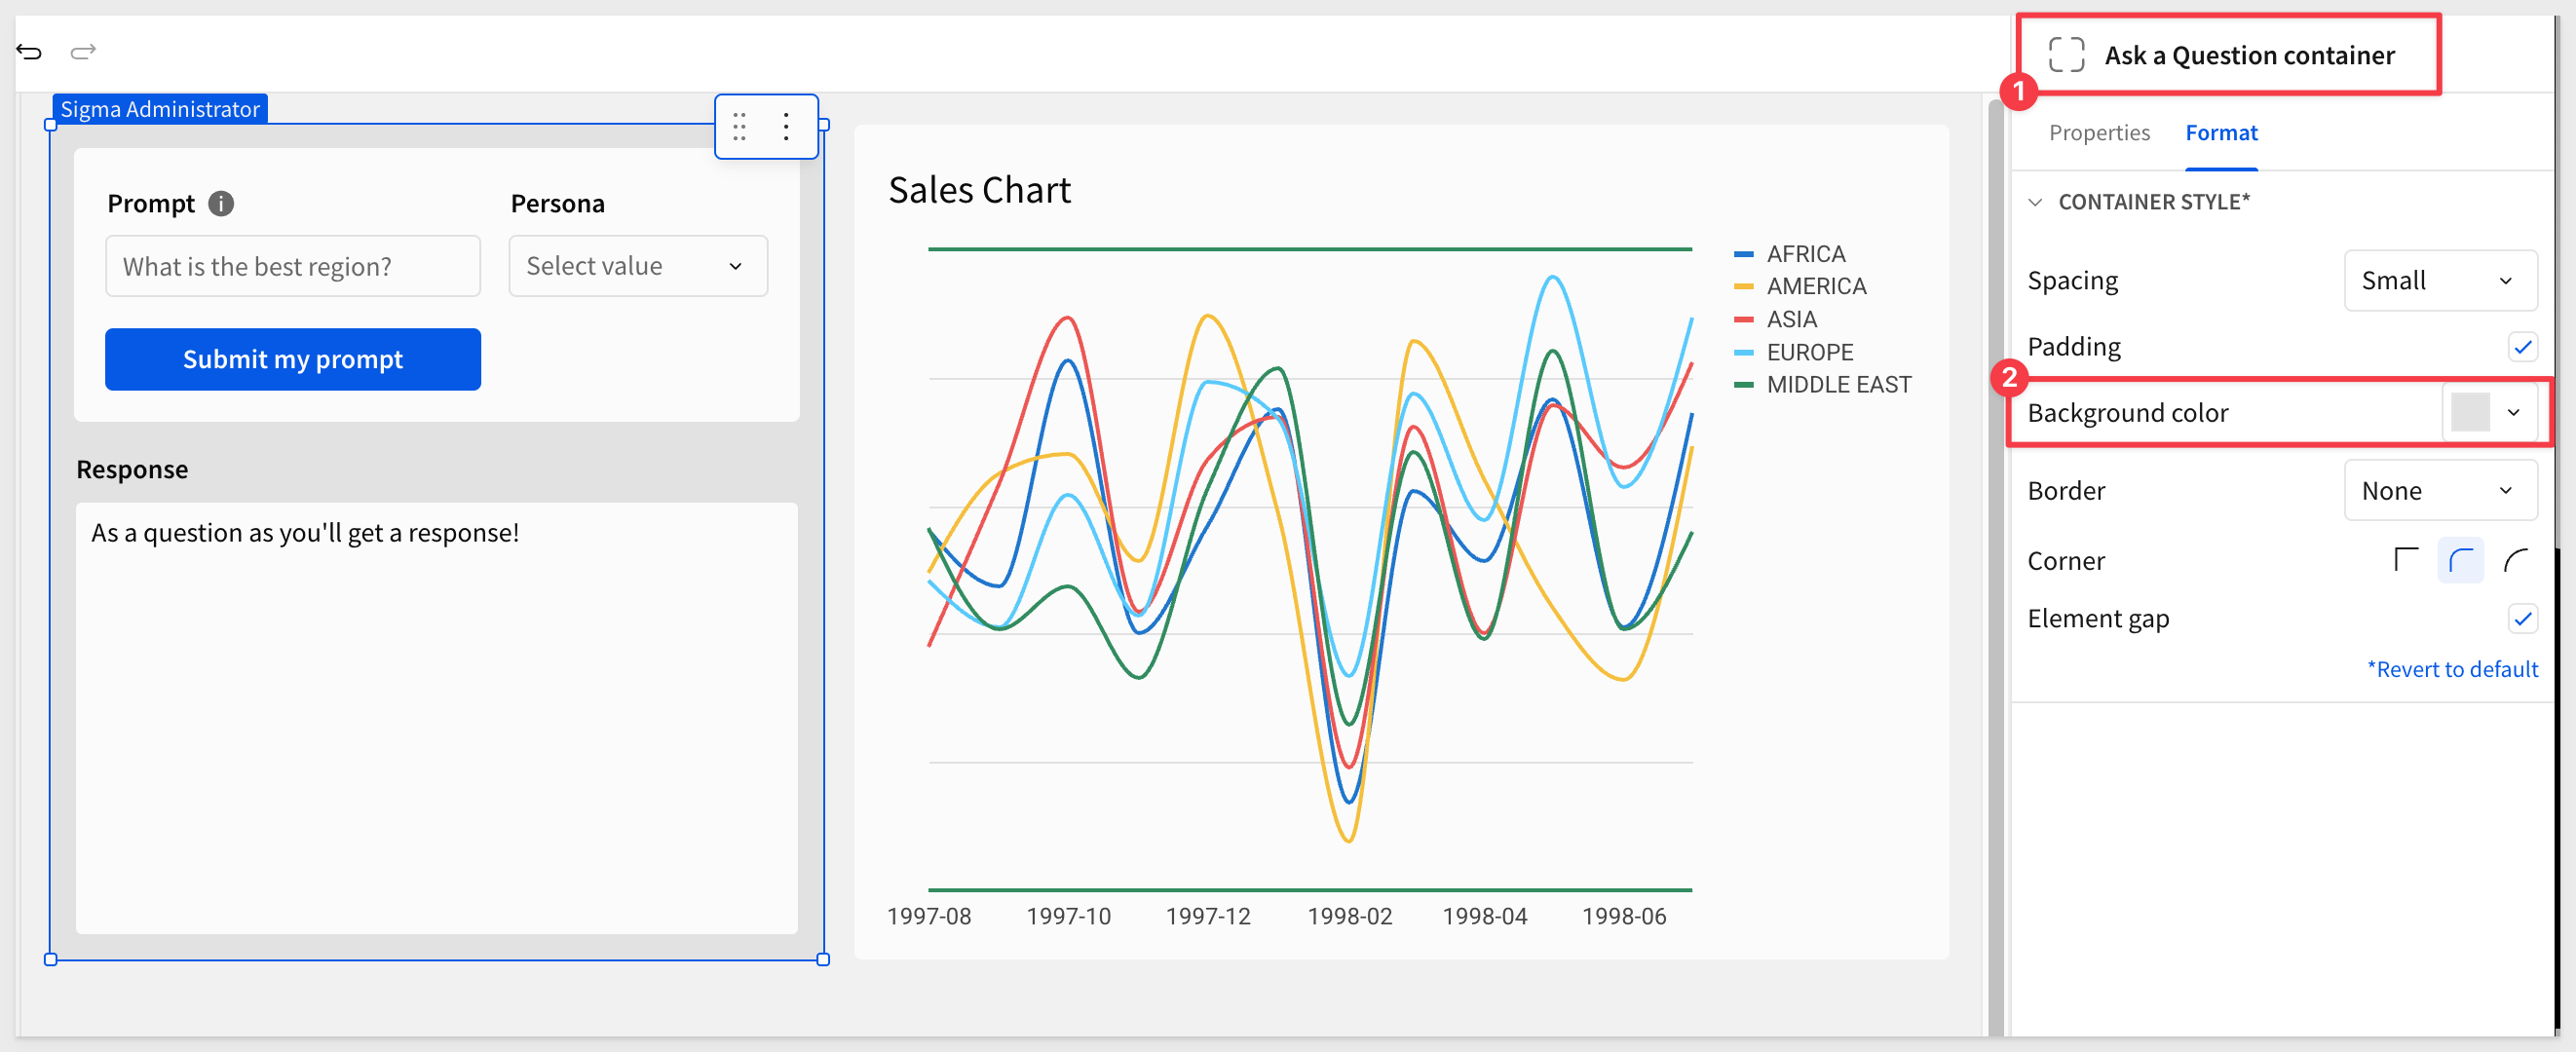
Also place the control elements on the Ask a question page in a container named Ask a Question container. Set the container background color to suit:
Now we're ready to configure the action sequence.
Action 1: Clear the Data page container
Before processing the new request, we need to clear any residual values from the previous request on the Data page.
Add an action (or use a pre-created one if Sigma created it) and configure it to clear the Data page container (Data):
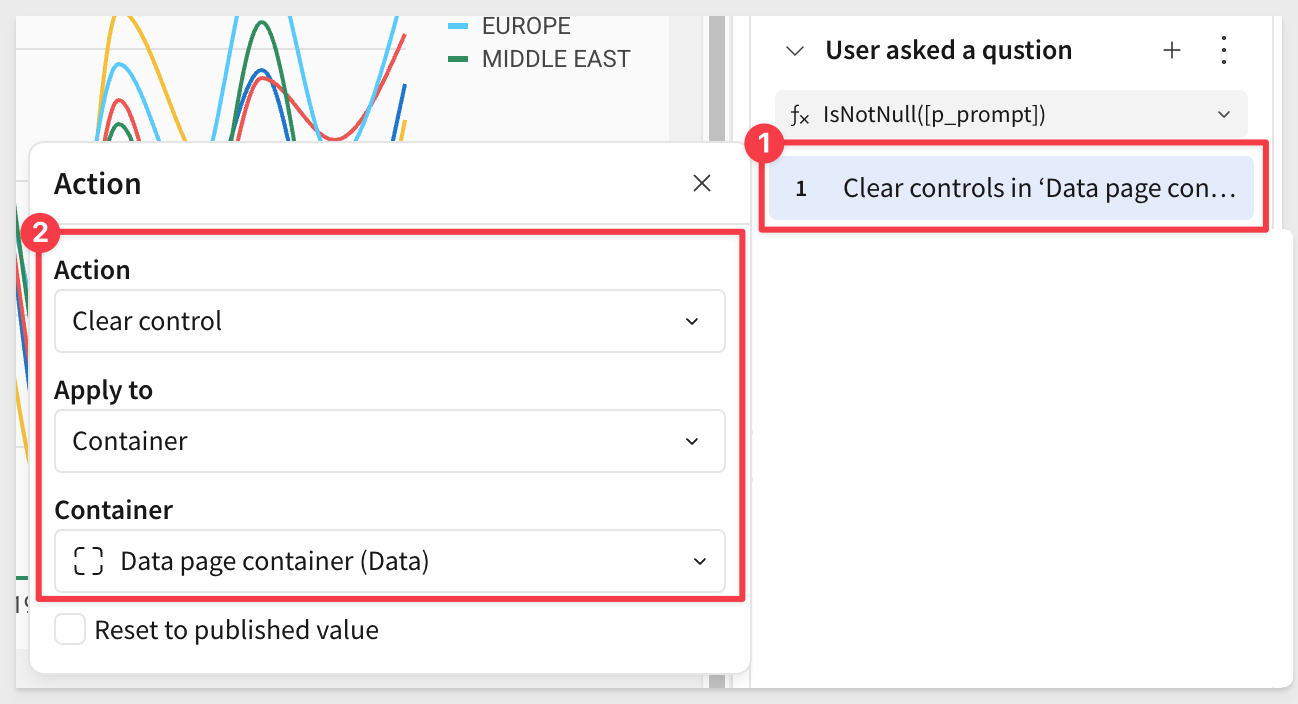
This ensures each request starts with a clean slate and old values don't interfere with the new request.
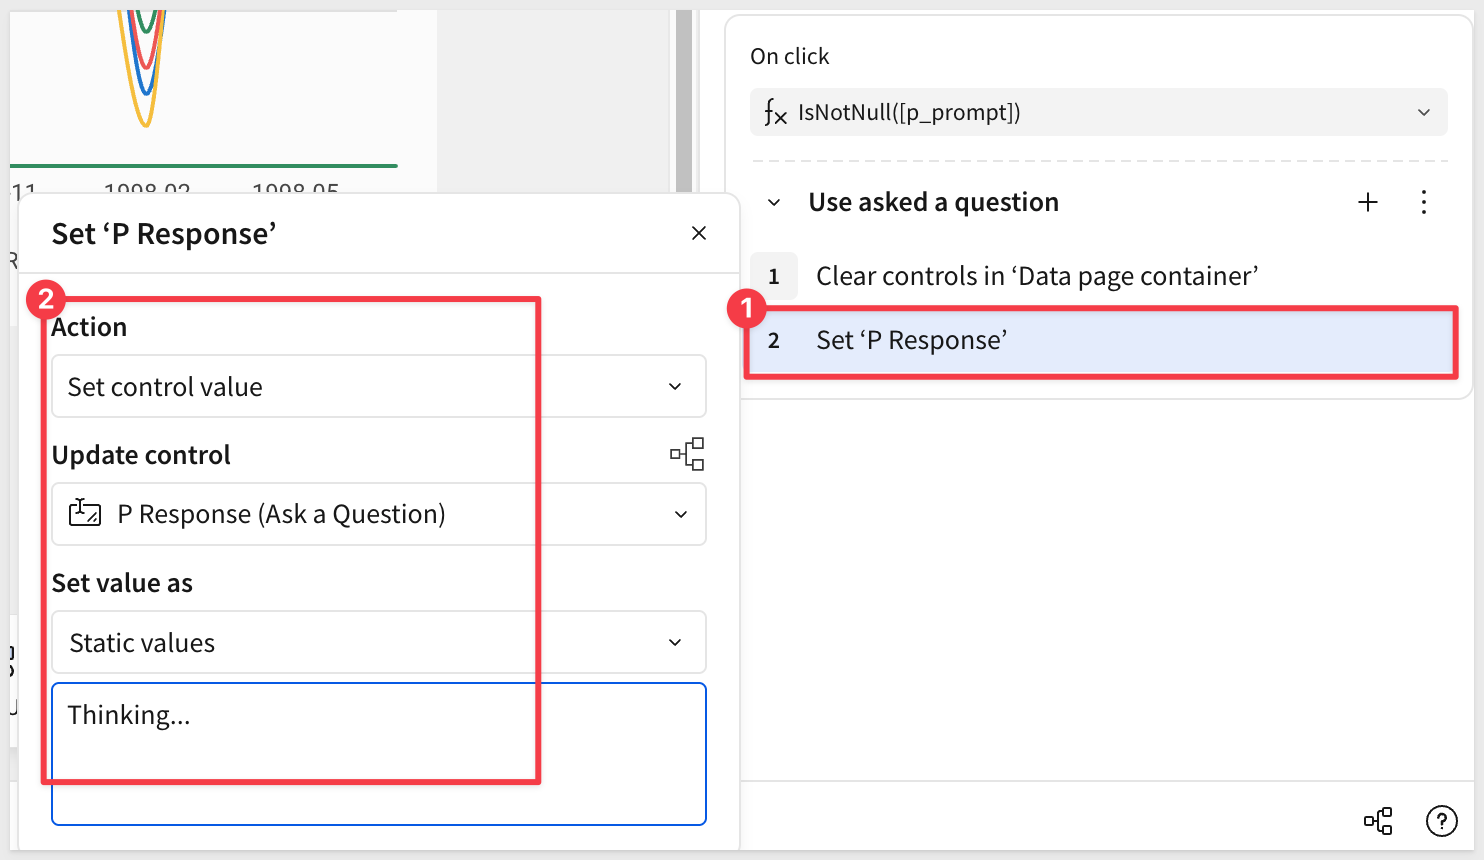
Action 2: Show "Thinking..." message
It may take a little time for Cortex to answer a question, so we want to show the user it is "Thinking". At least this way, they can see that something is happening when they click the button.
Add another action and configure it as:
Action 3: Store the user prompt into data page control
We want to store the data values that will be passed to Cortex temporarily so that we can observe them and also simplify the formula we use to call Cortex.
Add another action, and set the control value of the User Prompt control (with Control ID p_prompt_data) on the Data page to:
[p_prompt] & " ; Use this table:\n" & "Store Region, Month, Revenue\n" & ListAggDistinct(CallText("CONCAT", [Sales Chart/Store Region], ", ", [Sales Chart/MonthText], ", ", [Sales Chart/Revenue]), "\n")
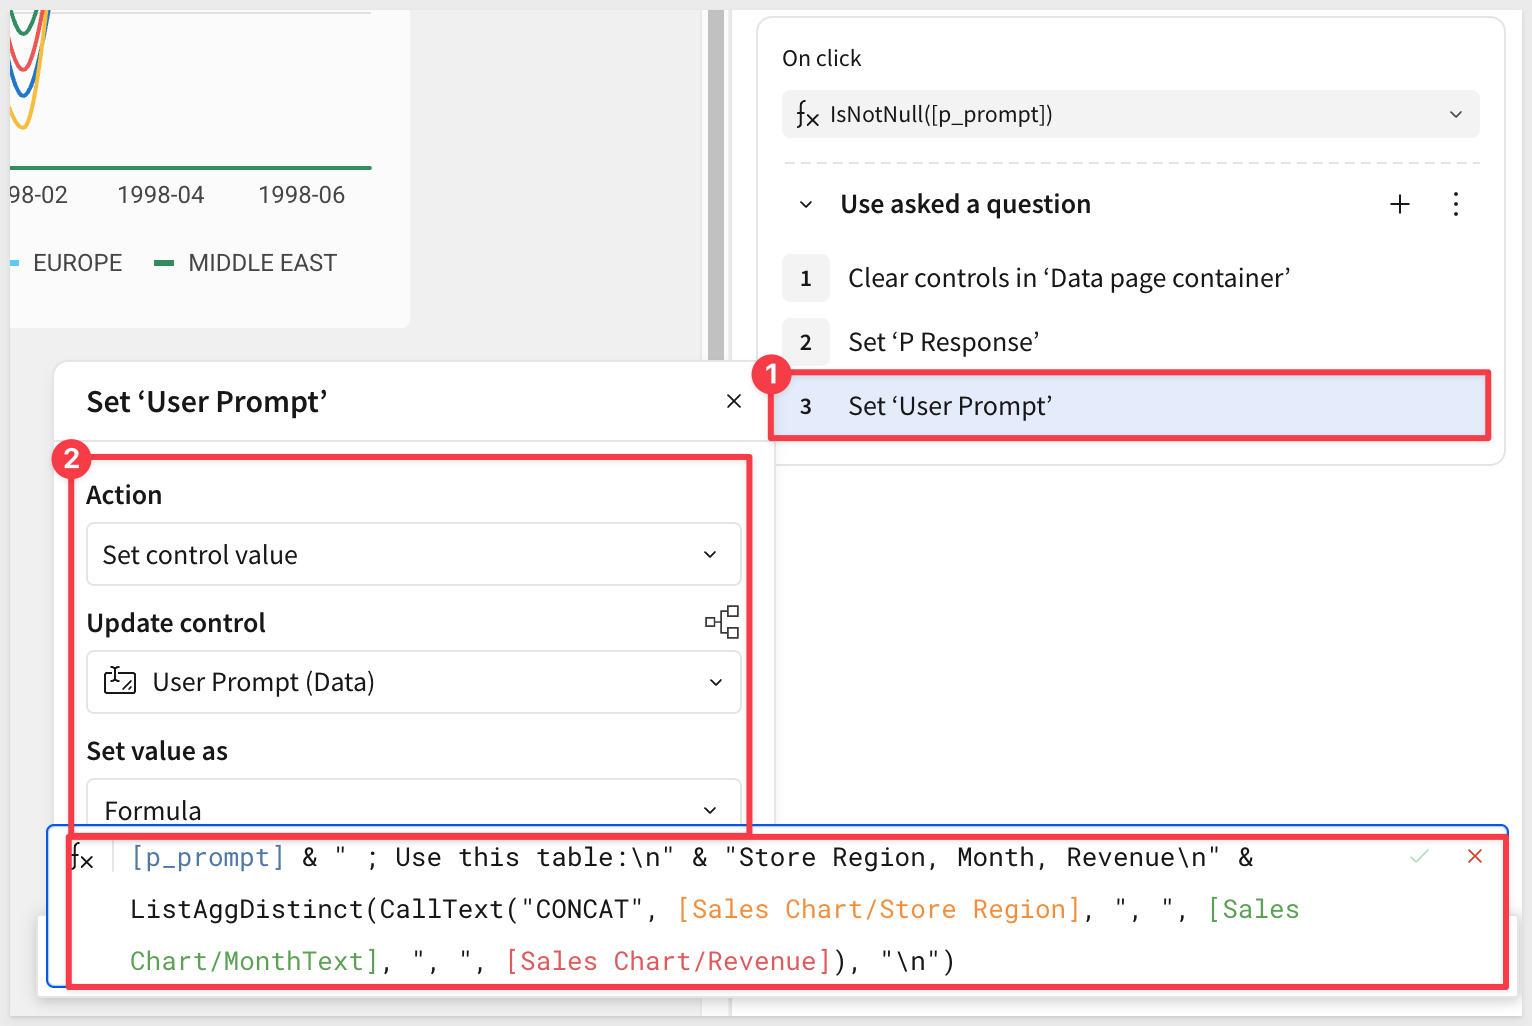
This formula combines the user's question with the chart data in a format Cortex can understand.
Action 4: Store the persona into data page control
Add another action, and set the control value of the Persona control (with Control ID p_persona_data) on the Data page to:
Lookup([System Prompts/Prompt], [Persona], [System Prompts/Persona])
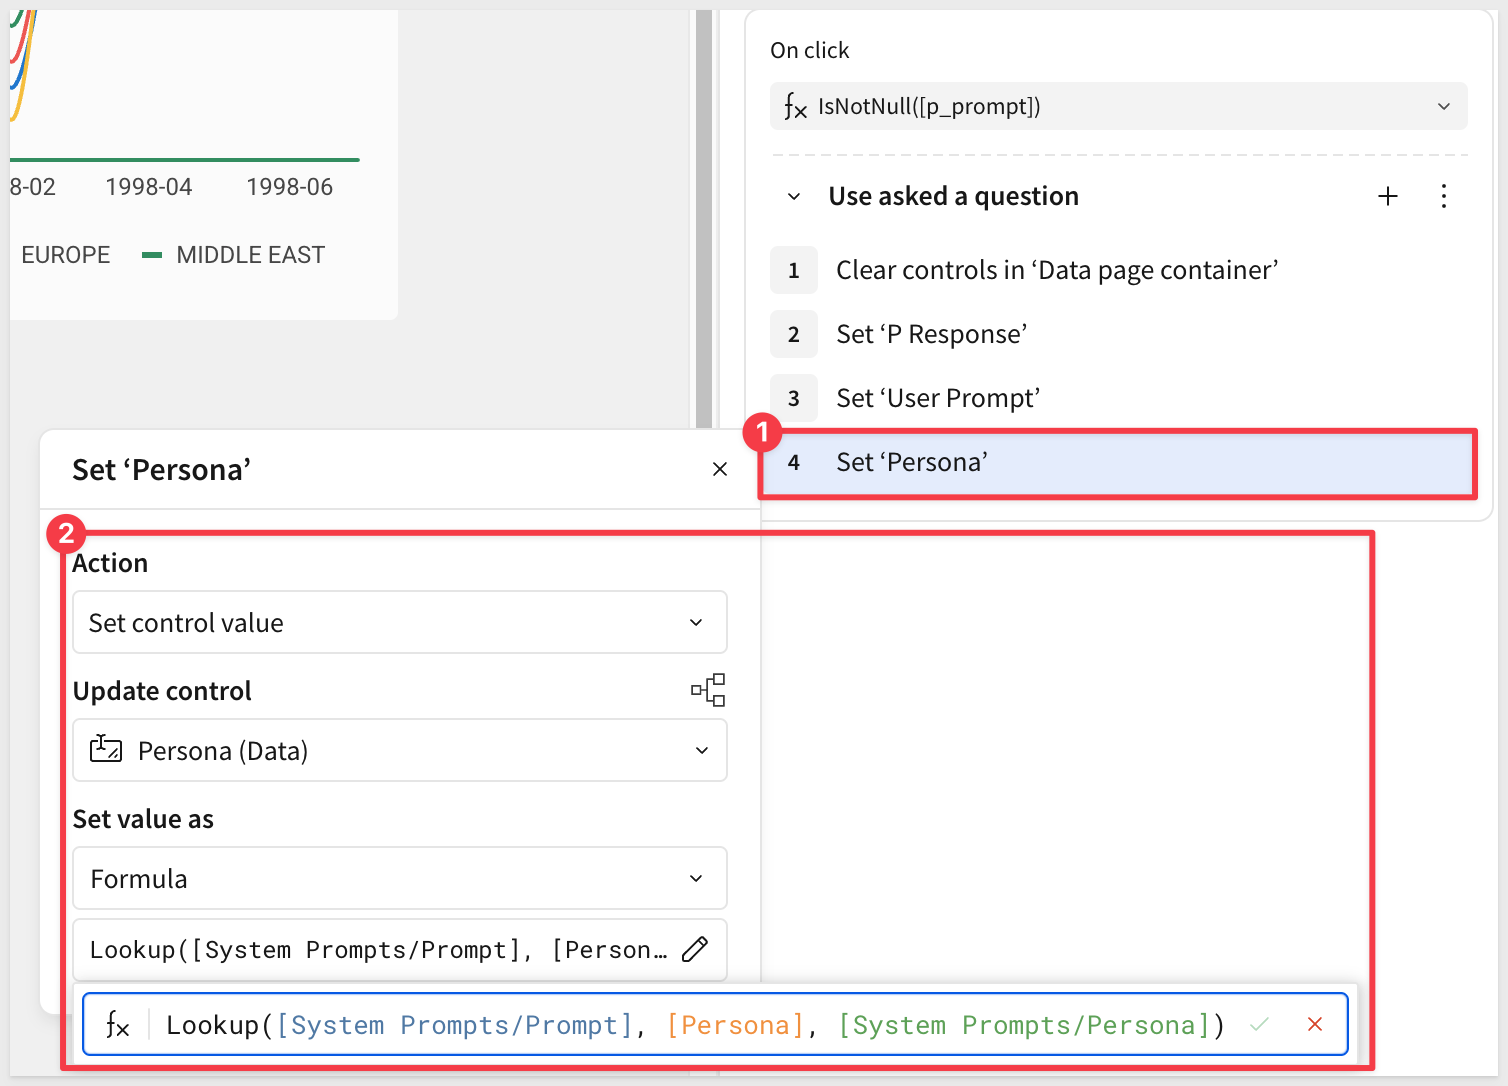
This looks up the full system prompt text based on the persona selected by the user.
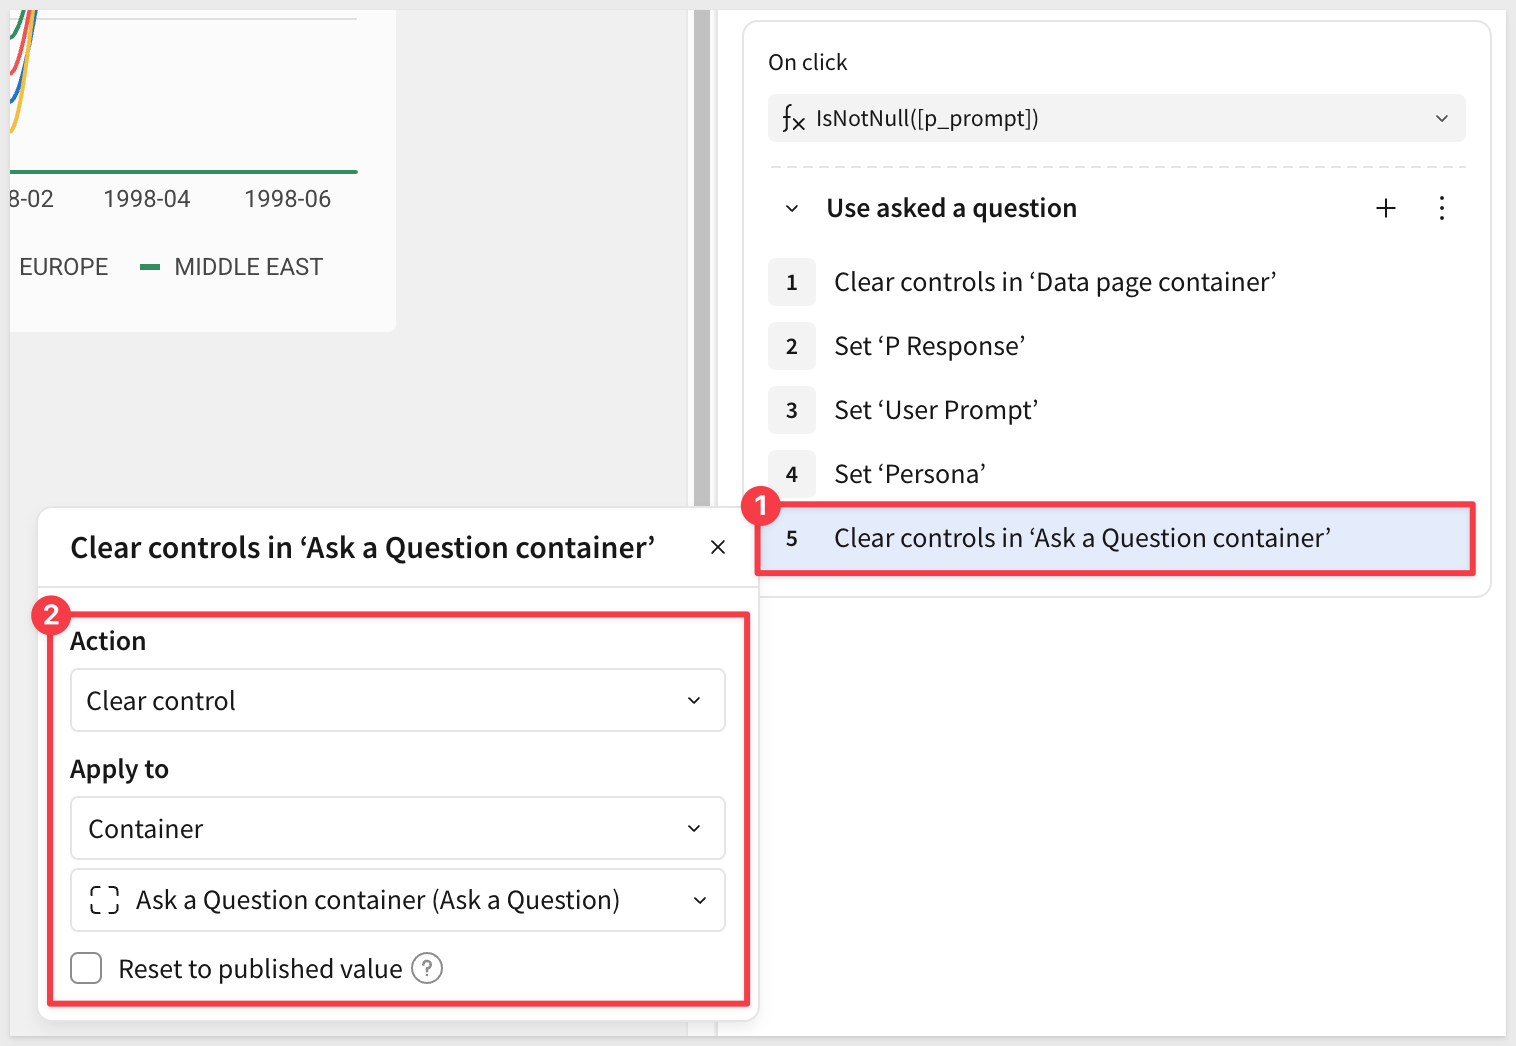
Action 5: Clear the Ask a Question container
Now that we've captured the user's input into the Data page controls, we can clear the Ask a Question container. This removes the old prompt, persona selection, and previous response from view.
Add another action and configure it to clear the Ask a Question container (Ask a Question):
Action 6: Call Cortex and update the Response
Add another action, and set the control value to update the Response control on the Ask a Question page, using this formula:
CompleteClaude([p_persona_data], [p_prompt_data])
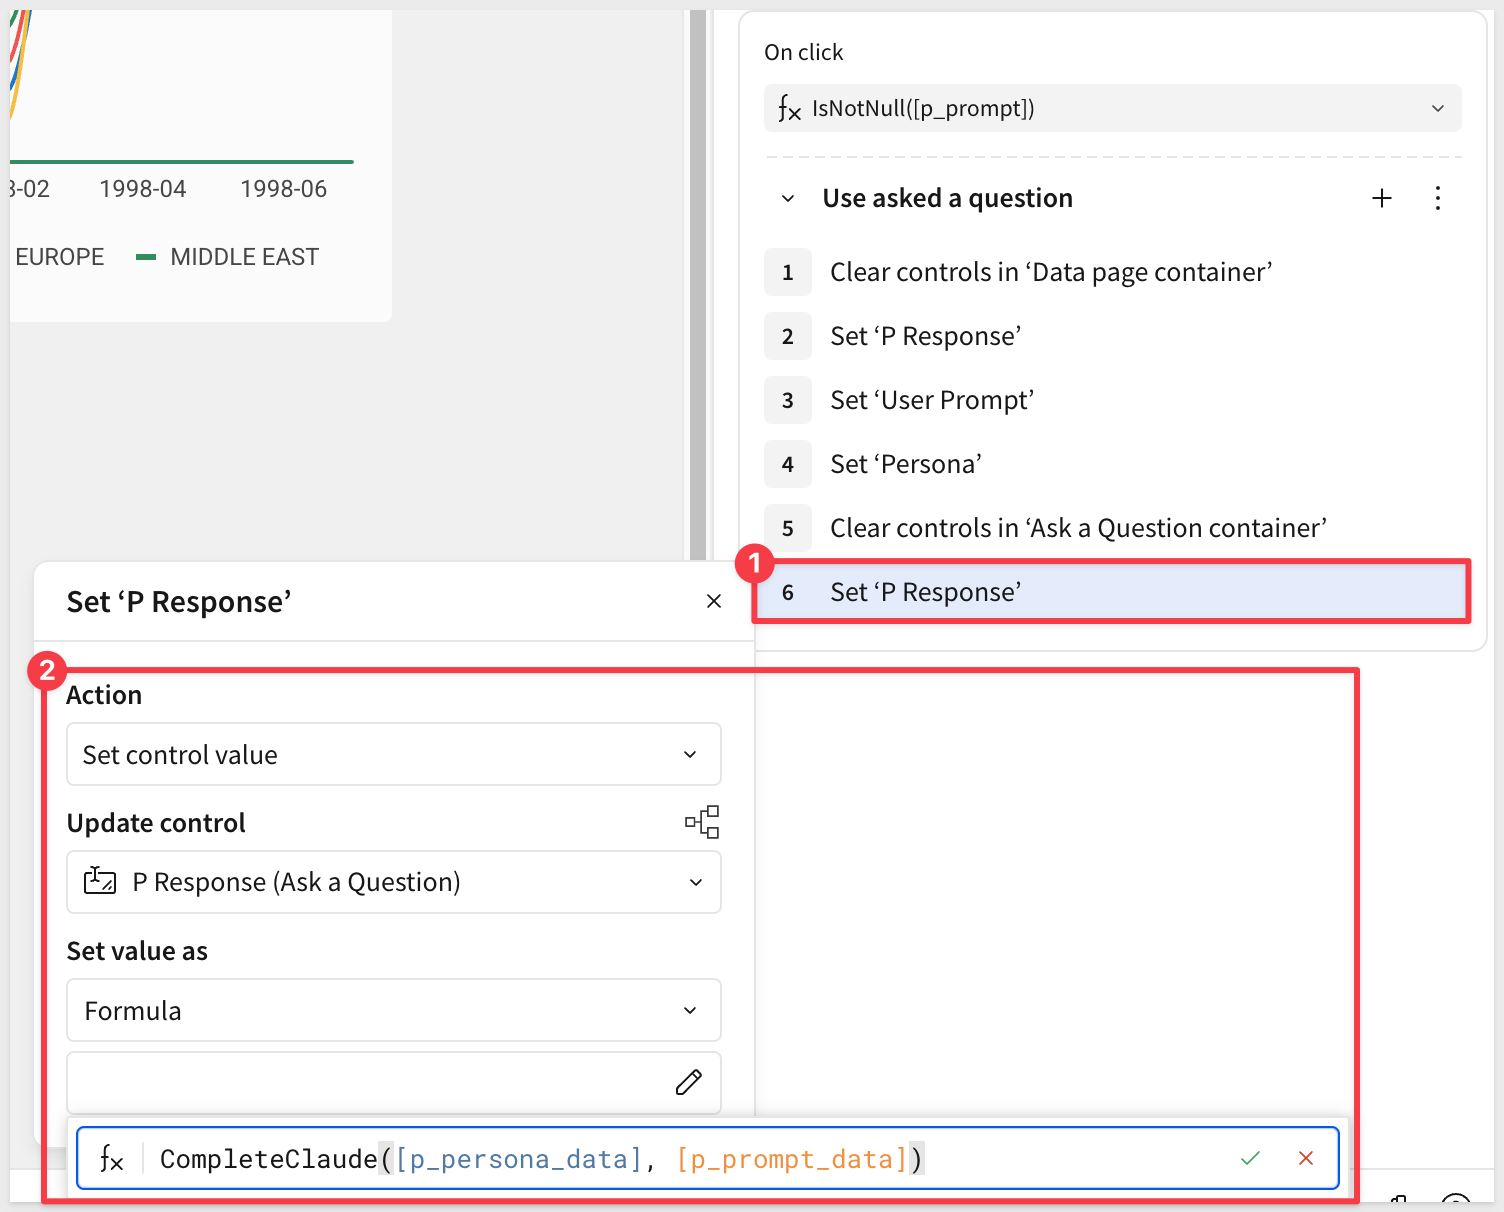
This calls the custom Cortex function we created earlier, passing both the persona configuration and the user's prompt with chart data.
Action 7: Log the prompt and response
Add another action, this time selecting to Insert a row into the Prompt Log input table on the Data page.
Sigma will try to auto-select matching columns. You may need to make some adjustments, using formulas as shown:
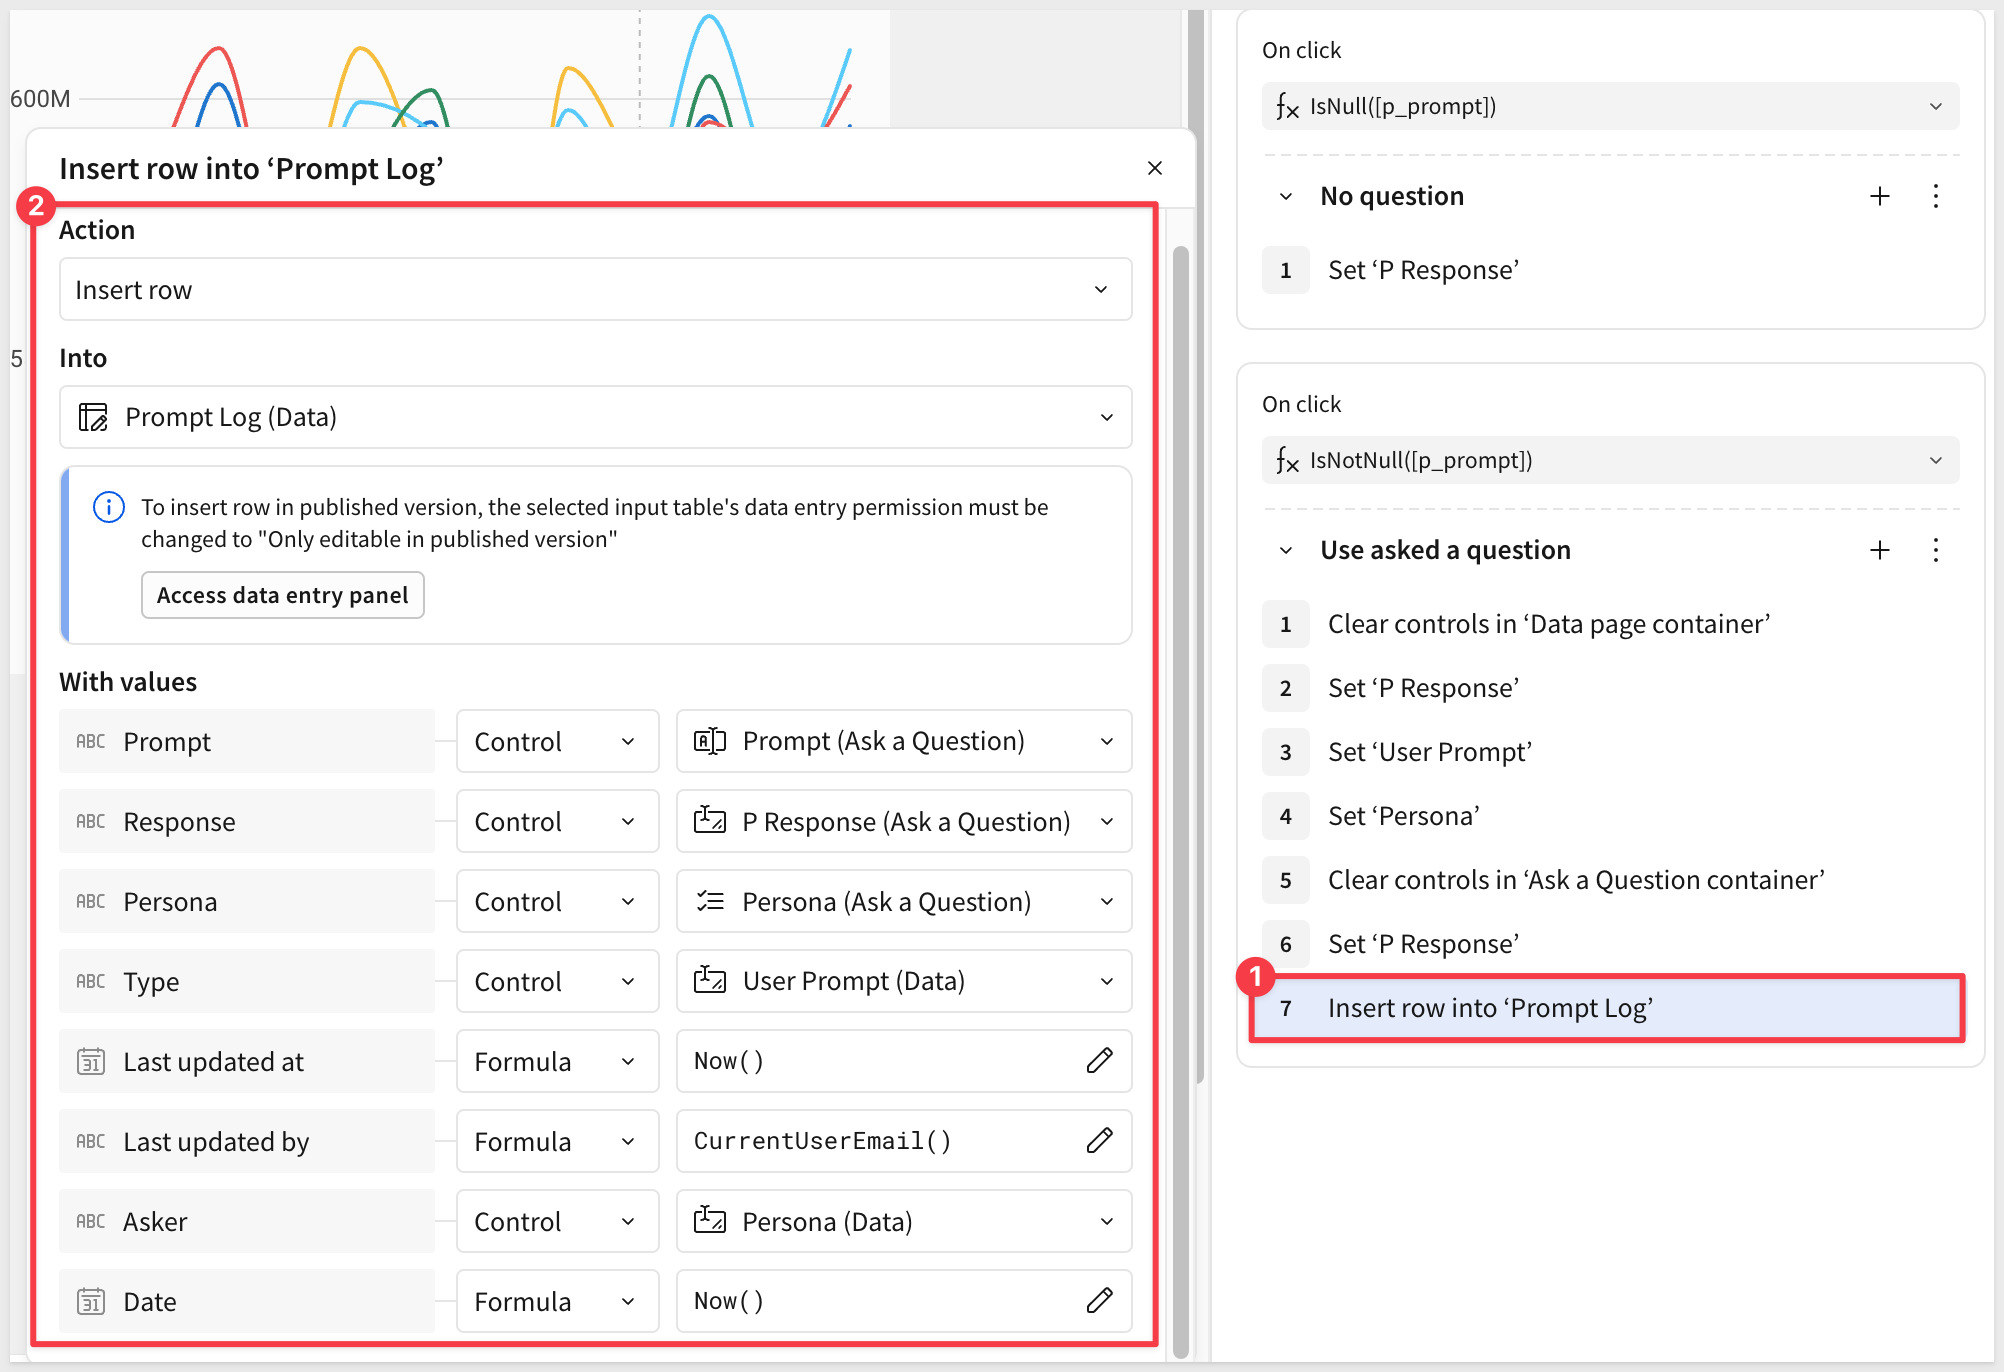
This creates a permanent record of each question and response for tracking and analysis.
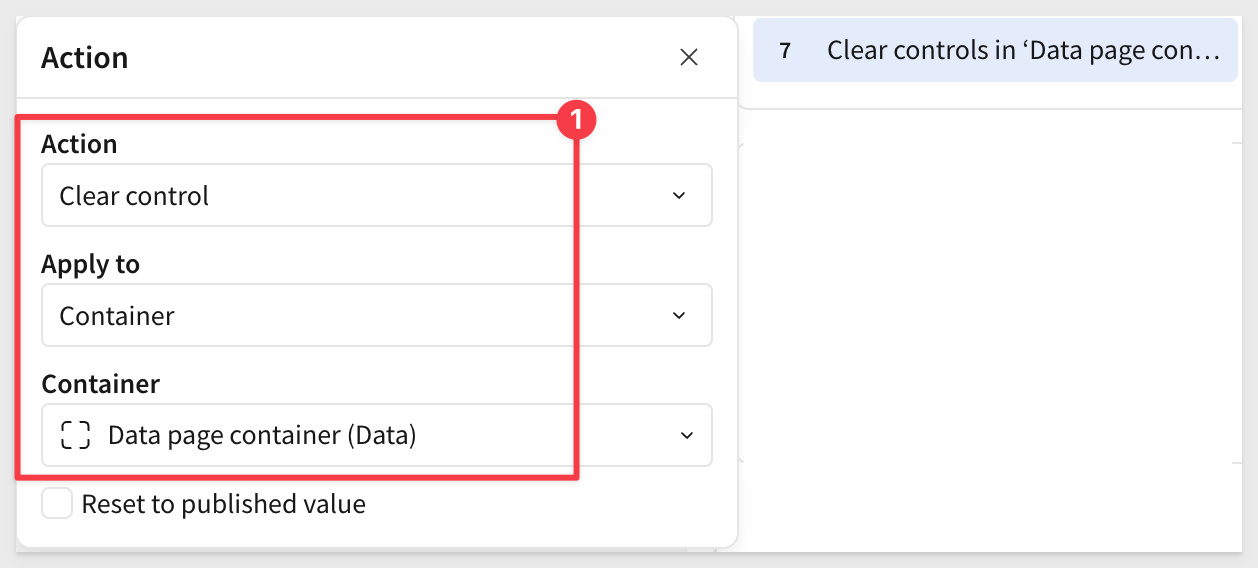
Action 8: Clear the Data page container
Lastly, add an action to clear out the Data page container on the Data page one final time:
Click Publish.
Let's ask Cortex a question and make sure everything works as planned. Any persona will do.
Explain the dip in 02-1998
Cortex responds according to the data and persona configuration we sent it:
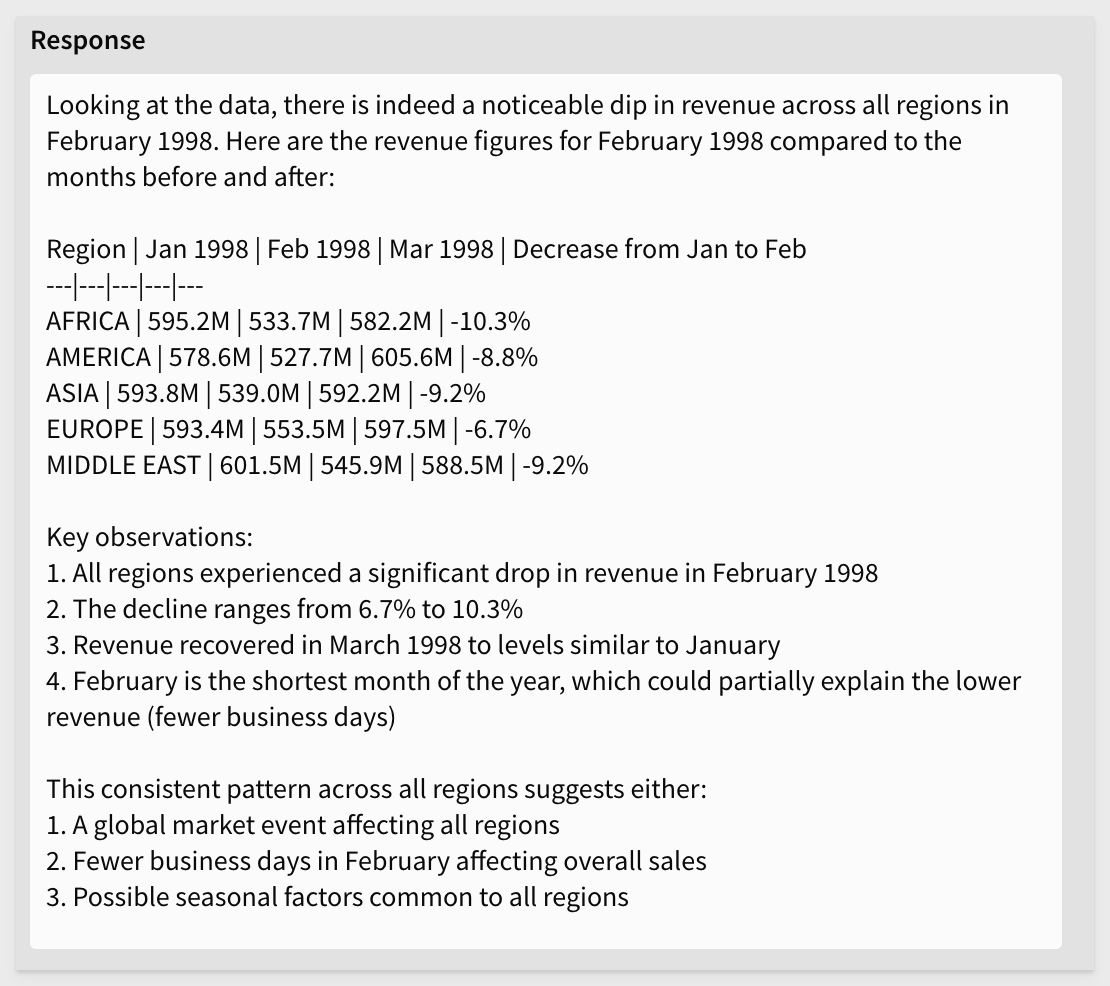
While this was not the most complex dataset or question, we can see just how easy it can be to harness the power of Cortex AI using Sigma.
Chat History
On the History page, you'll see the results of the most recent Insert a row action.
The data was written to the Prompt Log on the Data page, but the Chat History table on the History page is a child of that, so the columns we want to expose to other users are shown automatically here.
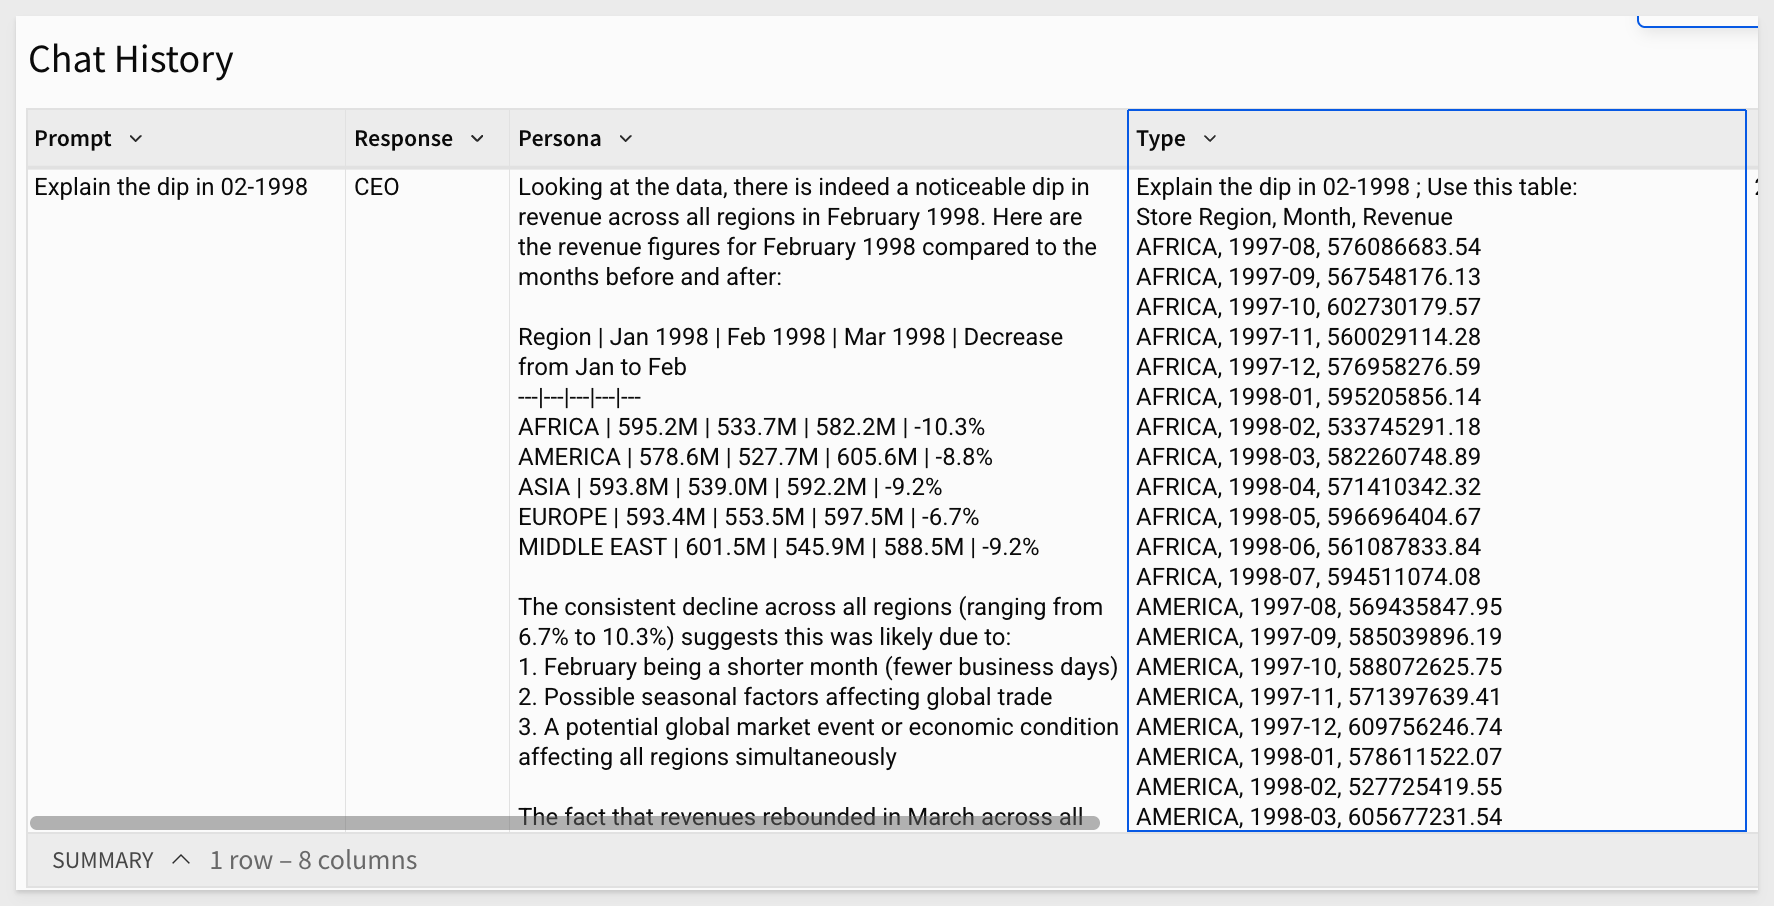
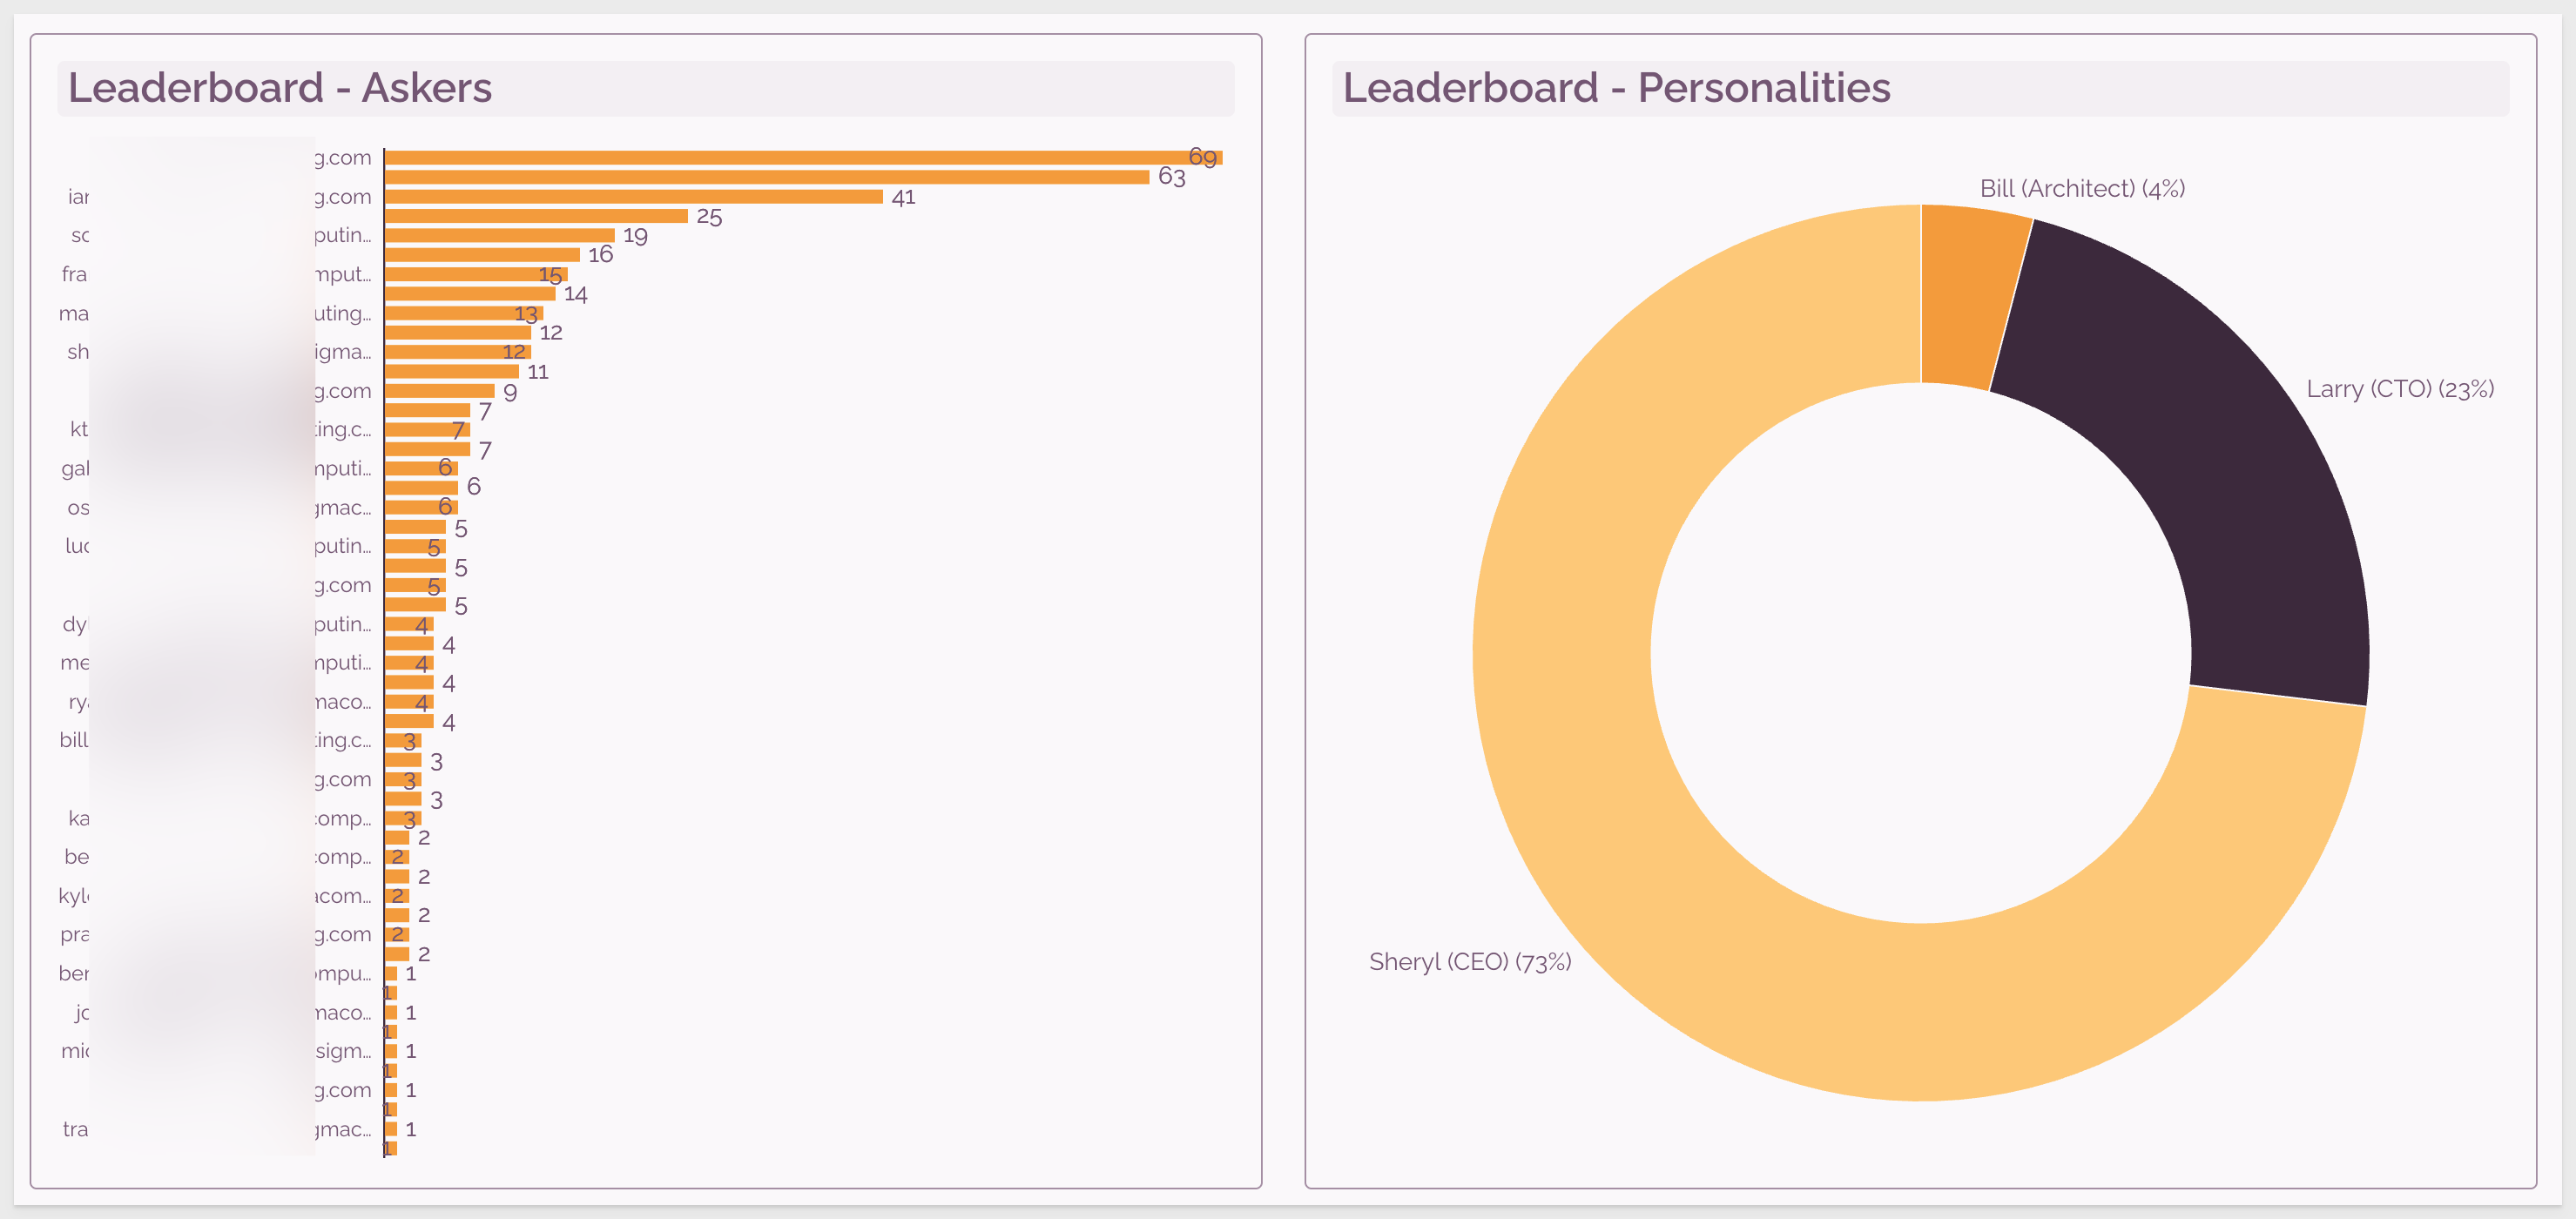
From this table, you can create charts to explore trends or usage patterns.
Here are two examples taken from a system with a larger number of rows in Chat History:
In this QuickStart, we explored how easy it is to bring together the flexibility of Sigma and the intelligence of Snowflake Cortex AI.
With just a few simple steps, we:
- Built a curated data model with reusable metrics,
- Created a natural language interface powered by Cortex,
- Enabled user-friendly controls and personas to personalize AI responses,
- Logged prompts and responses to help track usage and improve quality over time.
Together, Sigma and Cortex unlock a powerful, approachable way to work with data—no advanced coding or configuration required. Whether you're an analyst, a business user, or someone just getting started, this combination puts the power of LLMs directly in your hands.
Additional Resource Links
Blog
Community
Help Center
QuickStarts
Be sure to check out all the latest developments at Sigma's First Friday Feature page!