Sigma has always been known as a leader in analytics, with its cloud-built platform designed to support today's massive data scale challenges.
Sigma has been extended to enable customers to build rich, interactive applications, automate workflows, and take action customized to their team's needs—all without writing any code.
This transformation has occurred in stages, and we are now in stage three, as shown in the image below.
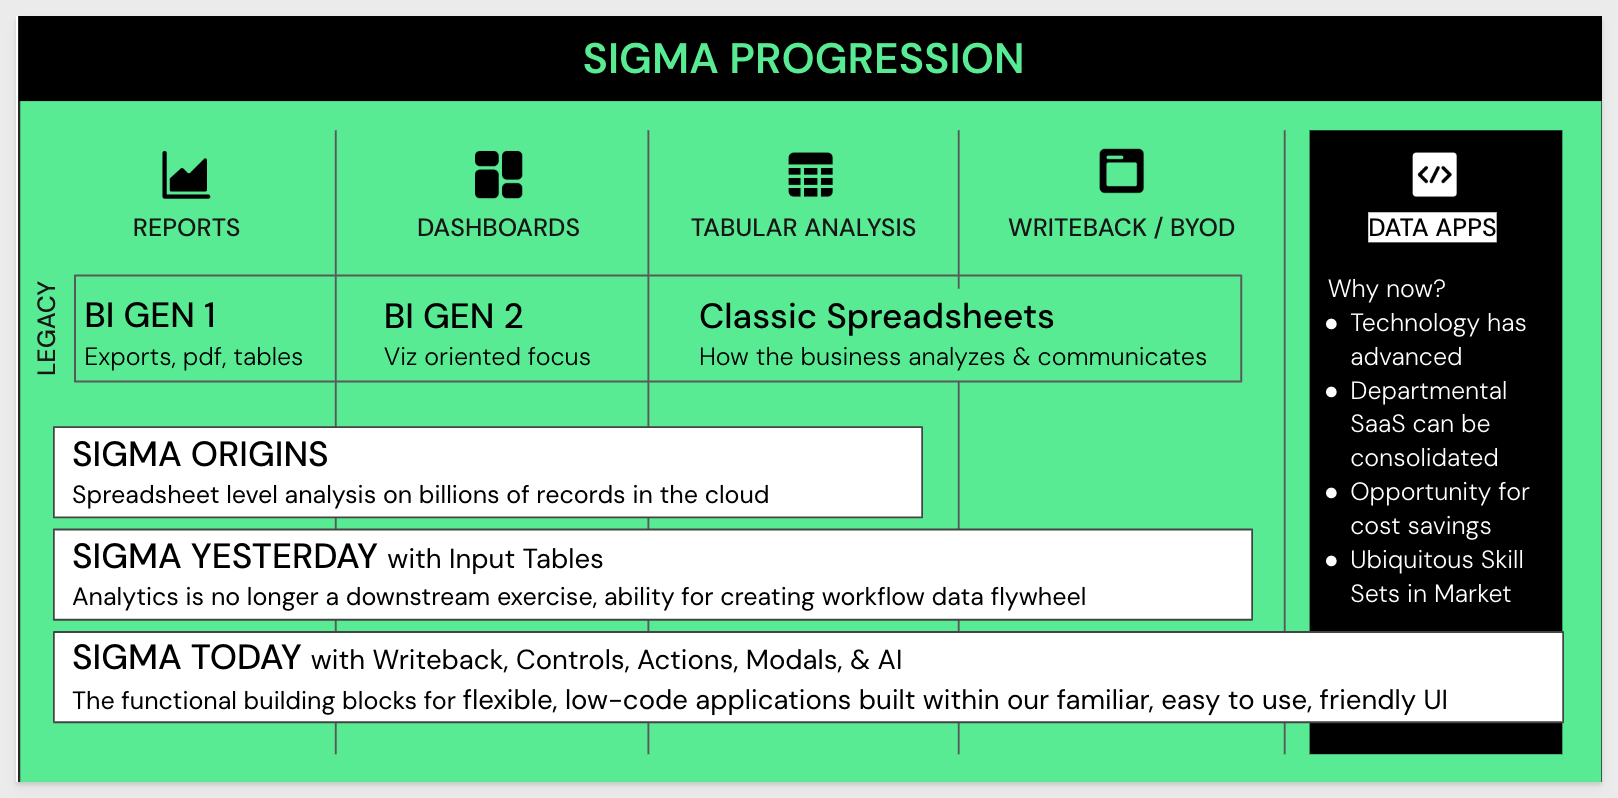
This QuickStart demonstrates how to use Sigma to build an AI Application (app) entirely within the Sigma UI. The data used will come from, and be stored in, Snowflake. During this demonstration, we will build a fully functional project tracking AI App that, in the past, may have taken significant time to get up and running.
This QuickStart is a bit longer than usual, and we understand that people can be pressed for time. While it is well worth the investment, if you can't spare the time, you can instead watch this 5-minute video to see how impactful Sigma AI apps can be for your organization.
Project Tracker use case
The Project Tracker will support the following:
Category | Description |
Projects | Top Level reporting. |
Tasks | Tasks are children of projects. Each project may have 1 or more tasks. |
Status | Project status changes over time. Create a flow to track status over time while displaying just the latest status for a project. |
Approvals | All projects must be reviewed and approved prior to being marked as complete. |
UI | Able to see all project details in one place. |
Some of the core Sigma functionalities we will touch are:
- Input Tables:
- Data Validation
- Input tables + Actions
- Overlays / Modals:
- Forms
- Filters
- Controls:
- Building a control panel
- Interaction of controls and actions
- Building the Application Interface
- Approval Workflow
- Themes
What we will build
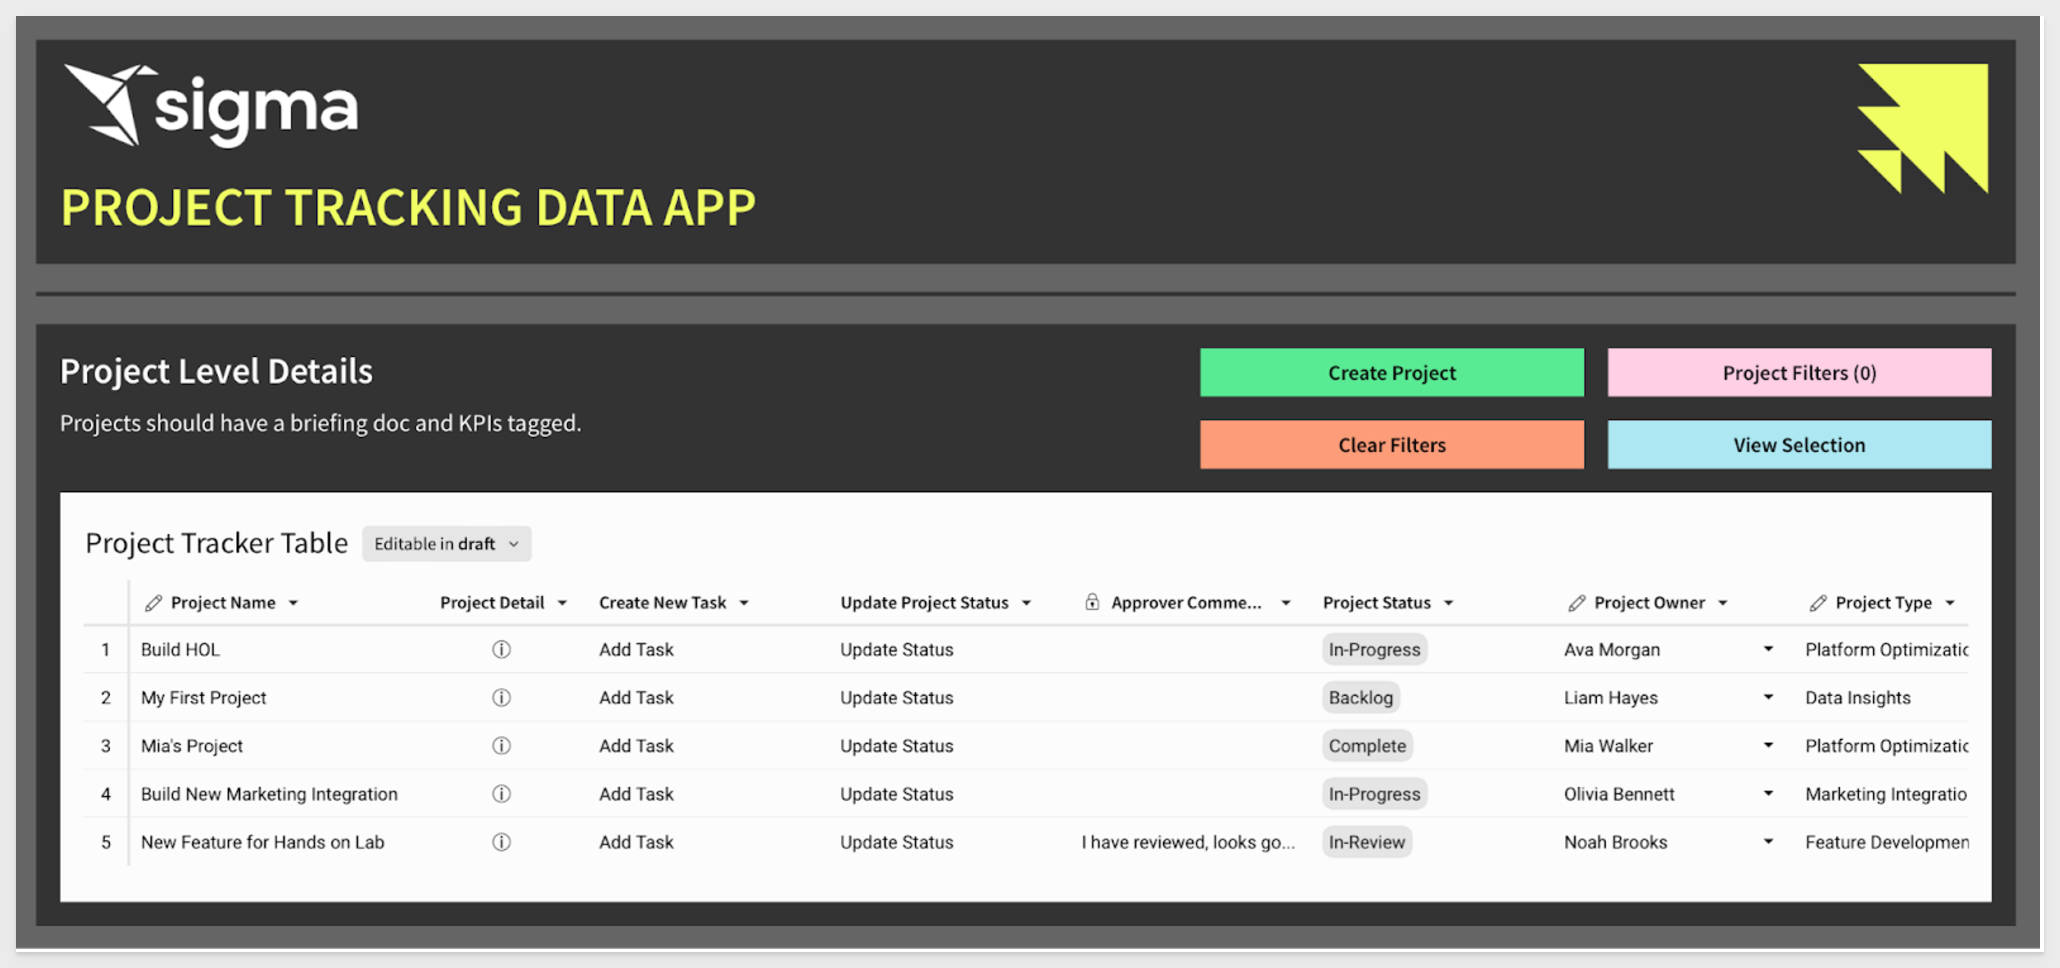
After completing this QuickStart we will have built a fully functional AI App based on a project management use case.
The finished product can look something like this (depending on your styling choices!):
For more information on Sigma's product release strategy, see Sigma product releases.
Target Audience
Sigma builders interested in leveraging the advanced capabilities to create fully functioning AI Apps.
Prerequisites
- A computer with a current browser. It does not matter which browser you want to use.
- Access to your Sigma environment.
- Some familiarity with Sigma is assumed. Not all steps will be shown as the basics are assumed to be understood.

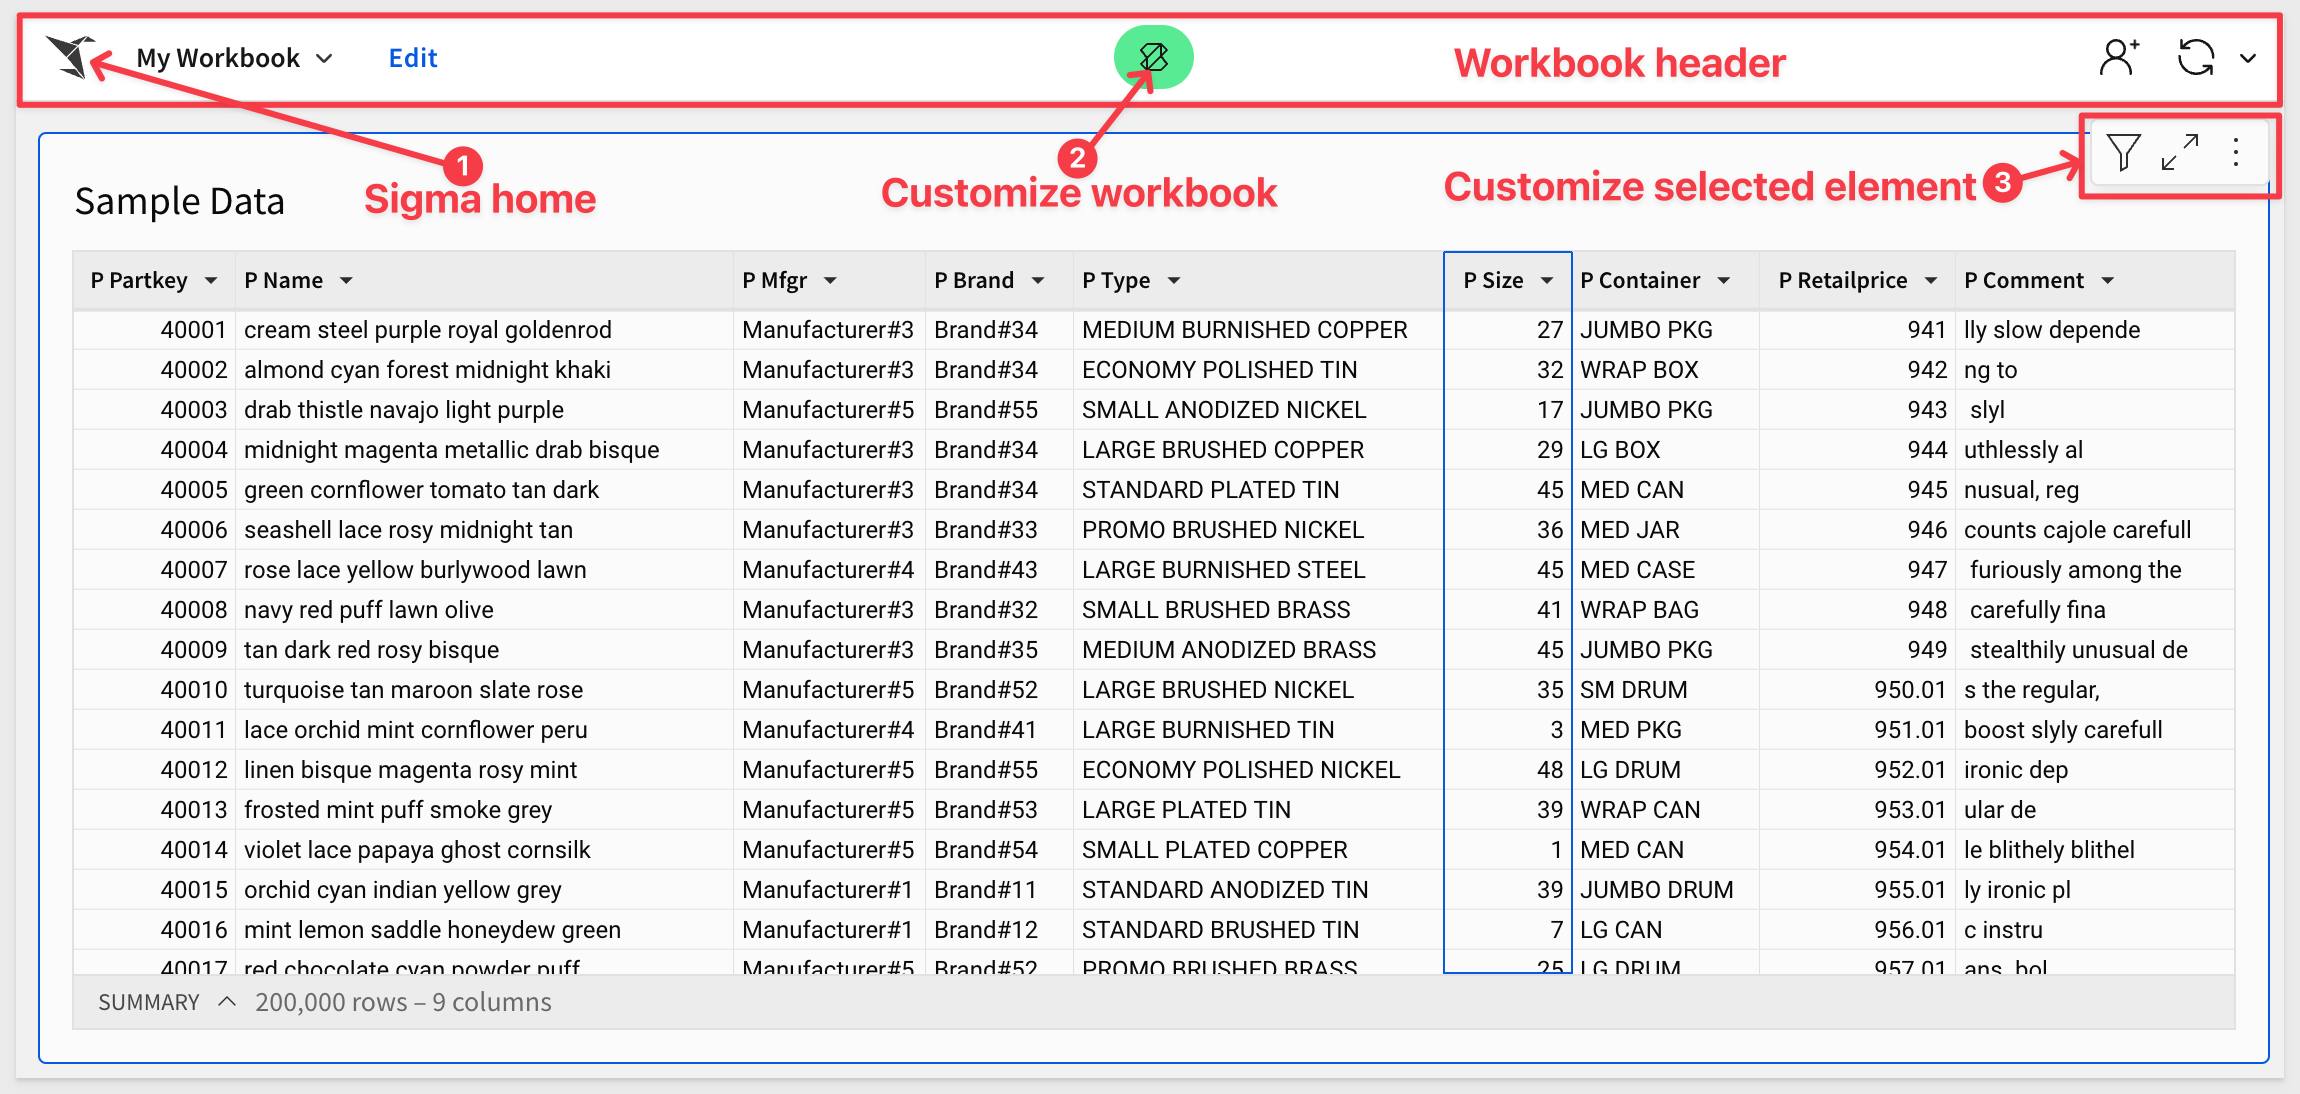
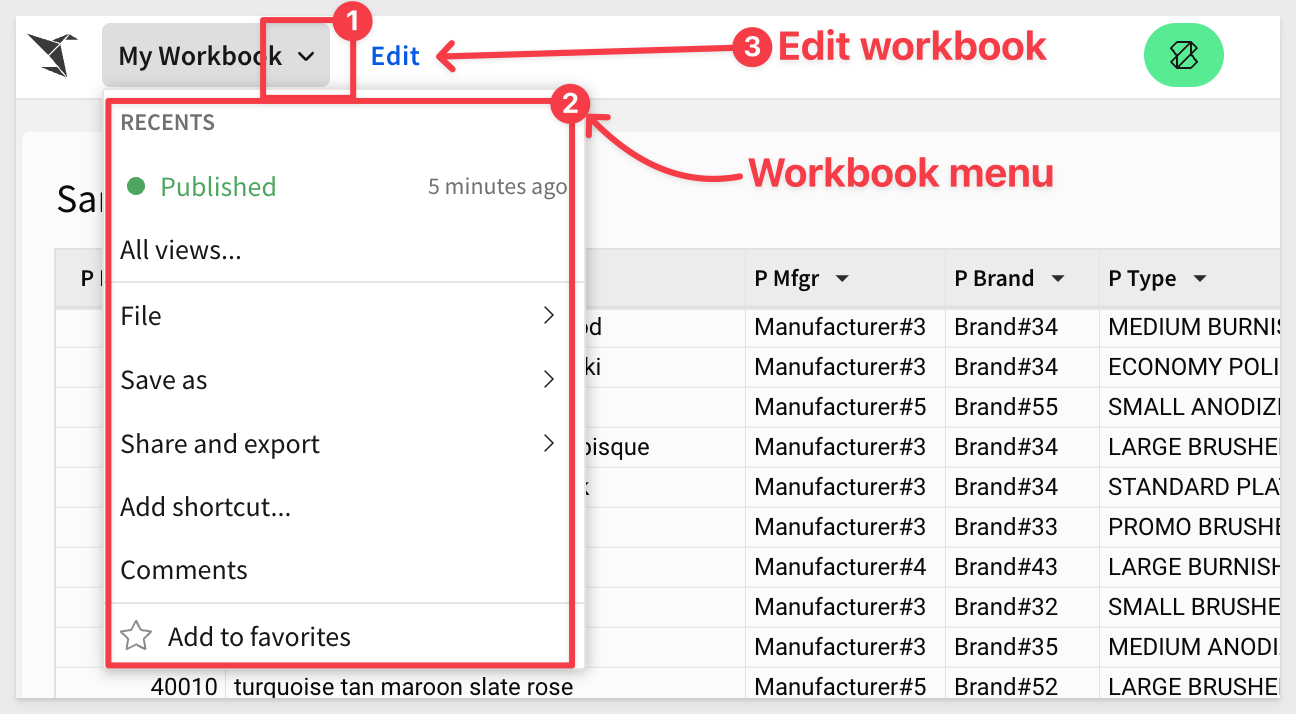
The following is a guideline for the different parts of the Sigma interface so that we are oriented to the terms that will be used throughout this QuickStart. Not every item is called out, but the most used ones are.
Workbook page - published version
Workbook menu - published version
Workbook page - edit mode
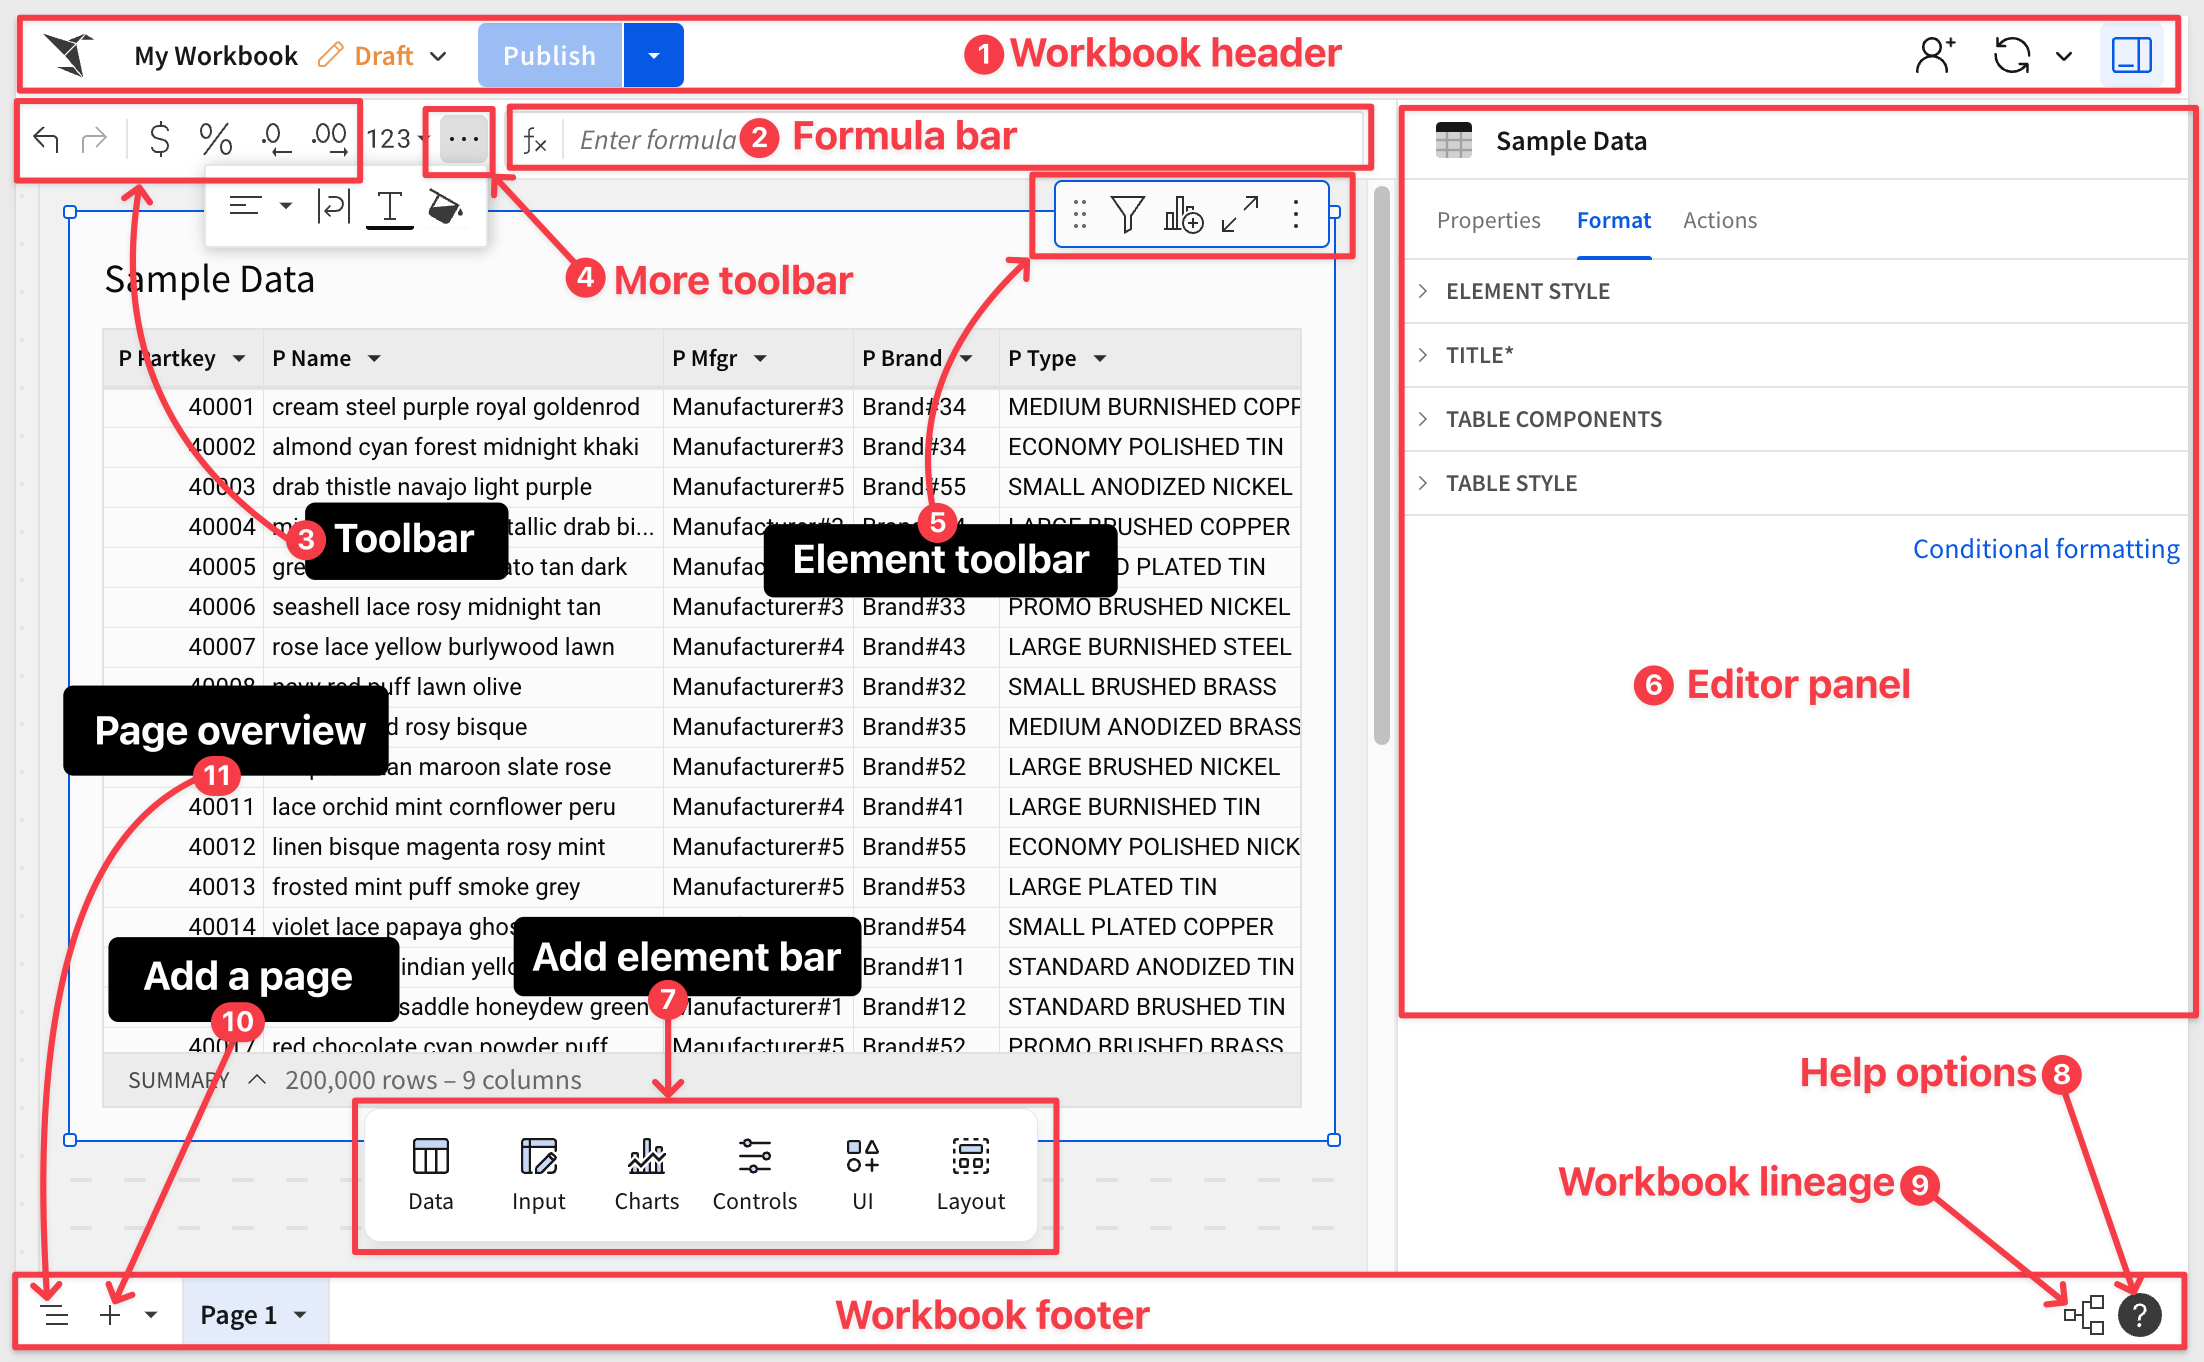
For more information, see Getting around in Sigma

Input tables are dynamic workbook elements that support structured data entry. They allow you to integrate new data points into your analysis and augment existing data from your data platform to facilitate rapid prototyping, advanced modeling, forecasting, what-if analysis, and more—without overwriting source data.
Use input tables as sources for tables, pivot tables, and visualizations, or incorporate the data using lookups and joins. And when you create warehouse views for input tables, you can reuse the manually entered data across your broader data ecosystem.
There are many options to control how users are permitted to use input tables.
For more information on this topic, see: Configure data governance options in input tables
Create Project Tracker Input Table
Step 1: Open a blank workbook in Sigma:
Log into Sigma and select the + Create New > Workbook from the homepage:
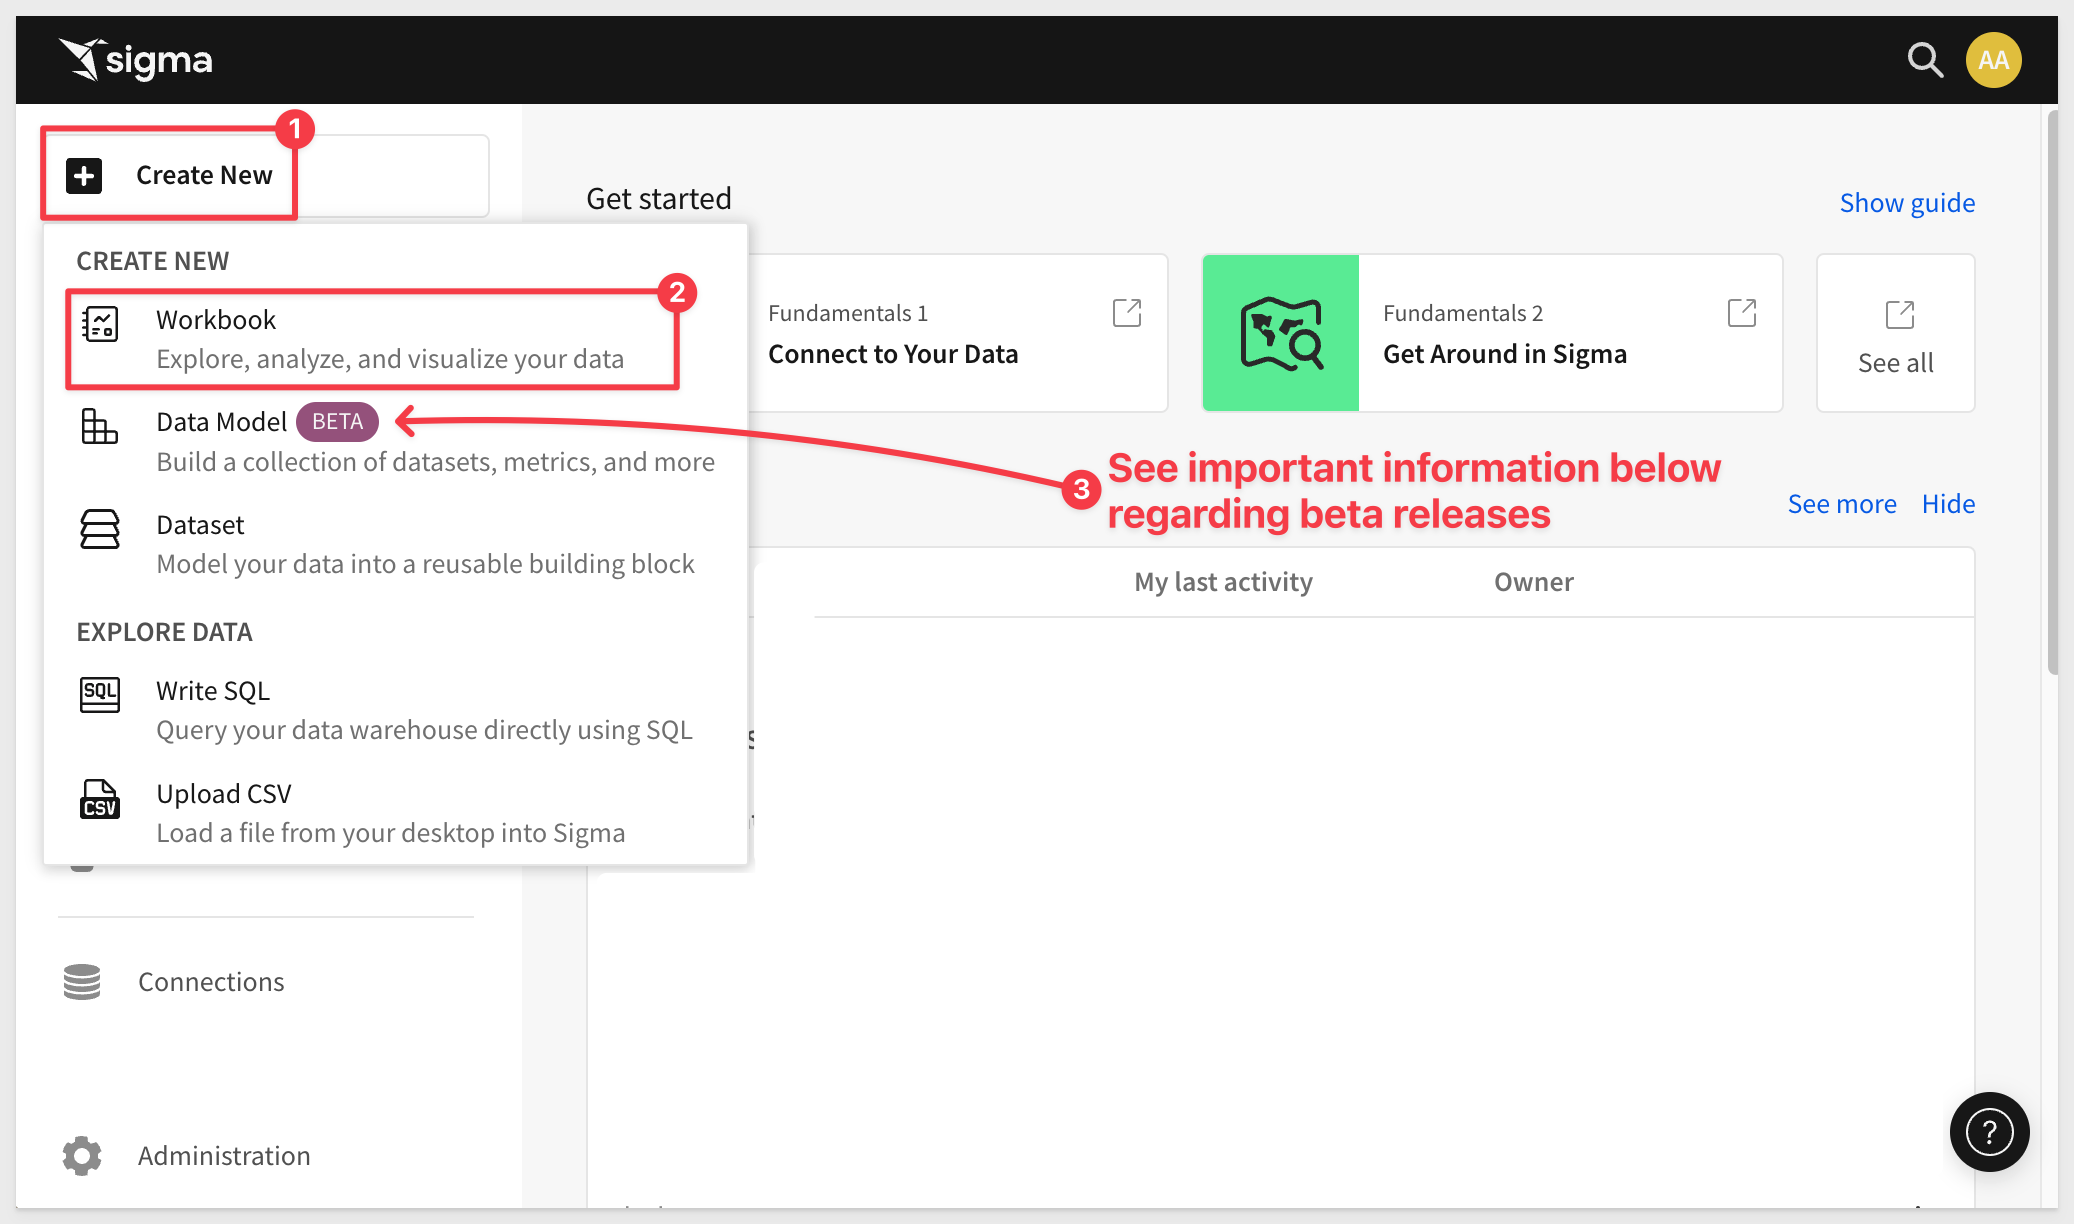
For more information on Sigma's release strategy, see Sigma product releases
There is also a QuickStart each month that covers all the release activity for the previous months. For more information, see First Friday Features
Step 2: Add empty input table:
Create an empty input table on Sigma Sample Database by clicking on Input in the element bar and dragging an Empty input table onto the page.
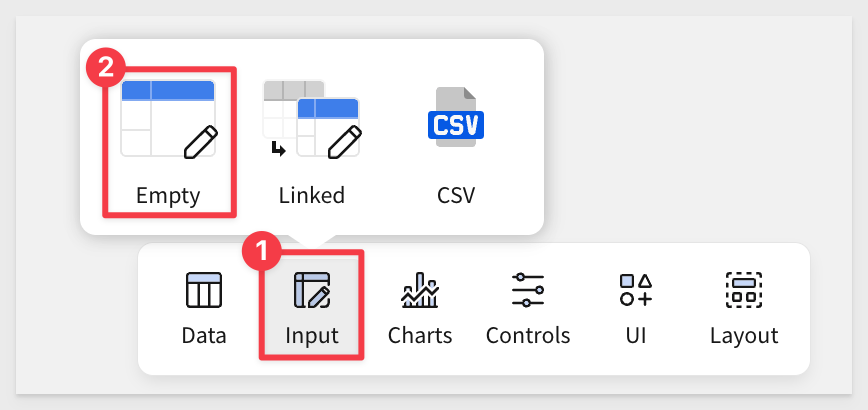
Click the Select connection button and choose the Sigma Sample Database. Click Create.
Change the title of the new input table (by double-clicking its current title) to Project Tracker Input Table:
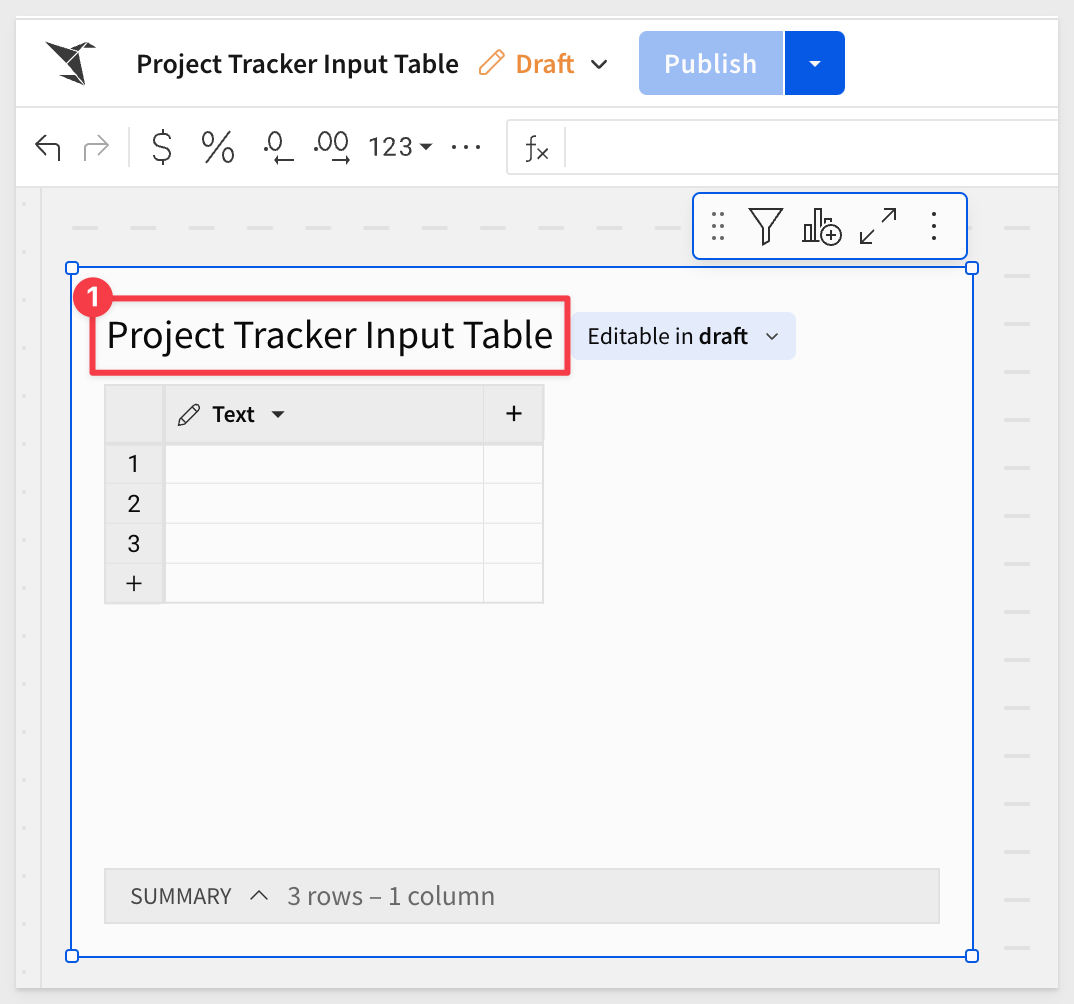
Step 3: Add new columns:
In this step, we will create three new columns: two as text and one as date format.
First, rename the existing Text column to Project Name.
Next, create two additional text and one date columns:
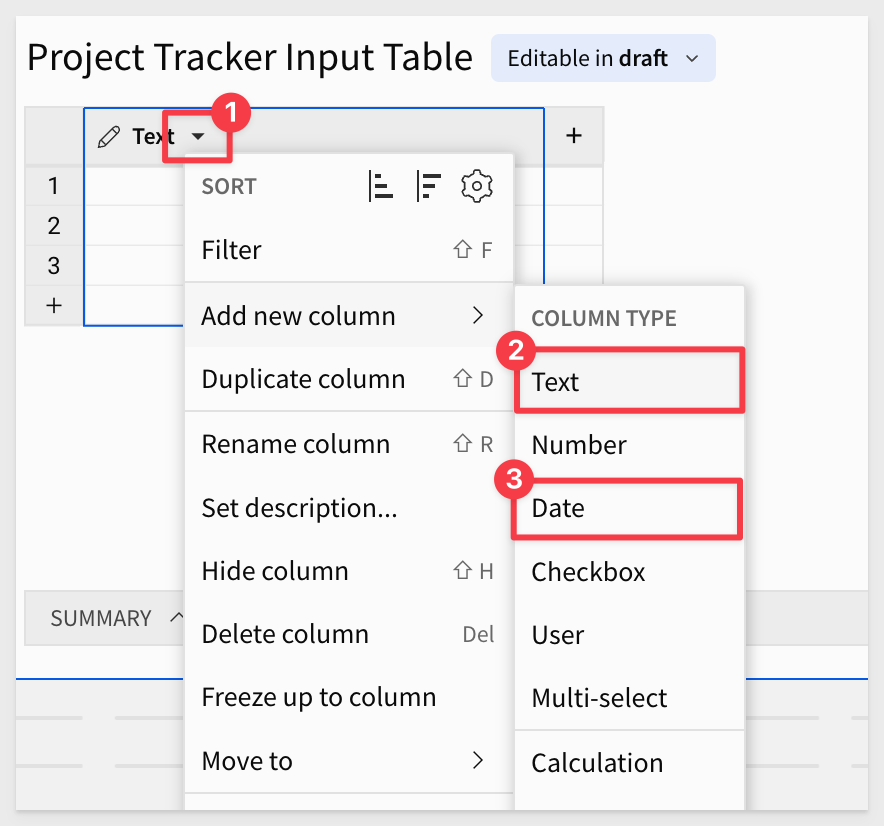
Rename the new columns to Project Owner, Project Type, and Project Due Date respectively:

Step 4: Rename the page
Rename the workbook page to Project Tracker and add a new page, by clicking the + icon in the footer. Rename it to Data Validation:

Step 5: Validation input tables
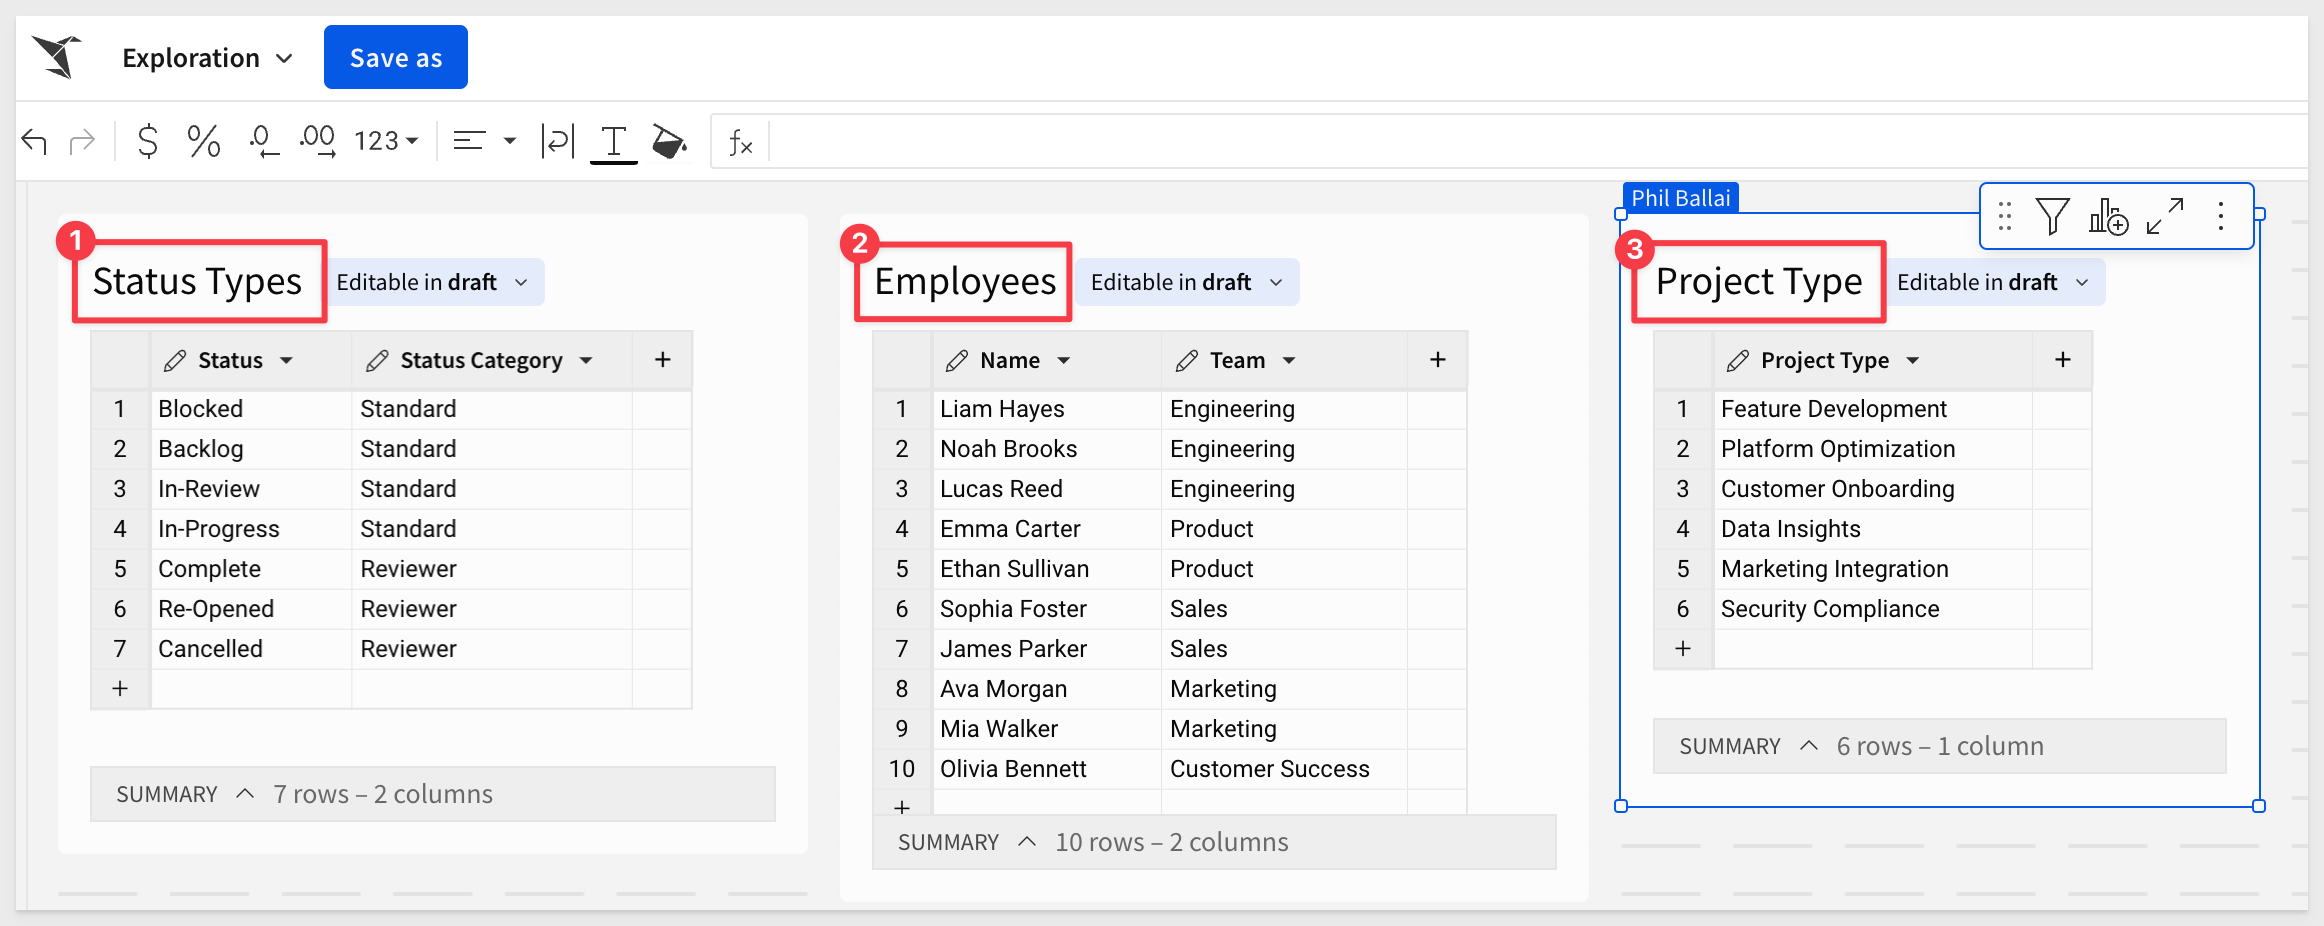
In this step we will create three additional input tables, reloading them with data from csv files.
Click the button below to download the files (in zip format). Extract them to a known location to make them easy to find.
The download will contain three csv files once extracted:
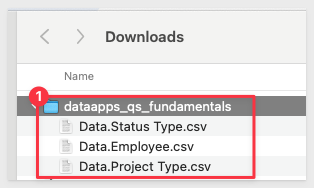
Now that we have the files, we can add three CSV input tables using the element bar as we previously did.
The only different thing is this workflow is we need to Upload CSV using the csv input table button:
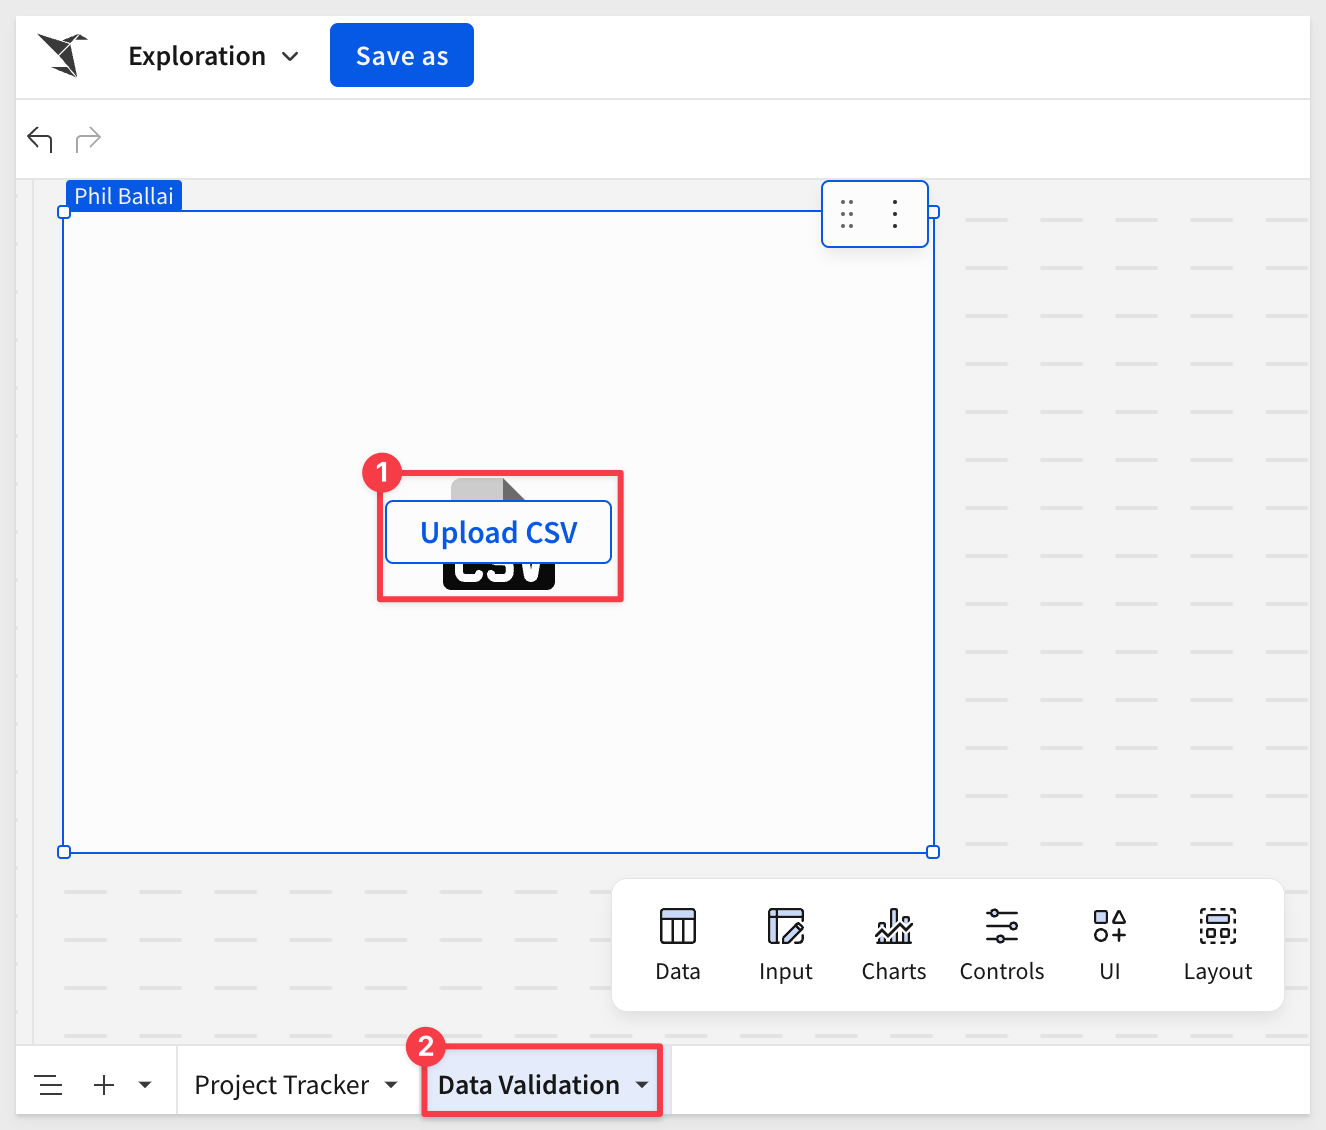
Browse to where the csv files downloaded are stored and select the first one.
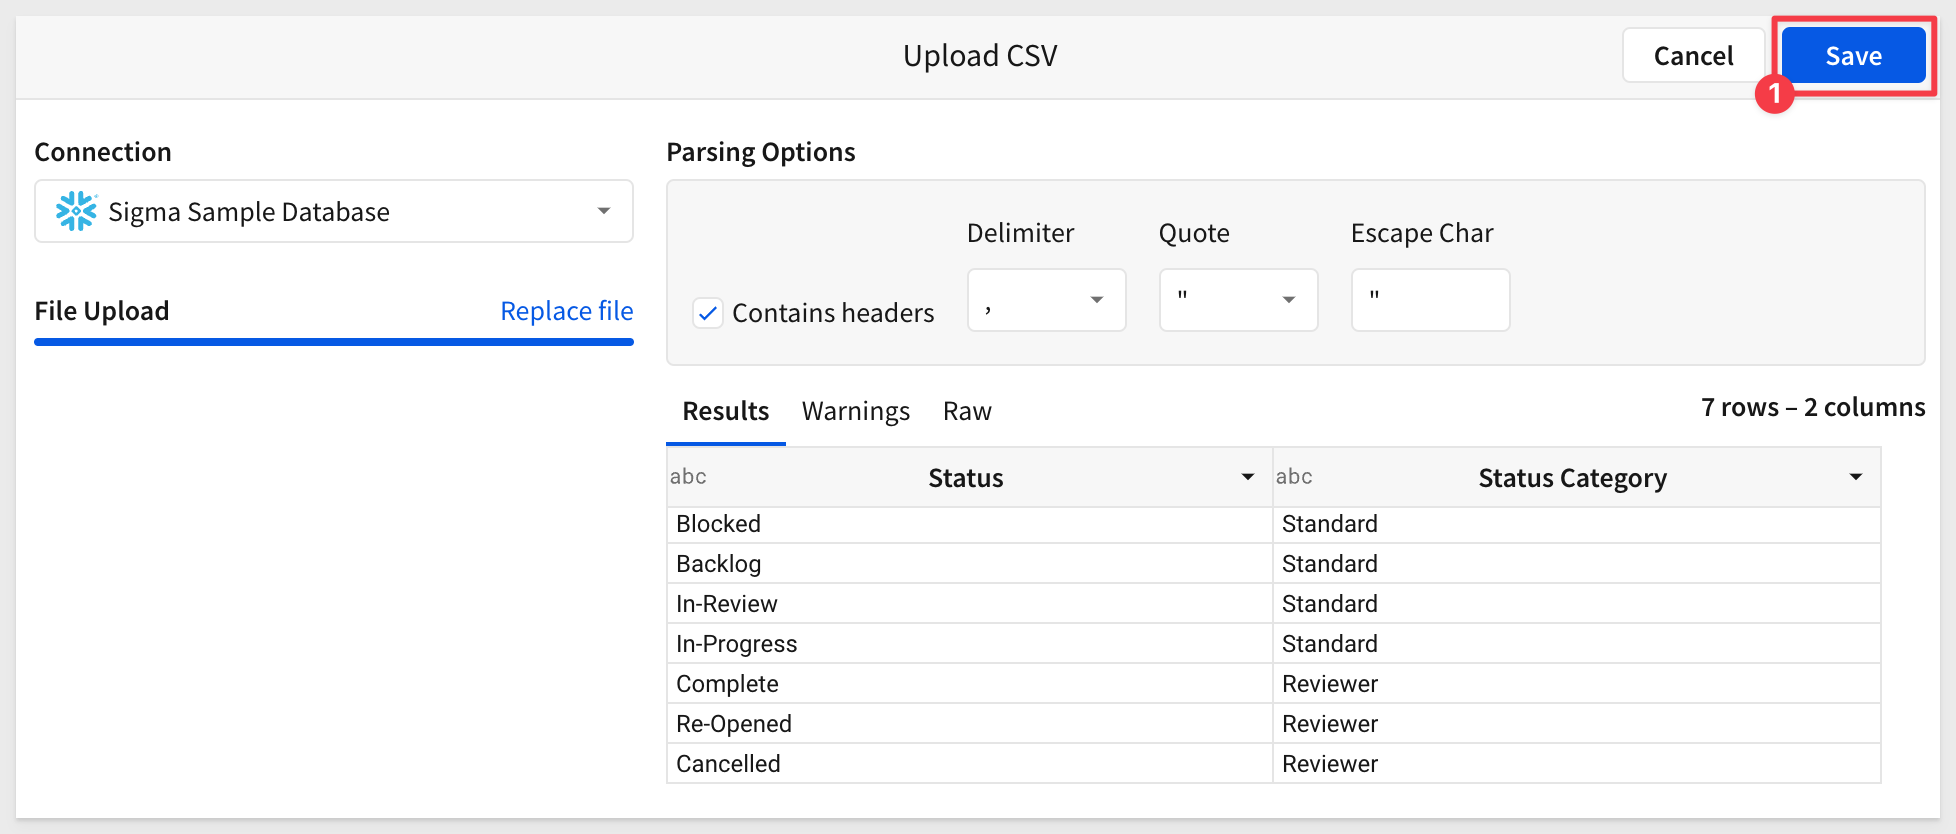
After selecting the first csv file, Sigma allows you to adjust the Parsing Options and review the parsed data. This ensures the data makes it to the input table as expected. If everything looks correct, click Save.
Once all three input tables are added, rename them to match the content:
Step 6:
On the Project Tracker page, open the menu for the Project Owner column on the Project Tracker Input Table and select Data validation:
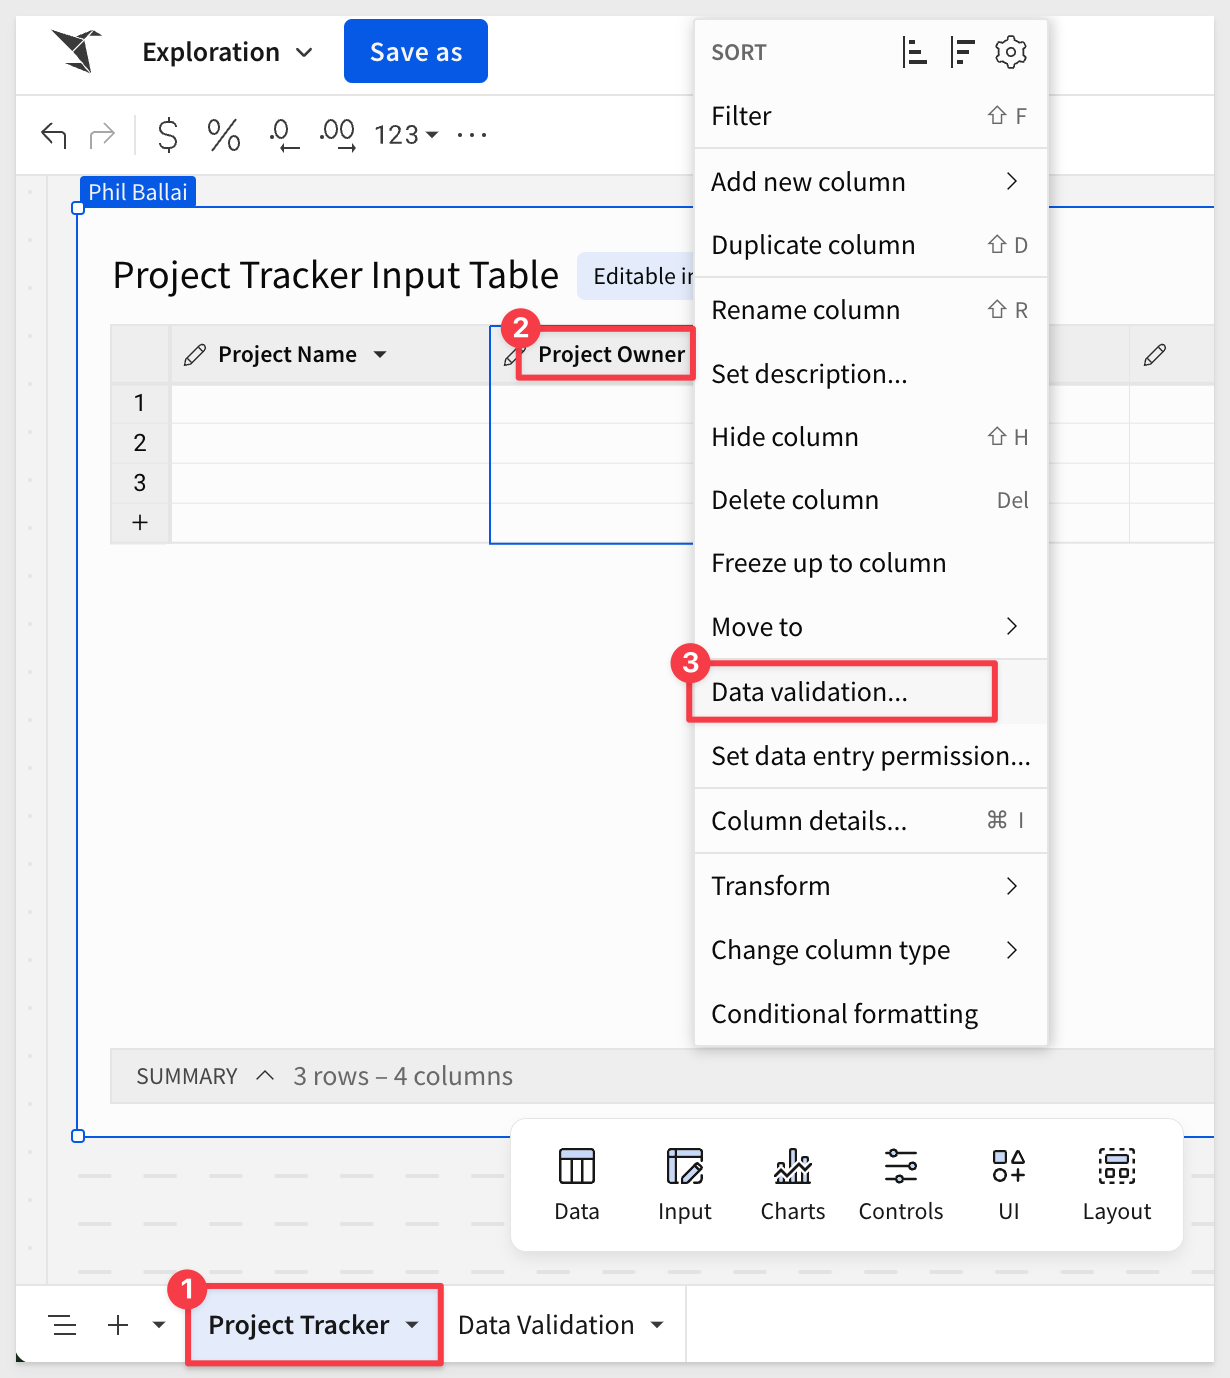
For Value source, select the Data Validation page and then Employees. Click Save.
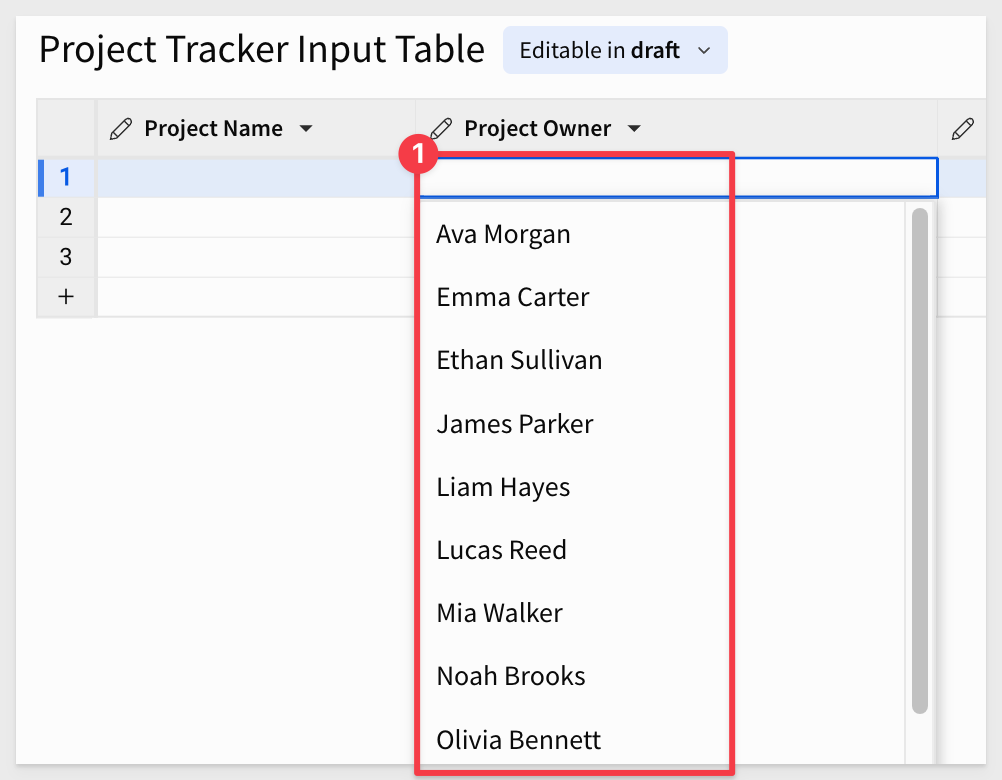
Now when the Project Owner column is restricted to the list of Employees from that input table:
Repeat this step for the Project Type column, using the Project Type input table as the source of validation value.
Delete any rows that may be present in the Project Tracker Input Table while we were building.
Step 7:
Add the following row of data to the Project Tracker Input Table.

Step 8:
Click the Save as button and name workbook as AI Apps Fundamentals.
Step 9:
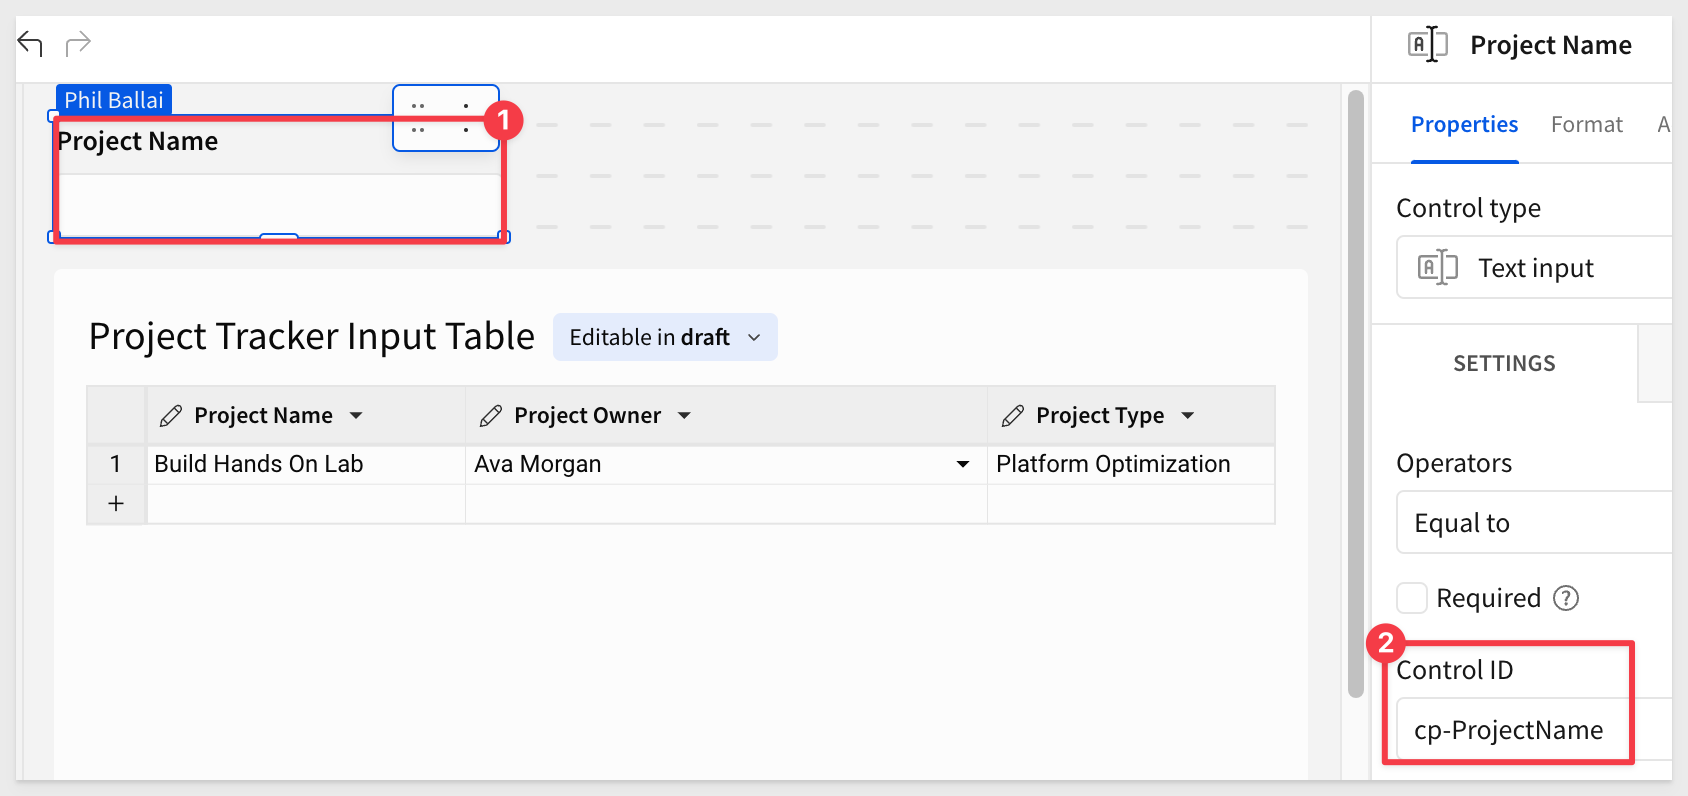
Using the element bar, in the Controls group, add a Text Input control above the input table:

Rename it Project Name.
With the Project Name control selected, change the Control ID to cp-ProjectName in the properties panel:
Step 10:
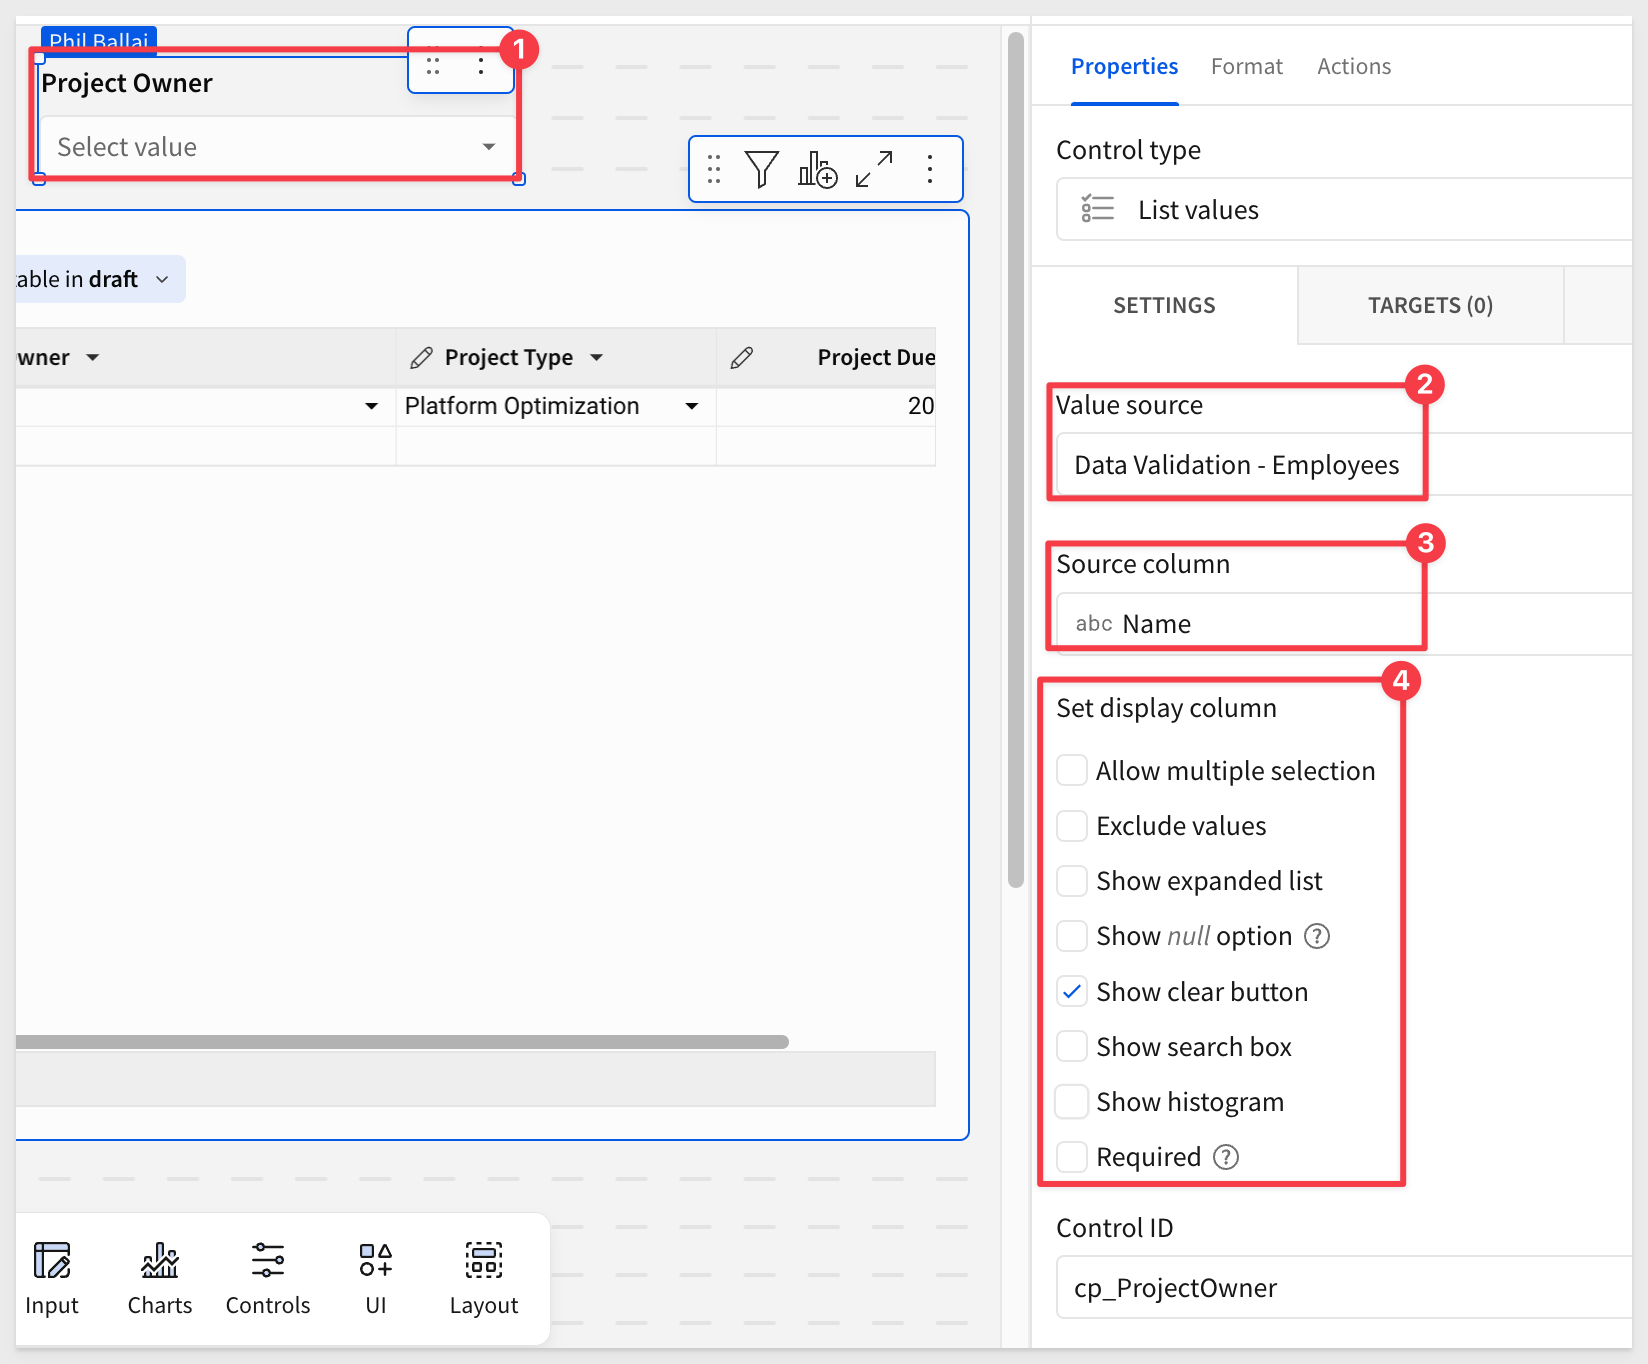
Add a List Values control element titled Project Owner.
In the properties panel under Value Source, select Data Validation > Employee and set the Source column to Name.
Ensure that only the Show Clear Button and Show Search Box are selected.
Rename the Control ID to cp_ProjectOwner:
Step 11:
Repeat step 10 for Project Type.
In the properties panel under Value Source, select Data Validation > Project Type and the Project Type column.
Rename the Control ID to cp_ProjectType.
Step 12:
Add a Date control titled Project Due Date with a Control ID of cp_ProjectDueDate.
The page should look like this now:

Step 13:
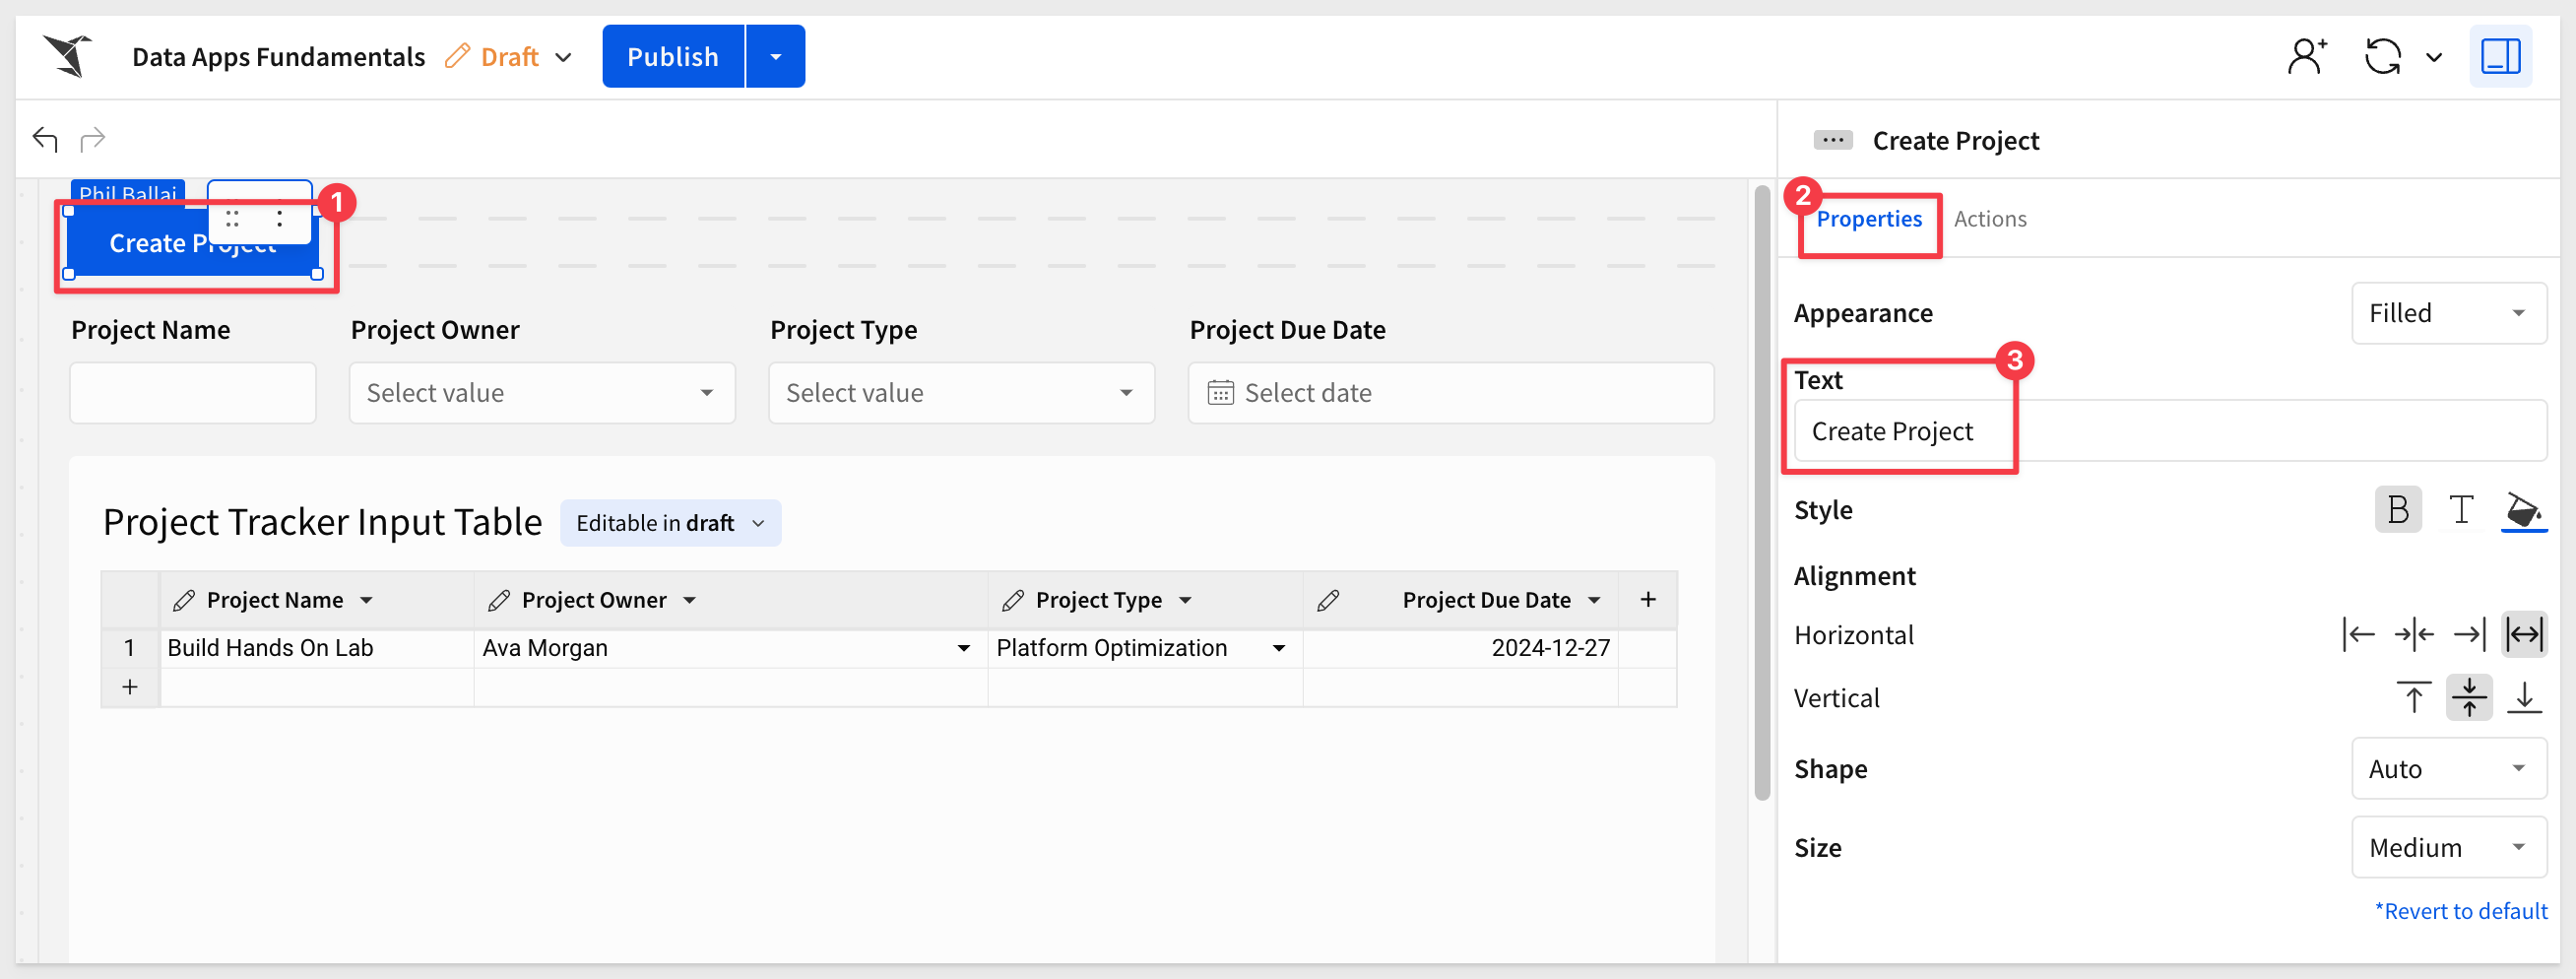
Add a button from the element bar, UI group to the page and set its name to Create Project:
Step 14:
On the Actions panel of the Create Project button, add a new action and select Insert Row.
Ensure the values align for each control to the Project Tracker Input Table:
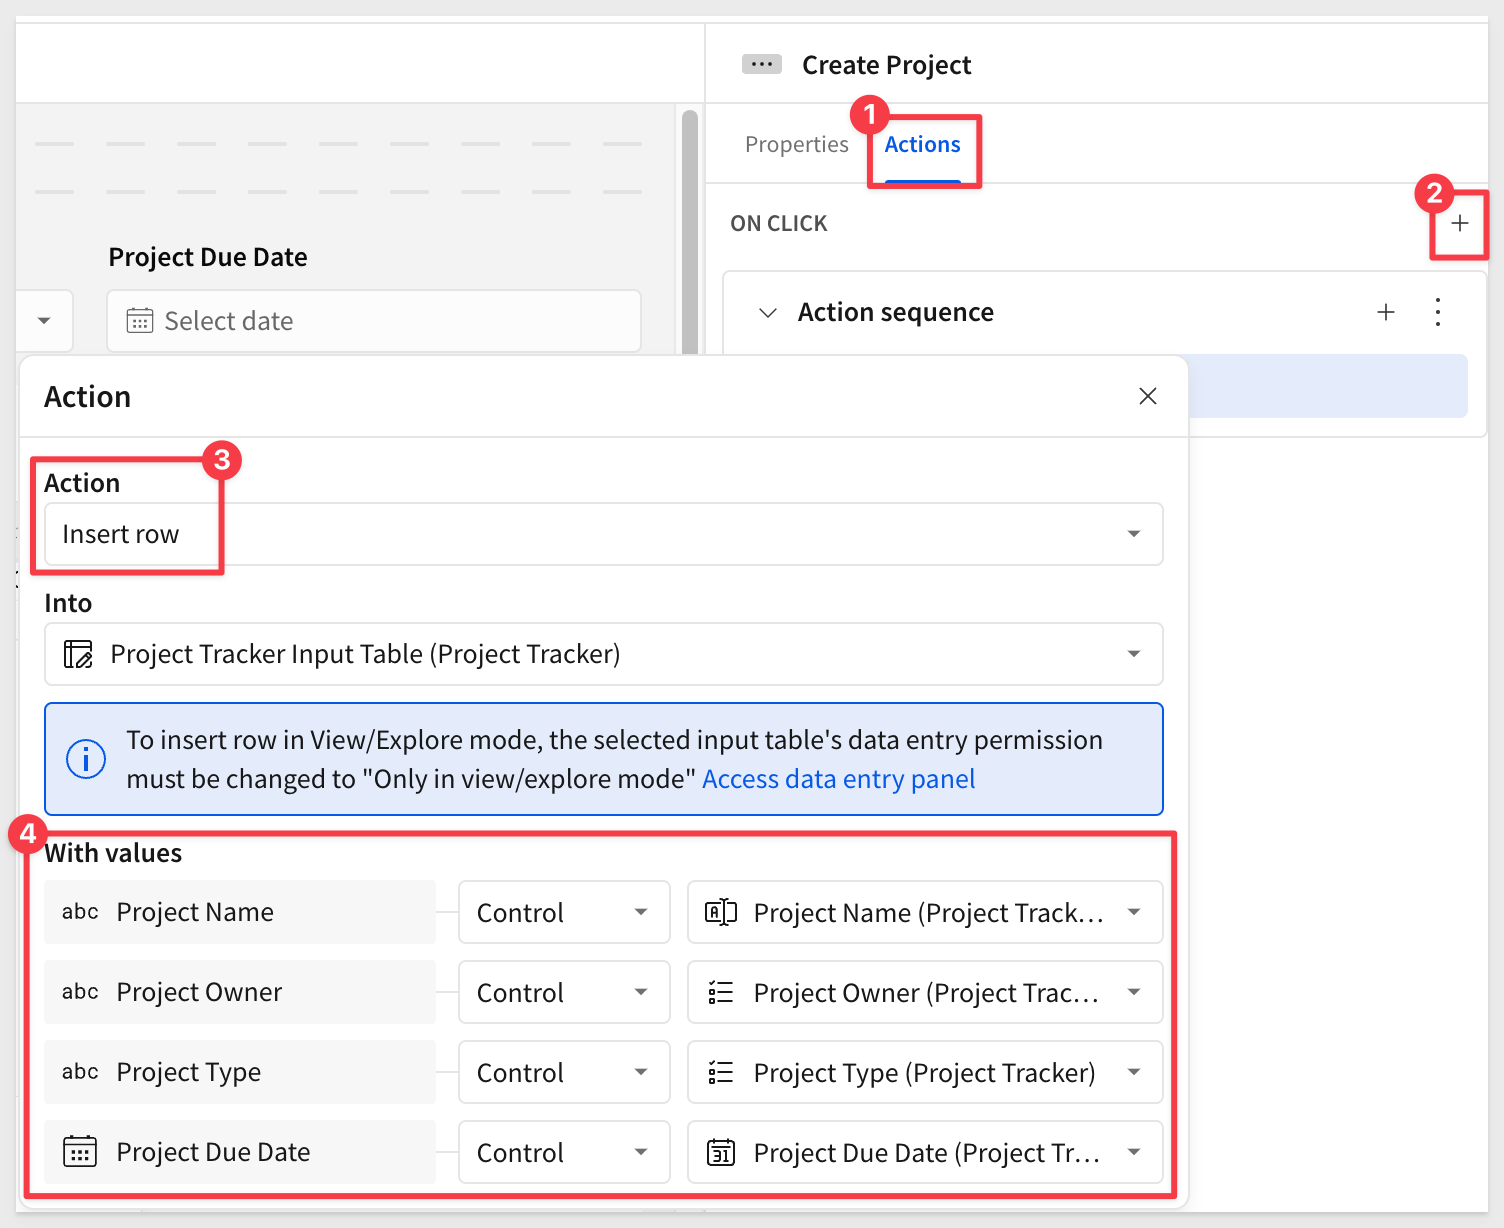
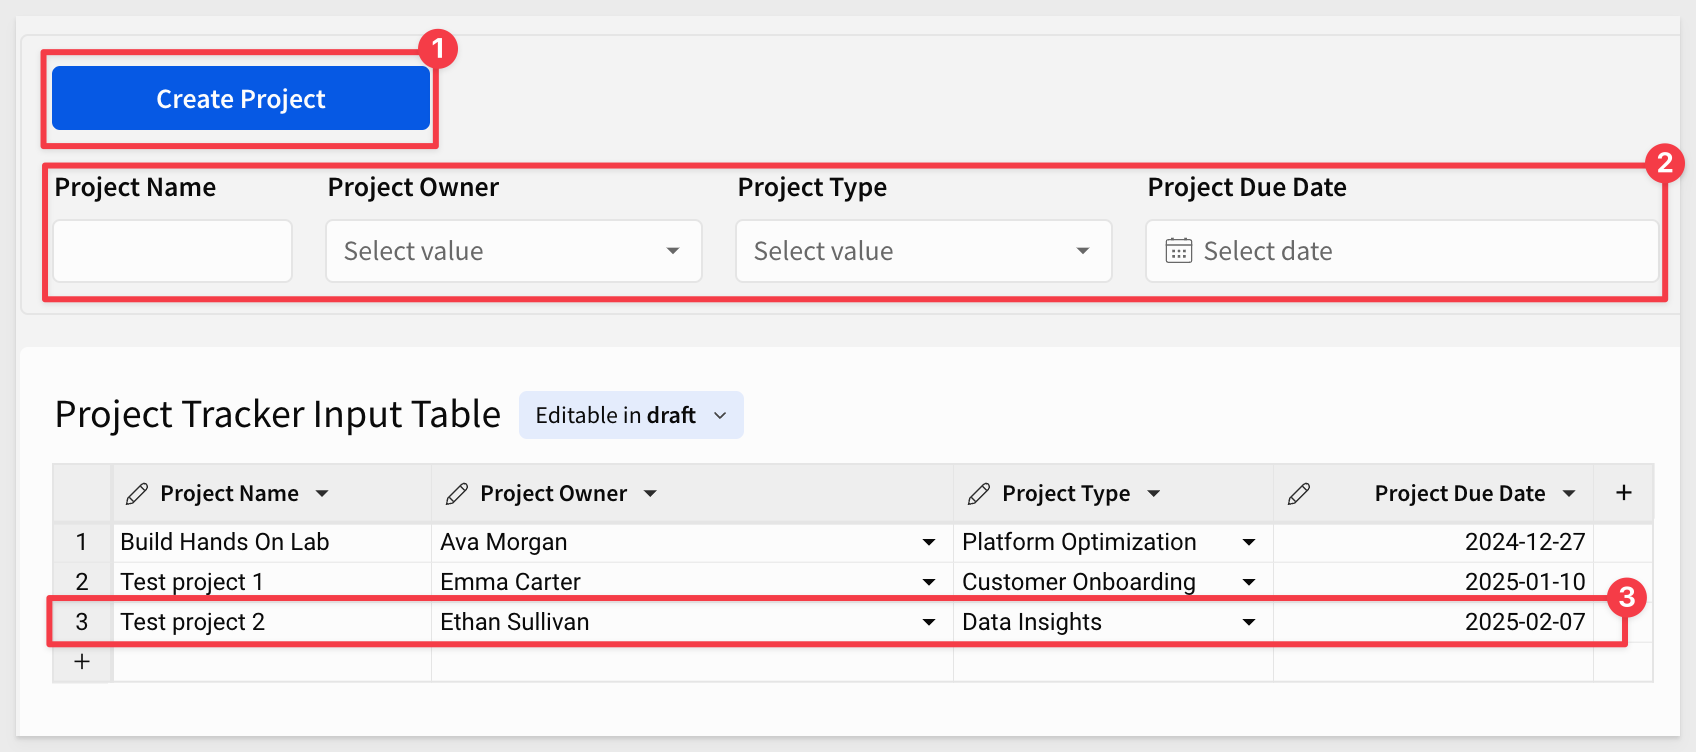
What this action does is add a new row to the input table, containing whatever values are set in the four controls on our page.
If you click the button with no values provided, an empty row is added to the input table. Right click that empty row and select Delete 1 row if needed.
Click Publish.
Step 15:
Once the action has been set up we may want to adjust the size of each control and the Create Project button.
Now let's create some projects. It does not really matter what your decide to use for the control, it is test data anyway.
For more information on this topic, see: Configure data governance options in input tables
Click the Create Project button to test if everything was set up correctly:

Step 16:
Select each control (shift+click) and the Create Project button.
At the top right, choose the Create container option from the selected elements menu:

Step 17:
Rename the container Create Project Container

Step 18:
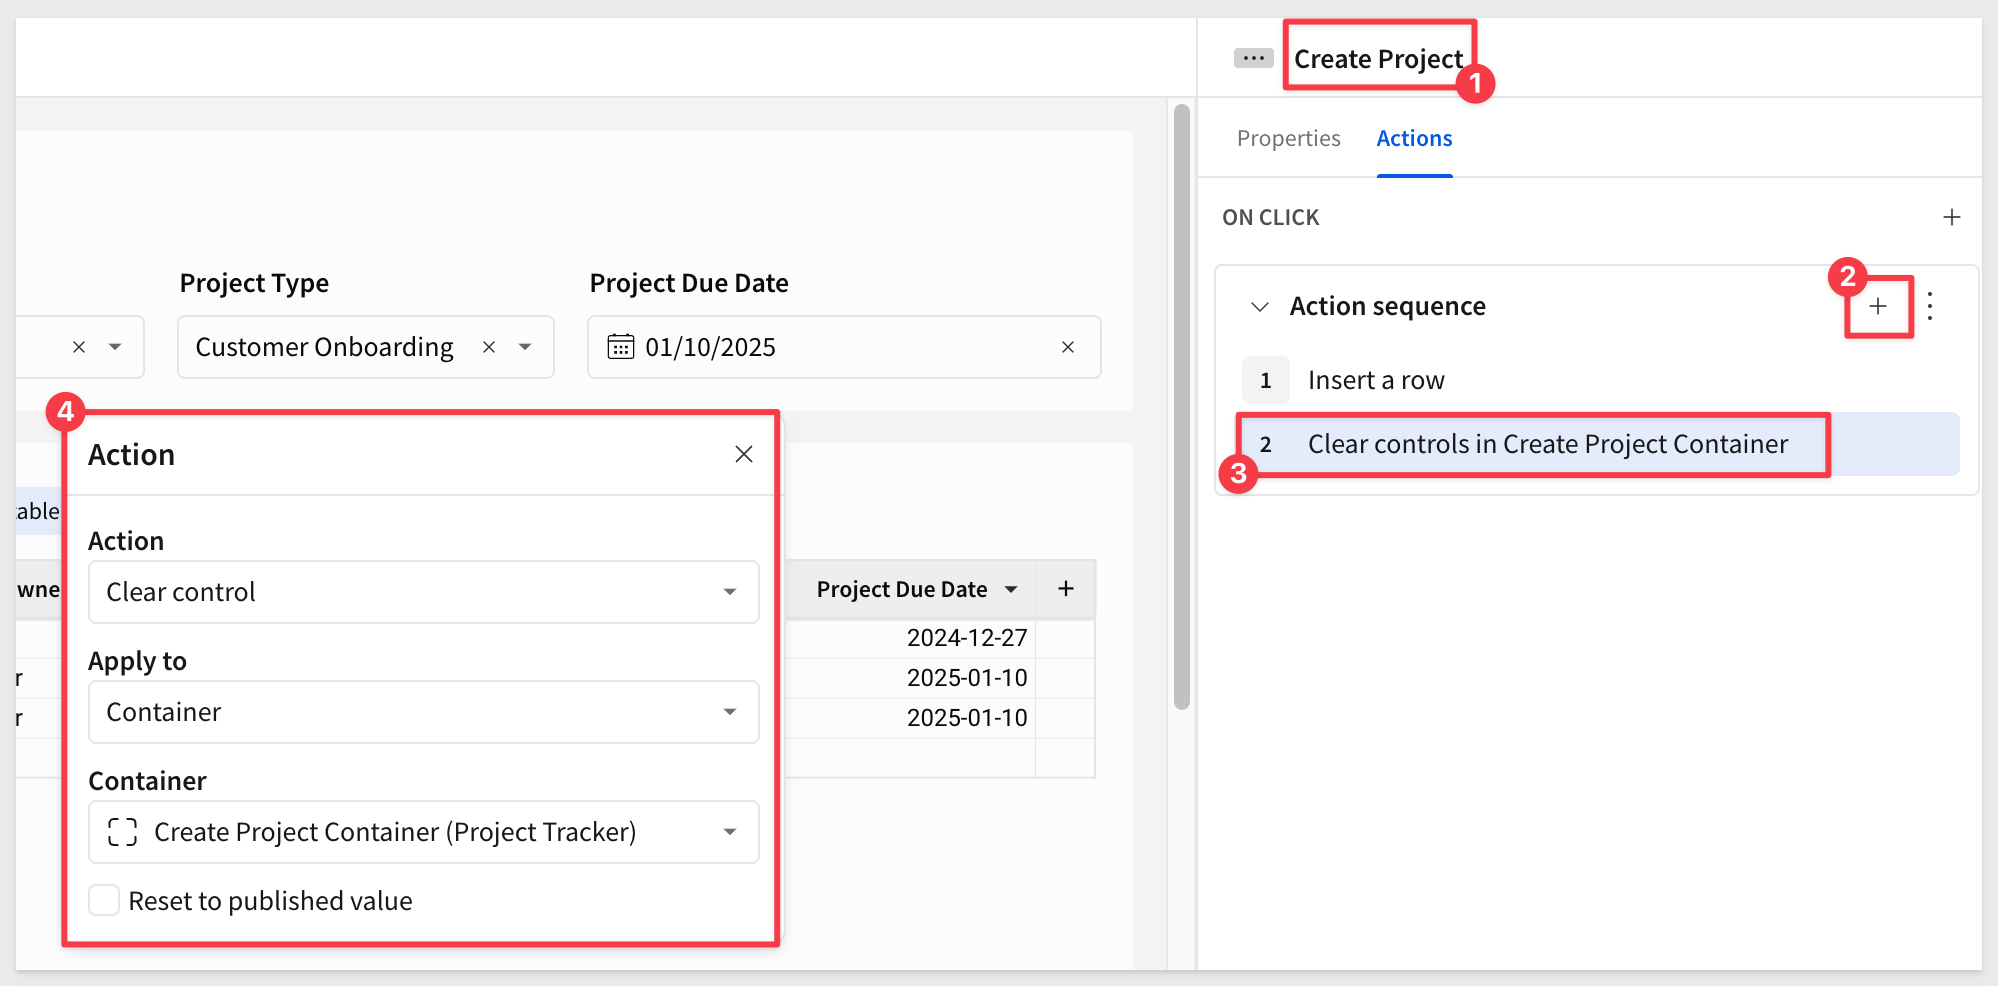
Click on your Create Project button, and go to Actions.
Create a second action set to Clear control applied to Container with our newly created Create Project Container. This will set the action to automatically target all four control elements:
Step 19:
Add an additional row of data to test the clear action on each control element within the container.
The updated Project Tracker Input Table should look as follows, with a new row of data and the controls cleared once the Create Project button is clicked:

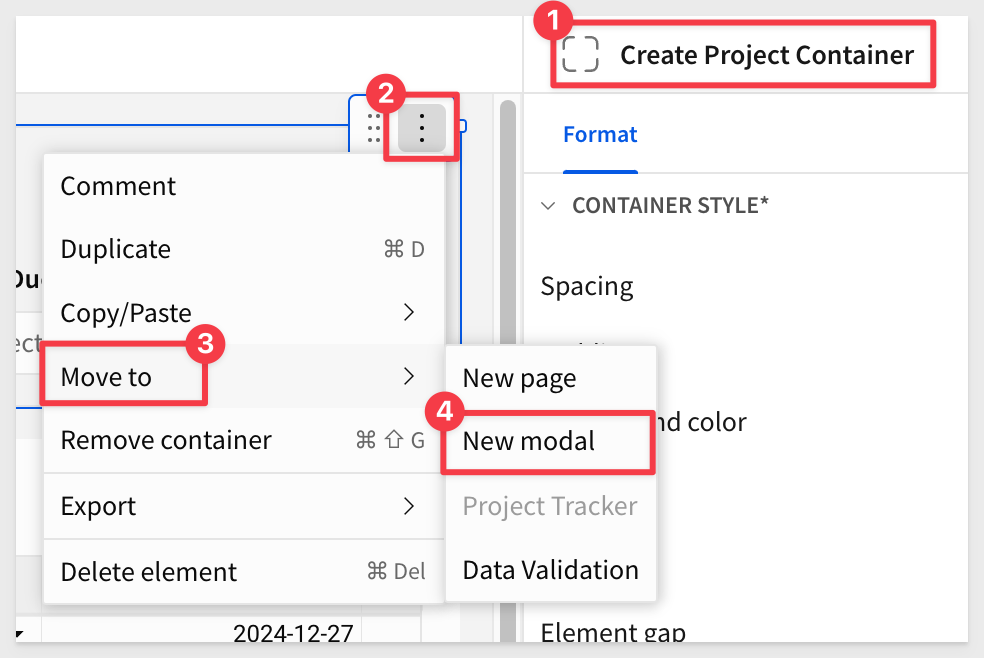
Step 1: Add a modal
Click on the Create Project container, and then click the  icon at the top right of the container.
Select the Move to > New Modal option.
Step 2:
Name the modal Modal - Create Project by changing the workbook page name.
By now, we assume you are familiar with where elements are accessed and configured in Sigma, so we may not show all steps.
Rename the title from New Modal to Create a New Project.
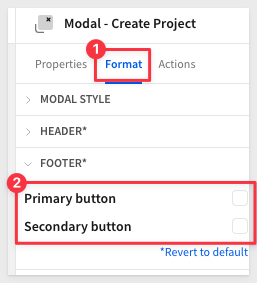
Deselect both Primary and Secondary button options under Footer in the selected element panel.
Move the various elements around and resize everything to suit. Trim any unnecessary space:
Step 3:
Create a new button and rename it to Clear Form.
In the actions panel, set the action to clear the Create Project Container. This is a good best practice for improving user experience.
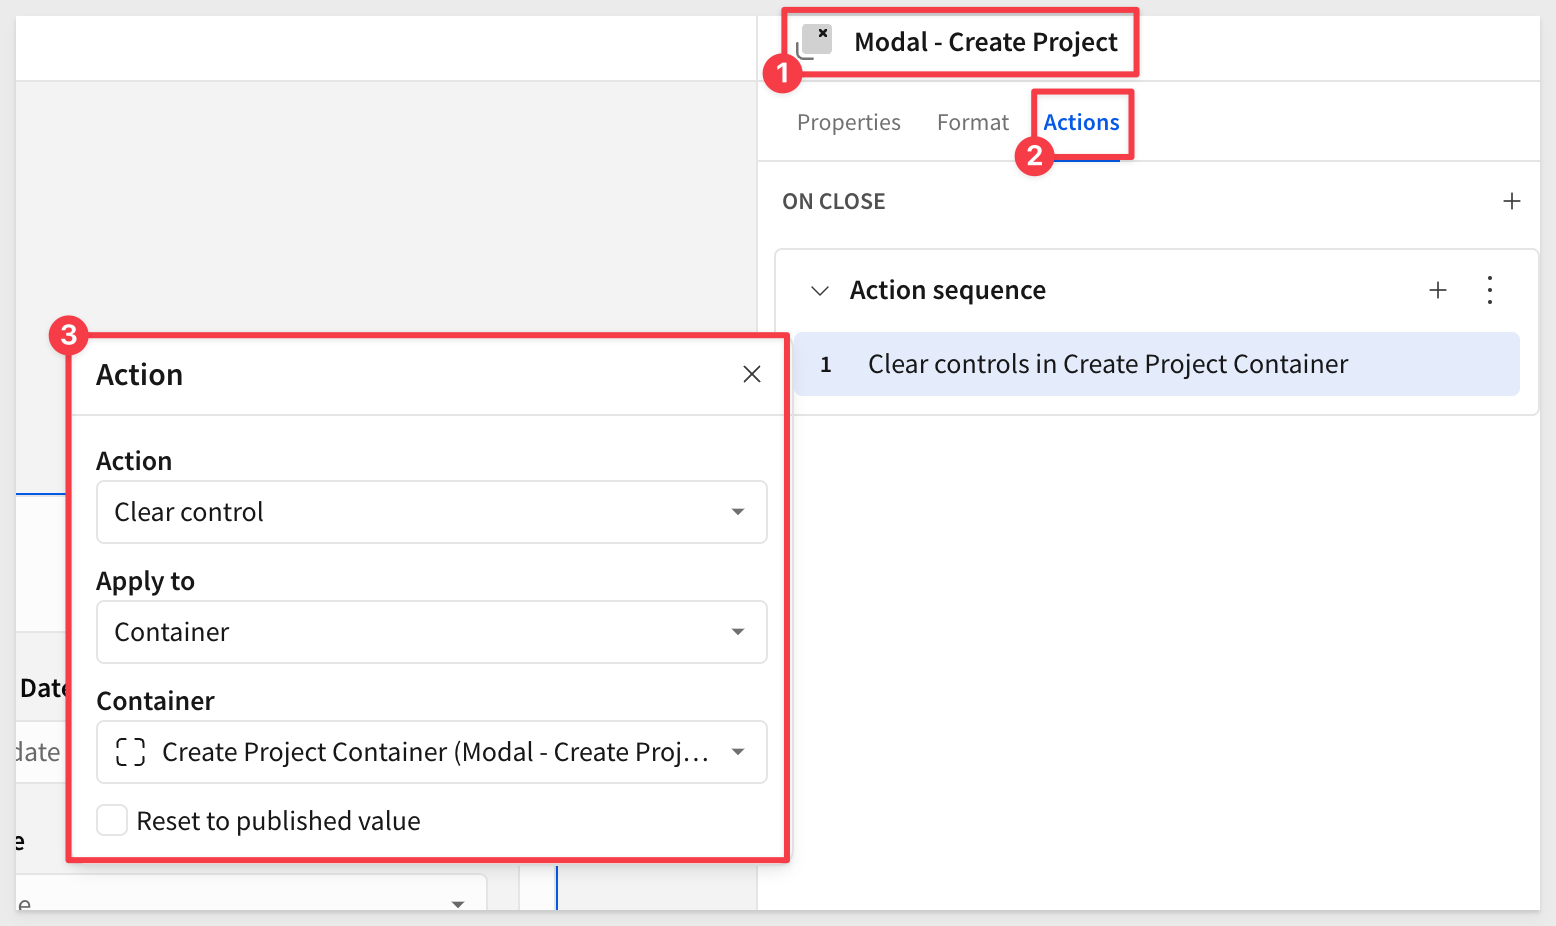
Step 4:
Add an action to the Create Project button to Close Modal:
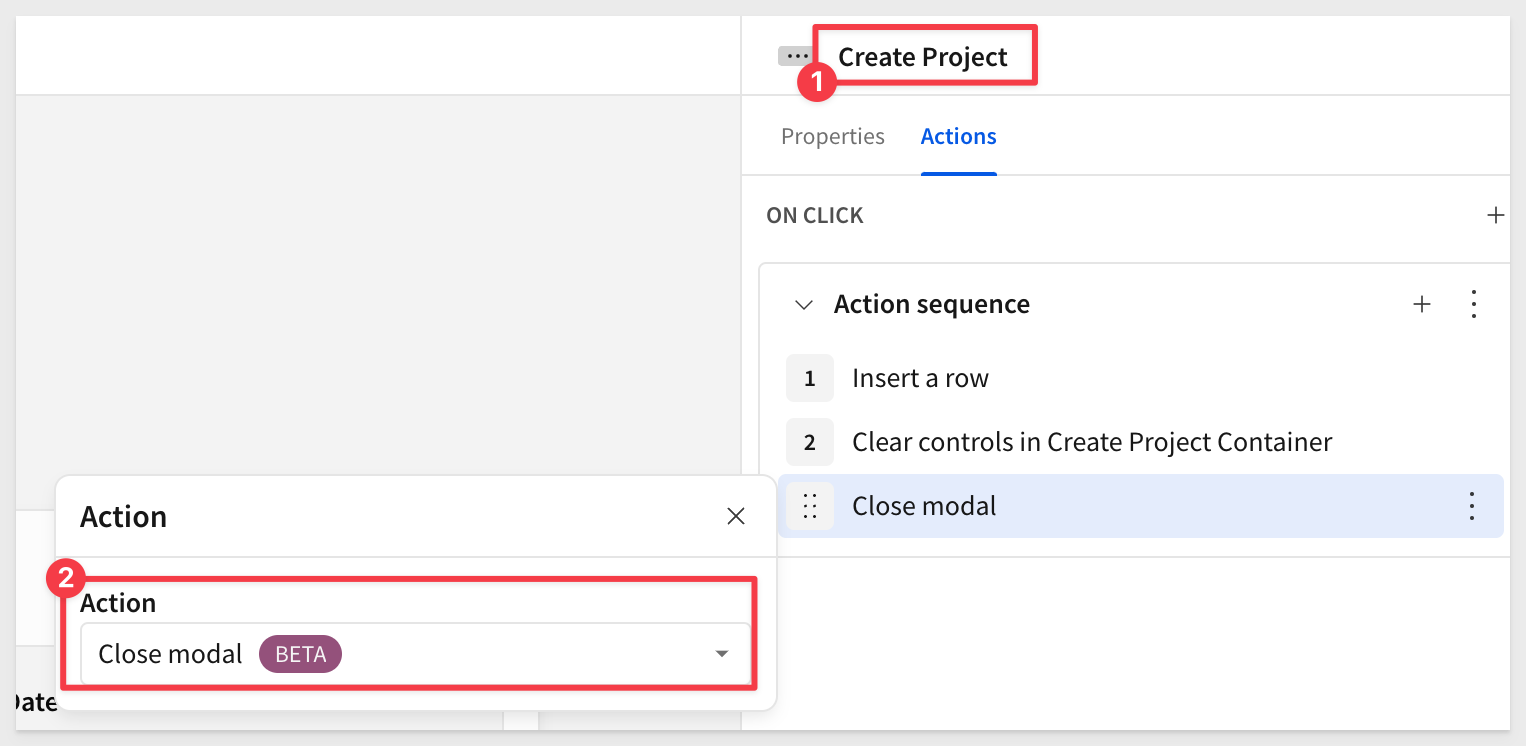
Actions can be added in series to create dynamic behaviors. For more information see Configure an action sequence
Step 5:
Return to the Project Tracker page and add a button titled Create Project.
This button replaces the Create Project button we moved to the modal earlier.
Add an action to Open a Modal for the Modal - Create Project:

Step 6:
Click the Create Project button to test the action. Modal - Create Project should opens. Check that add a record, clear and create project works to add a new row in the Project Tracker.
Congratulations You have now successfully built a form to do controlled data entry into the Project Table!
Considering how easy that was AND data is being written automatically to the cloud data warehouse, that is pretty slick. Let's go further still.
Step 7: Create page controls
On the Project Tracker Input Table page, create filters for the Project Name, Project Owner, and Project Type one at a time.
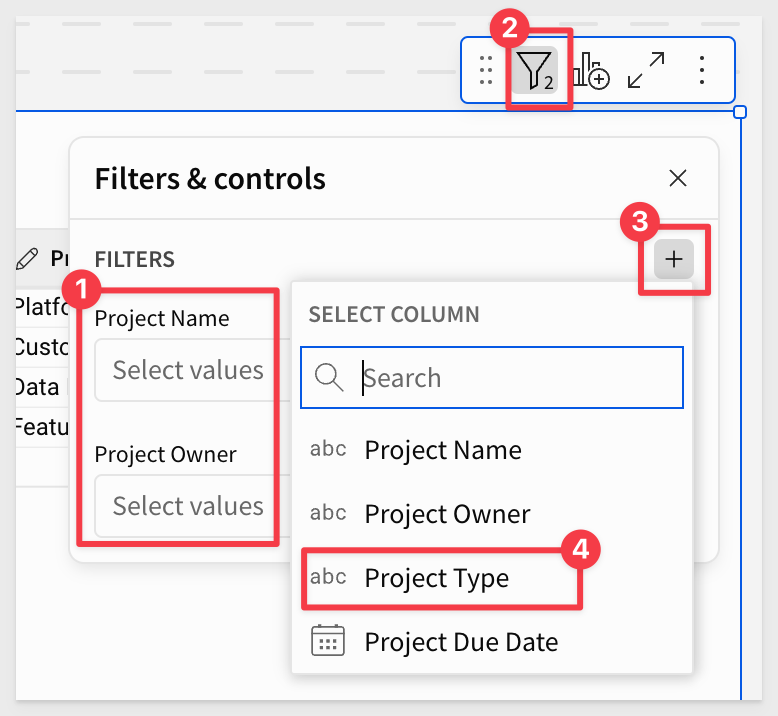
For more information on keyboard shortcuts in Sigma, check out these docs:
Convert to each filter to a page control by selecting the vertical ellipsis:
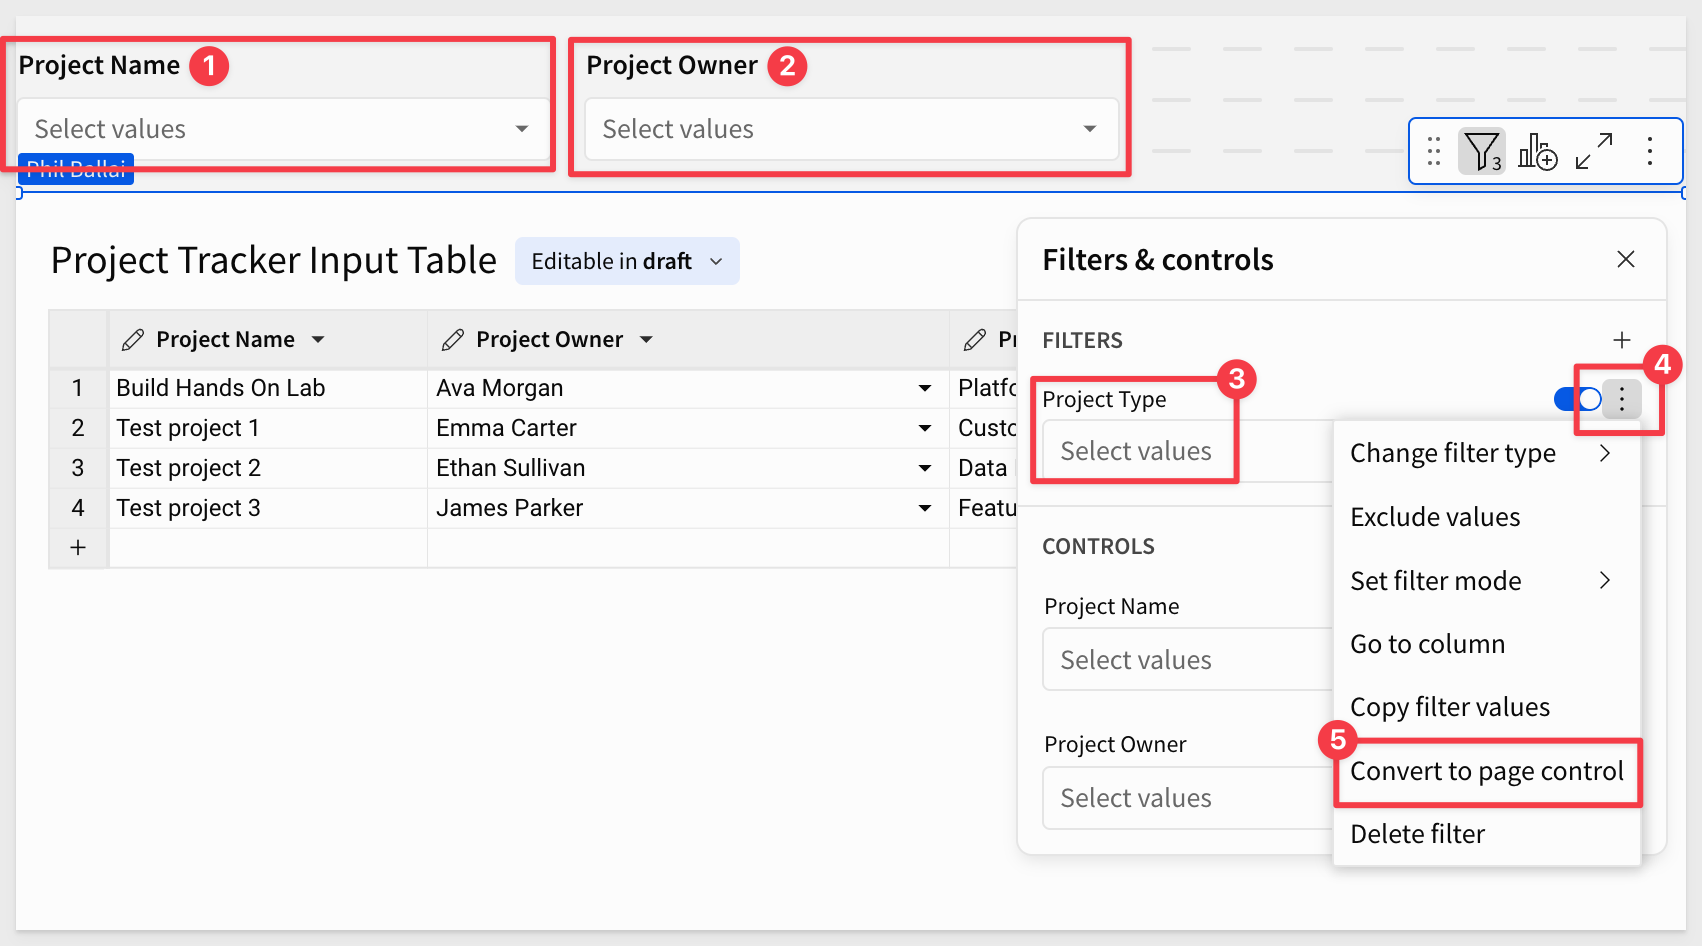
Rename each of the control IDs to have filter- prepended as:
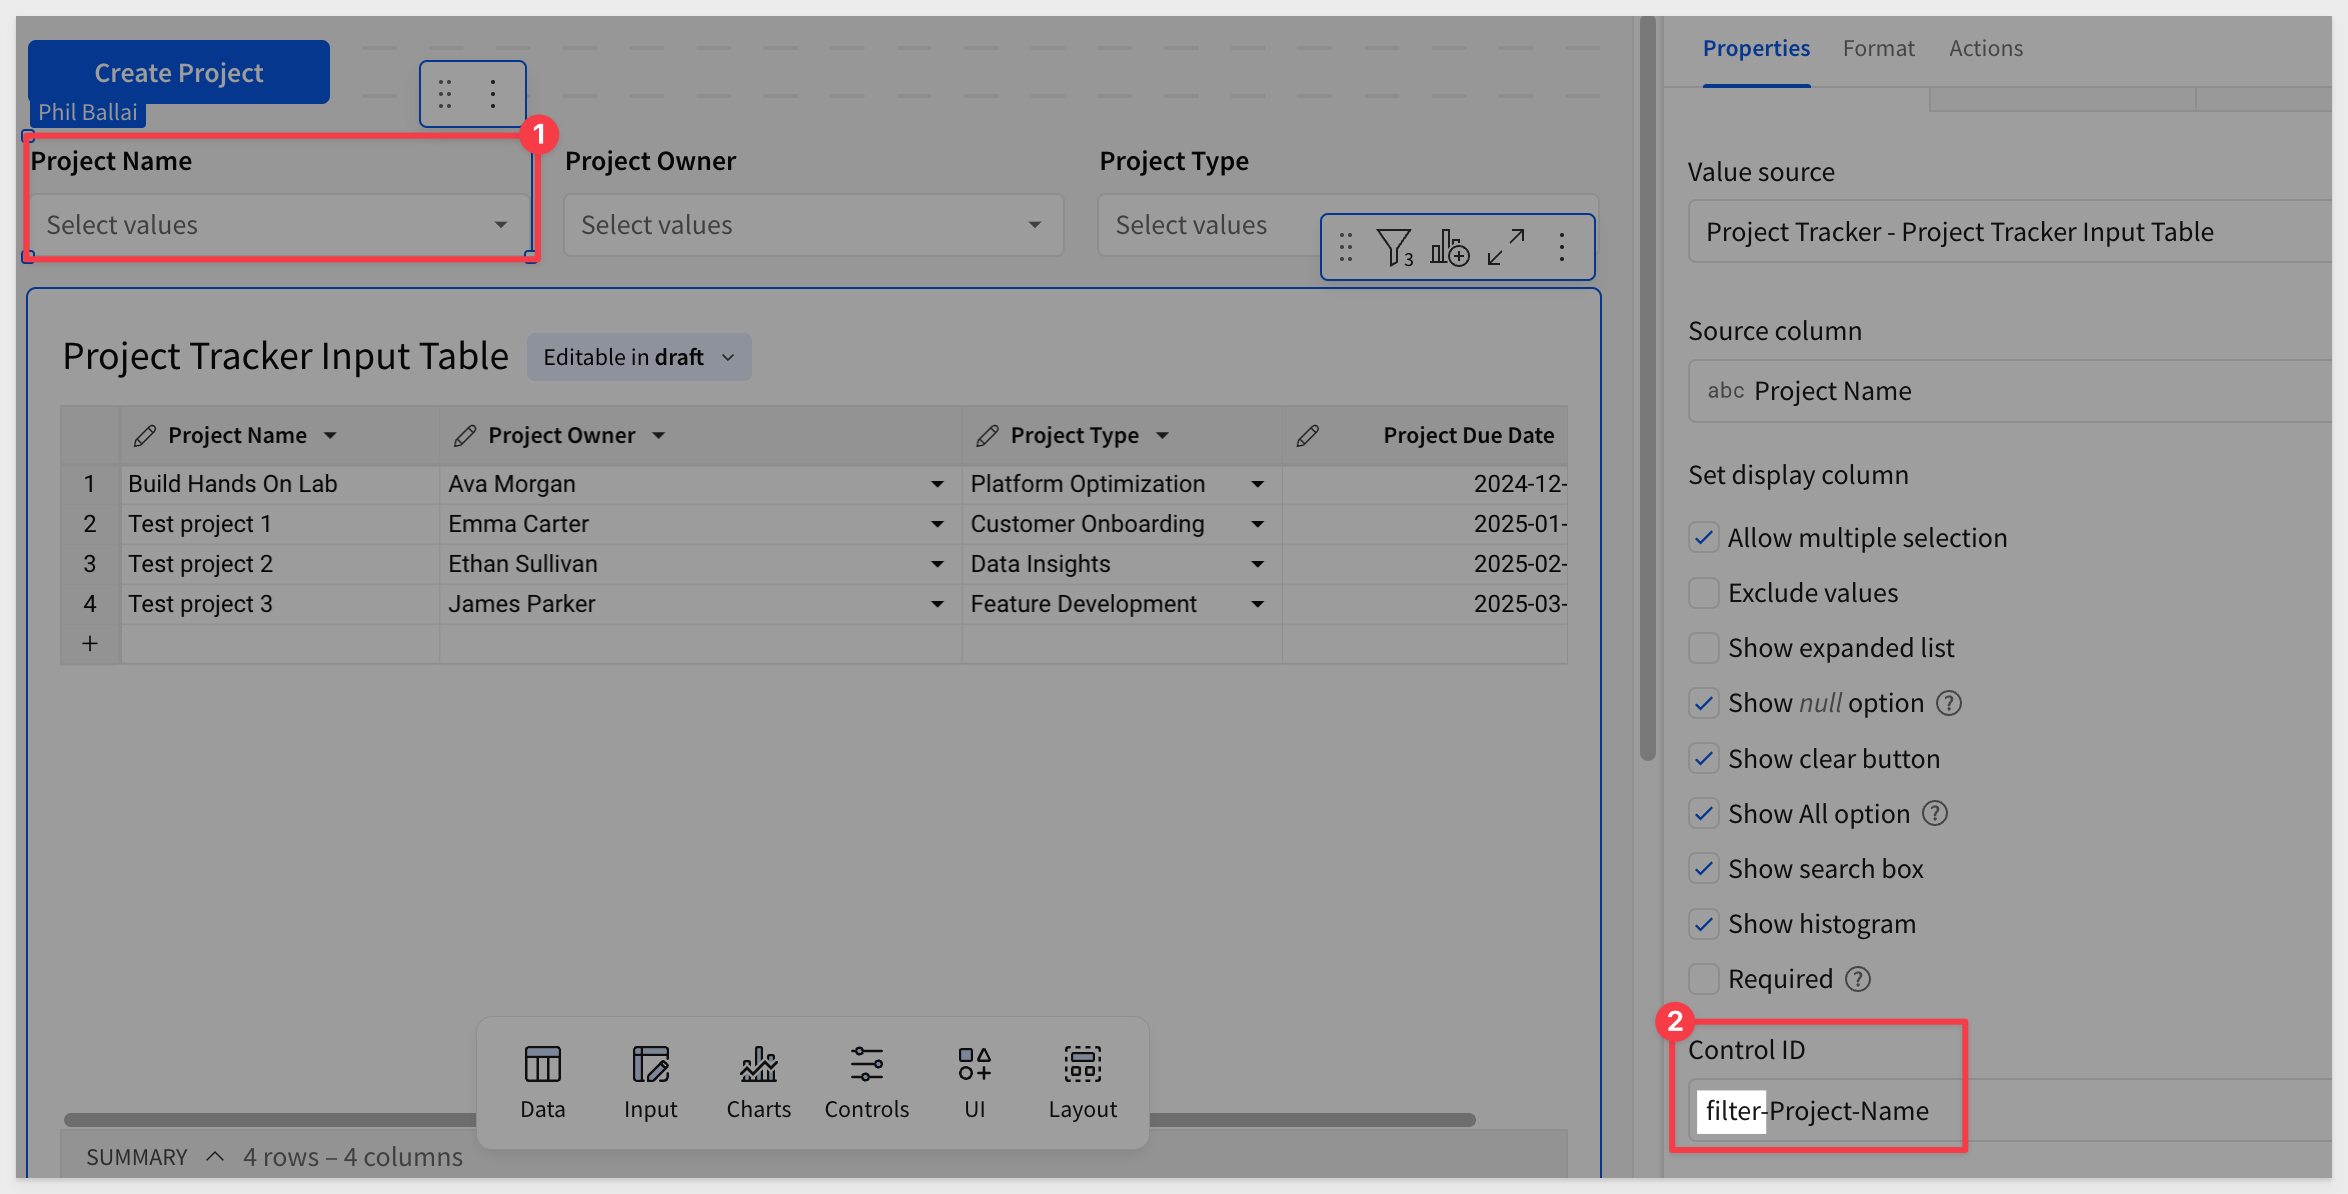
Click Publish.
Step 8: Container it
Select the filters and place them into a container titled Filters Container,
Move this container to a new modal titled Modal - Filters.
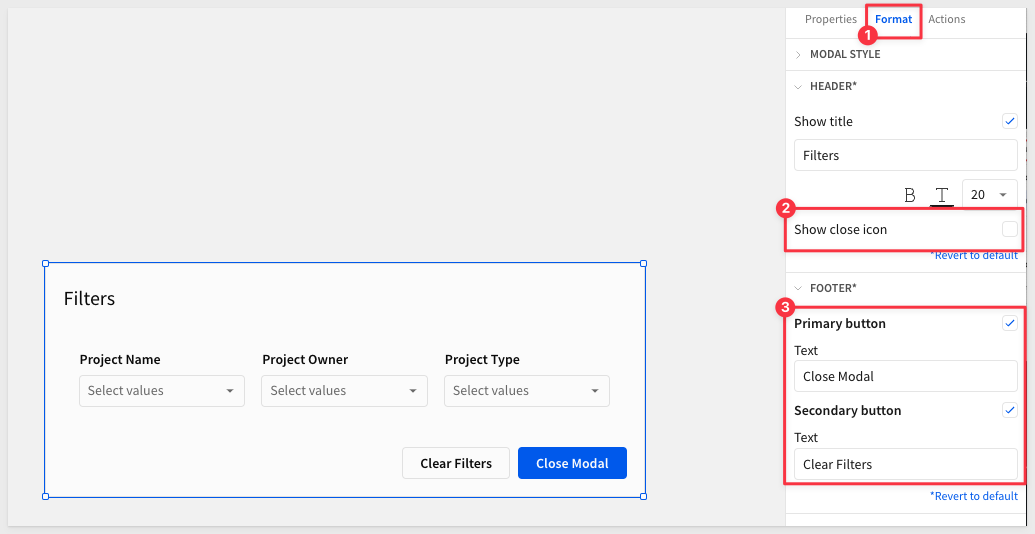
Add a Filters title and this time keep the footer buttons naming the primary Close Modal and the secondary Clear Filters. Deselect the checkbox for Show close icon, since we will have a button to do that.
Step 9:
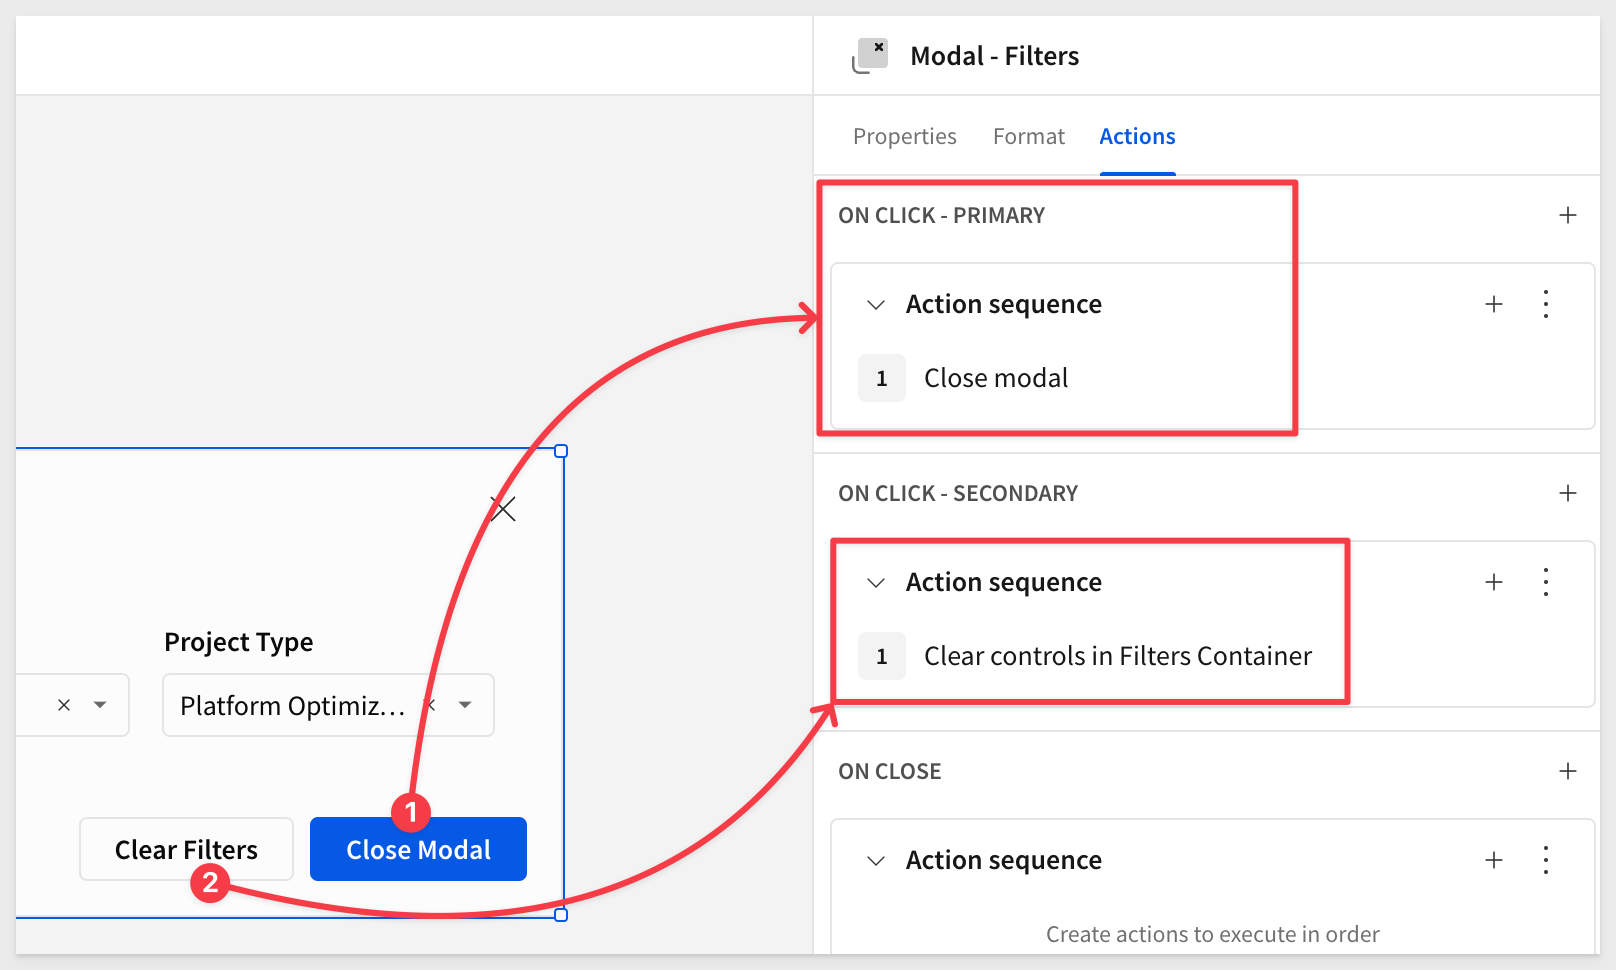
On the actions tab of Modal - Filters configure the Close Modal button to Close a Modal.
The secondary configure Clear Filters to Clear control on the Filters Container:
Step 10:
Back on the Project Tracker page, add another button for Project Filters with an action to Open Modal on Modal - Filters.
Add an additional button named Clear Filters.
Select all three buttons and place those into a container titled Buttons Container.

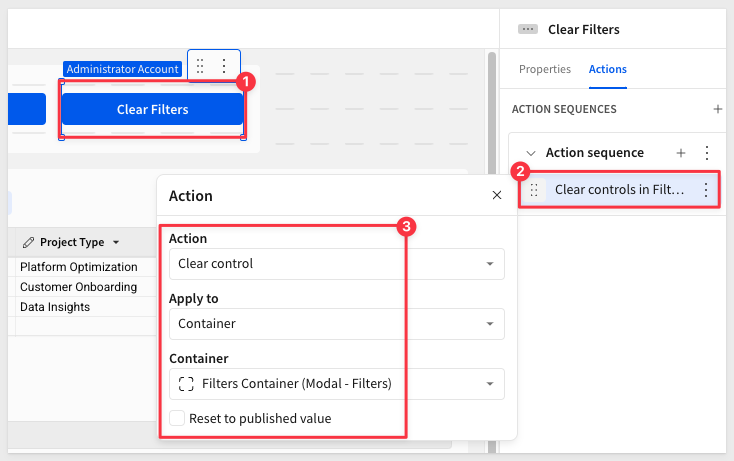
Set the action on the Clear Filters button to clear the Filters Container (Modal - Filters).
Test that the new buttons work as expected.
Our AI App is beginning to take form by mixing and matching Sigma building blocks.
Step 11:
Customize the title for the Project Filters button by adding a ( followed by the = sign, which will open a pop up for use to use a custom formula:
Use the following formula:
Sum(If(ArrayLength([filter-Project-Name]) > 0, 1, 0) +
If(ArrayLength([filter-Project-Type]) > 0, 1, 0) +
If(ArrayLength([filter-Project-Owner]) > 0, 1, 0))
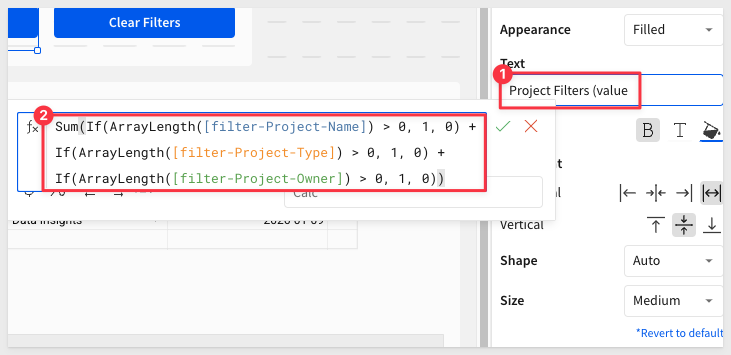
Once the formula is good, click the green checkmark:

Add one more ) to make the value surrounded by ().
Click the Project Filters button and set a few filters.
This results in a count when filters are selected:


Step 1: Add page
Add a new page named Control Panel.
This will be the central hub and spine for the AI App which ensures governance over the circular flow of data.
Step 2:
On the Project Tracker page, add three new columns using any of the drop downs for Last Updated At, Last Updated By, and ID.

Rename ID to Project ID, click it's column header and drag it over so that it is in the first position on the table:

Step 3:
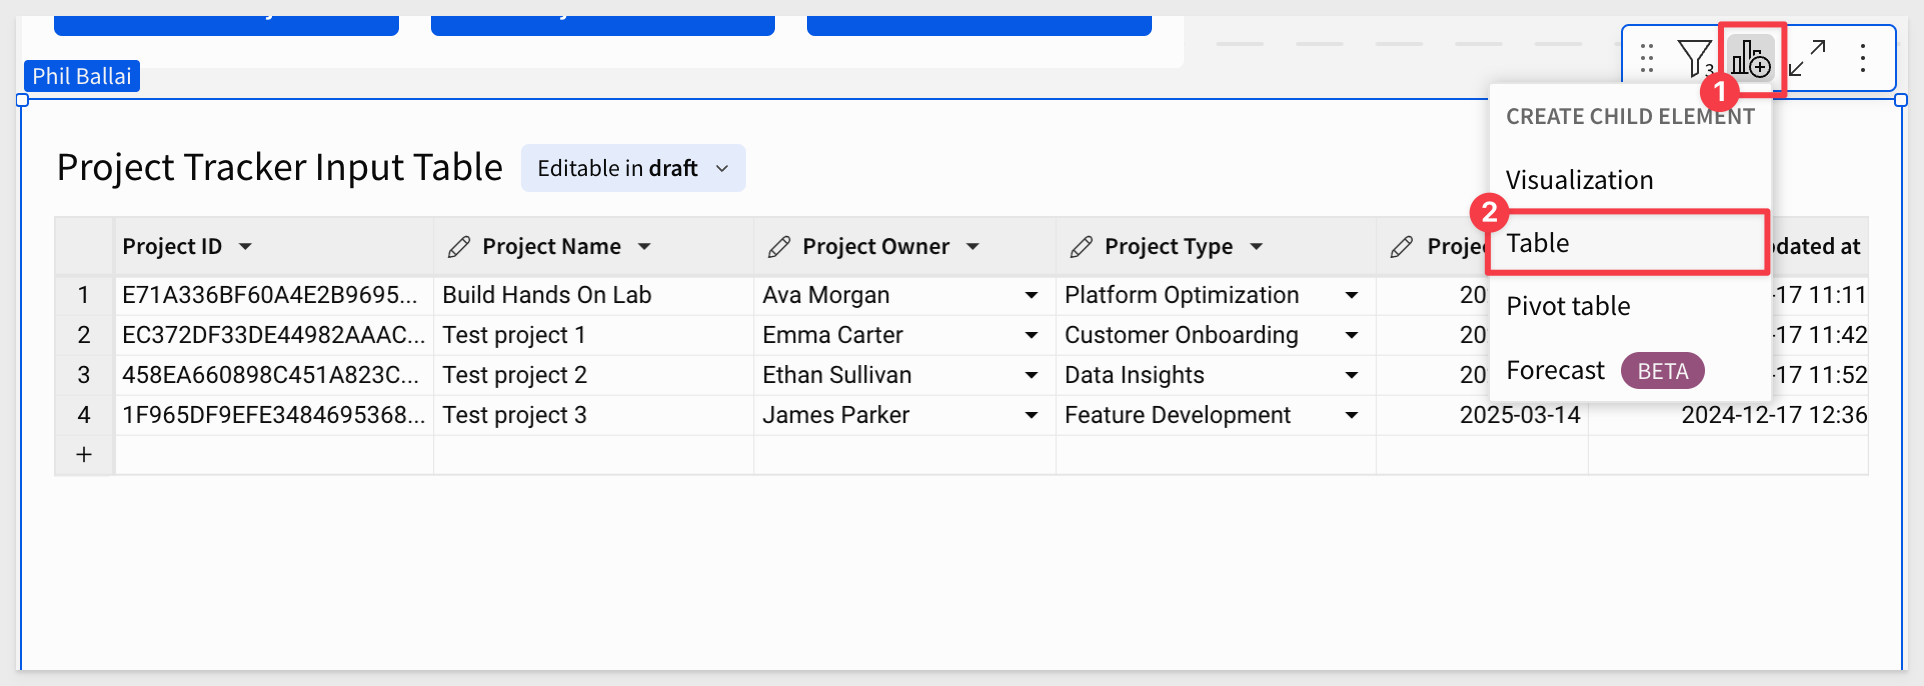
Create a child table from the Project Tracker Input Table and rename the child Project Tracker Stable Table:
Step 4:
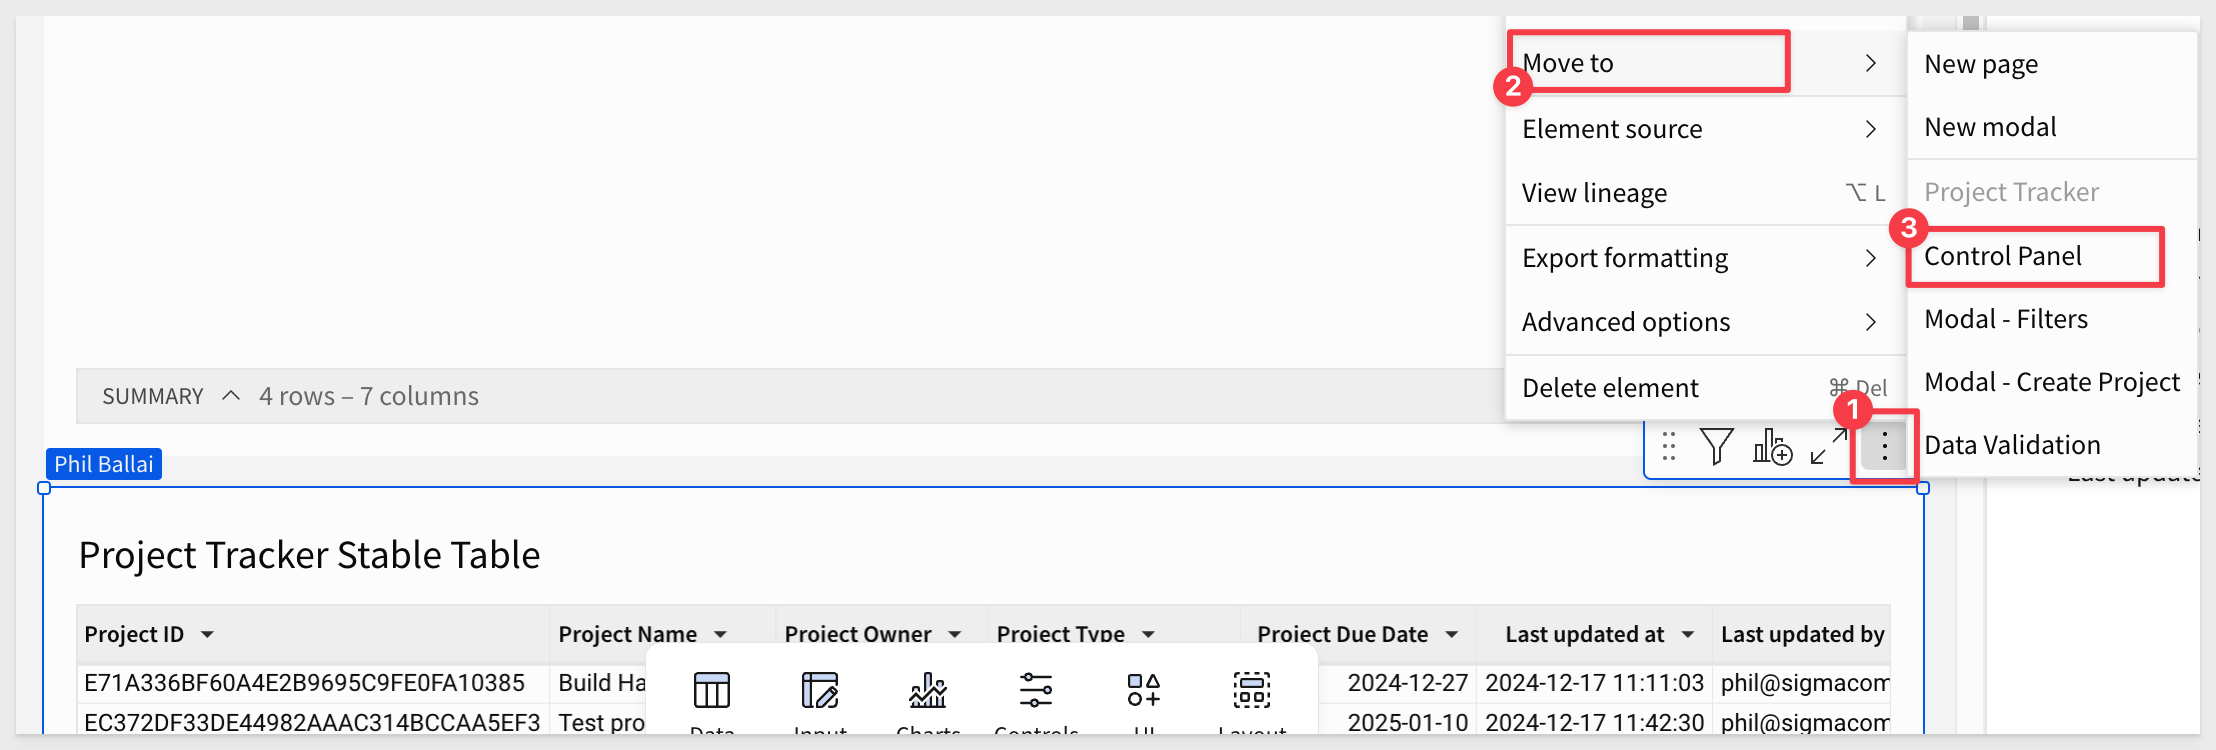
Move the Project Tracker Stable Table to the Control Panel page.
Step 5:
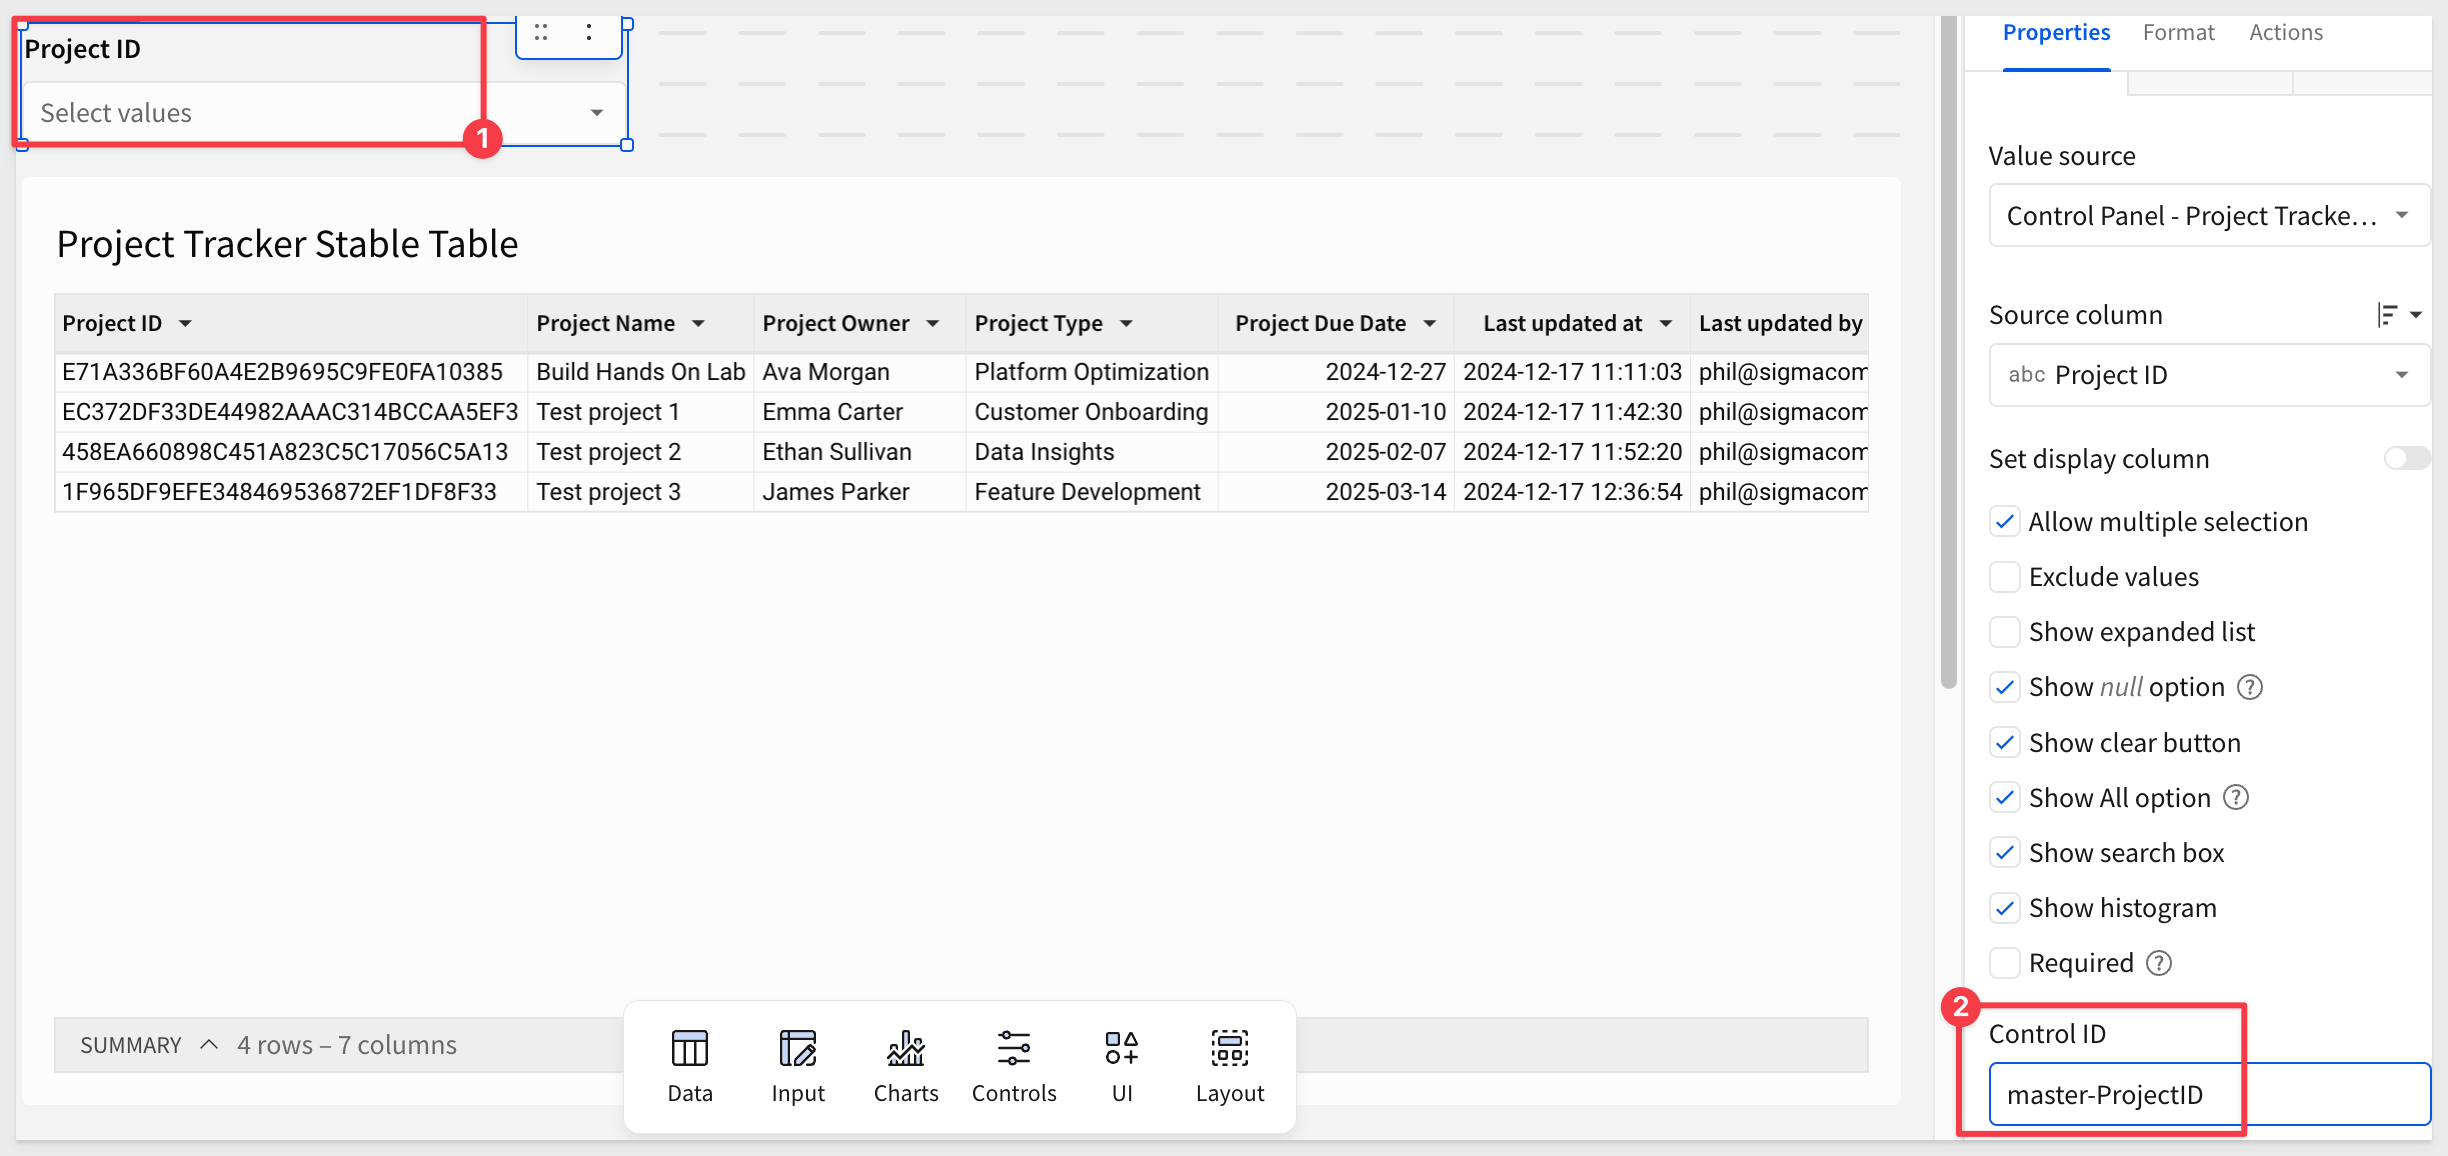
On the Control Panel page, from the Project Tracker Stable Table filter Project ID and convert it to a page control.
Rename the Control ID to master-ProjectID:
Step 6:
Add another page control filter, this time for Project Name.
Rename the Control ID to master-Project-Name.
Step 7:
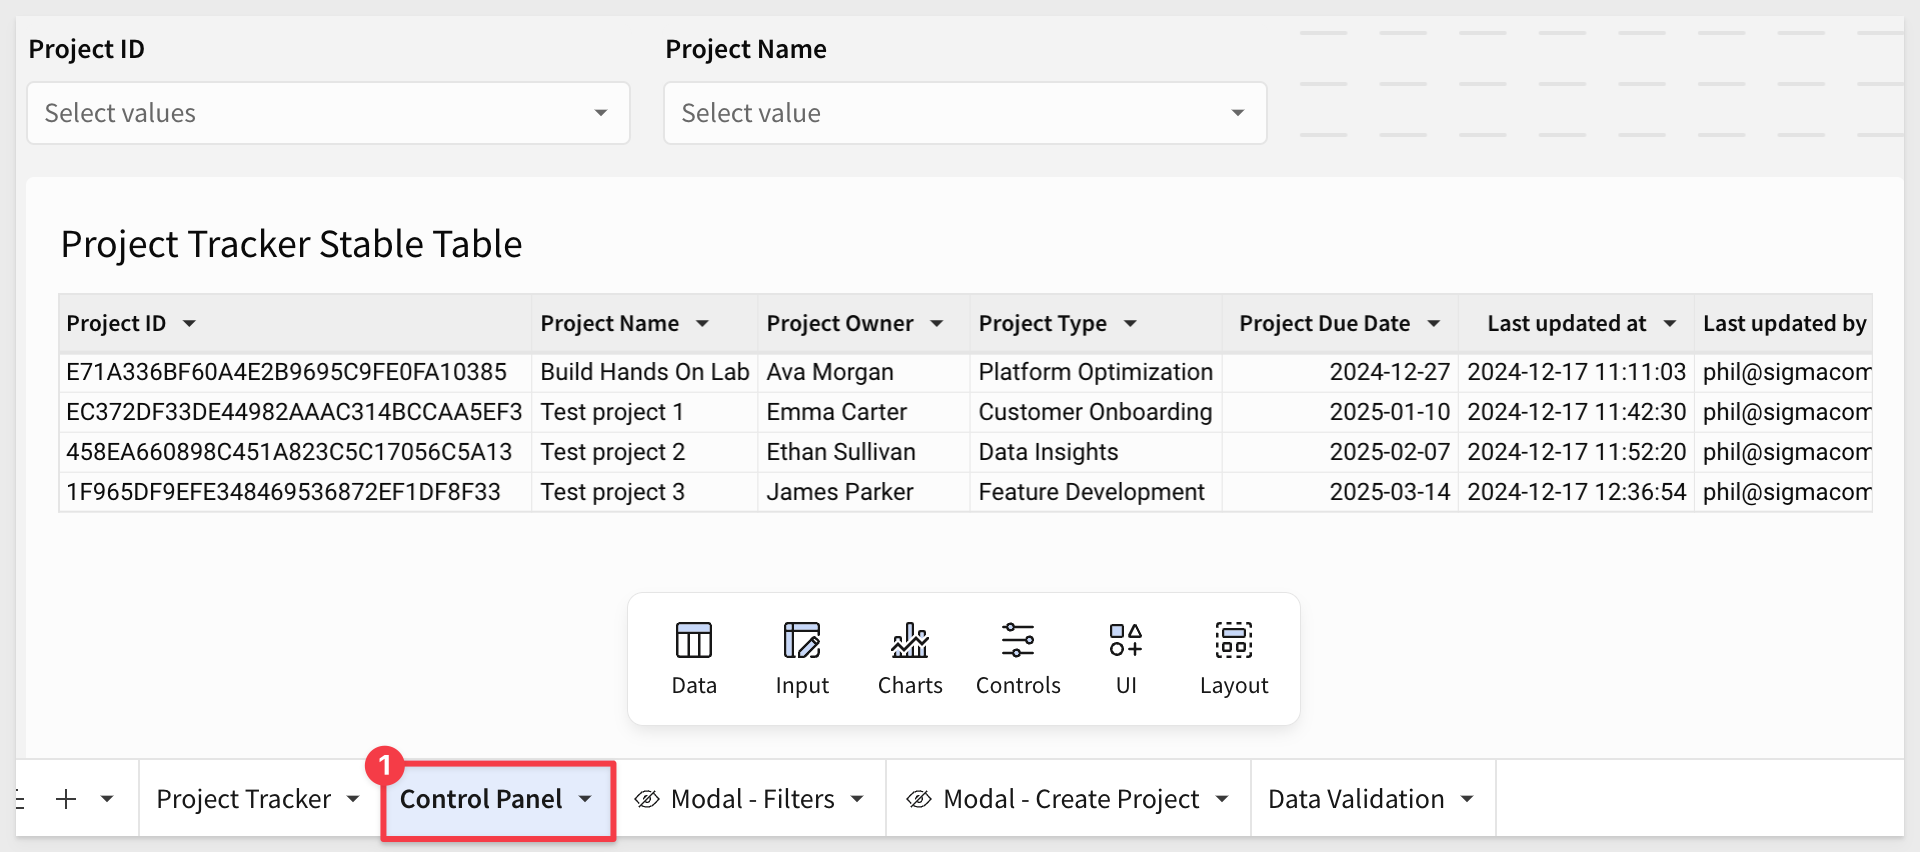
The Control Panel page should look as follows at this stage:

Step 1:
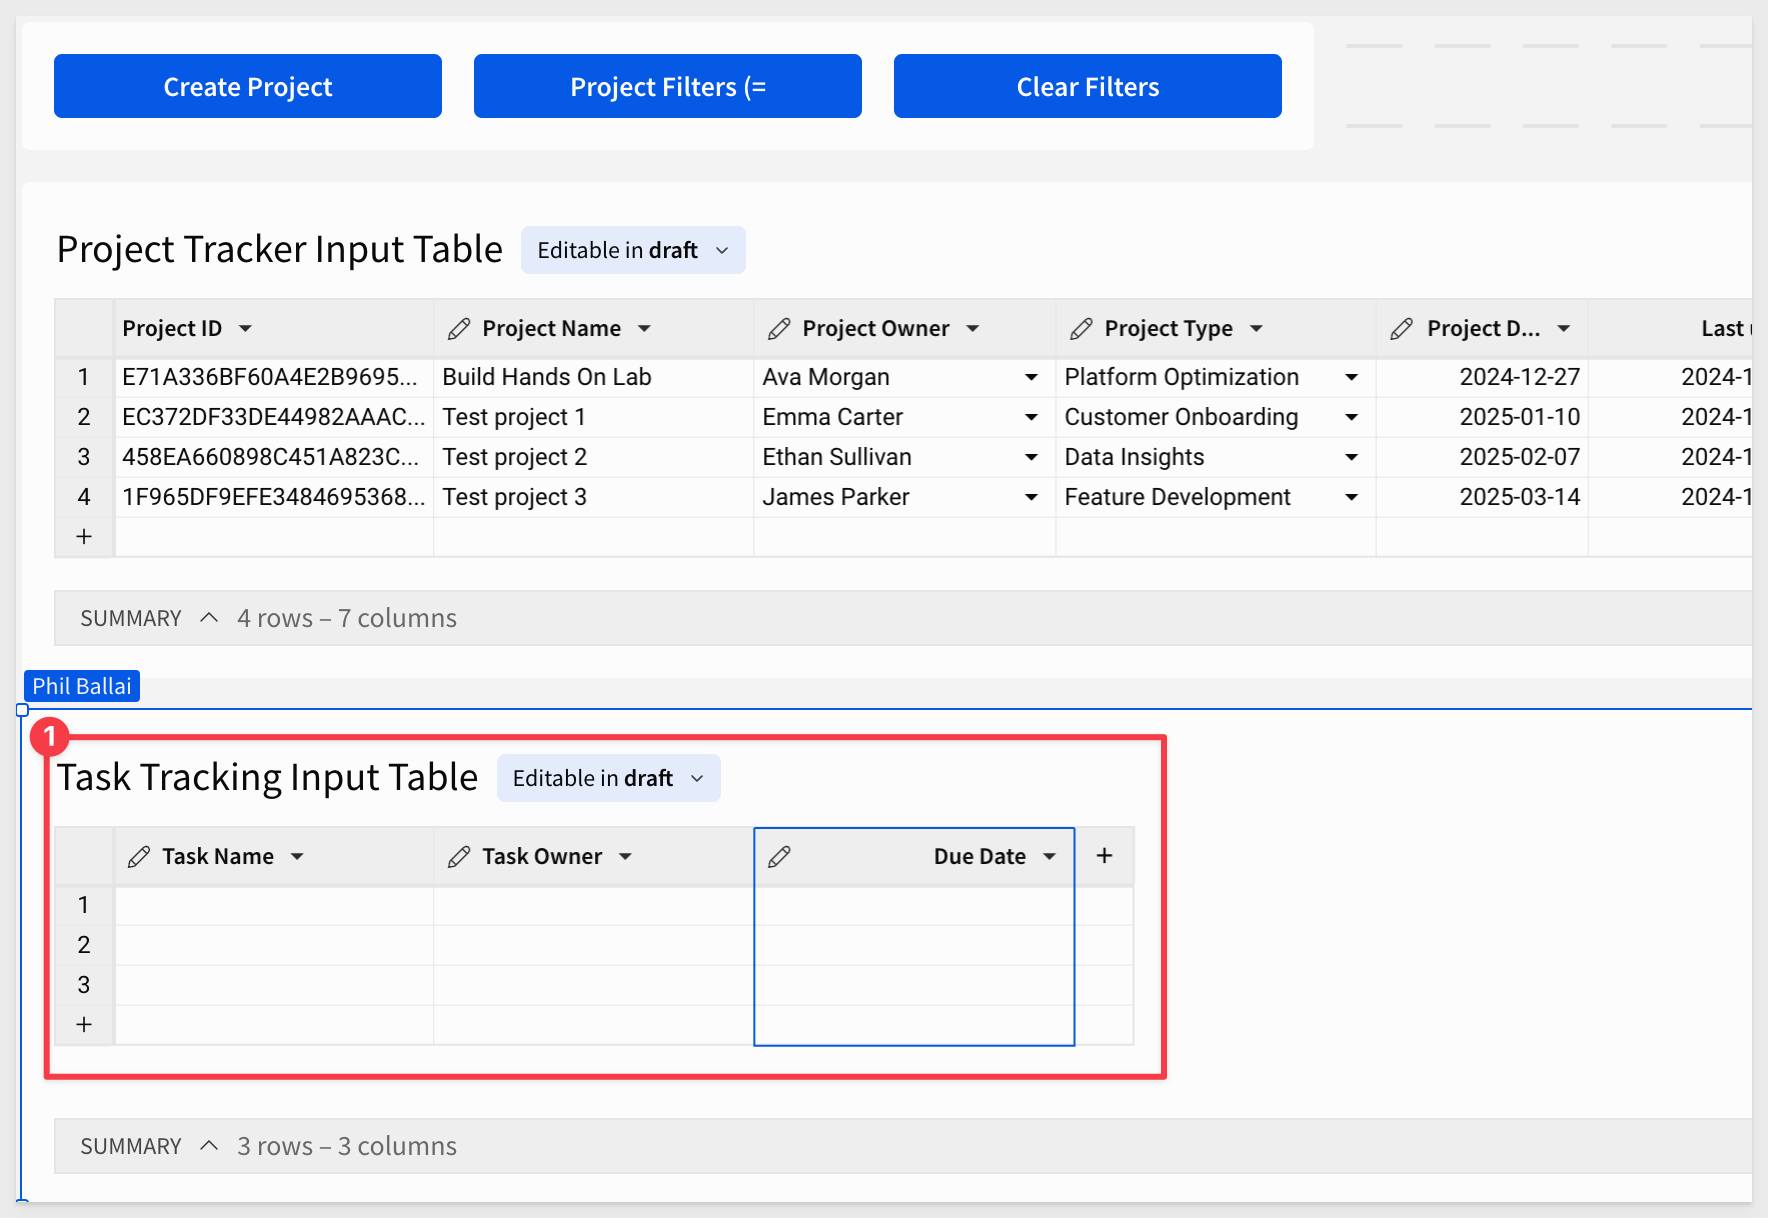
On the Project Tracker page, add a new Empty input table, connect it to the Sigma Sample Database and rename it to Task Tracking Input Table.
Add two Text columns, Task Name, Task Owner and a Due Date column as Date data type:
Step 2:
Add an additional text column for Project ID:
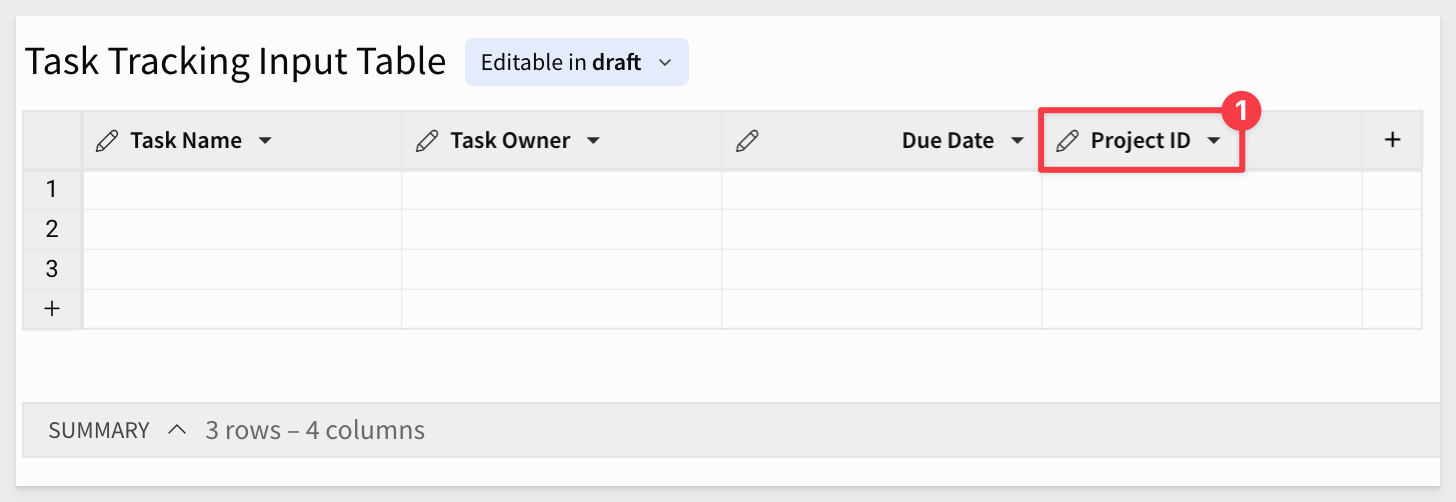
This column will be tied to the Project Tracker Input Table to link tasks to projects.
Step 3:
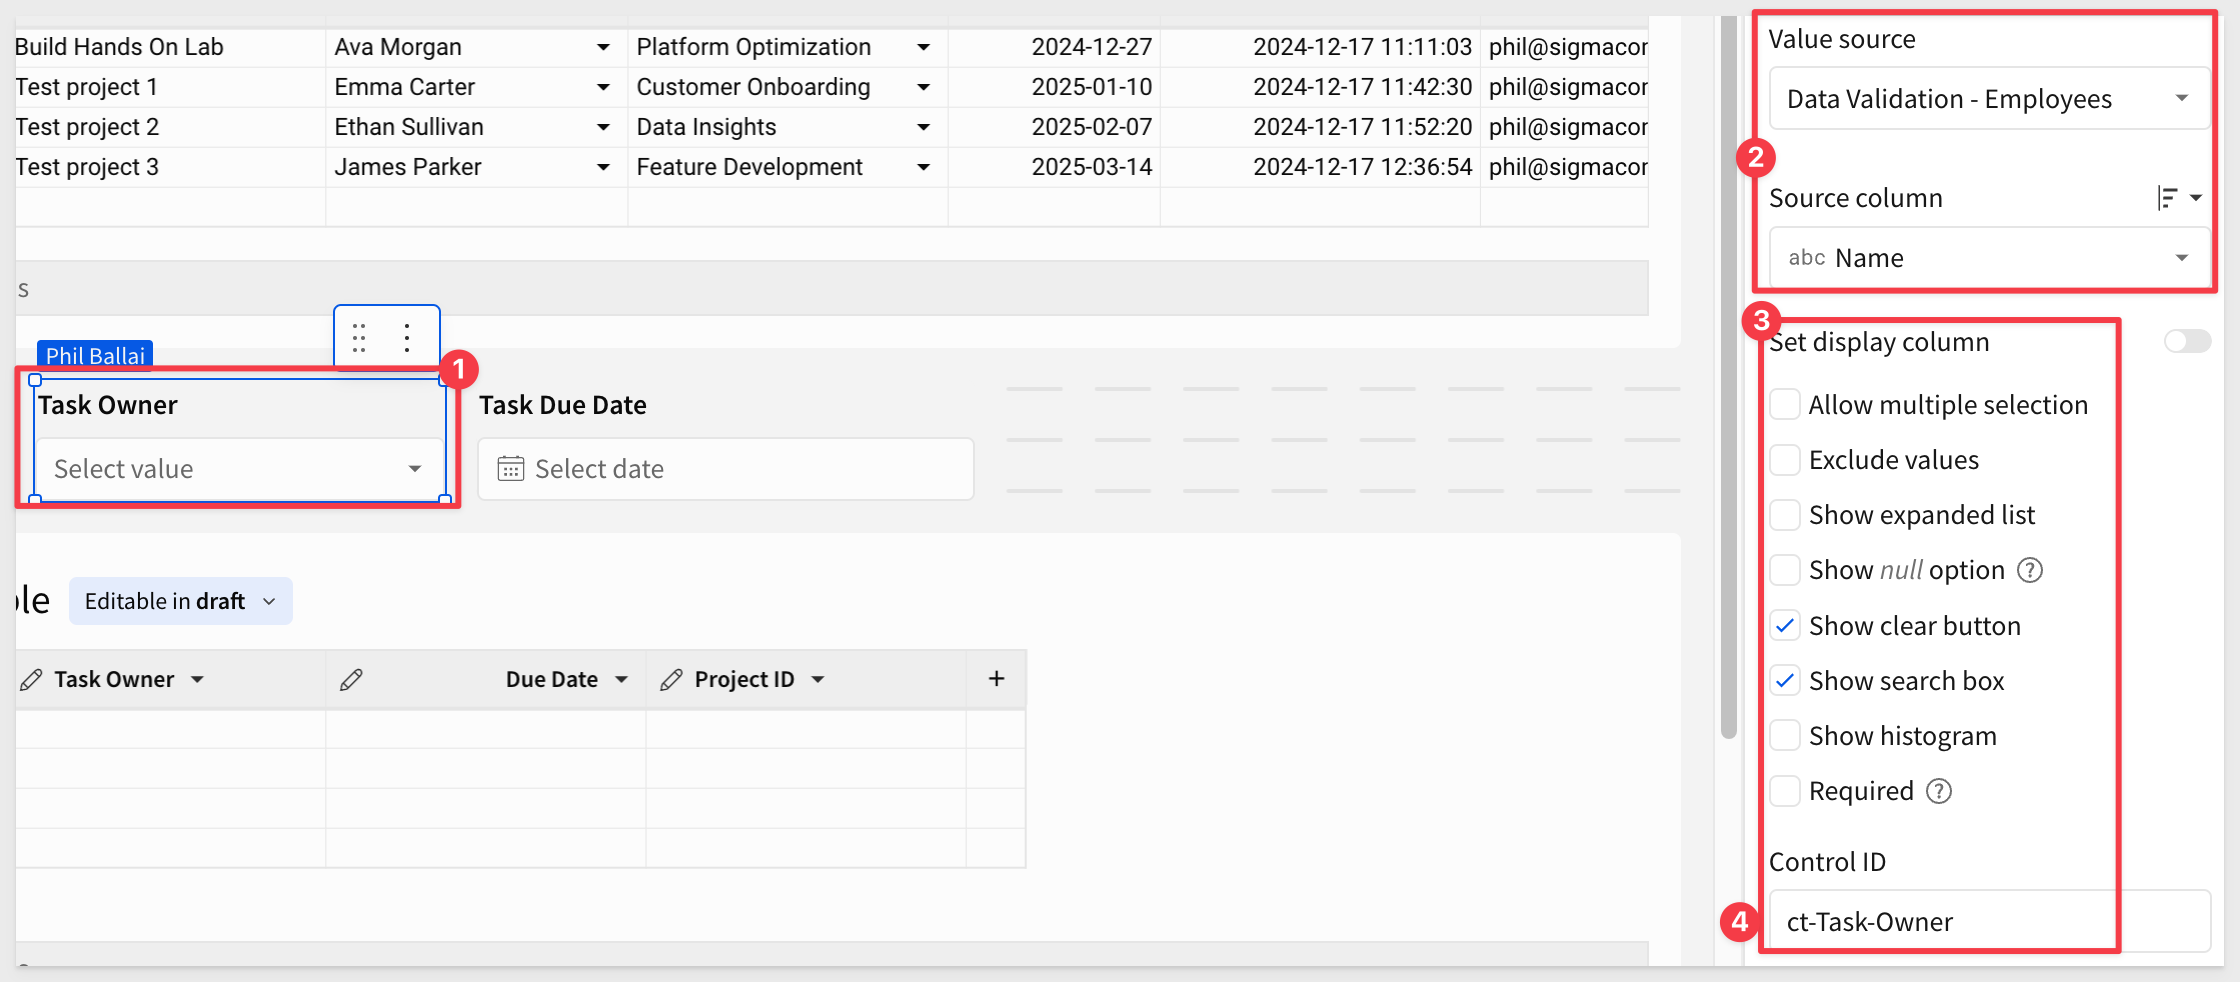
Add a text input control, List values control, and Date control above the Task Tracking Input Table.
Rename these to Task Name, Task Owner, and Task Due Date.
Set each Control Id as:
Task Name | ct-Task-Name |
Task Owner | ct-Task-Owner |
Task Due Date | ct-Task-Due- Date |
Step 4:
Ensure the Task Owner column is sourced to the Data Validation - Employee table with the correct items deselected as shown:
Step 5:
Create a container titled "Create Task Container" with the three controls.

Step 6:
Move this container to a New modal and rename the modal page to Modal - Create Task.
Change the model tile to Create Task
Using the existing primary and secondary buttons, change the names to Clear Form and Create Task.
Configure the actions for these buttons as follows:
Create Task (primary button): Add an Insert Rowand make sure you're inserting into the Task Tracking Table:
Add two more actions after the Insert Row action to clear the controls in the container and then close the modal:
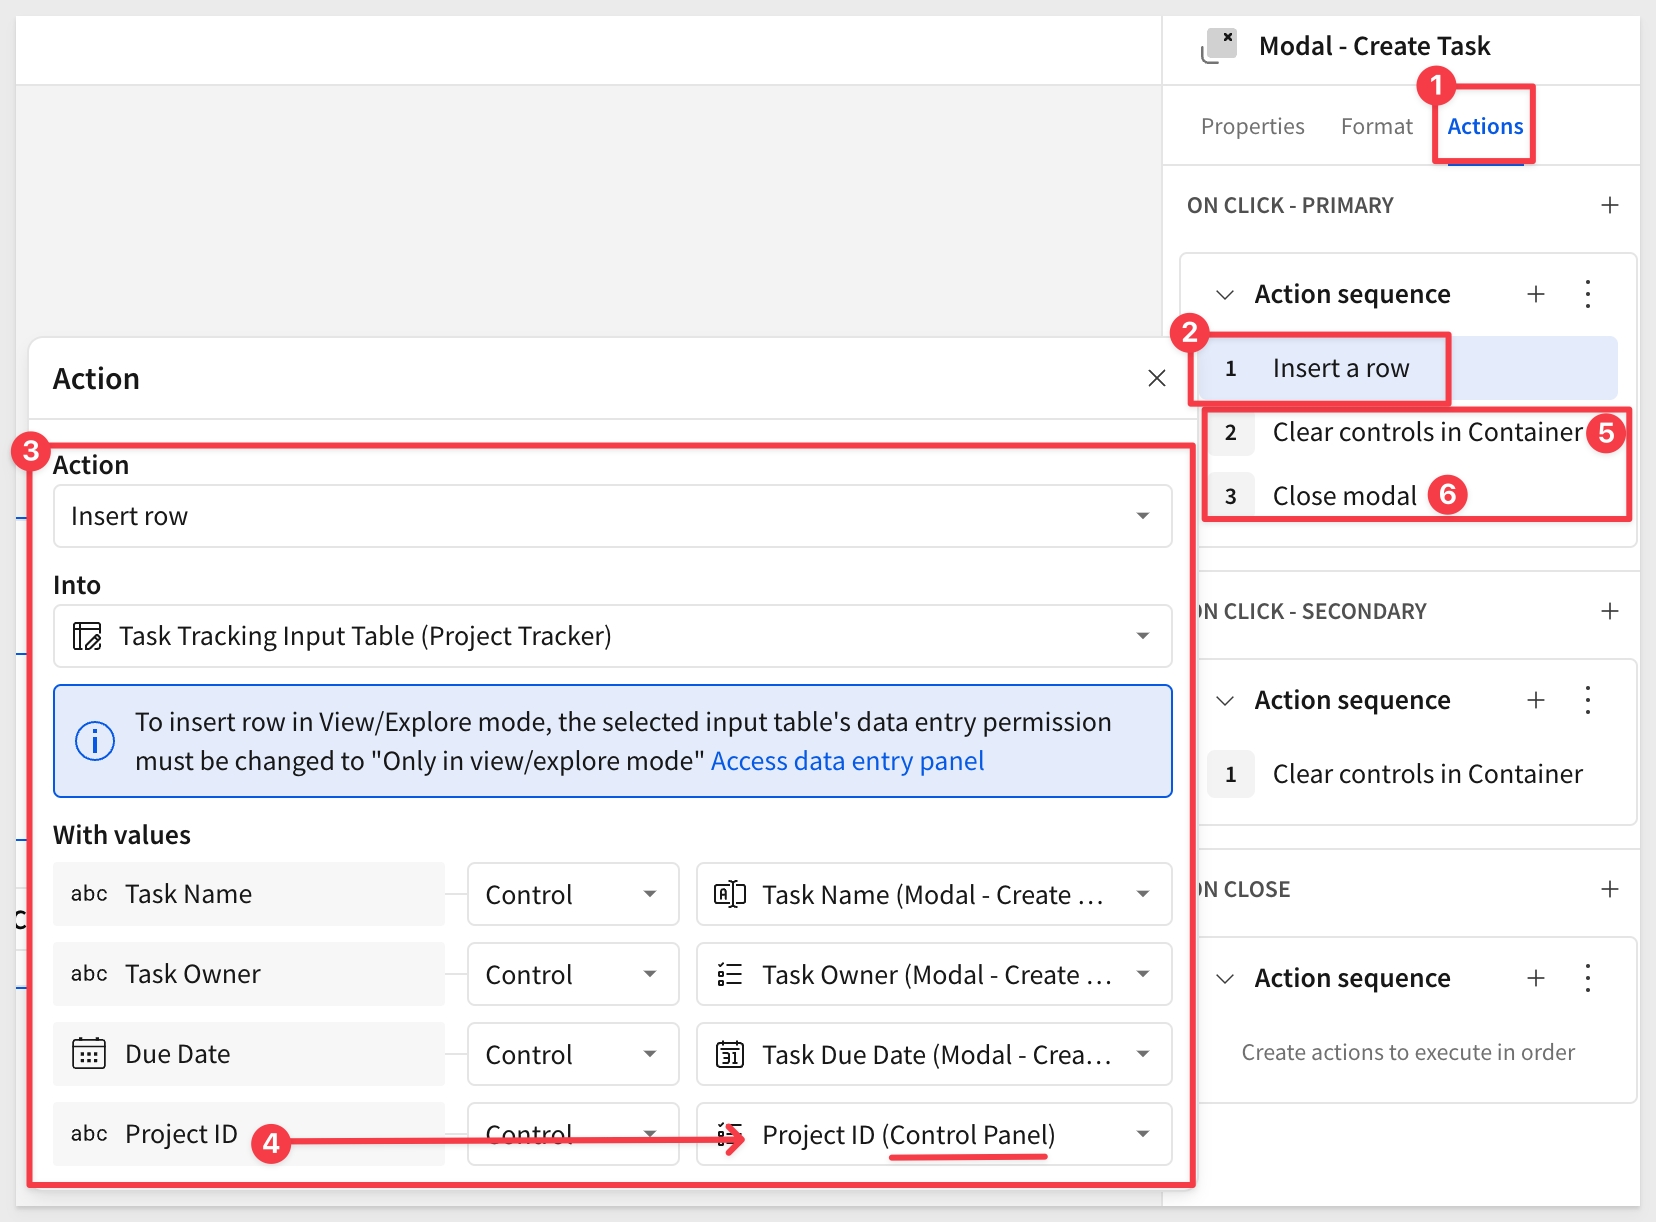
Clear Form (secondary button): Add a Clear control for the Container with the action set as:
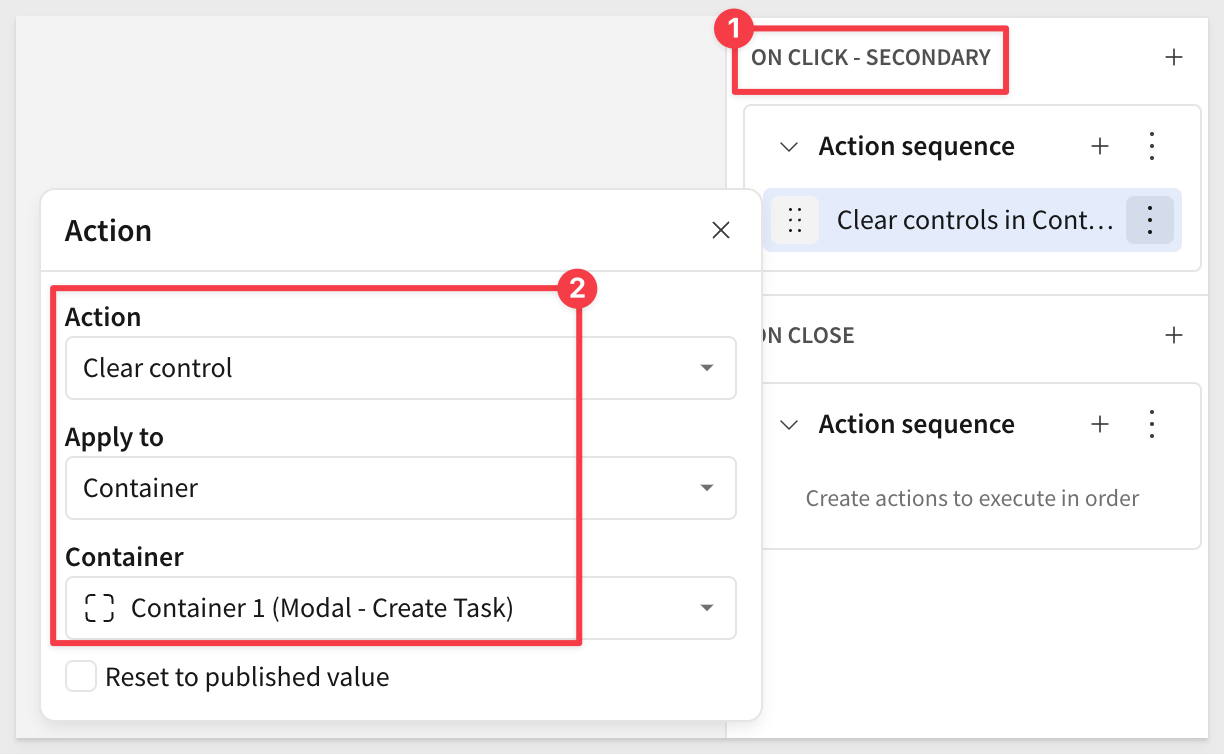

We will use the modals X to close the modal.
Step 7:
On the Project Tracker Input Table, select the dropdown and add a calculation.
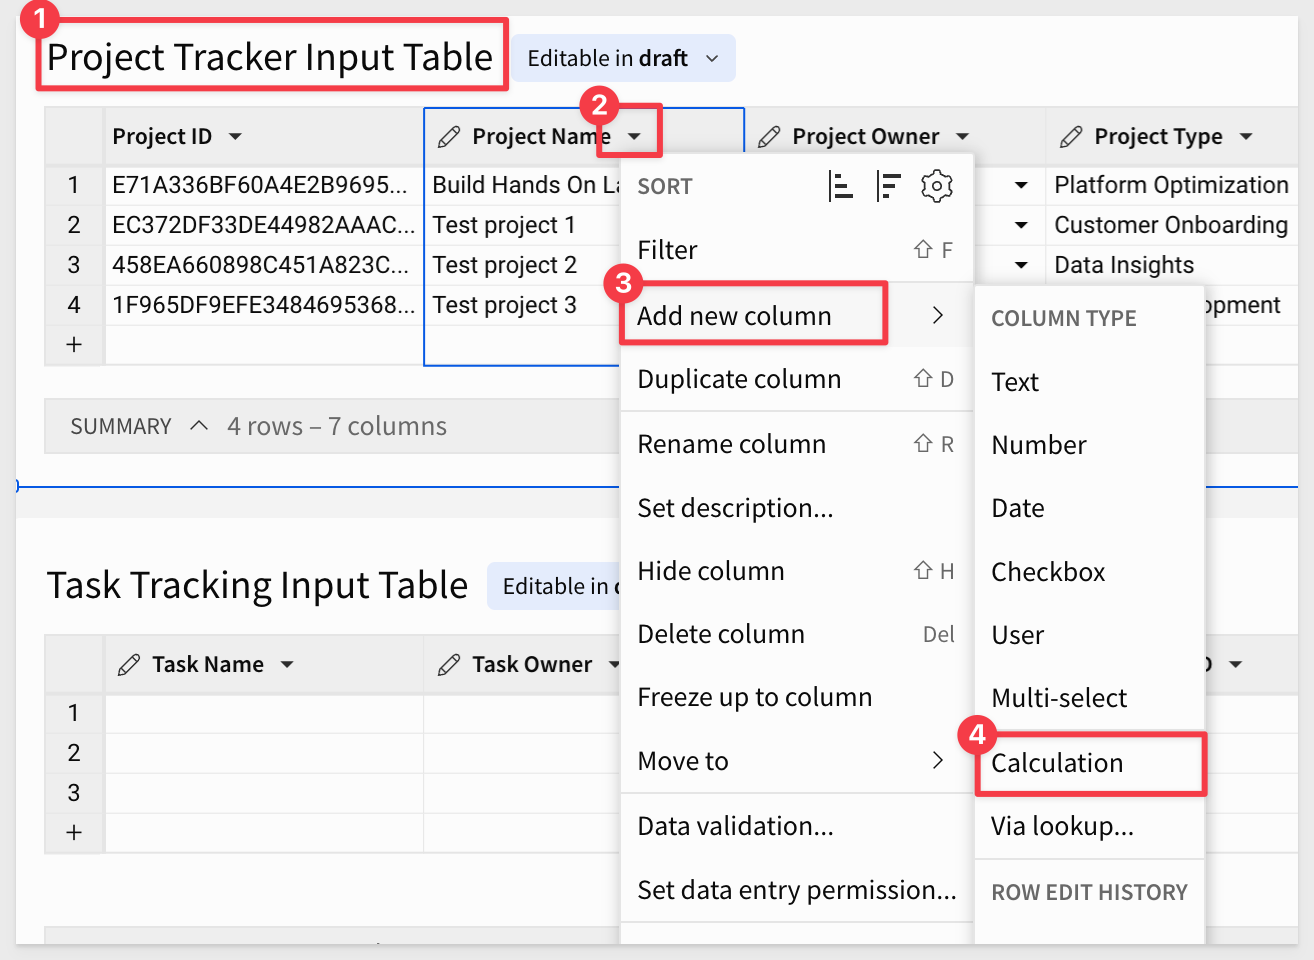
The formula for this calculation will be "Add Task" (with quotation marks included) in the formula bar.
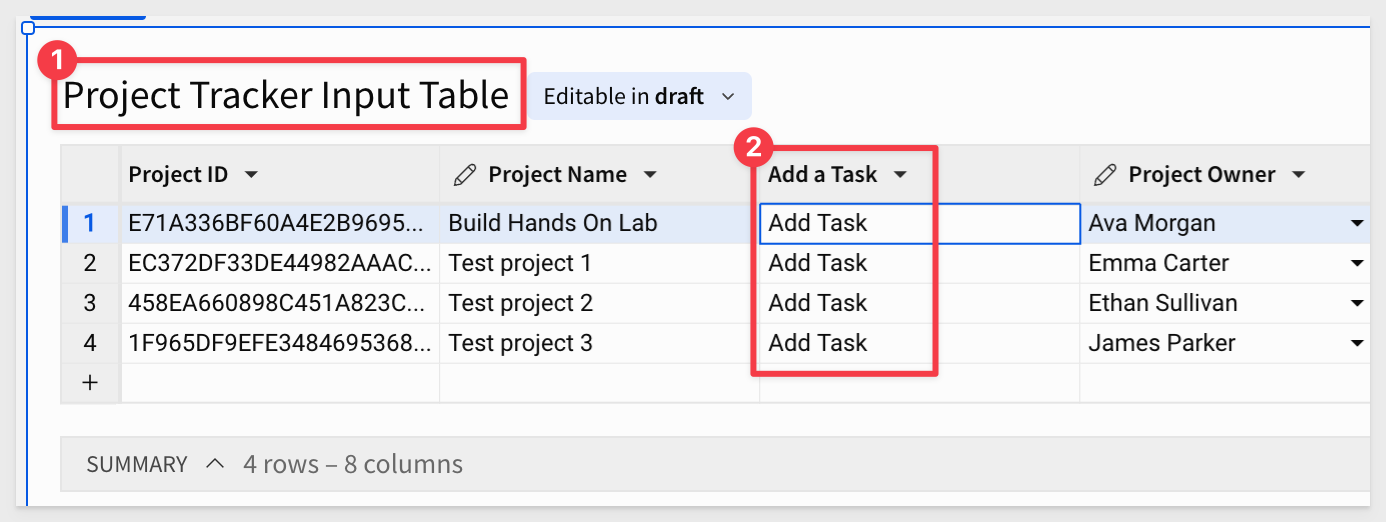
Rename this column to Add a Task:
Step 8:
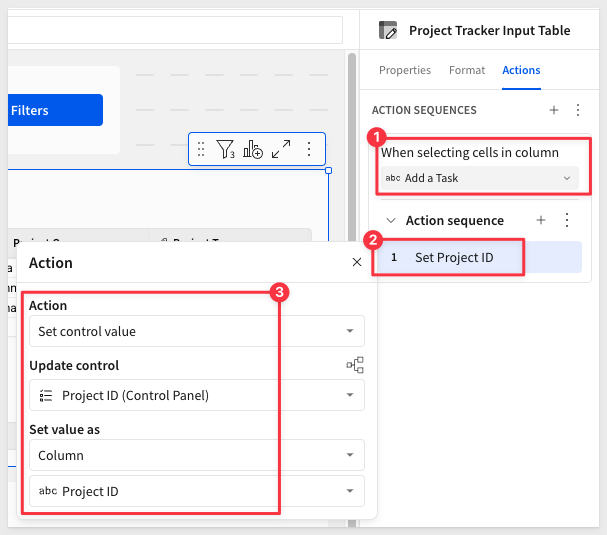
Click to select the Project Tracker Input Table and add an action.
Configure the action to When selecting cells in column for the column Add a Task.
Configure the rest of the action to set the Project Id.
Step 9:
Add conditional formatting to the Add a Task column to make it appear as a hyperlink:
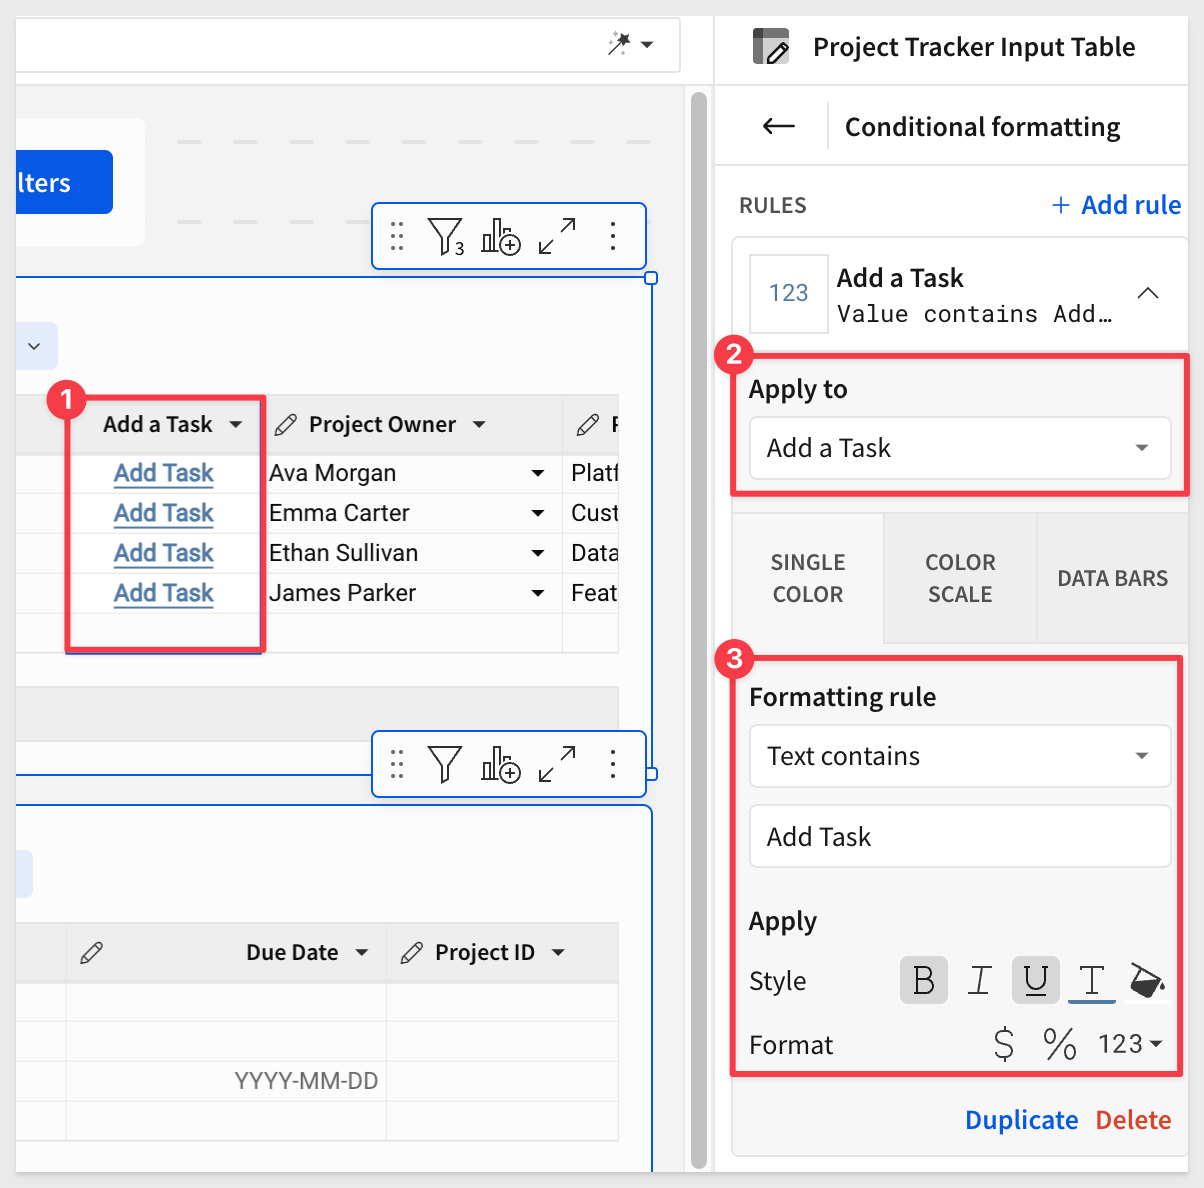
Step 10:
Test this action by selecting an Add Task cell from Create New Taskand check the Control Panel page for the Project ID control element. The value that was clicked will appear in the filter as:
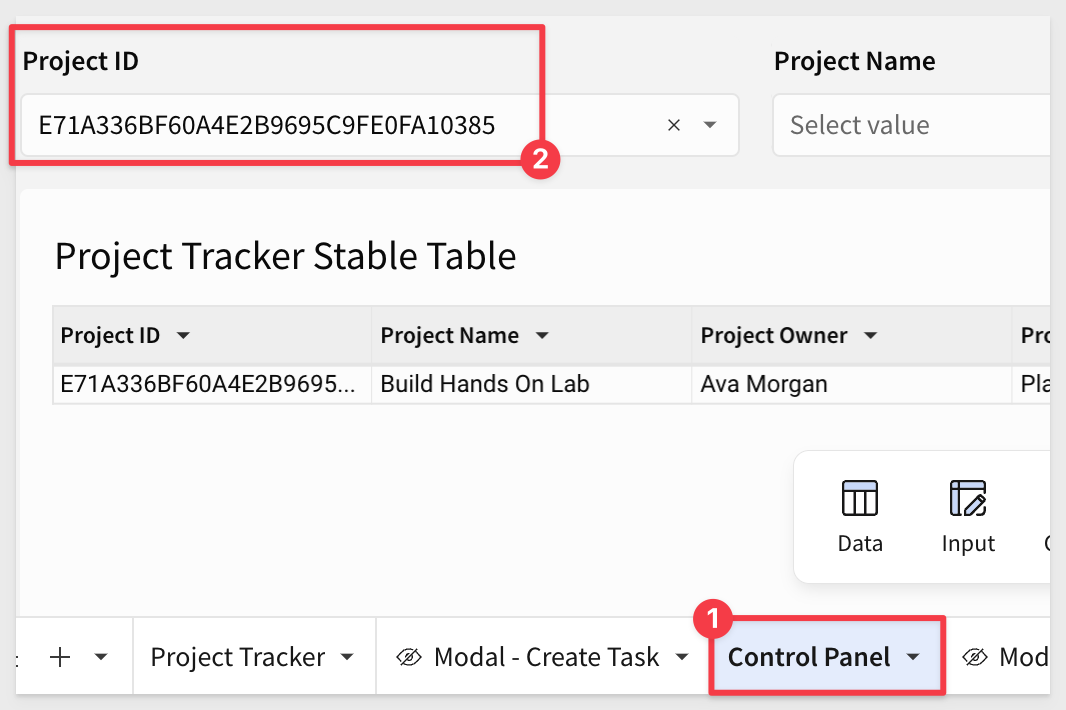
Step 11:
We also want to set the Project Name when the user clicks Add Task.
Add another action under the Set Project ID and configure it as follows:
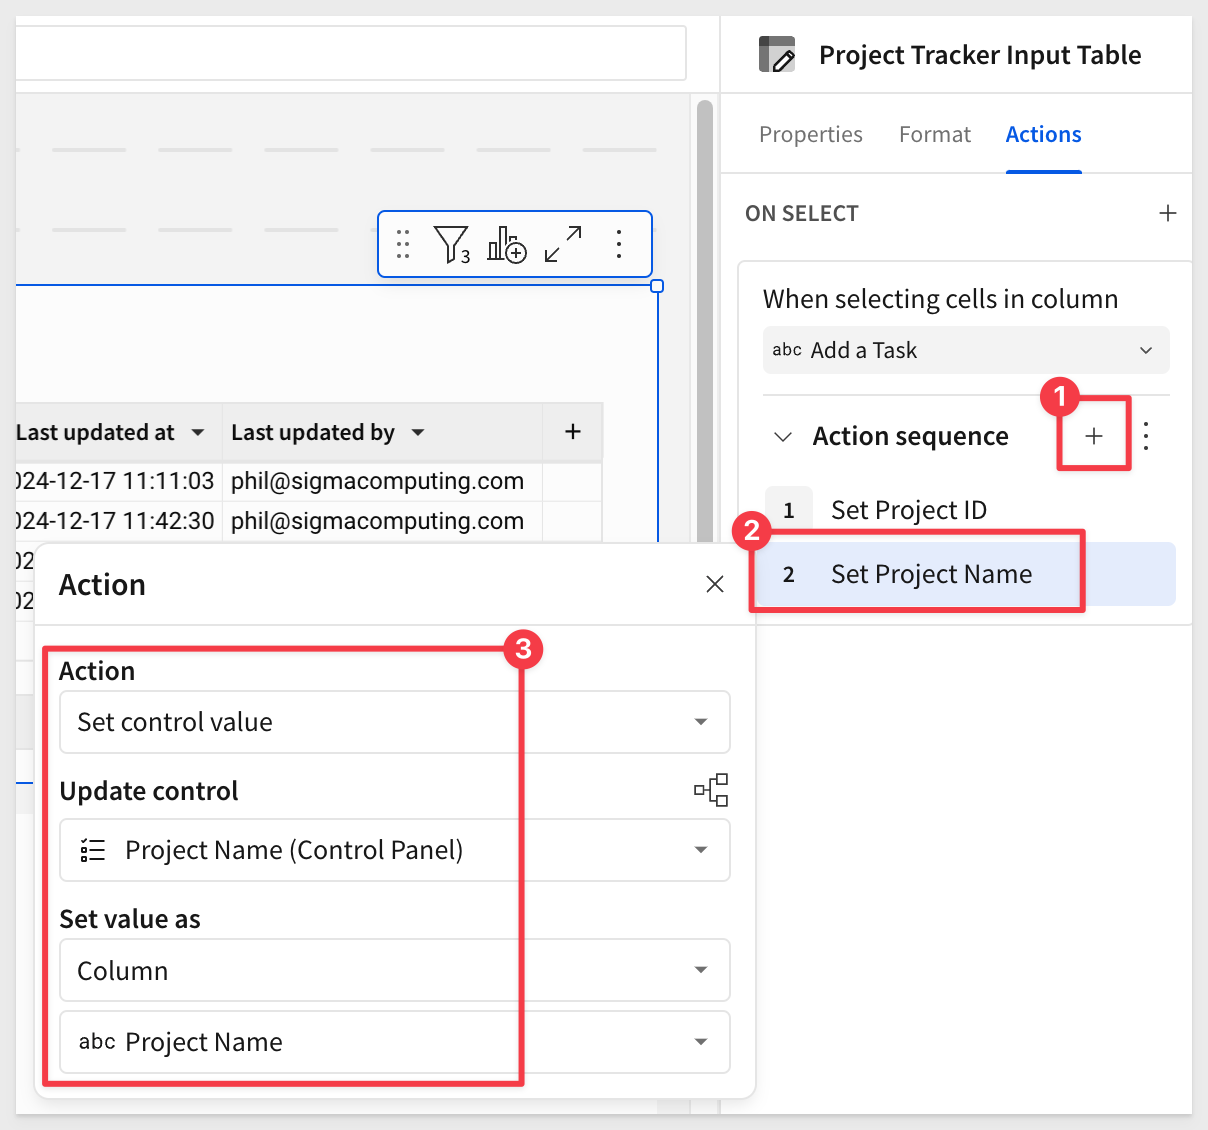
Step 12:
Add a third action for Opening a Modal, and select Modal - Create Task:
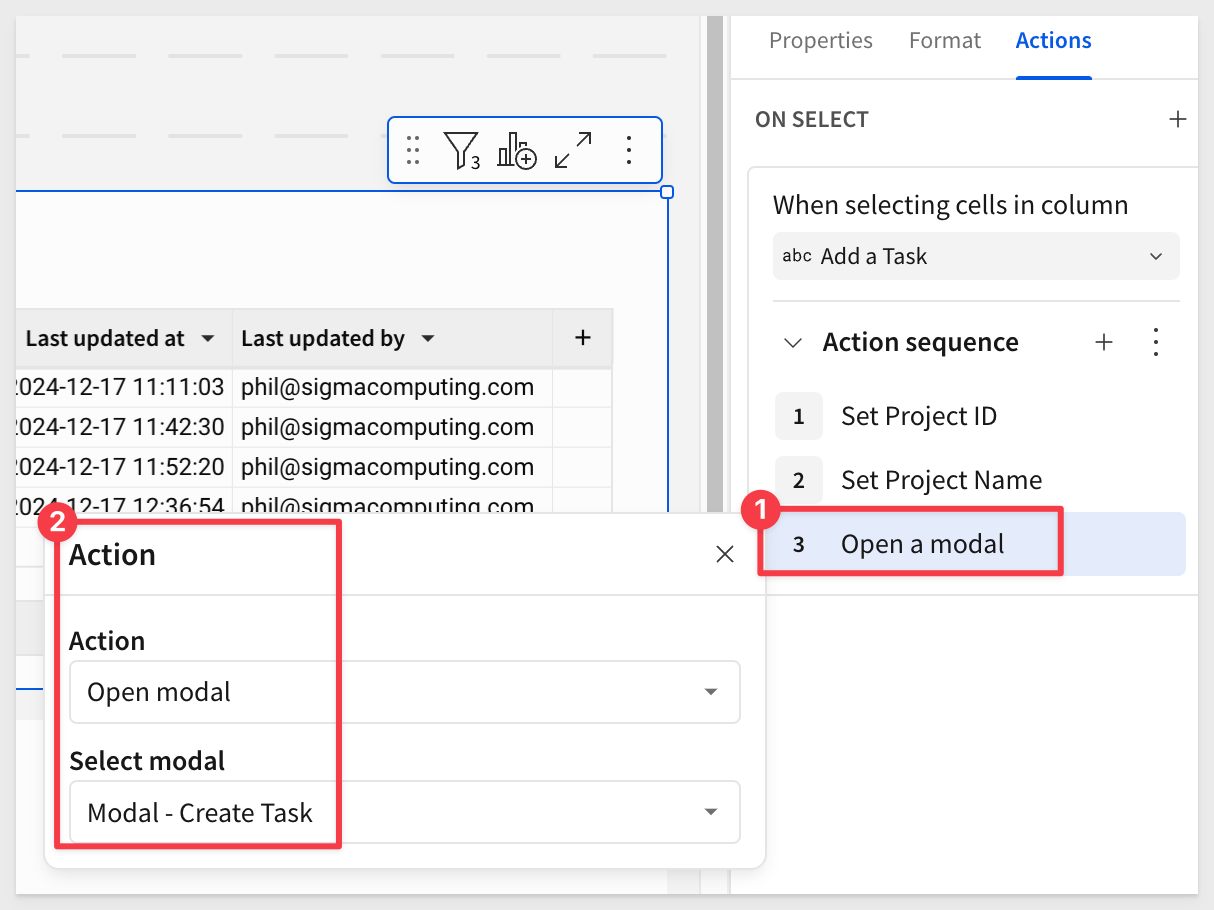
Step 13:
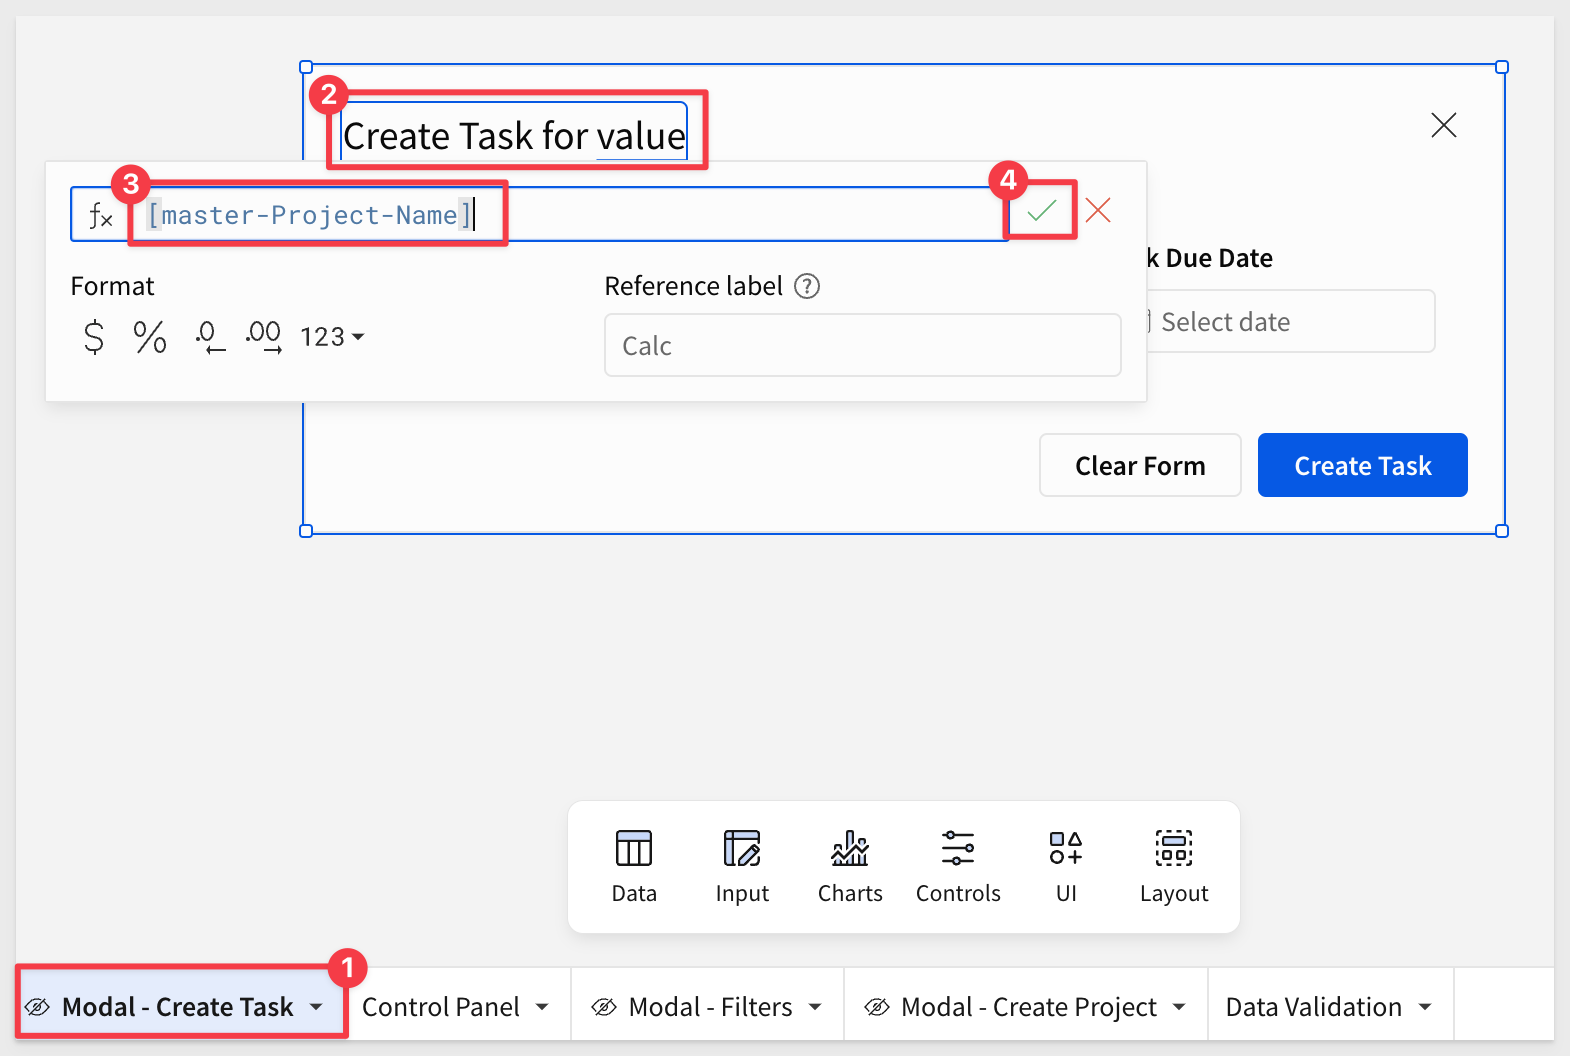
When the modal appears, we want the project name to appear in the title so the user is oriented.
On the Modal - Create Task page, revise the title to include the project name.
Select the text Create Task and append it with for followed by =, which opens the formula bar.
Type [master_Project-Name] and click the green checkmark:
Step 14:
Lets test this by clicking Add Task from any row and entering some test data. When done, click Create Task:
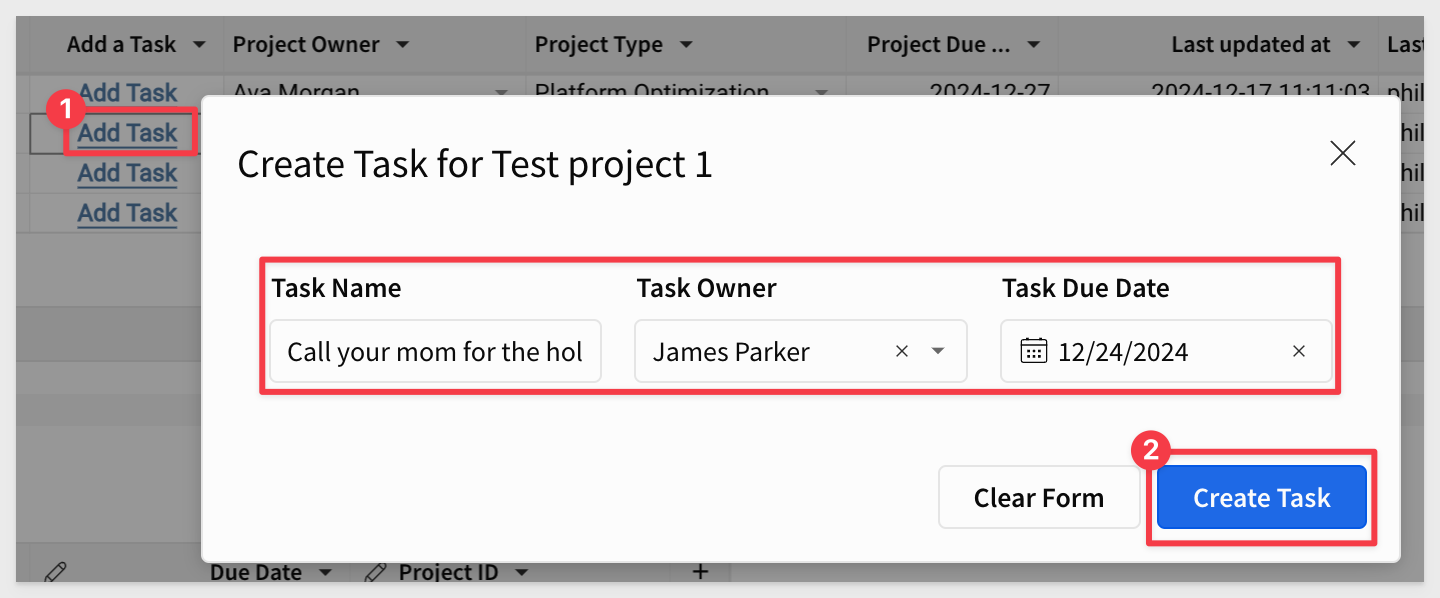
The new task should appear in the Task Tracking Input Table:

Try this multiple times to add new tasks to the task tracking table.
Step 15:
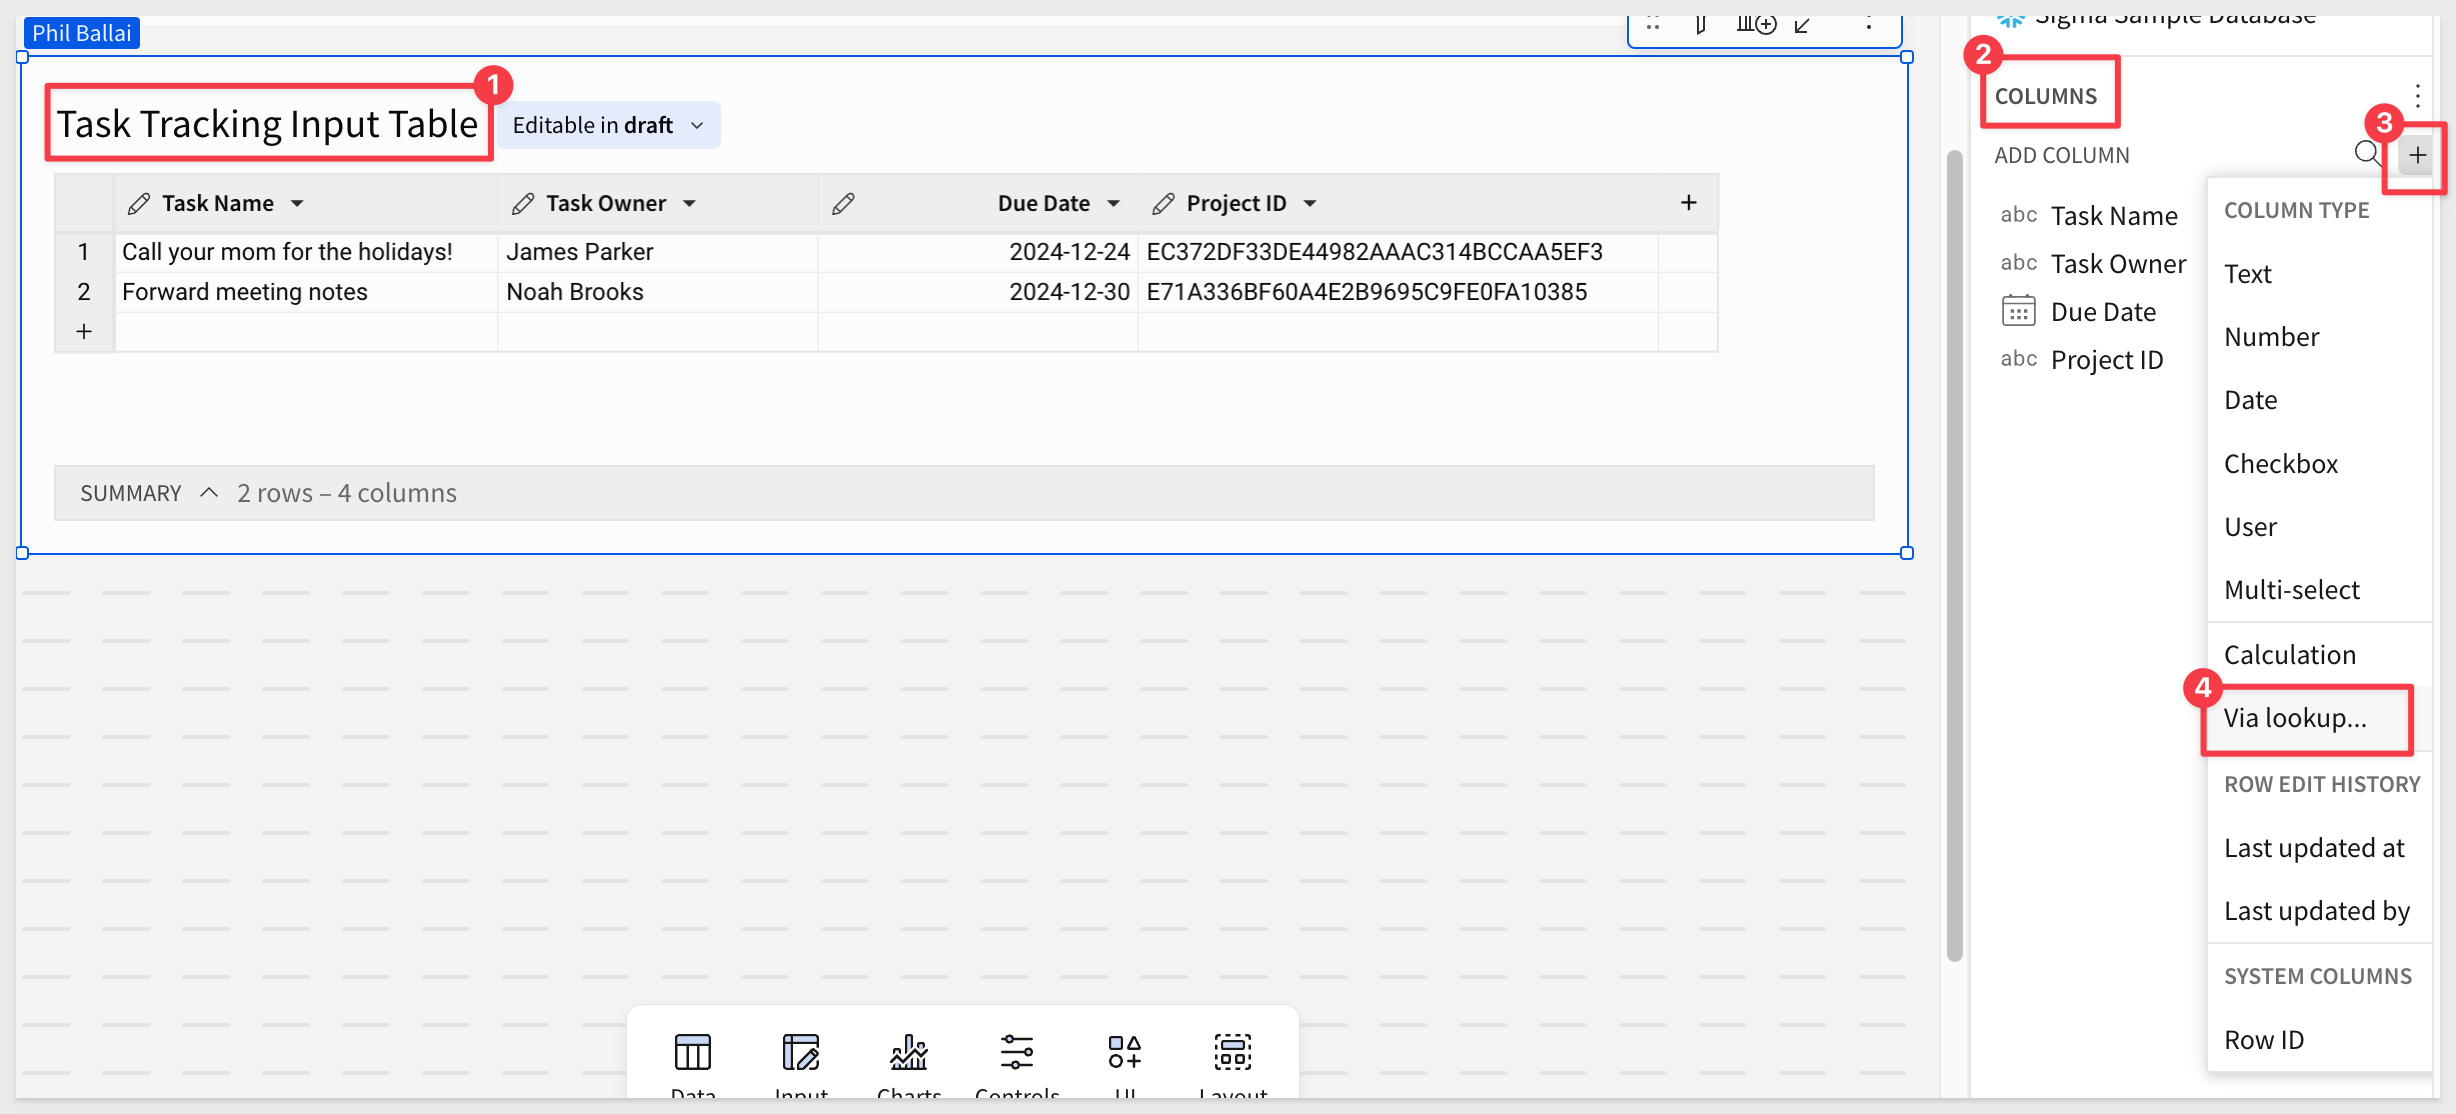
On the Project Tracker page, add a new Column via lookup to the Task Tracking Input Table.
This time we used the selected element panel, COLUMNS menu to add a new column to demonstrate another way to do it:
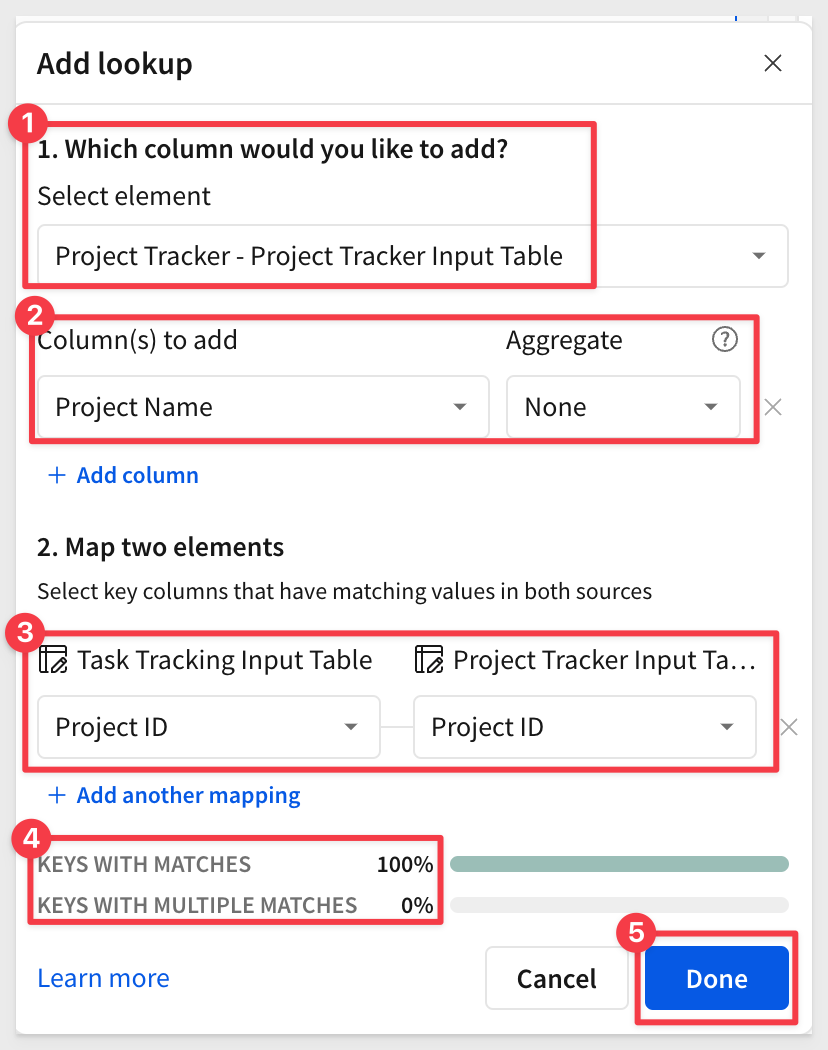
We need to let Sigma know which column(s) we want to bring in and how to "match" the two input tables (ie: join them). We could also pre-aggregate the columns as we bring them in, but in this case, that is not wanted:
Step 16:
Rename the new lookup column to Project Name and move it to the first column:

For more information on lookups in Sigma, see Add columns through Lookup
Step 17:
Move the the Task Tracking Input Table to the Control Panel page. Now that we have the Project Name we don't need to show that information to the user.
Add an additional task record for the same project and sort by Project Name.

Step 1:
On the Control Panel page, create a new blank input table and rename it to Status Update Input Table.
Connect to the Sigma Sample Database again.
Create the following columns:
Project ID | type = text |
Project Status | type = text |
Status Owner | type = text |
Status Date | type = date |
Add the Last updated at, Last updated by, and row ID columns using the menu options.
Rename the row ID column name to Status ID.
Delete any blank rows:

Step 2:
Add a new modal and change the title to Update Project Status.
Add a List control and rename it to Project Status.
Set its Value source to Data Validation and Source column to Status.
Uncheck Display columns as shown below.
Set the Control ID value ups_Project-Status:
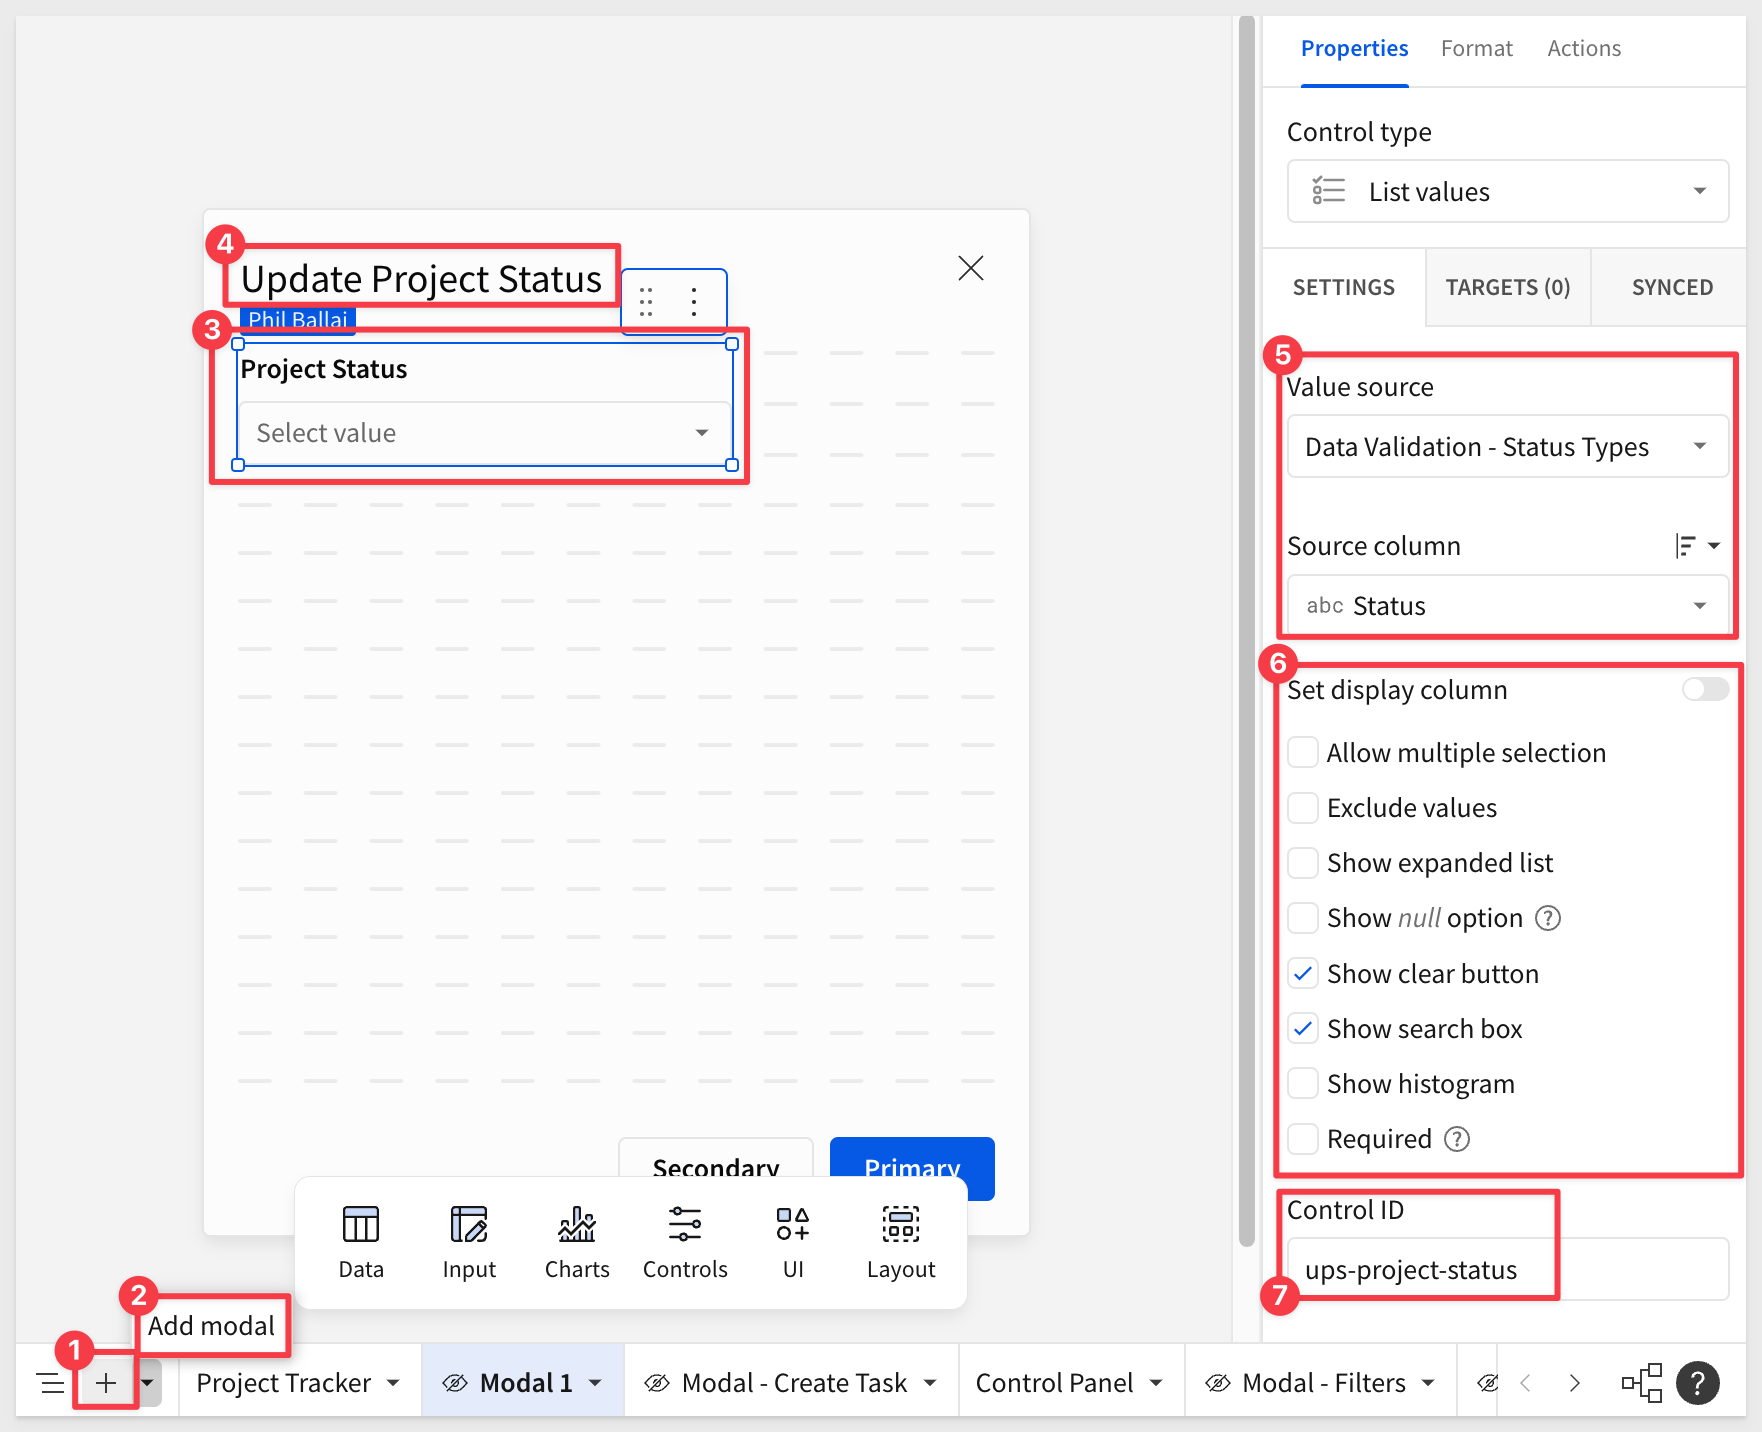
Rename the modal page to Modal - Update Status.
Step 3:
Change the Label > Label position under Format to put the Project Status title on the left:
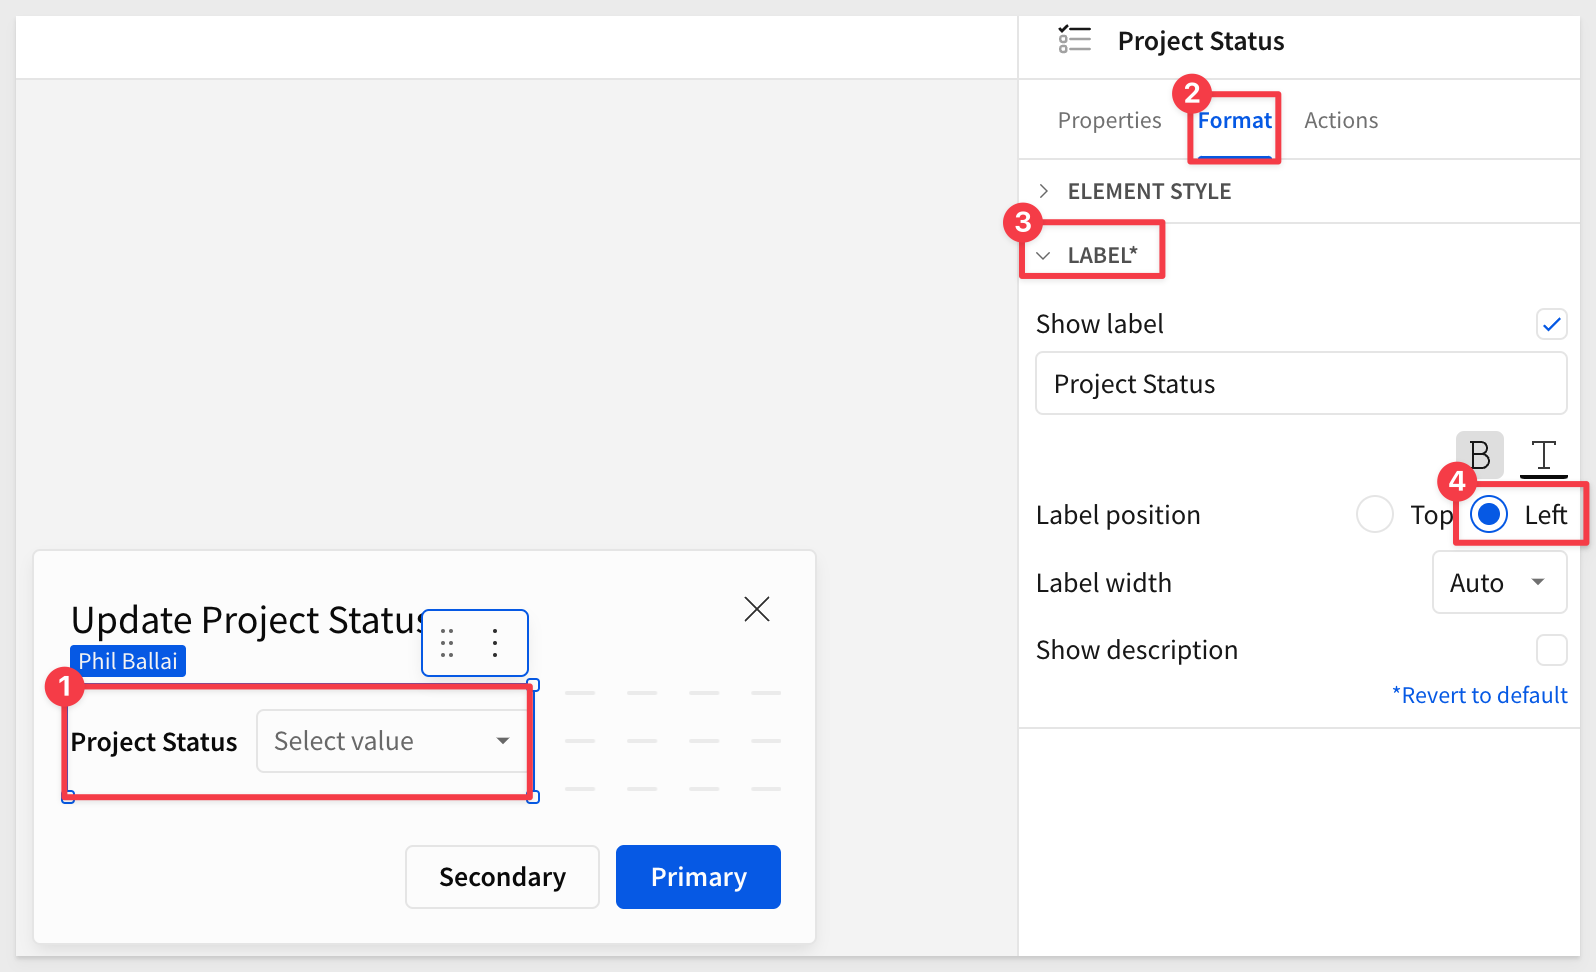
Step 4:
Disable the Primary and Secondary buttons from the input tables Format options.
Add a button and rename it to Update Project Status`:

Step 5:
On the Project Tracker page and the Project Tracker Input Table, add a new column via Calculation after the Add Task field and rename it to Update Project Status with a formula of "Update Status".
Lets use conditional formatting to set the new columns appearance to the same as the Add a Task column.
This is made easy by adding the Update Project Status column to the Apply to list and changing the Formatting rule to Is not null as shown in the screenshot below:
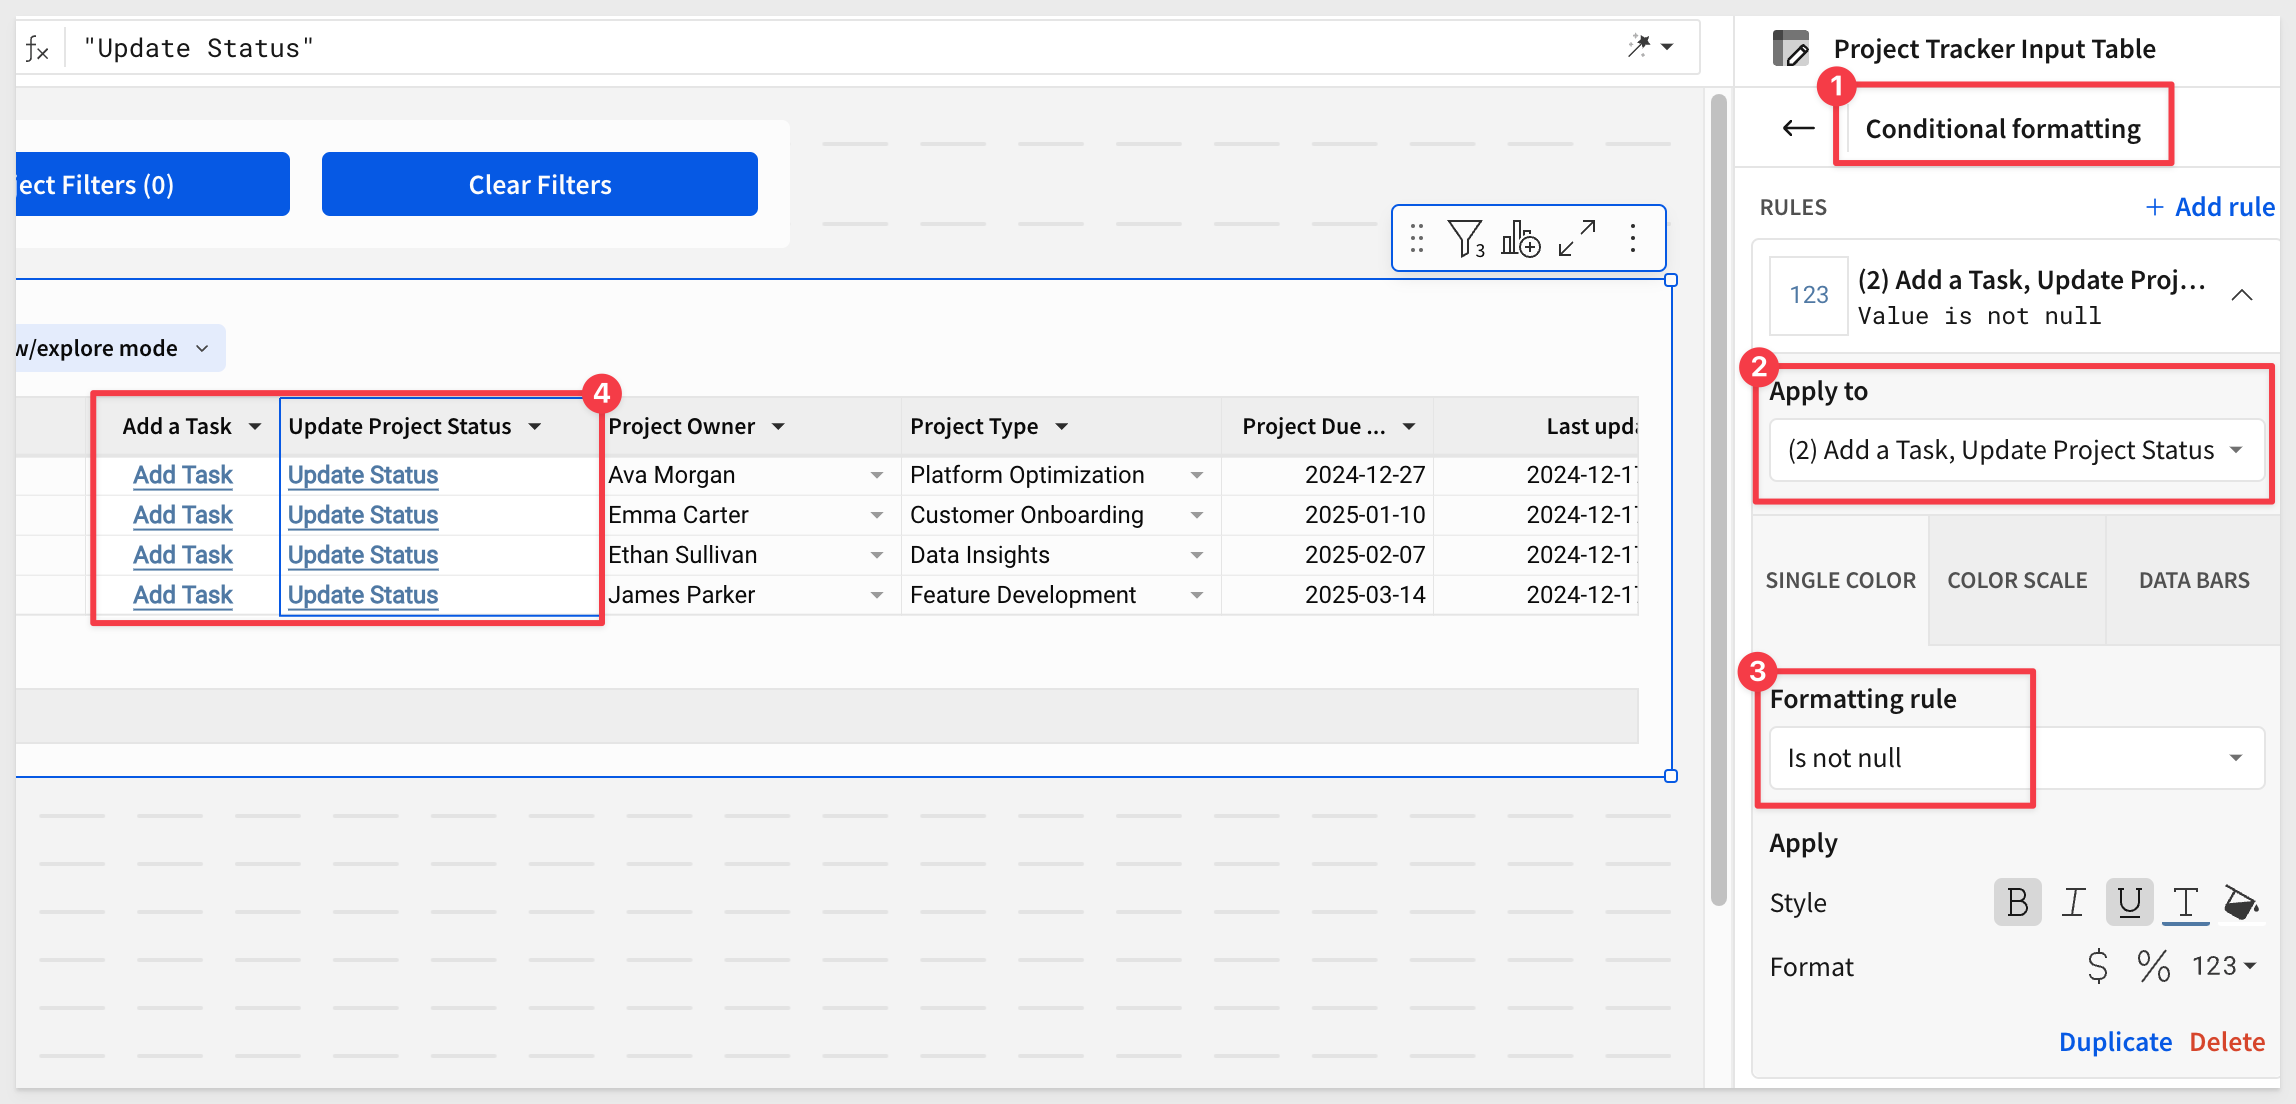
Step 6:
On the actions panel for Project Tracker Input Table, click the + to add a new action which will be Update Project Status.
Add an action to set control value of Project ID from the Control Panel.
Set the value as Column > Project ID:
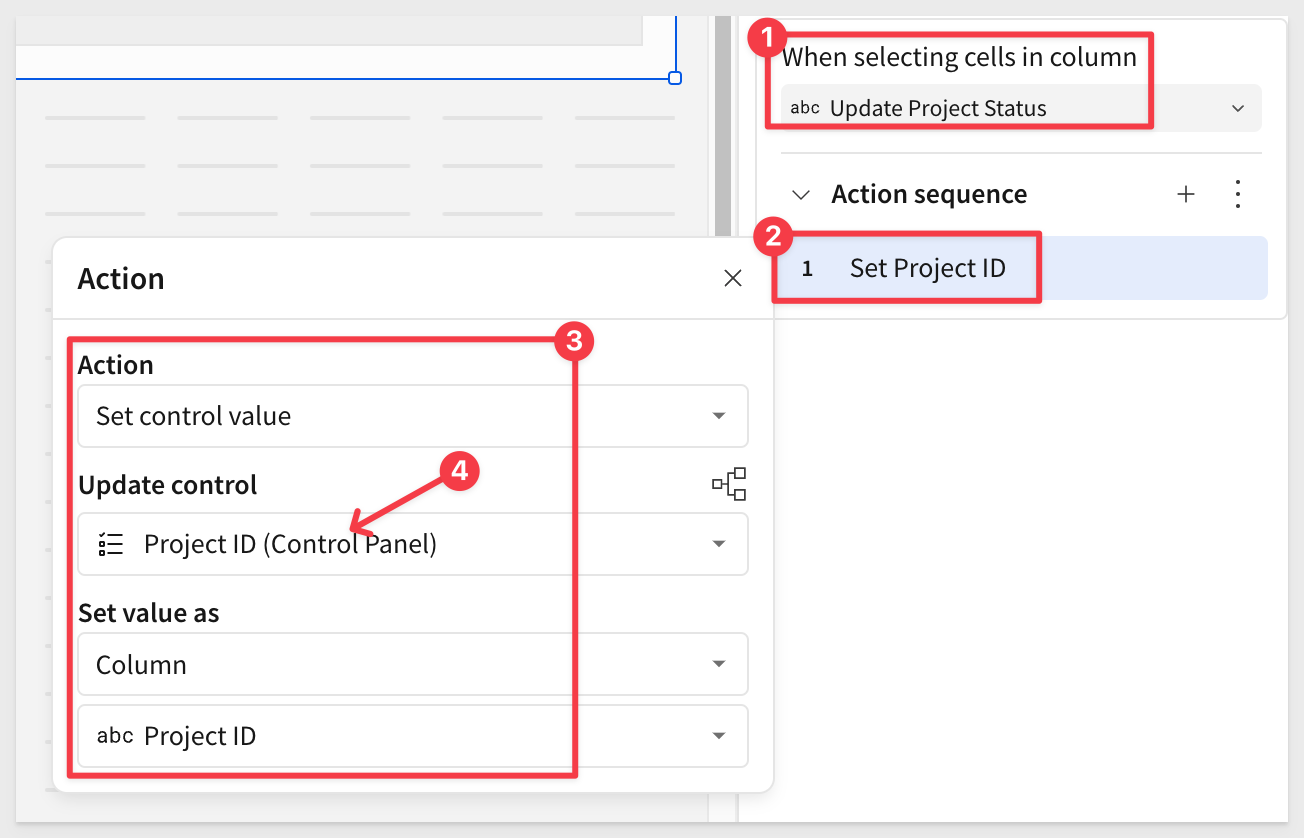
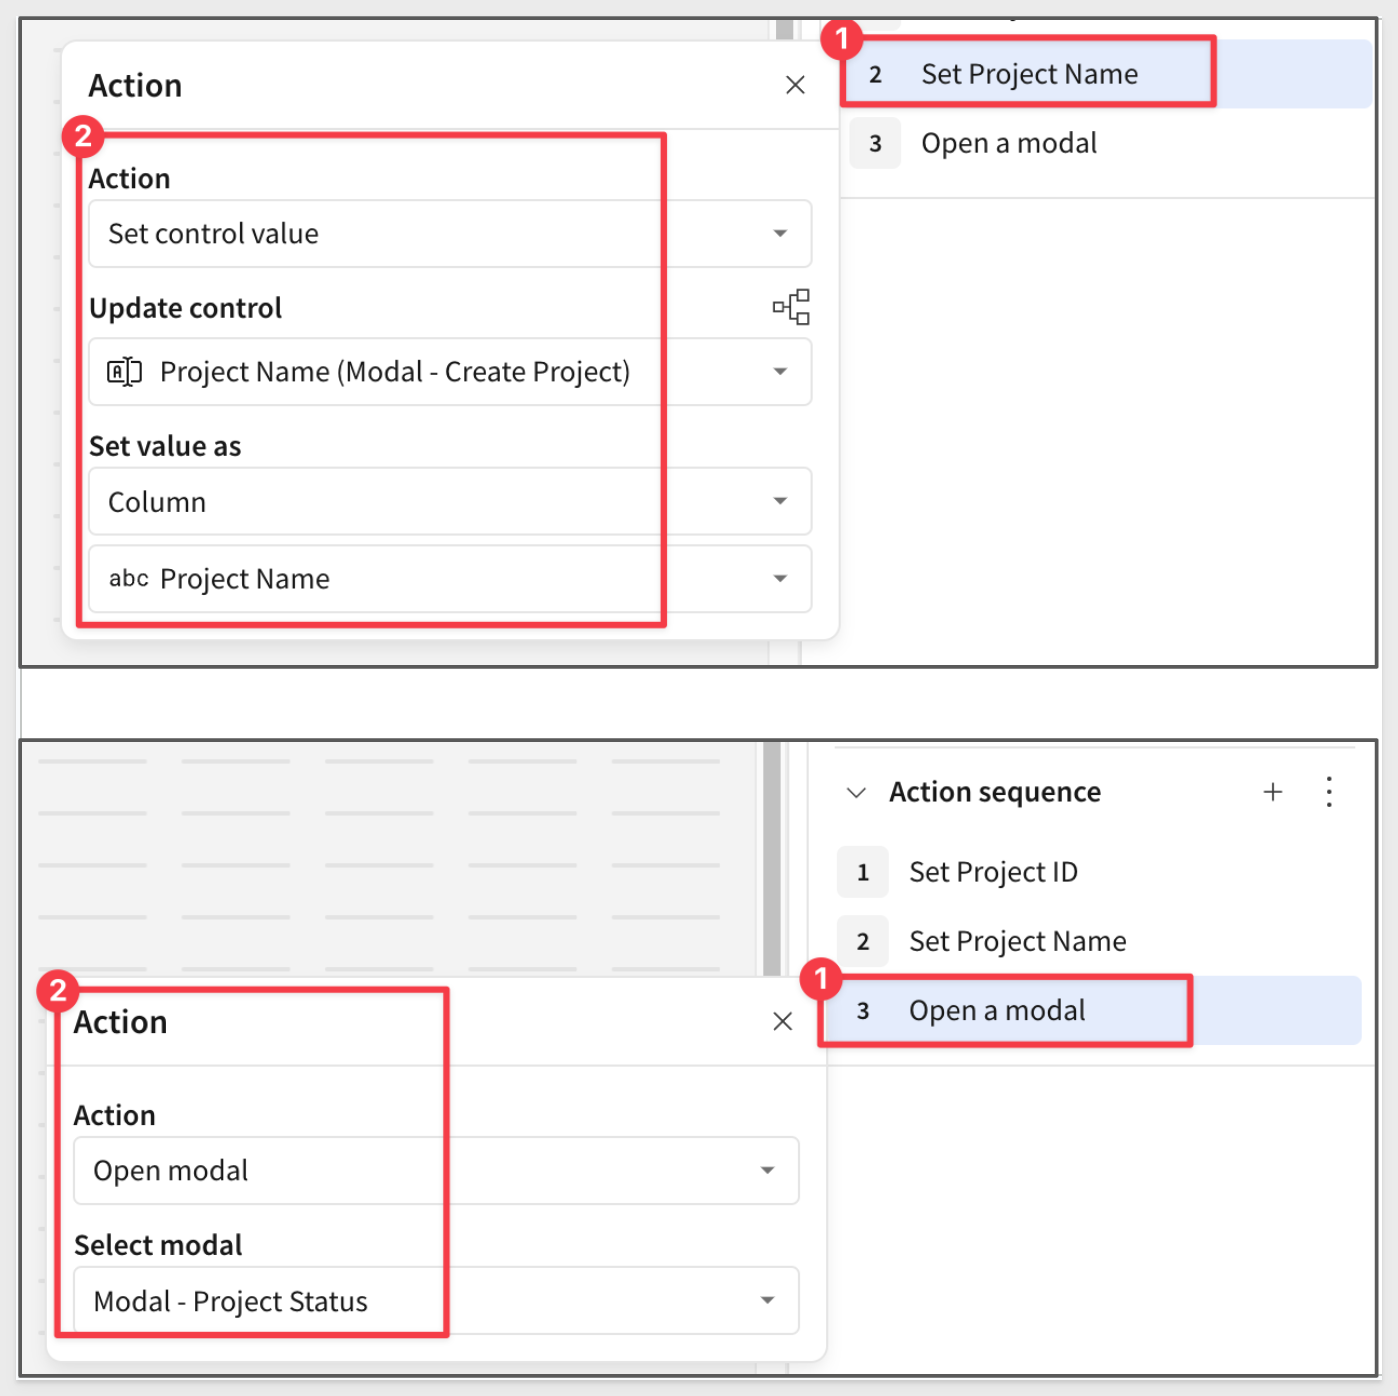
Step 7:
Repeat adding an Set Control Value action for Project Name and the Open Modal action for Modal - Update Status:
Step 8:
In the header of the Modal - Update Status page, add in the following text: Project Name: followed by an = sign and set the formula to [master_ProjectName]:

Step 9:
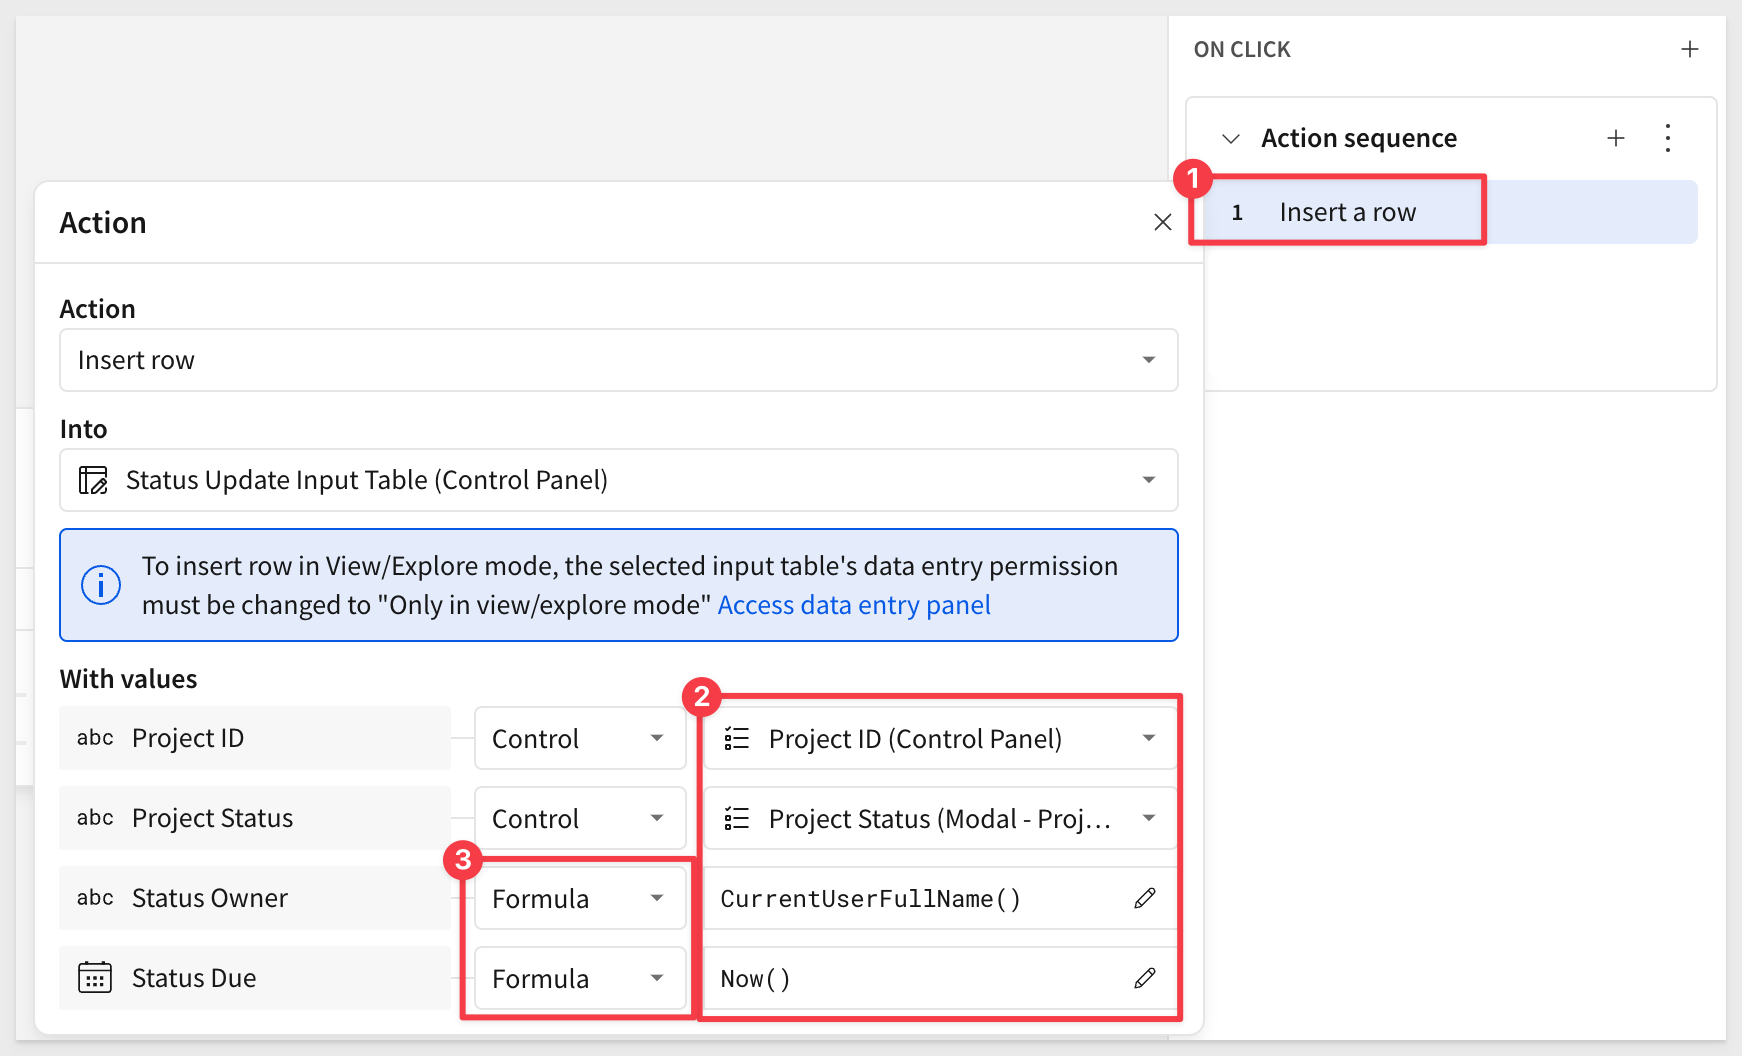
Set the action Insert Row on the Update Project Status button.
Ensure this is inserting a row into the Status Update Table with Project ID which if you recall is located on the Control Panel page.
Notice that two columns are mapped to two formulas; CurrentUserFullName() and Now() and that the mapping for Project ID and Project Status are different in the screenshot below:
Step 10:
As we have done before, add an action for Clearing Project Status and set the third action to Navigate to the Project Tracker page > Top of Page.
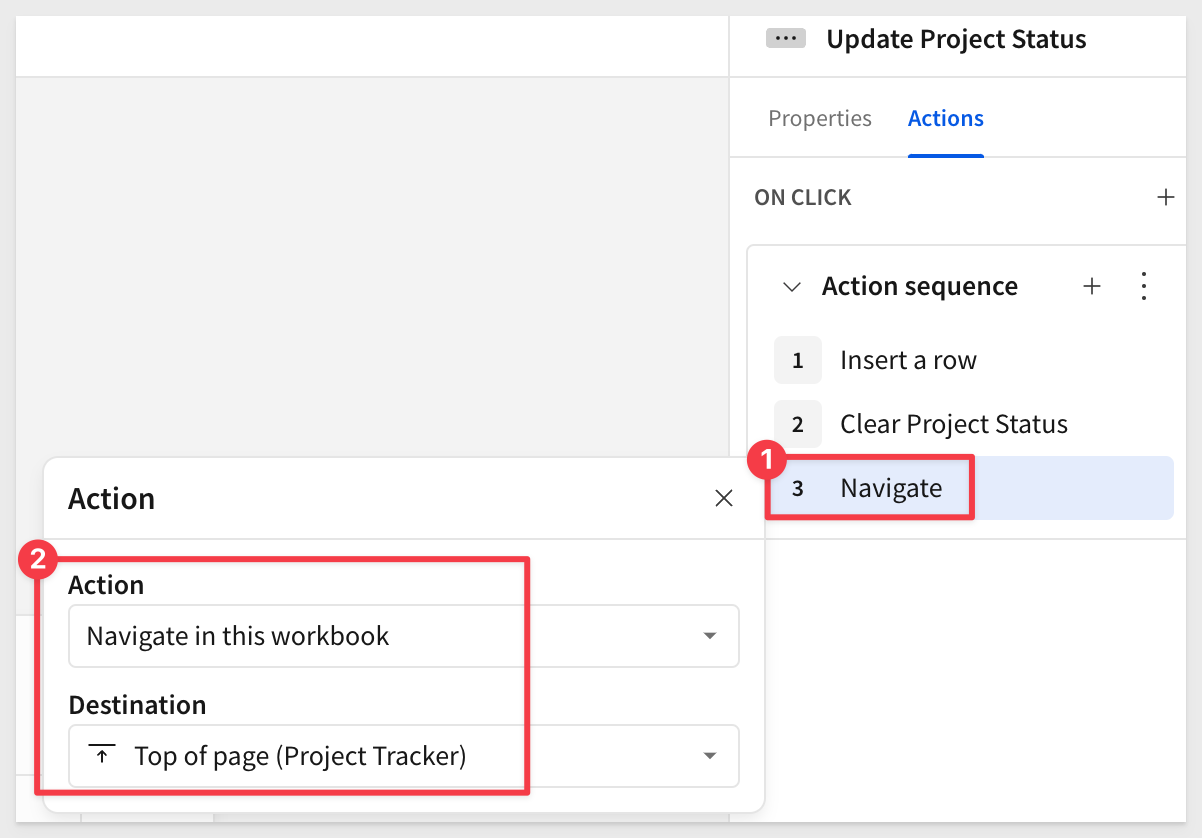
Saving clicks is always appreciated!
Step 11:
Back on the Project Tracker page, select Update Status for any project and test out the functionality of Modal - Update Status.
After setting a status and clicking the Update Project Stauts button we are returned to the Control Panel where we can see the row added with the new status:

Step 12:
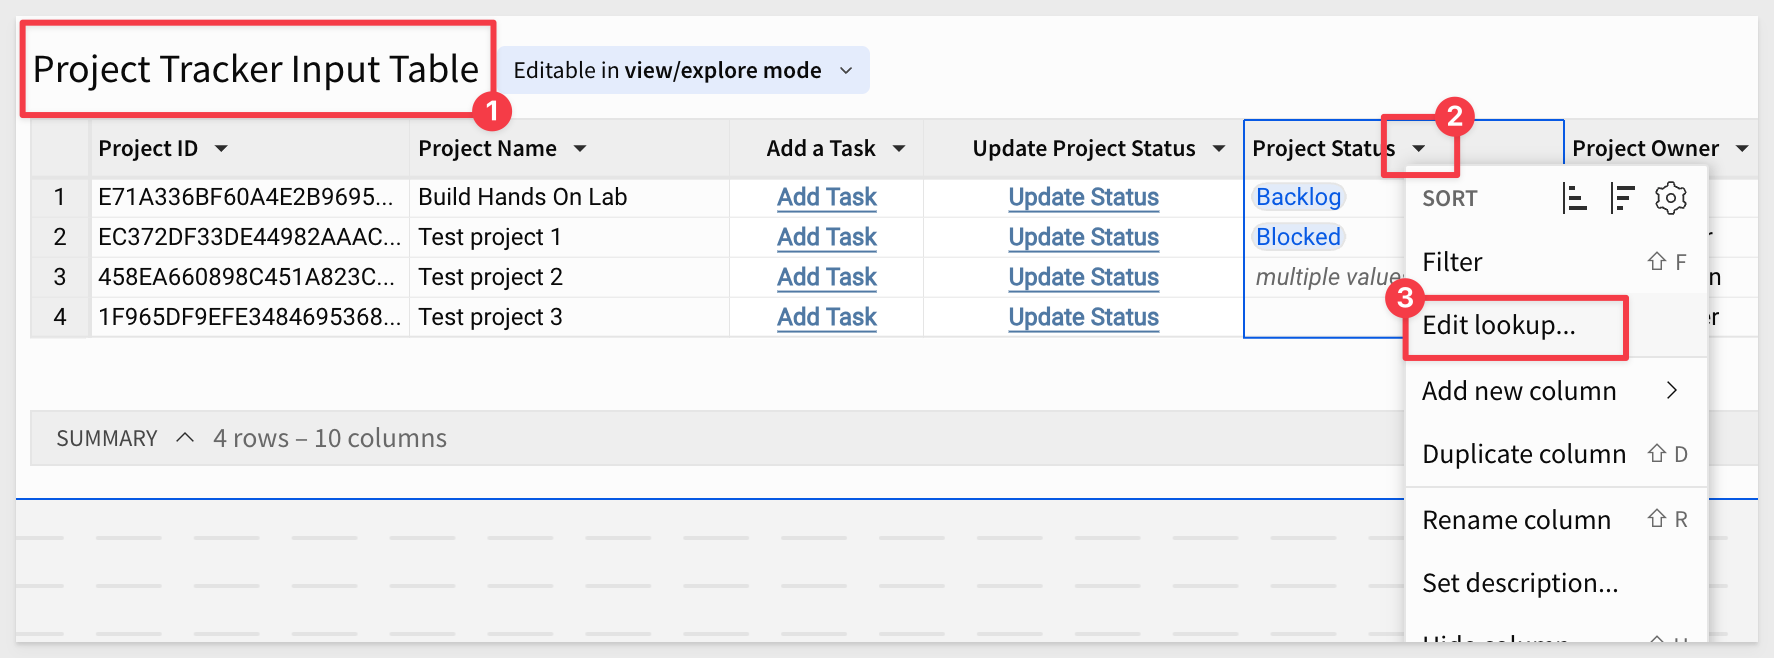
On the Project Tracker page > Project Tracker Input Table, add a new field via lookup on the Status Update Table adding Project Status based on Project ID.
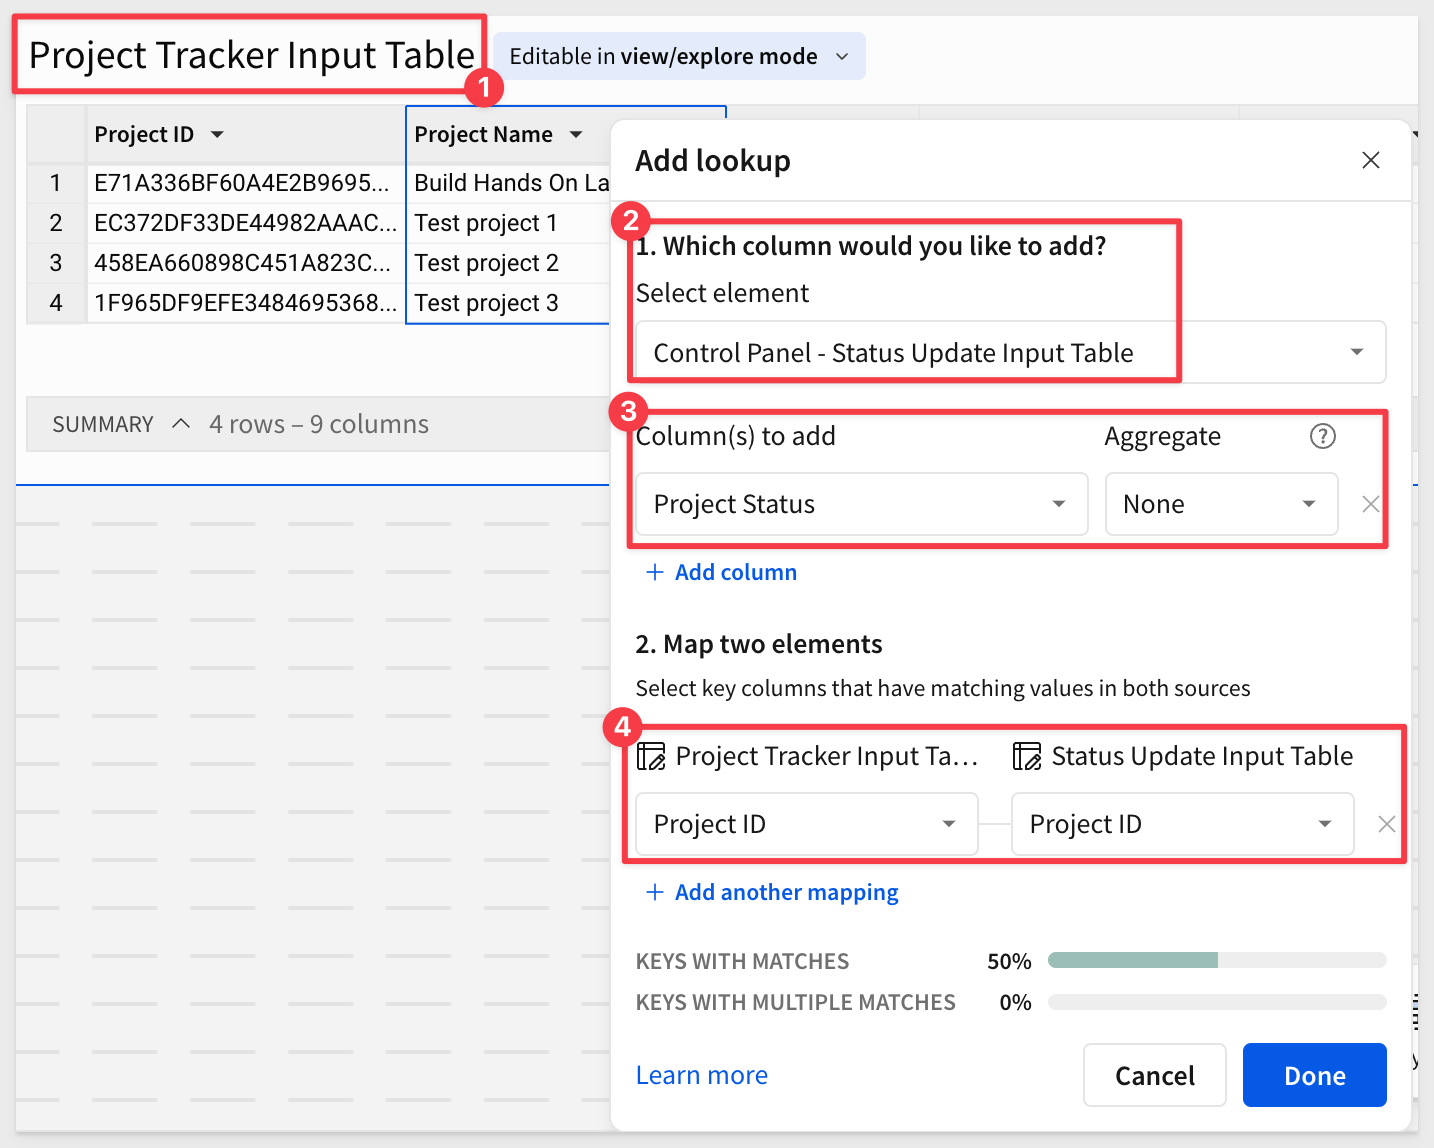
Rename the new column Project Status and move to the column to just after Update Project Status column:

Step 13:
Now update a project with a second status and see the "multiple values" result under Project Status.

This happens when a lookup is one to many instead of one to one and requires a different approach to enable proper data app functionality.
Step 14:
Create a Child table off the Control Panel > Status Update Table.
Rename this table to Status Update - Latest Status Table.
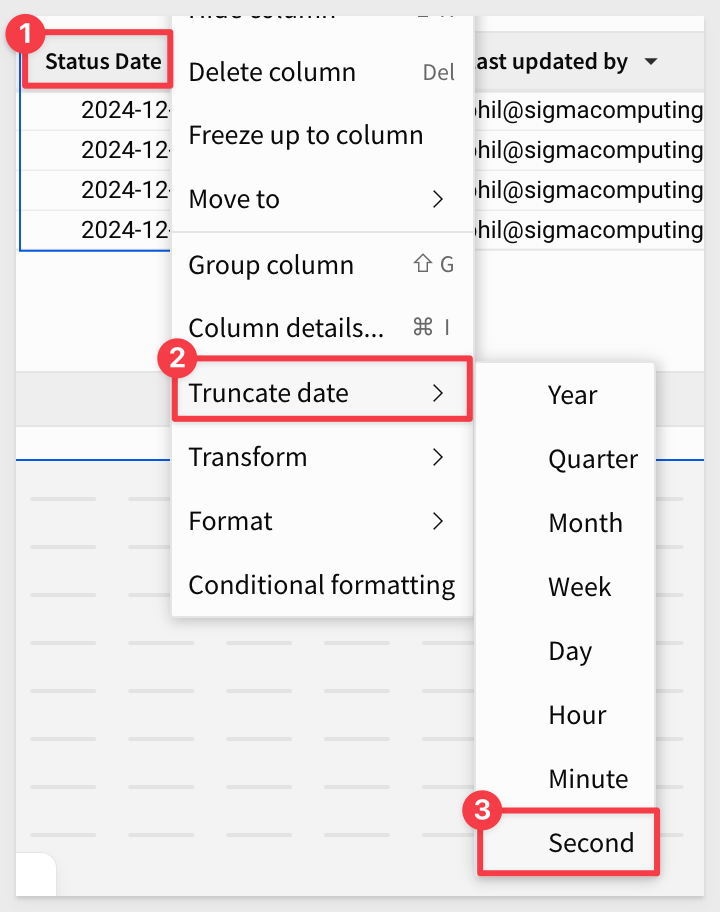
Set the Status Date to Truncate date > Second:
Step 15:
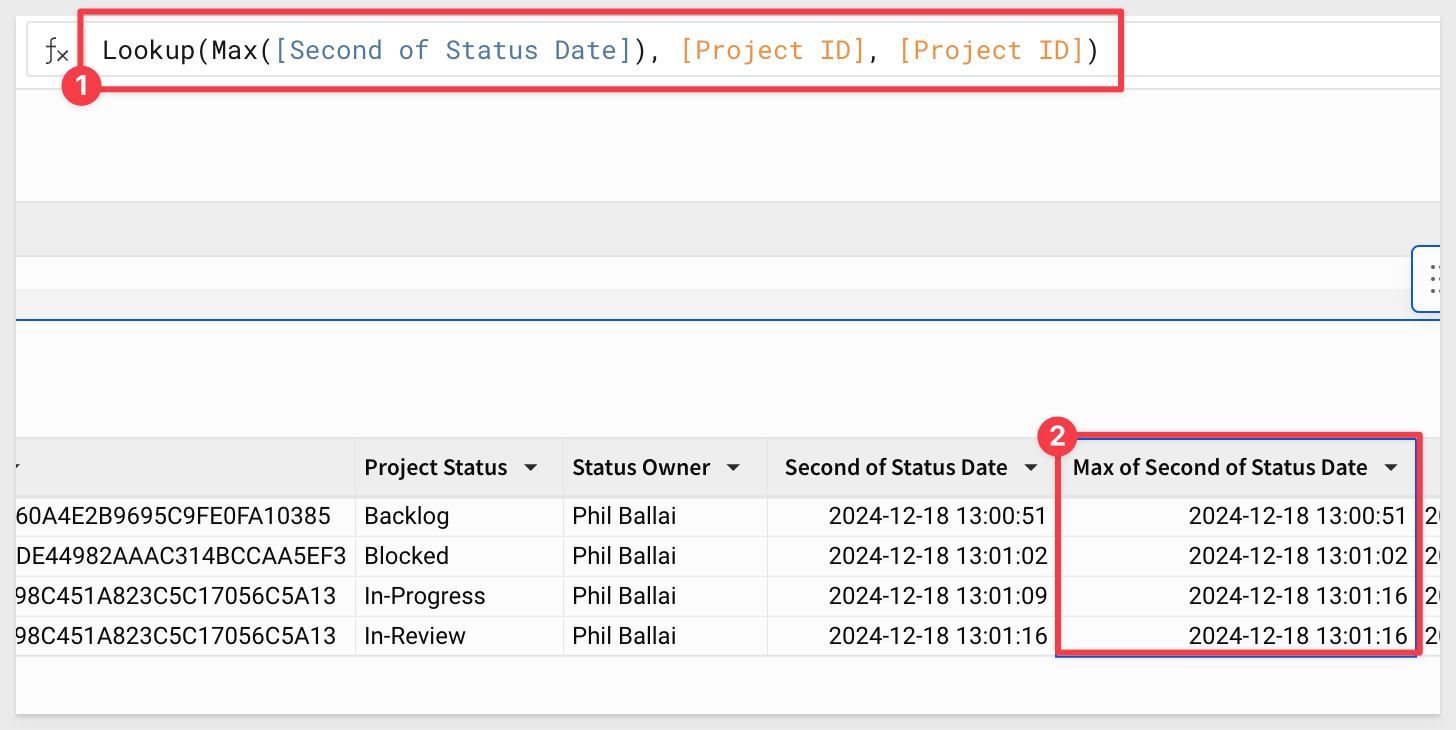
Add a new column to the table, set the calculation to be:
lookup(max([Second of Status Date]), [Project ID], [Project ID]
For more information about functions in Sigma, see Function index
Step 16:
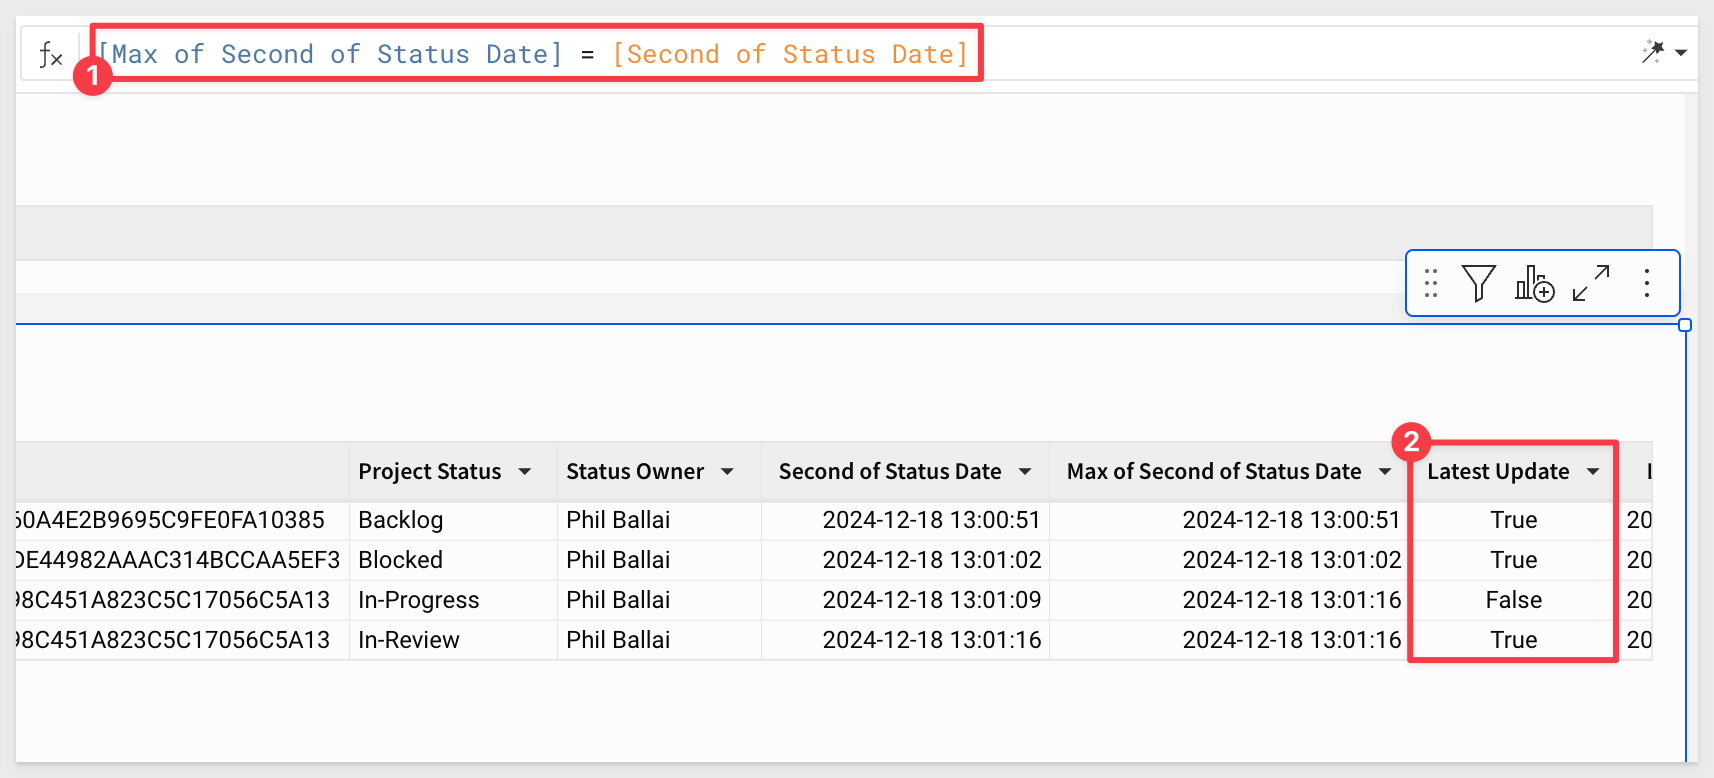
Add a new column of Latest Update with calculation:
[Max of Second of Status Date] = [Second of Status Date]
This will result in a true or false:
Step 17:
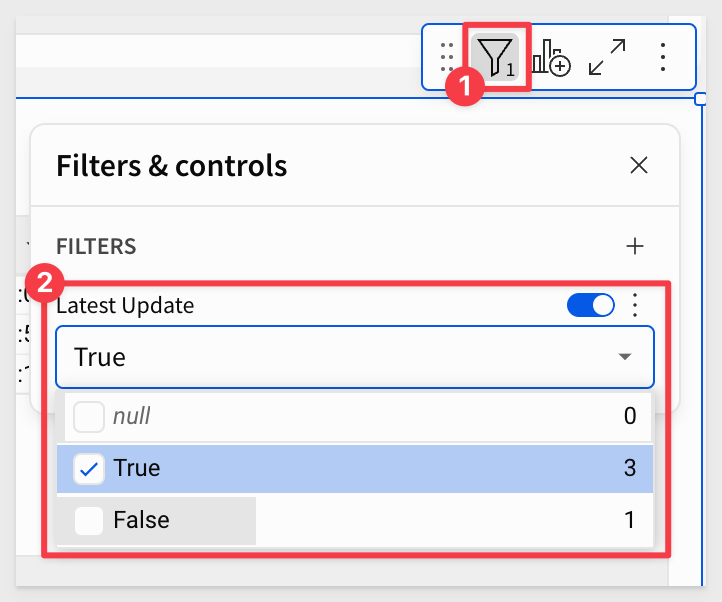
Filter this Latest Update column to only show the True status updates.
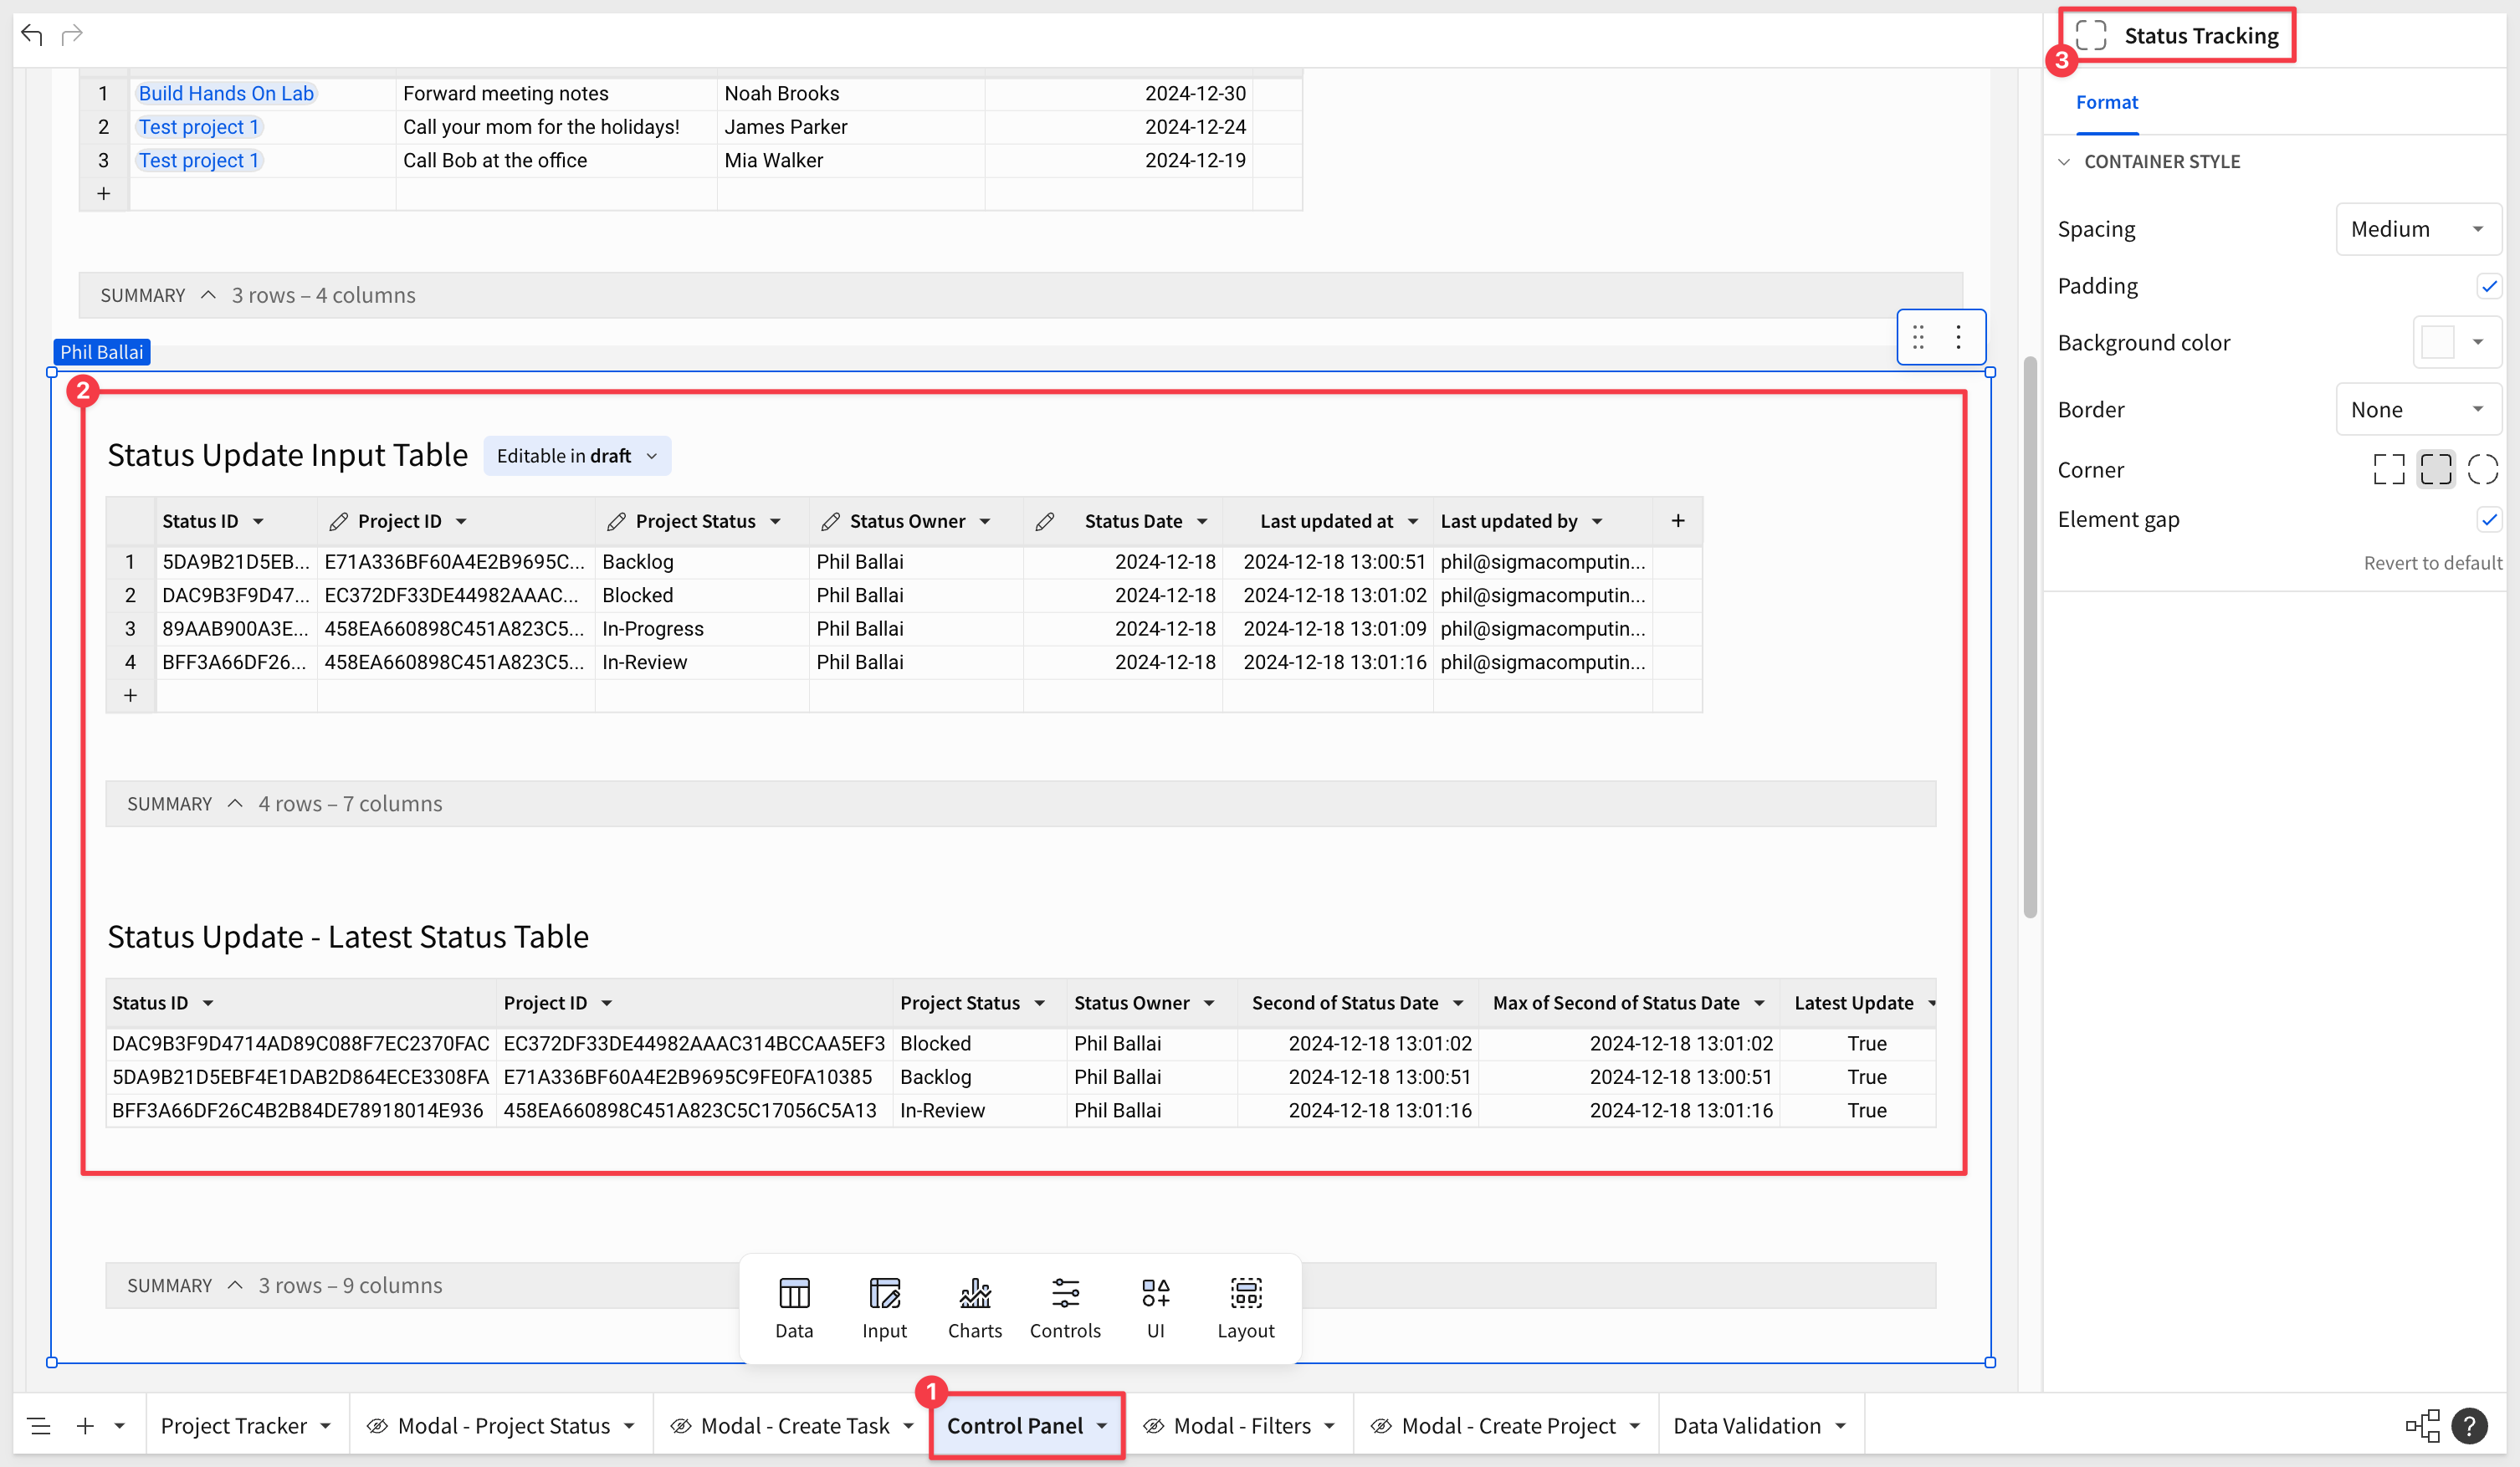
The Status Update Input Table operates as the transaction log, while the Latest Status Table provides just the latest value:

Having both tables for this and other potential analytics can be powerful.
Step 18:
Update the lookup on the Project Tracker Input Table to now look at the Latest Status Table adding Project Status based off Project ID:
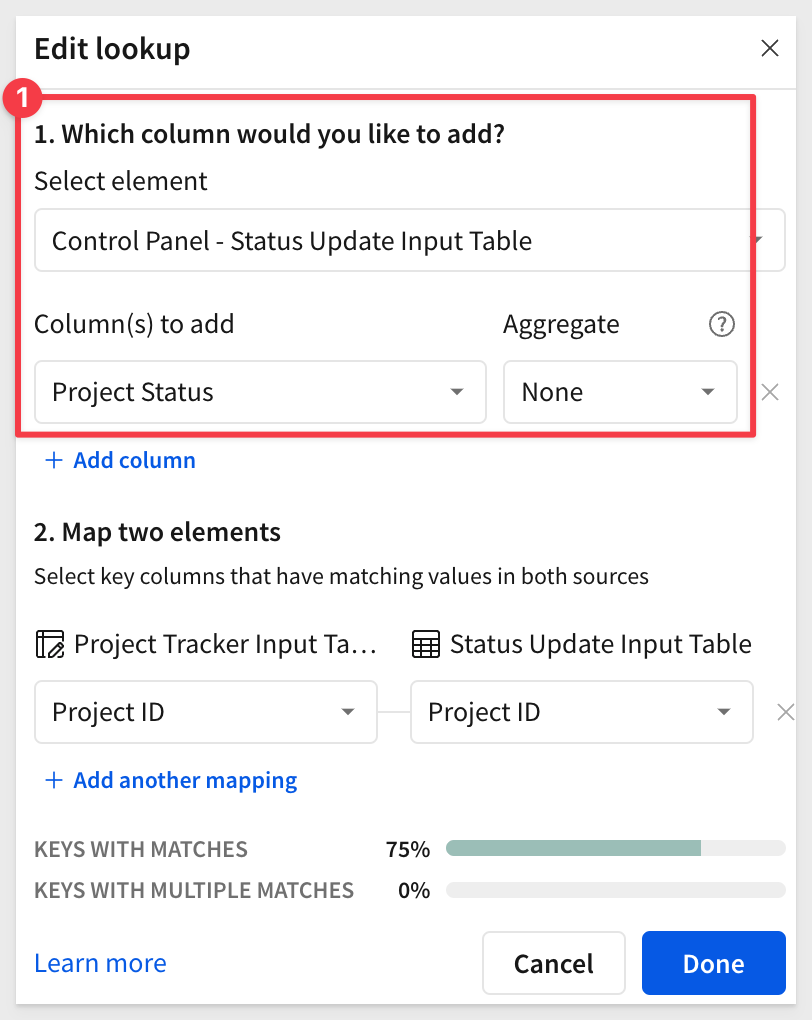
Now our table shows the most recent Project Status:

Step 19:
Select the Status Update - Latest Status Table and Status Update Input Table and place them in a container named Status Tracking container:

Step 1:
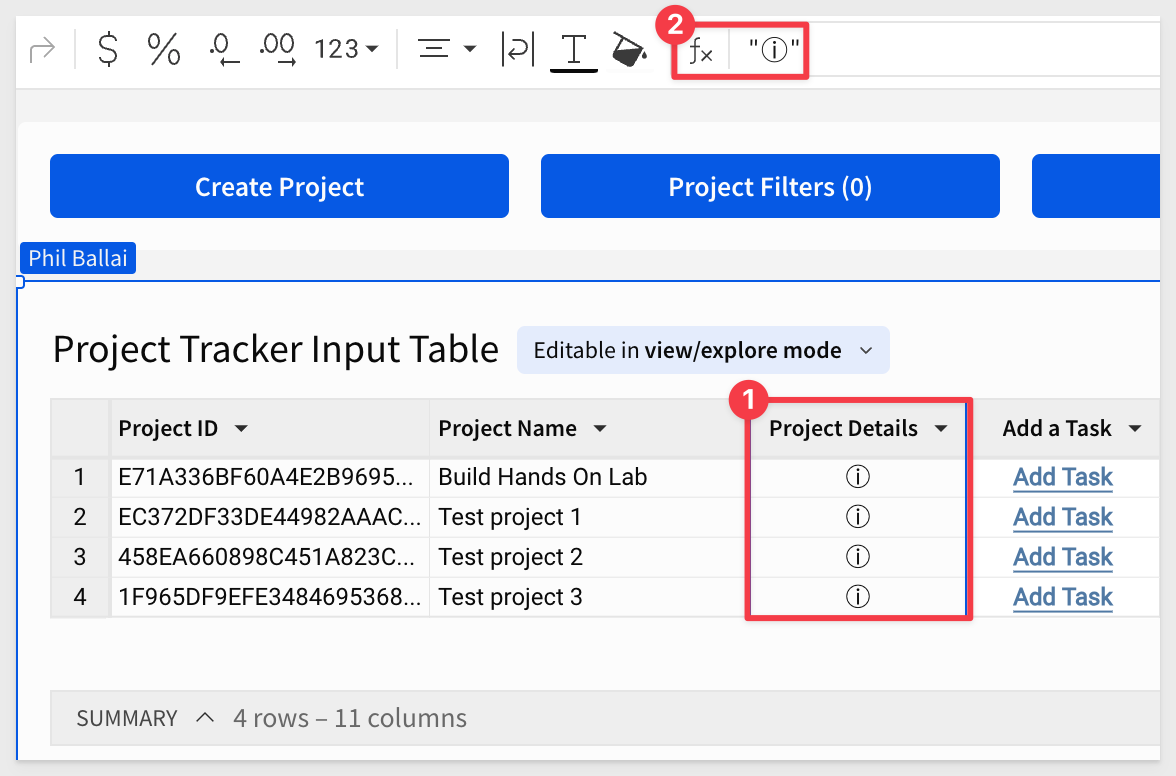
On the Project Tracker Input Table, create a new Calculation column and rename it to Project Details.
Set the column's formula to "ⓘ".
This will be used to pop up a modal with project details.
Step 2:
Create a new Modal page and rename it to Modal - Project Details.
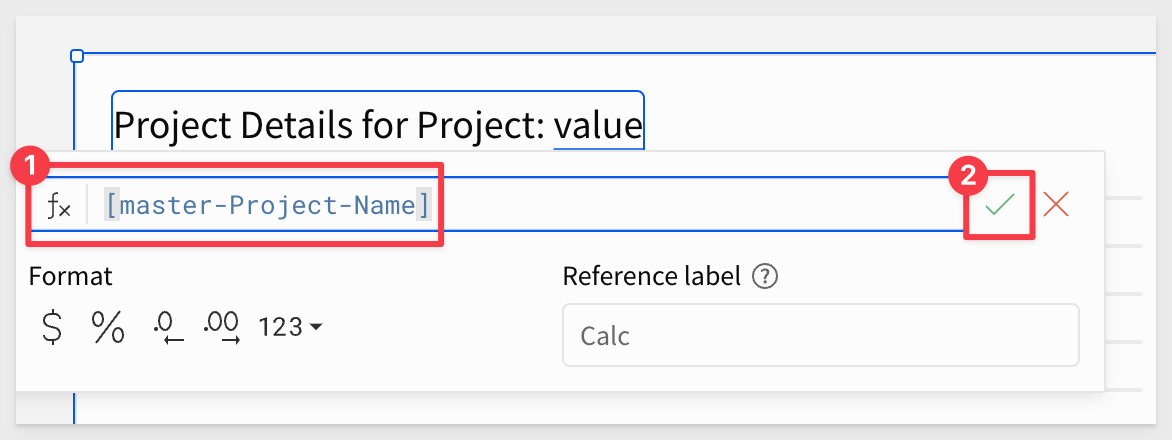
Change the modal's title to Project Details for Project: and the add the = sign.
Using the formula bar, set it to reference [master-Project-Name] and click the green checkmark:
Step 3:
From the elements bar, in the UI group, add a Text control with Project Owner and type =[Pr into the formula bar. This will return all the matching items. Select Project Tracker Stable Table:
The list will then show all the columns from the selected table. Now we can choose the column we want, Project Owner:
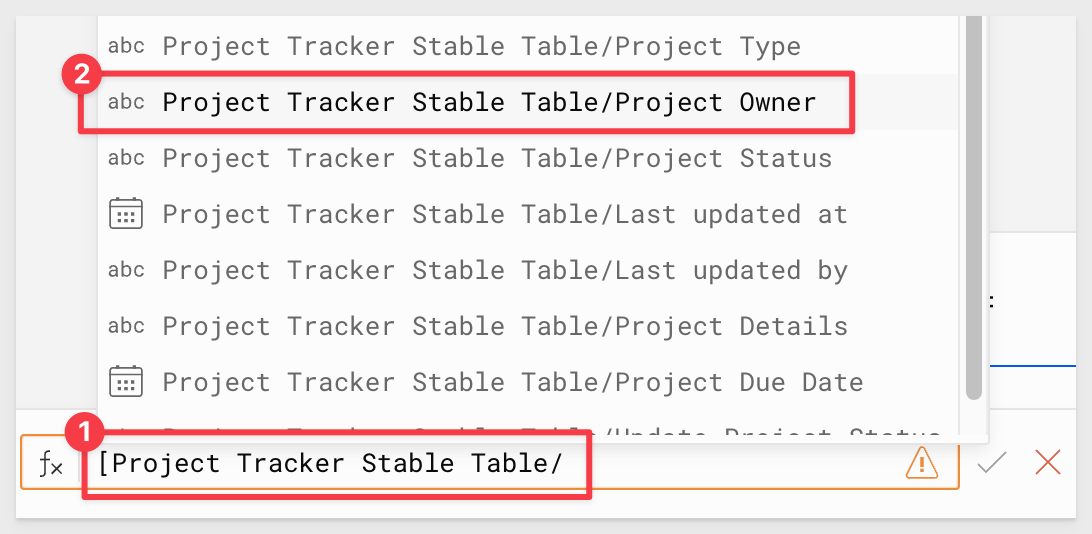
Click the green check mark to accept the entry of [Project Tracker Stable Table/Project Owner].
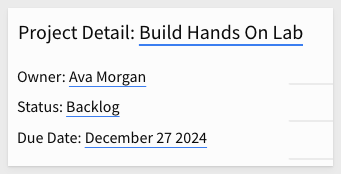
Repeat the process by adding two more line beneath the first one for:
[Project Tracker Stable Table/Project Status]
[Project Tracker Stable Table/Project Due Date]
We now have:
Step 4:
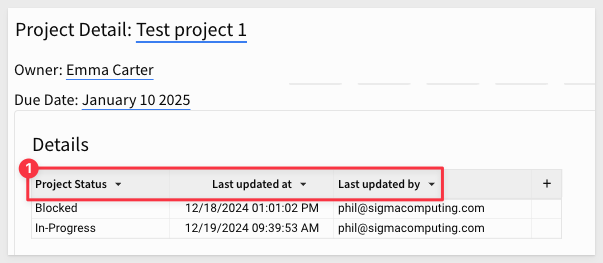
Create another Child table of the Status Update Input Table on the Control Panel page. Then move it to the modal titled Modal - Project Details.
Rename the title of the table to Details:
Hide all columns except those shown below:
Step 5:
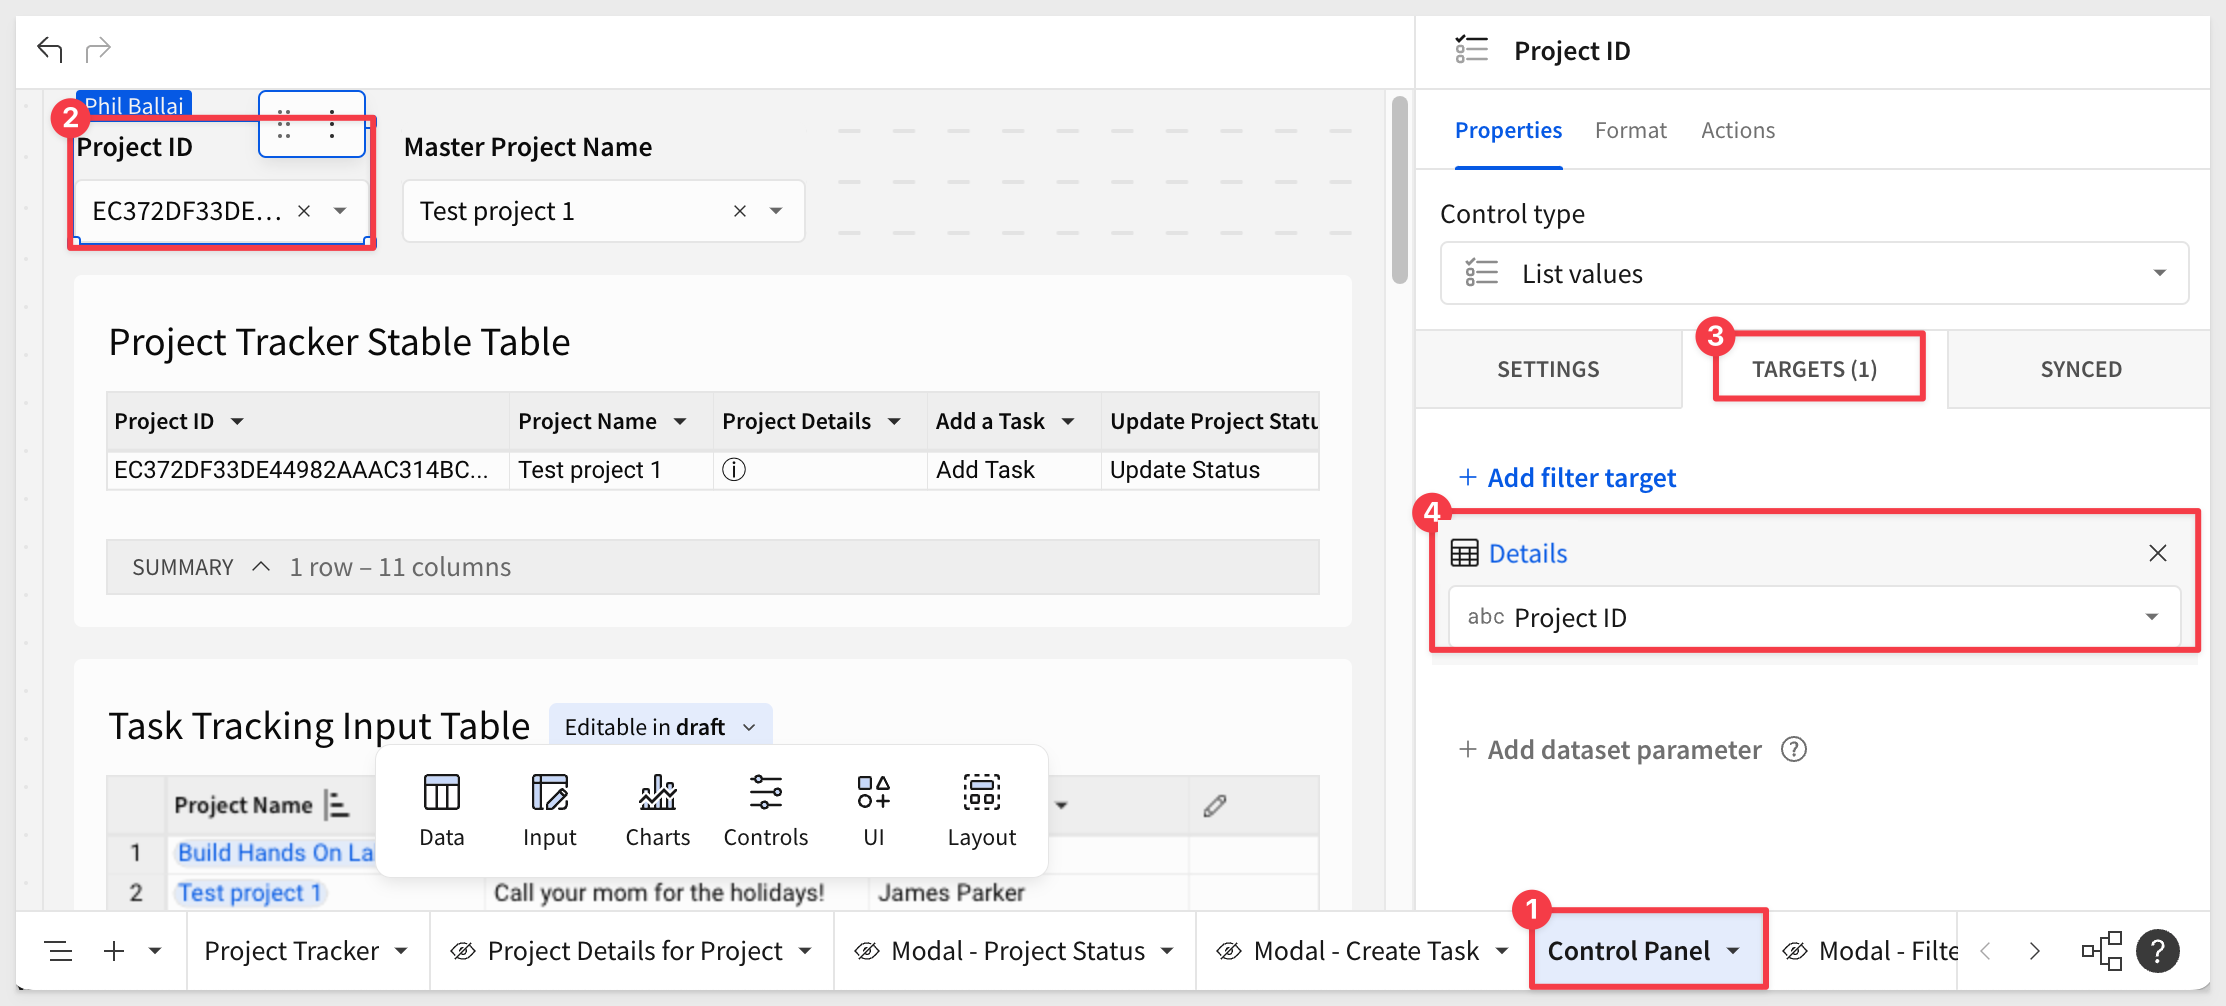
On the Control Panel page, select the Project ID control and select TARGETS in the selected element panel.
Add filter target to update the Project ID on the Details table on the Project Details for Project modal:
Step 6:
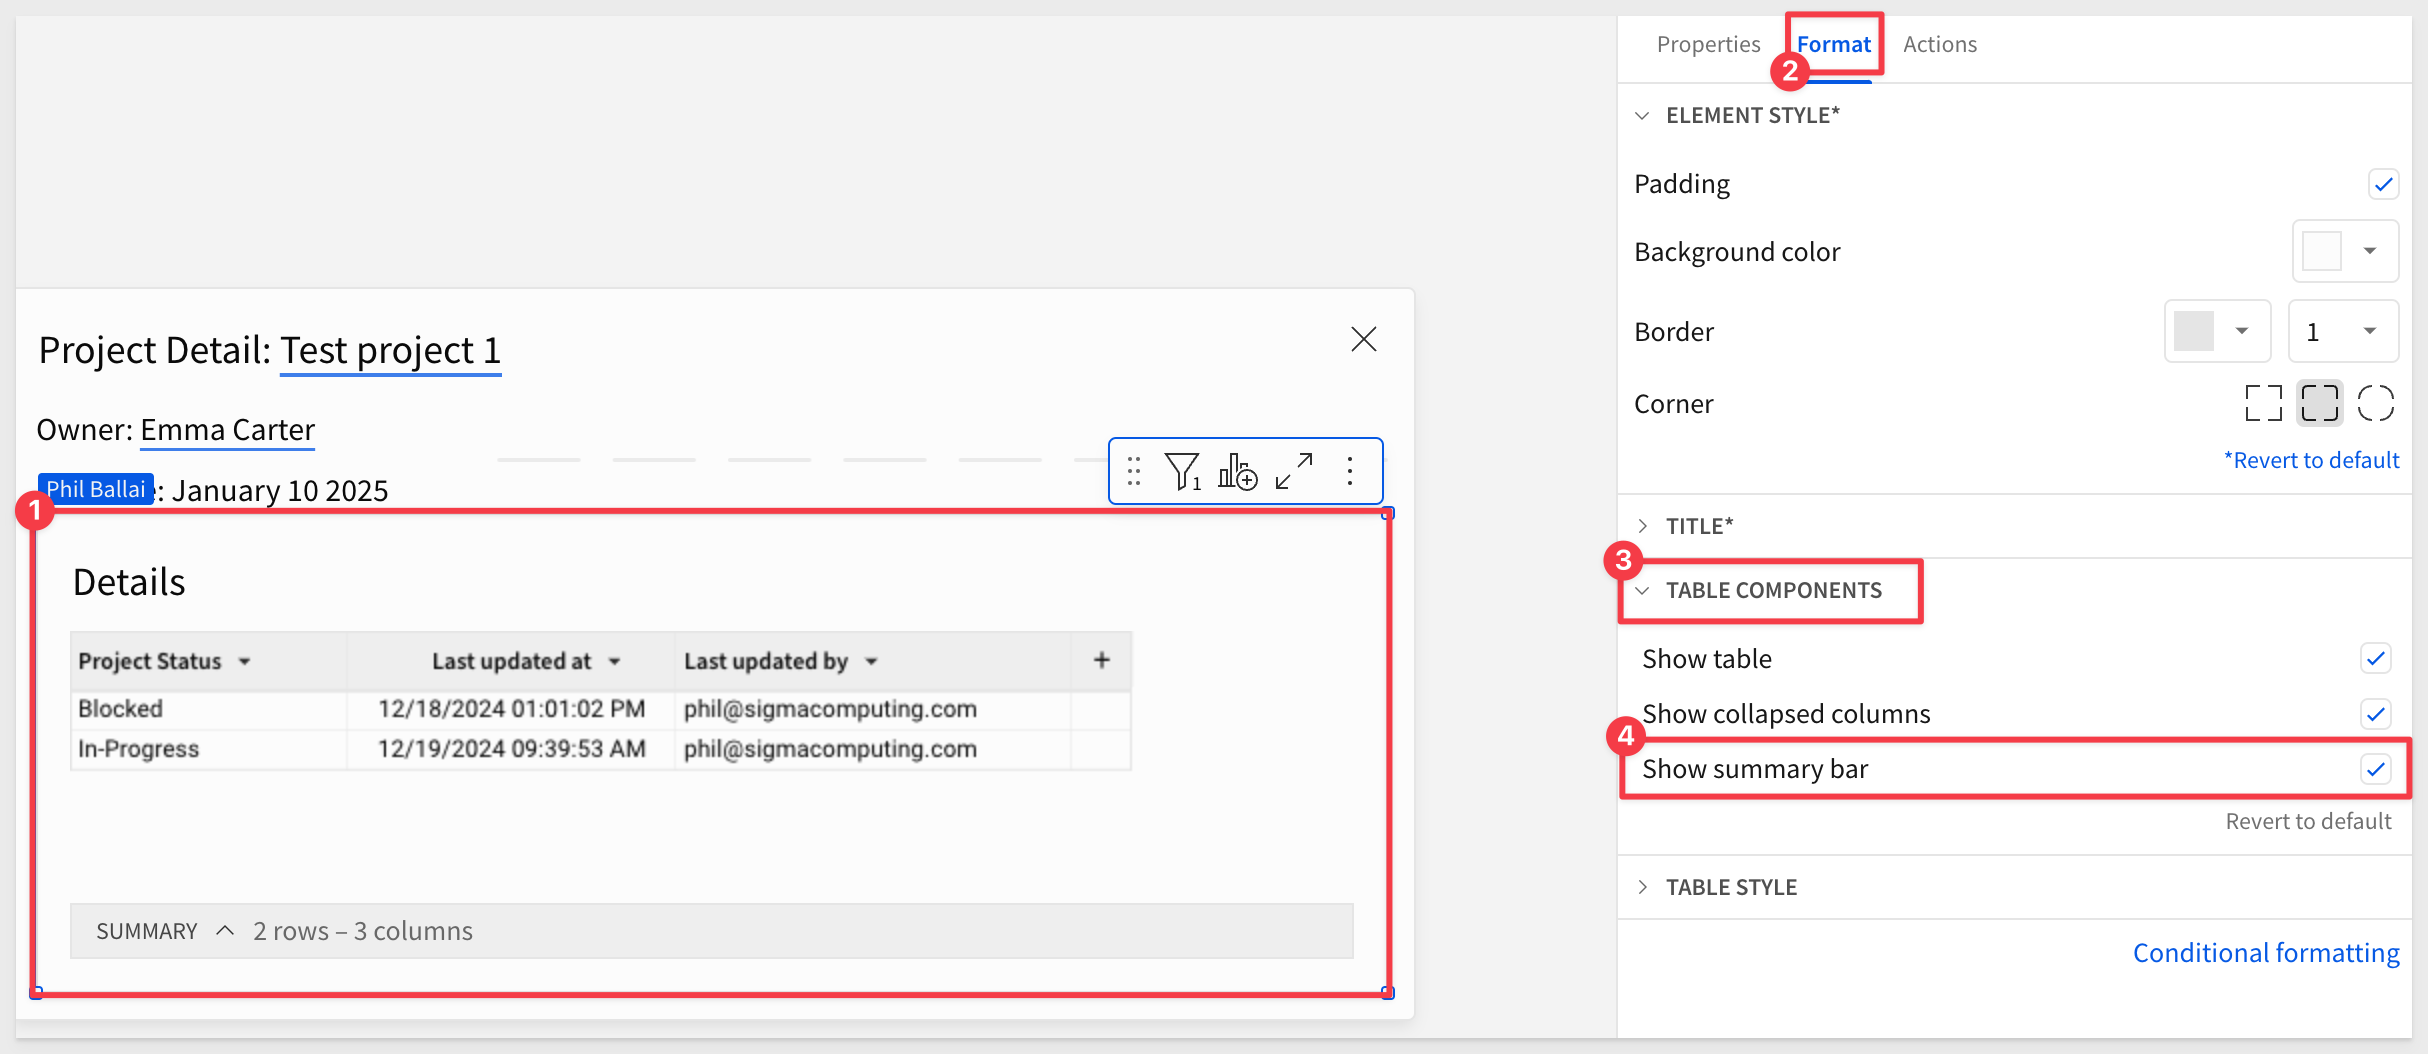
On Format > Table components, uncheck the Show summary bar option and modify the title to include the project name as we have done previously.
Step 8:
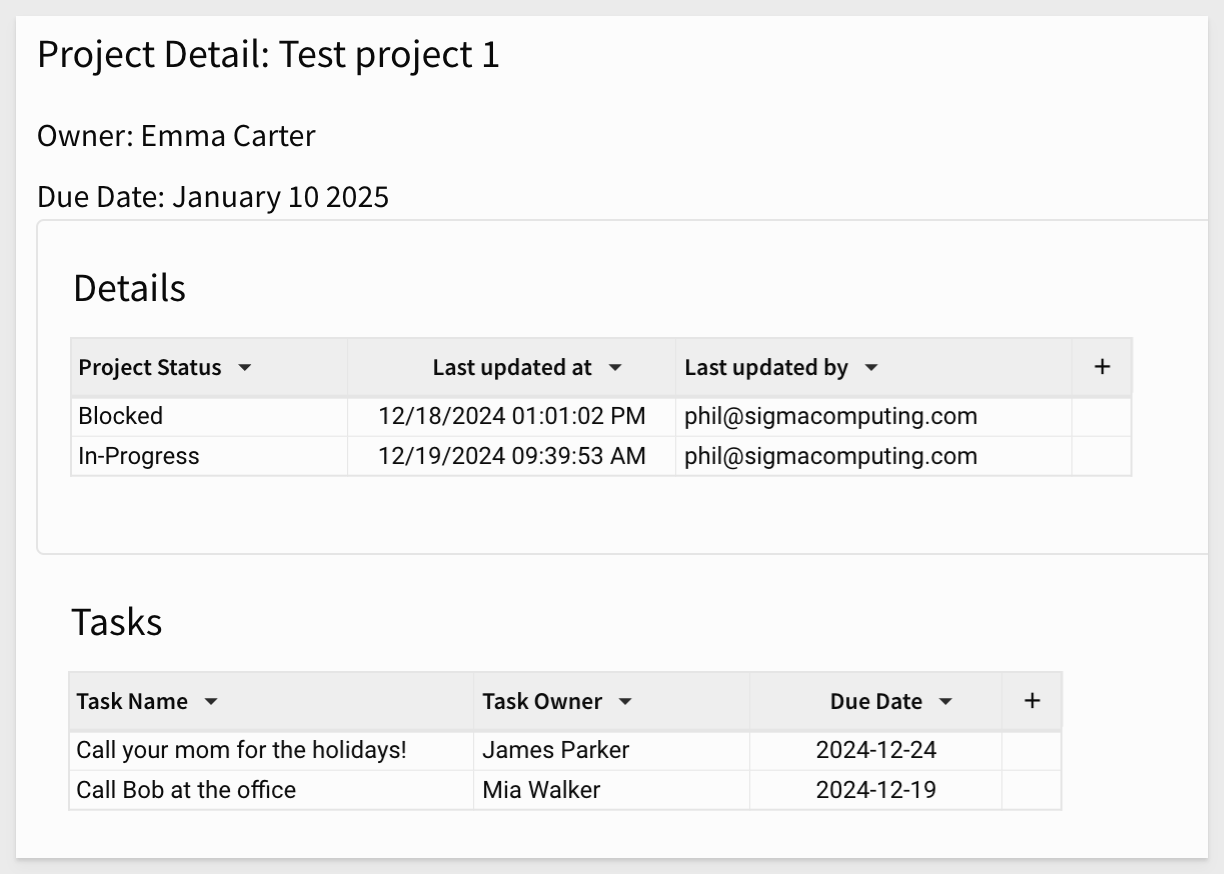
We also want to include all the related tasks for the selected project.
Repeat the steps for used for the Details table to add a Tasks table.
On the Control Panel page, create a Child table on the Task Tracking Input Table and move it to the Modal - Project Details.
Open the modal by clicking the ⓘ or by directly opening the modal page.
Remove the summary bar and add change the table's name to Tasks.
Set the Master Project Name control on the Control Panel to target the the Tasks table and the column Project Name:
Step 9:
It may be useful to be able to add tasks for this modal as well.
One the Project Details for Project modal, add a button titled Add New Task that uses an action to open the modal for Modal - Create Task.
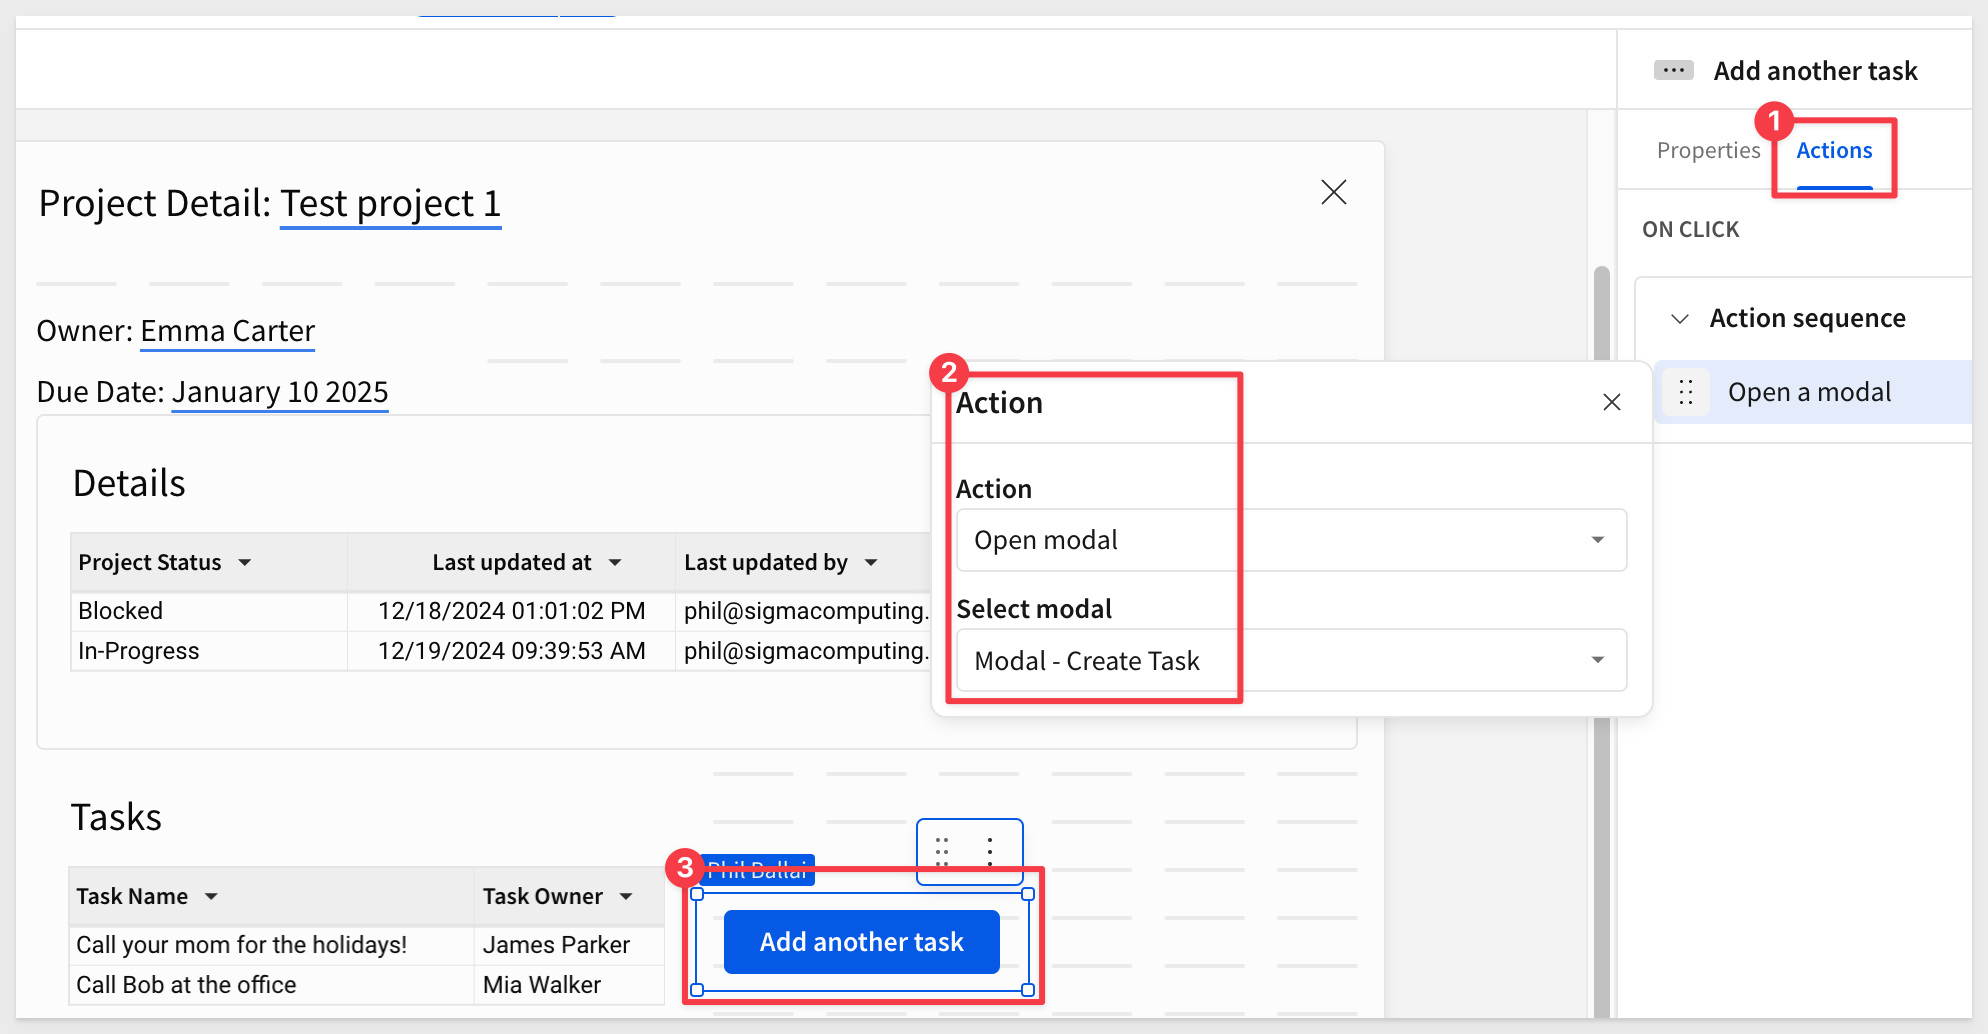
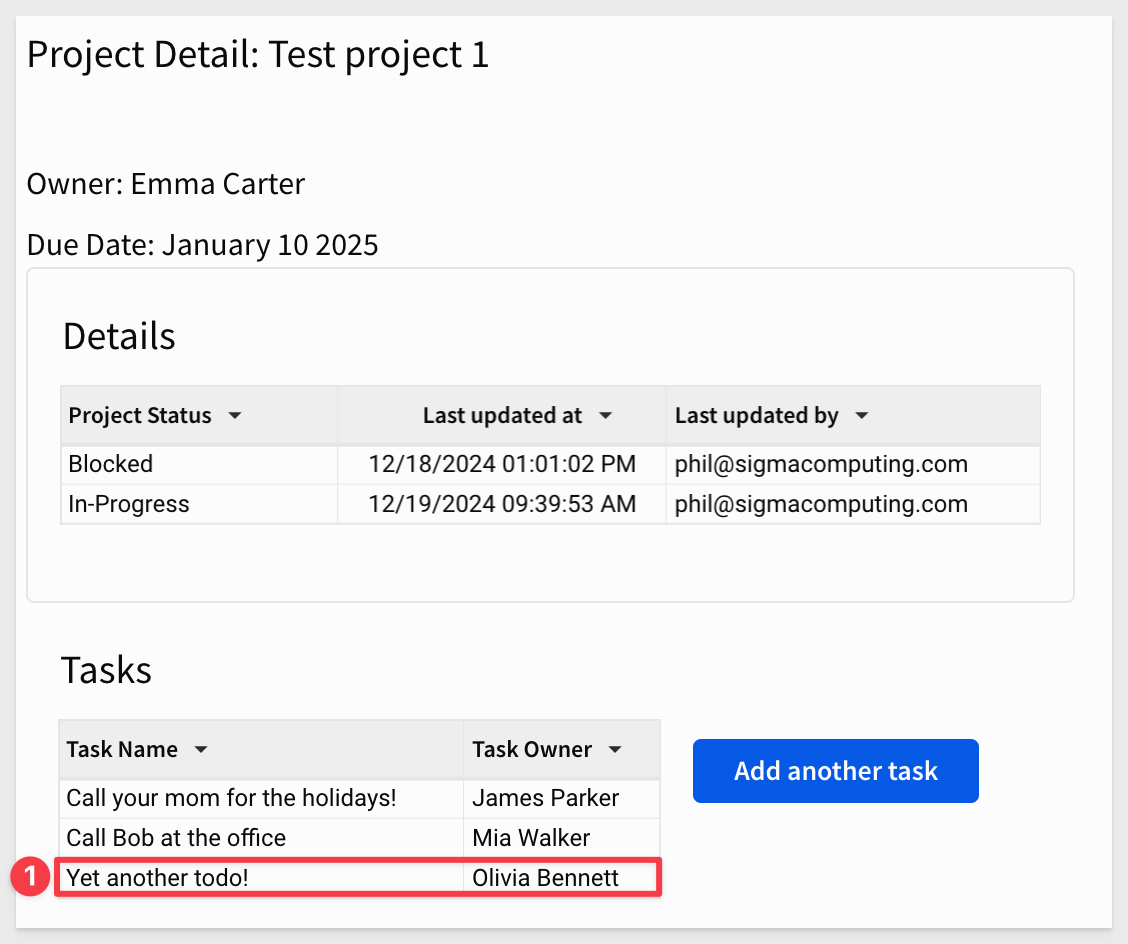
CLick the Add another task and test the workflow, to add another task to the list:
For completeness, it may be useful to include an Update Status button here as well:
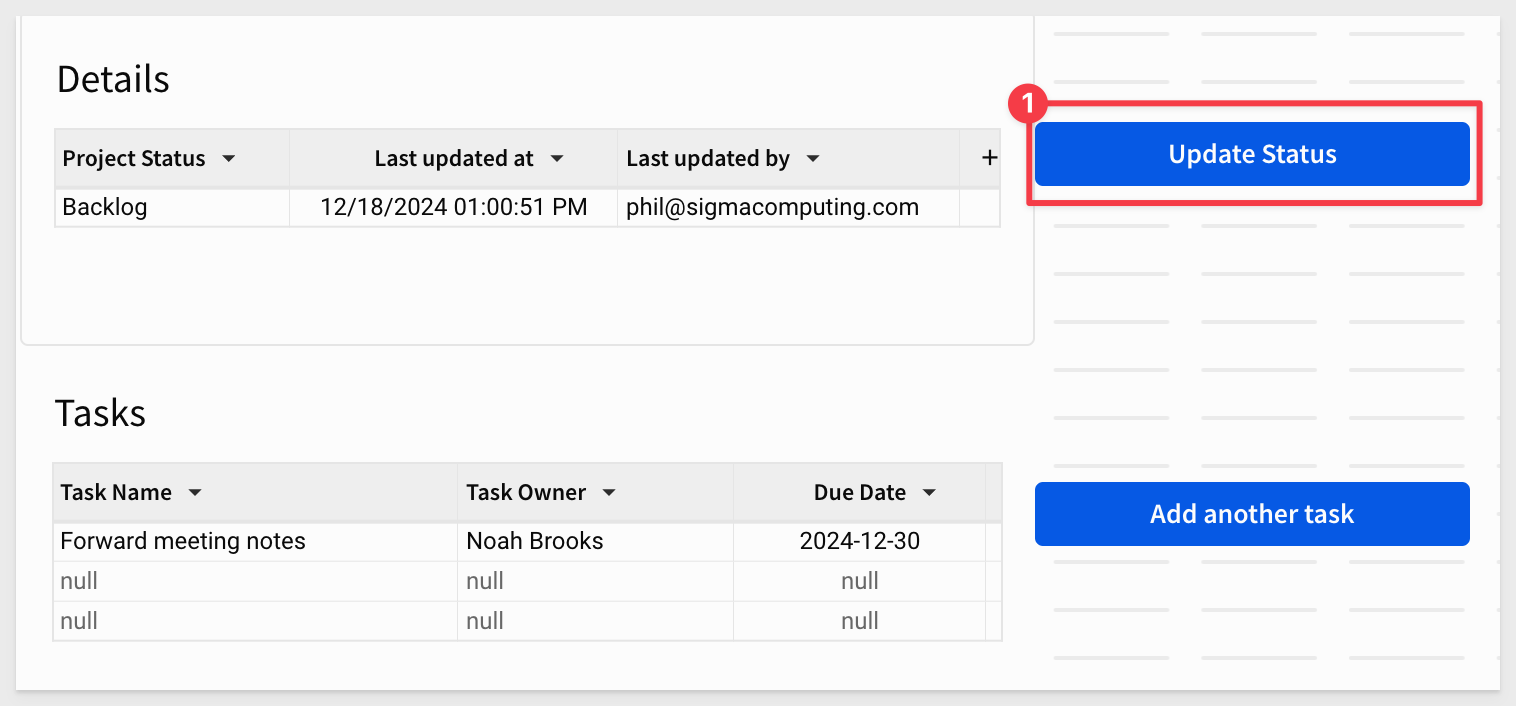
Configure its action to open the modal Modal - Update Status.
That was super quick and easy to extend the workflow now that our "base" data app pages and modals are setup!
Step 10: Adding a Visualization
Going one step further, lets add a Charts > Bar chart to the Project Details for Project modal.
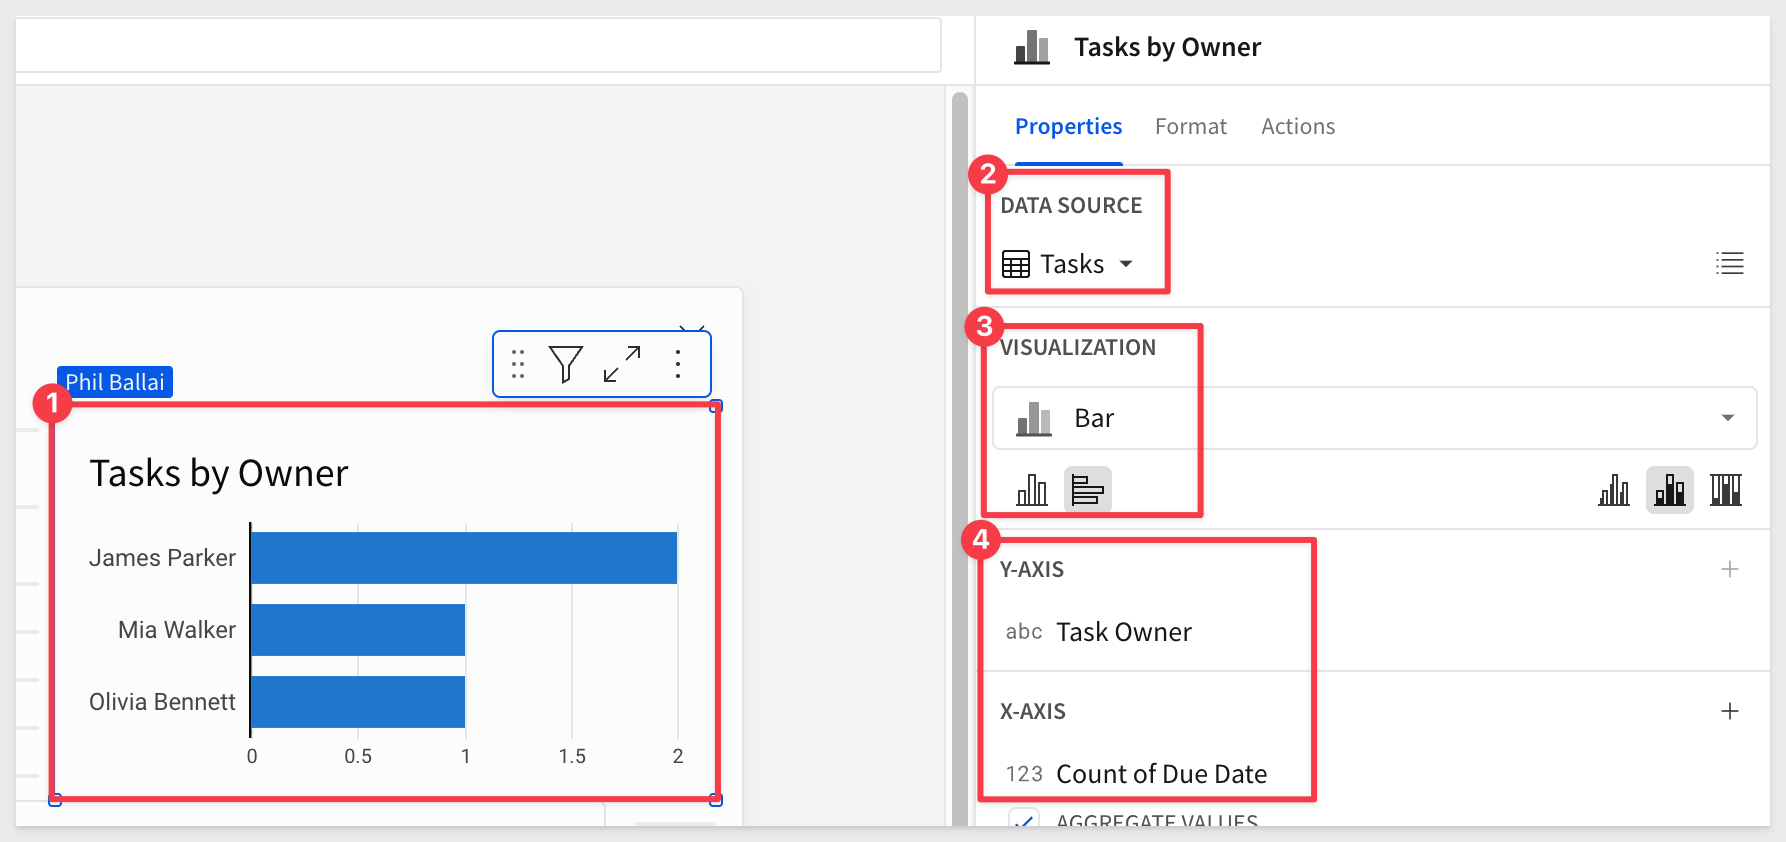
We now have:
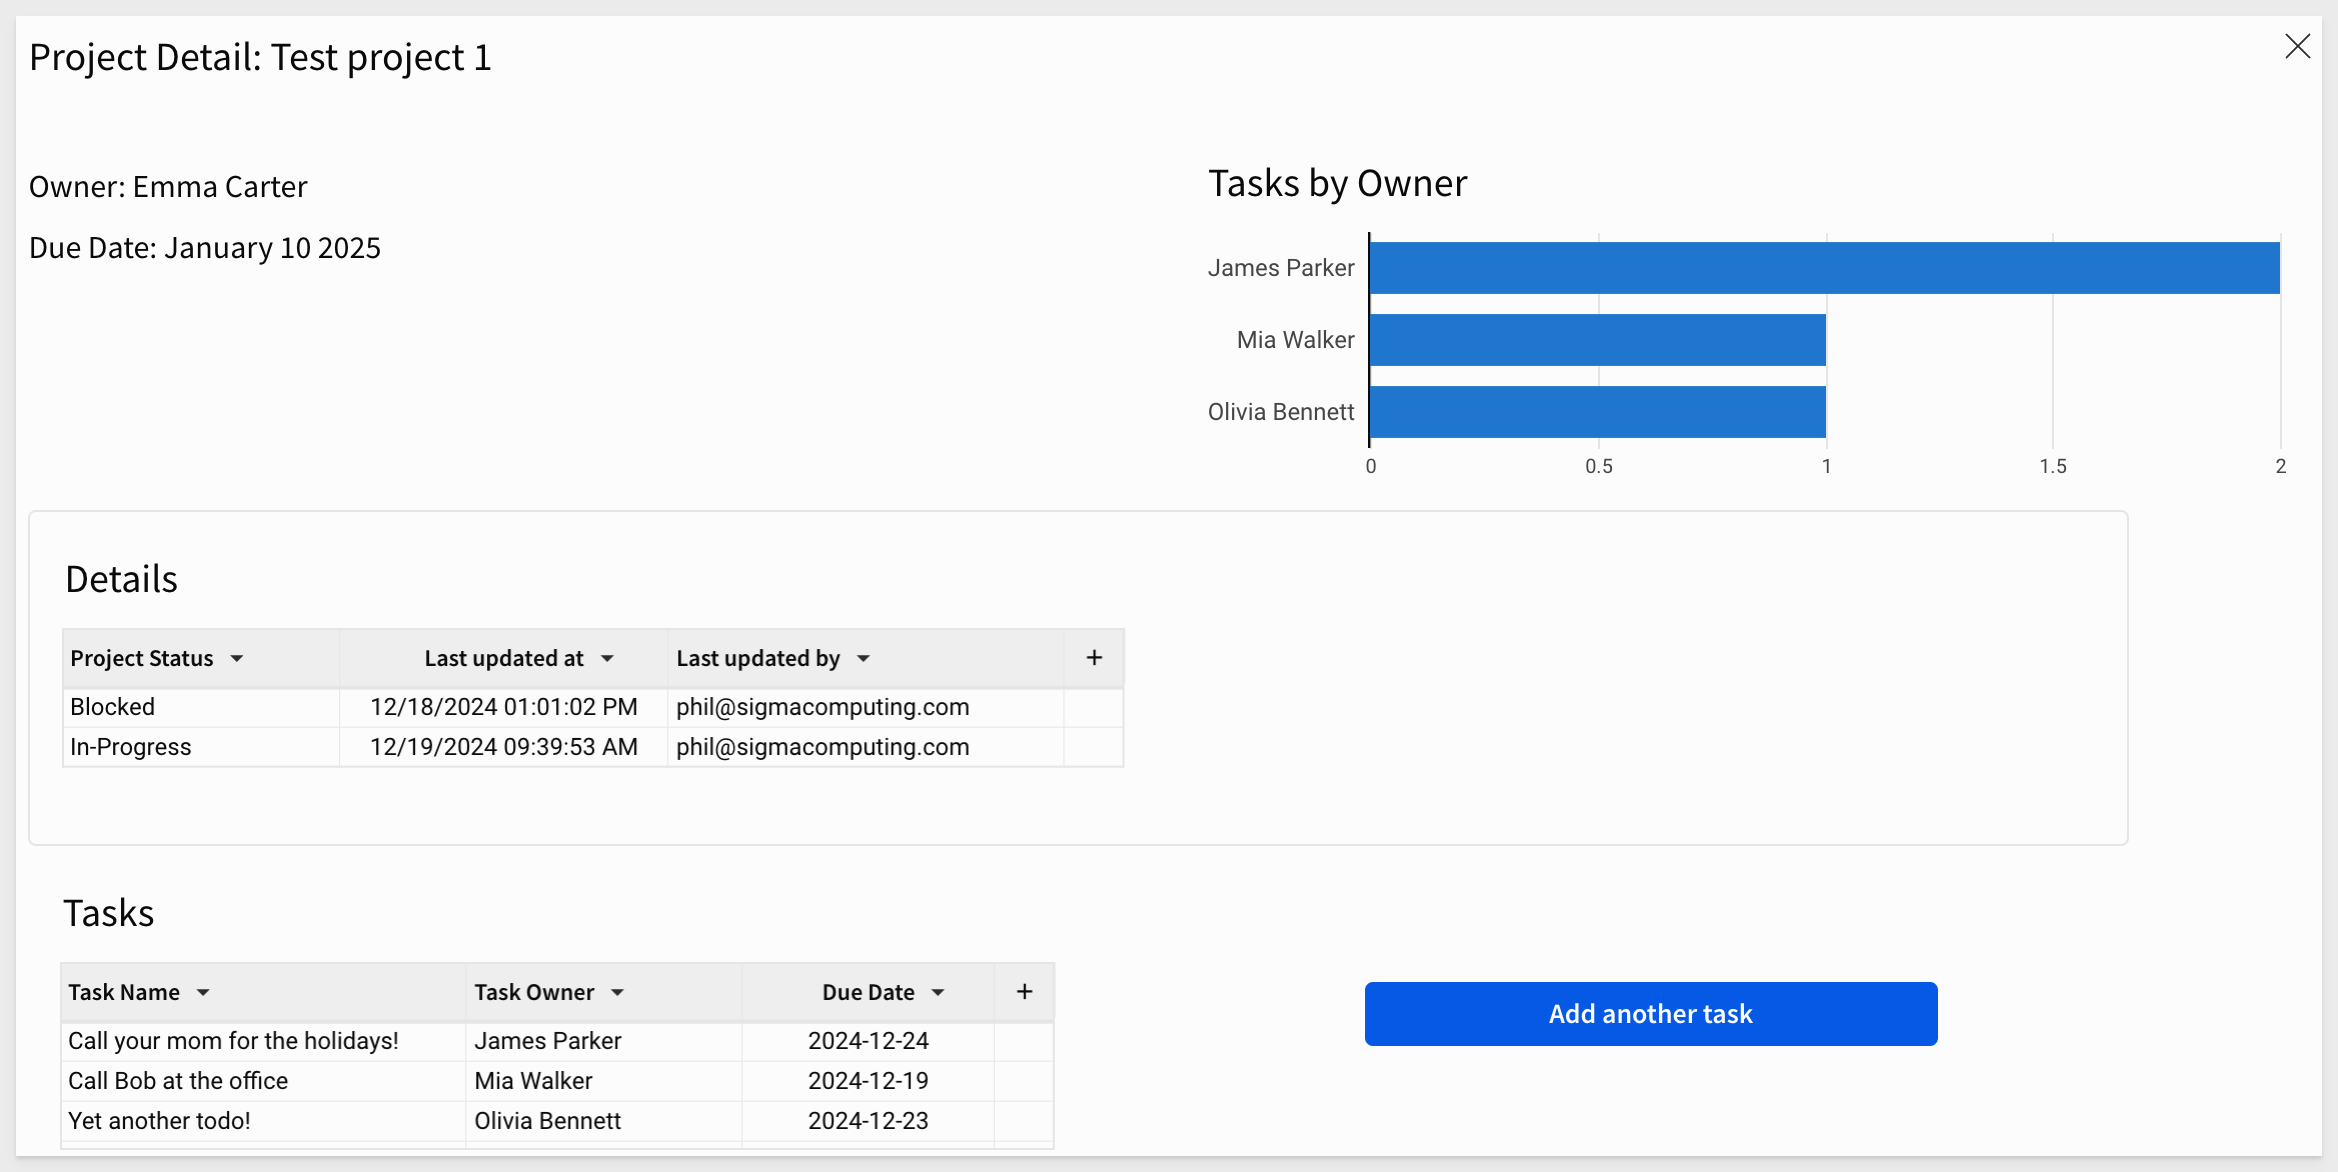
We can apply some styling by we will touch on that in the last section. Styling in Sigma is really easy so it is best to make sure the functionality all works first, and then make it look pleasing to the eye.
For more information on how Sigma supports responsive design, see Responsive design for desktop and mobile layouts

Step 1:
On the Project Tracker page, add a Controls > Segmented Control
Configure the Values as Project Owner View and Project Reviewer View.
Remove the label (title) as we have done the previous steps. The page will look like this:
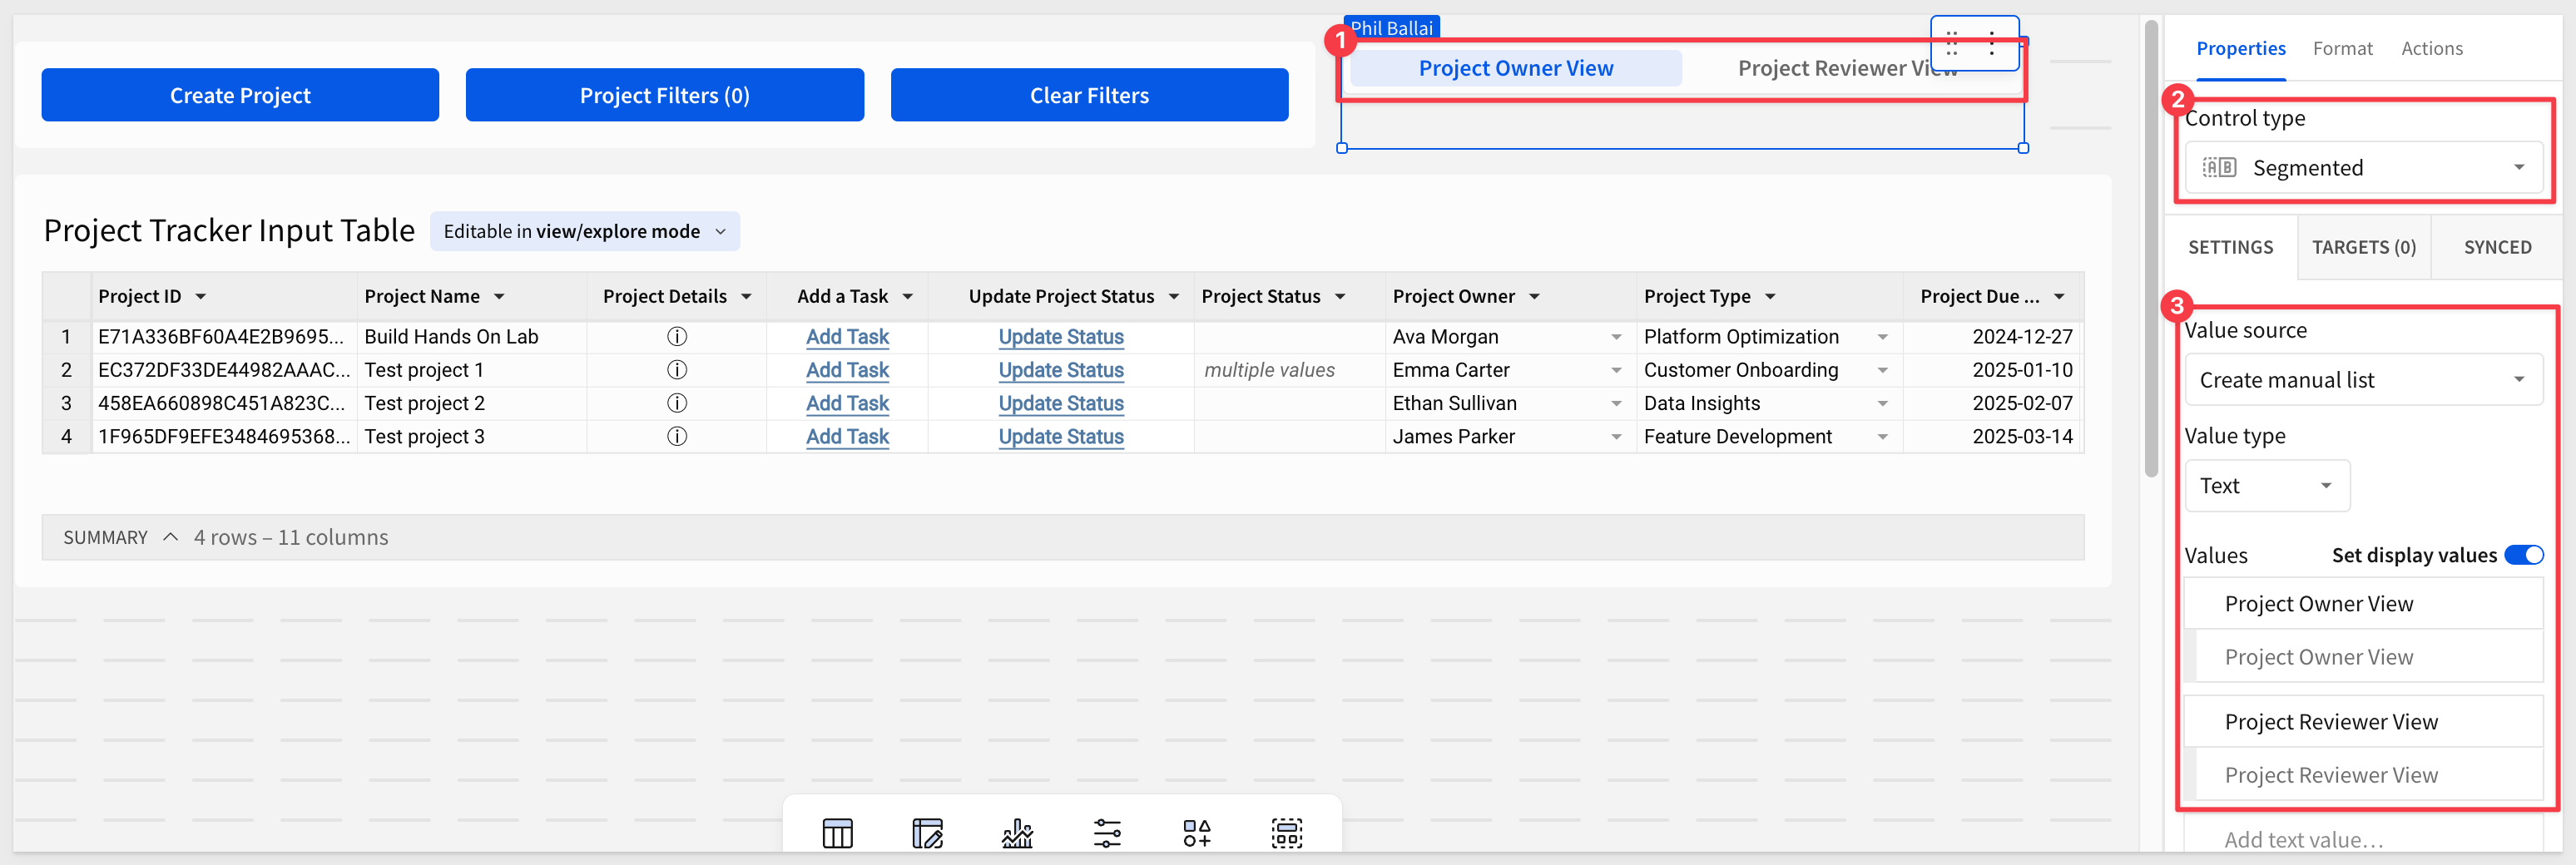
Step 2:
Add a new Calculation column to the Project Tracker Input Table called Reviewer Approval.
Set the formula to Click to Review and add it to the existing conditional formatting we have done before:

Step 3:
Select the segmented control and add an action.
Add a Condition:

And select the `Project Owner View:
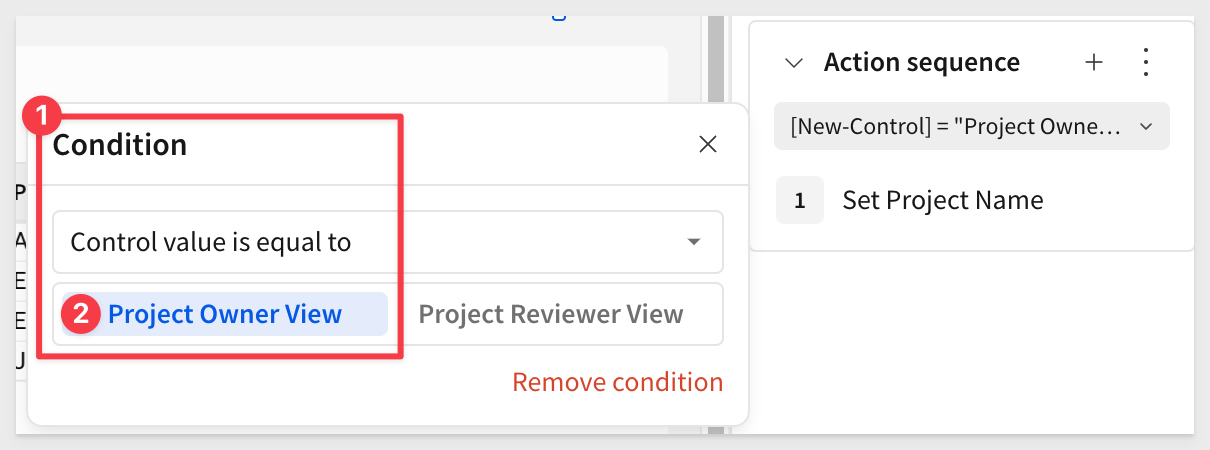
Configure the action to:
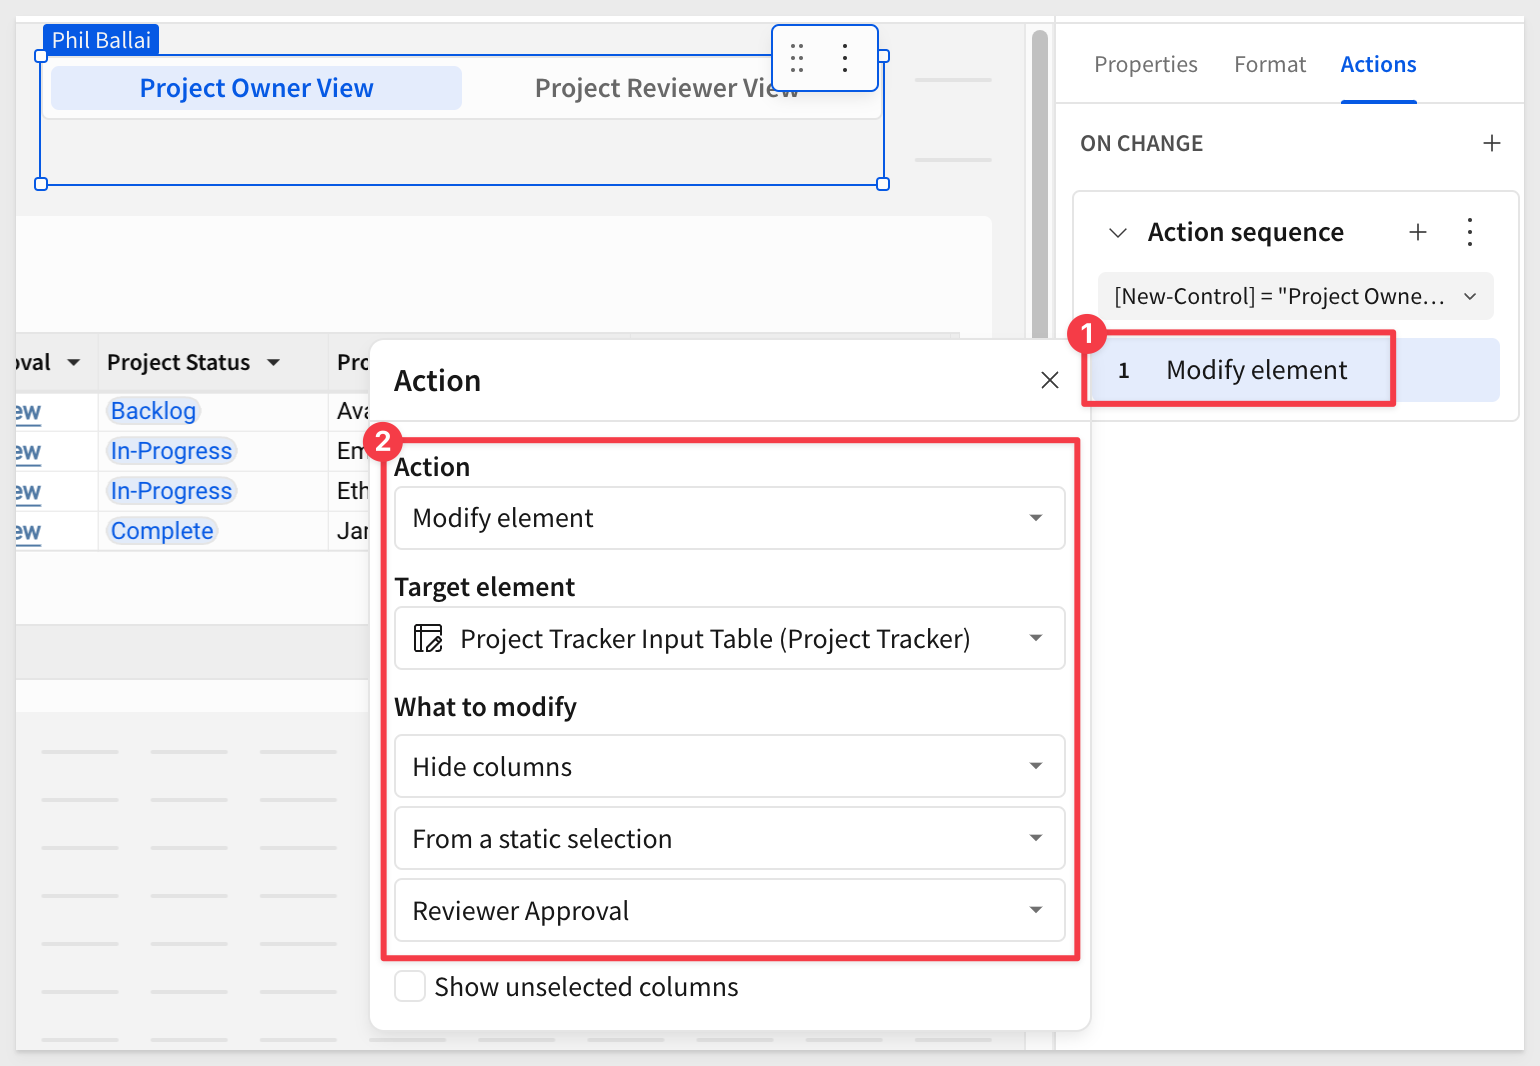
Repeat this process for the Project Reviewer View, this time setting the What to modify to Show columns:

Step 4:
On the Data Validation page, create a child table off Status Type and call it Status Type Stable Table.
Move this table to the Control Panel.
Step 5:
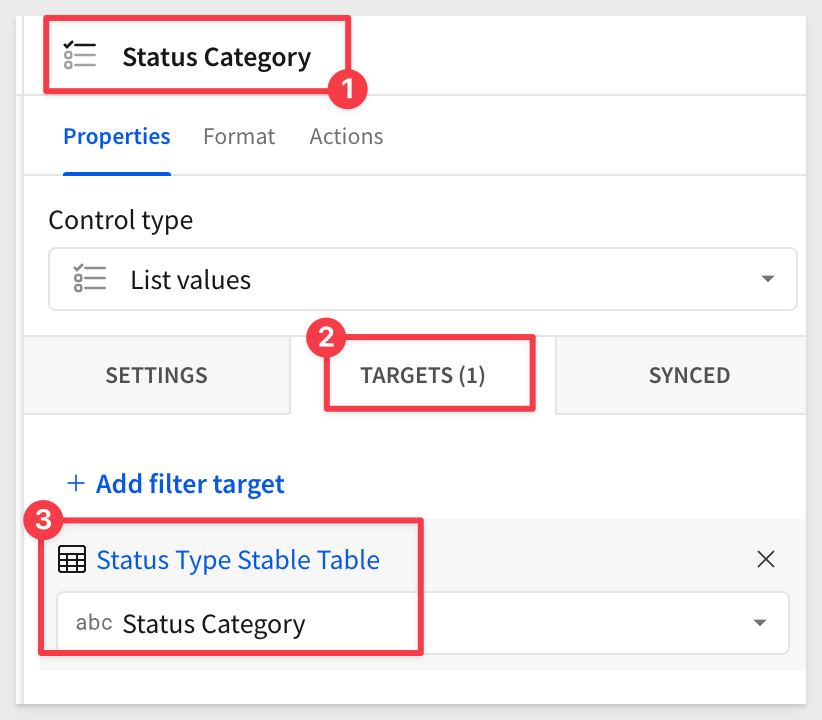
One the Control Panel page, add a filter for Status Category and convert it to a page control.
Set the page control to only Show Clear Button and Show Search Button. Update the Control ID to use the pattern we established earlier. Configure the Value source and Source column too:
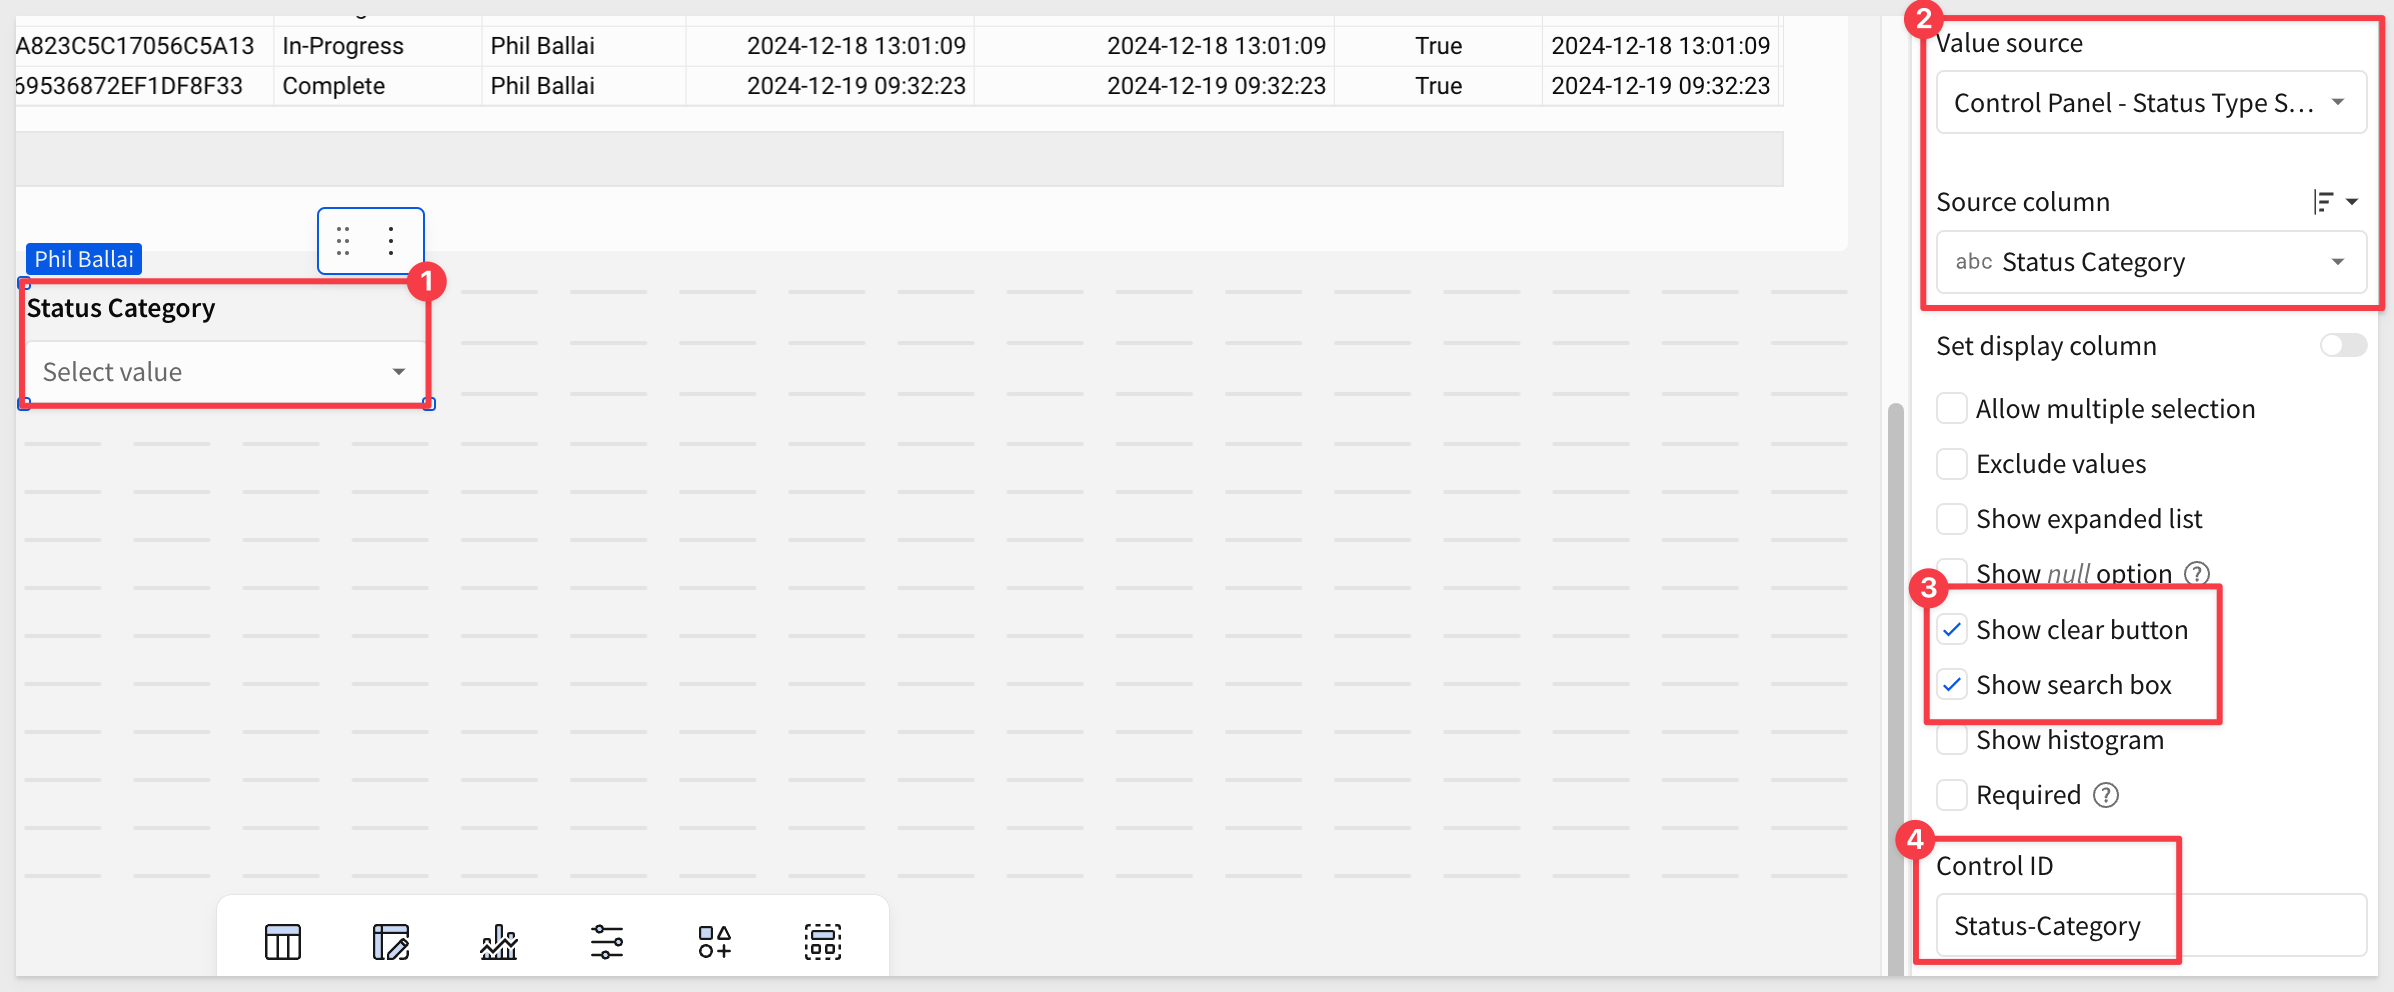
Set the TARGETS to
Step 6:
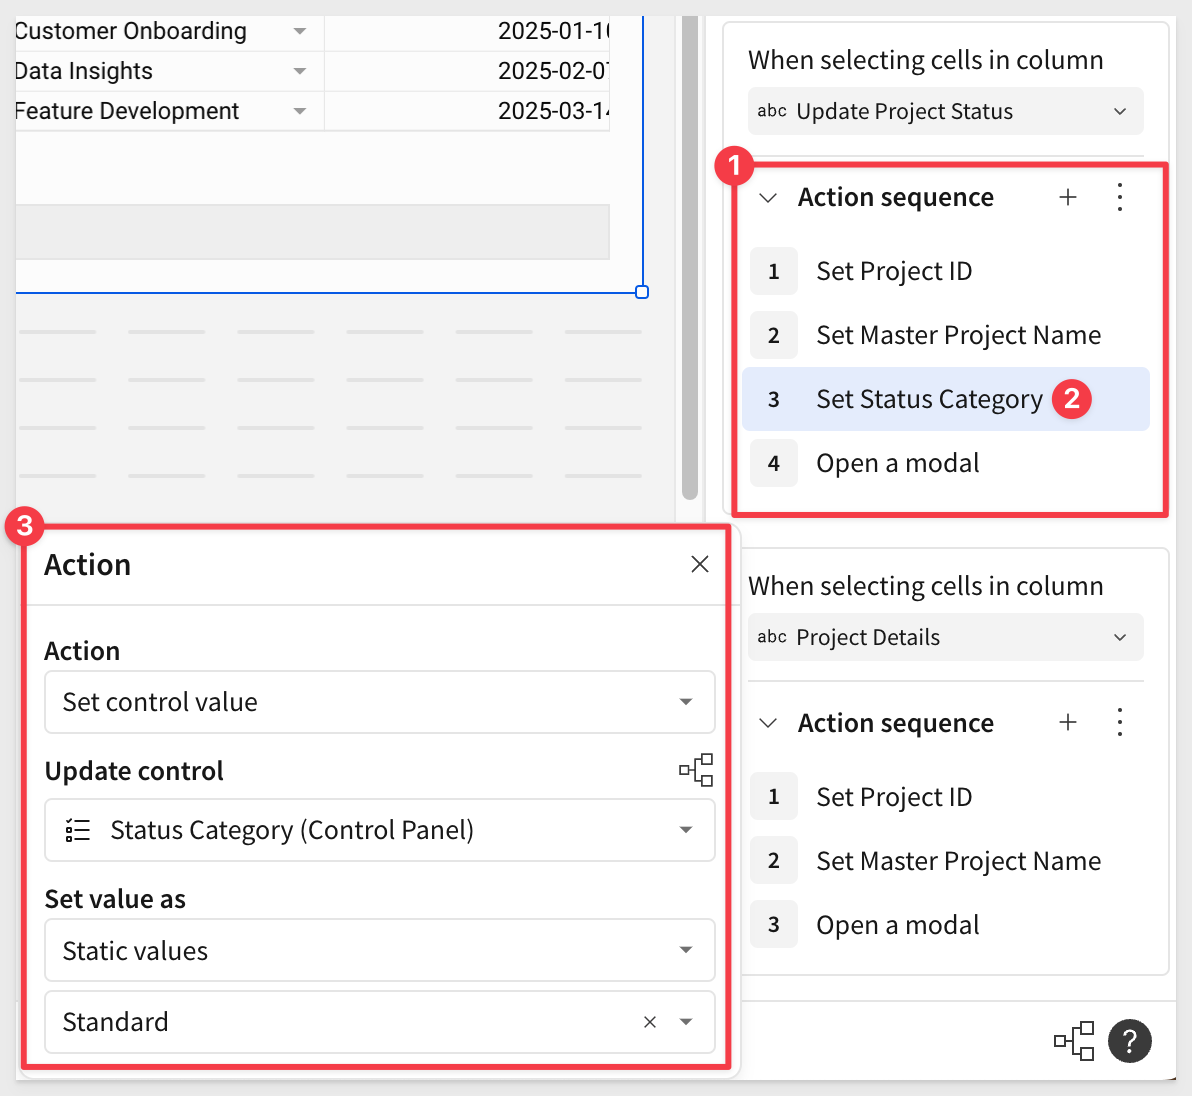
Return to the Project Tracker page and select the Project Tracker Input Table.
In actions, add an action in the third position, it the sequence shown below. Configure to match:
Step 7:
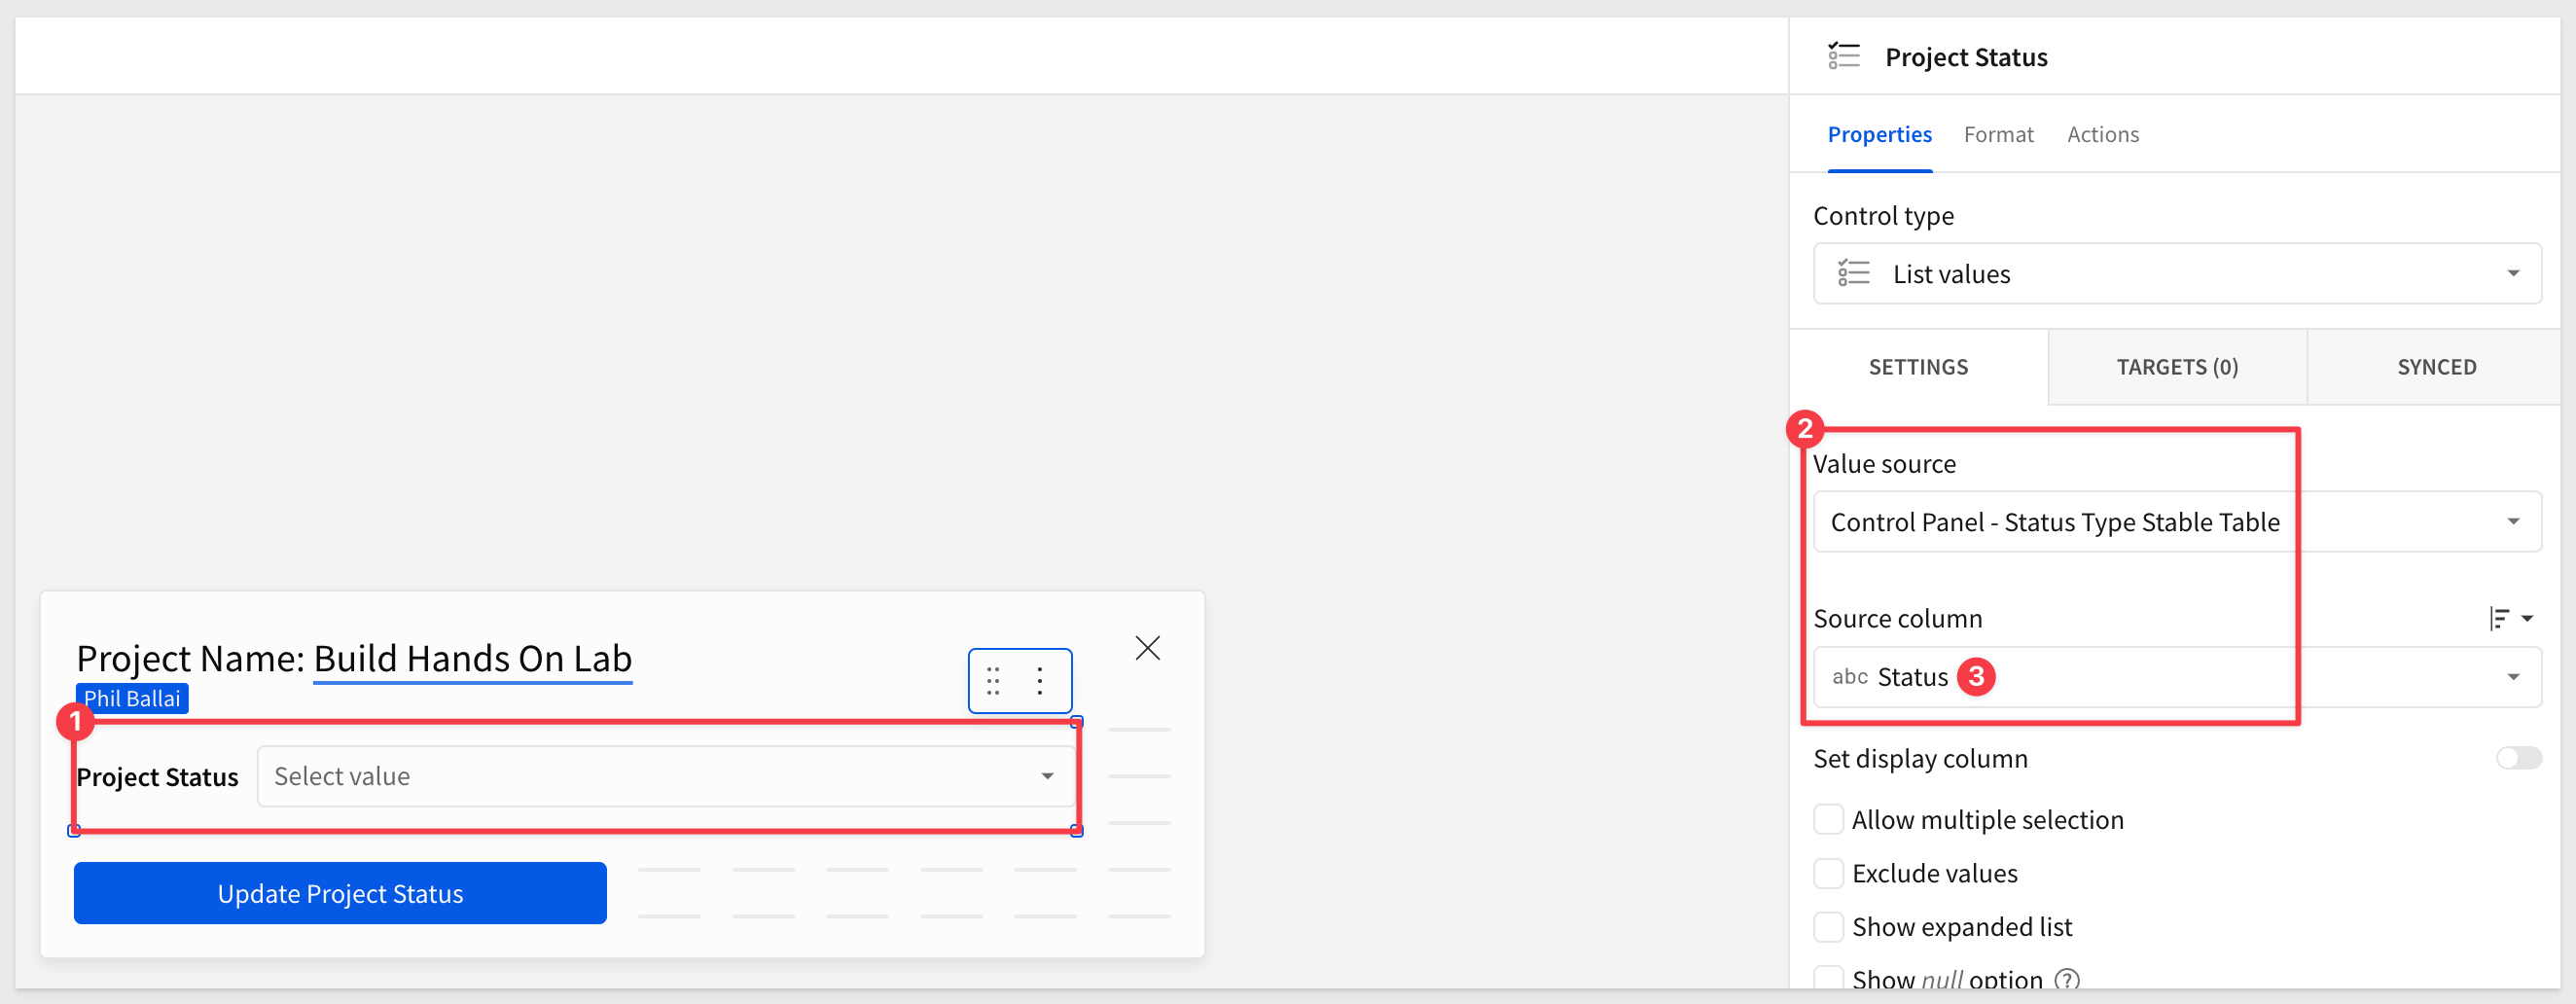
On the Modal - Update Status control titled Project Status.
Switch the Value Source to the Status Type and the column switch to Status on the selected element panel:
Step 8:
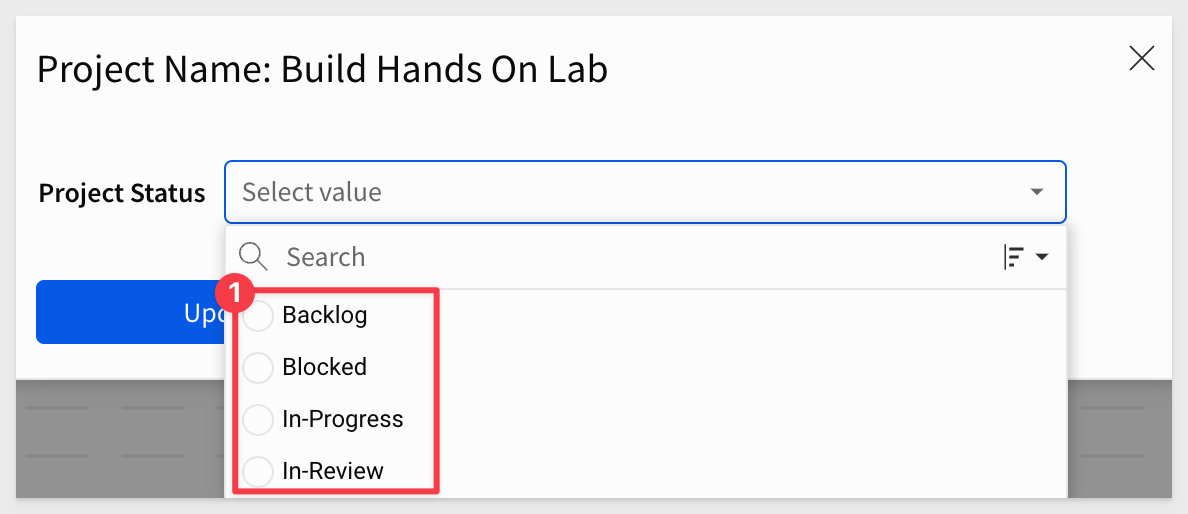
Go back to the Project Tracker page and select theProject Tracker Input Table.
Click a cell with Update Status to test that only 4 options appear on the modal's list control:
Step 9:
On the Project Tracker page, click the Project Reviewer View button in the segmented control.
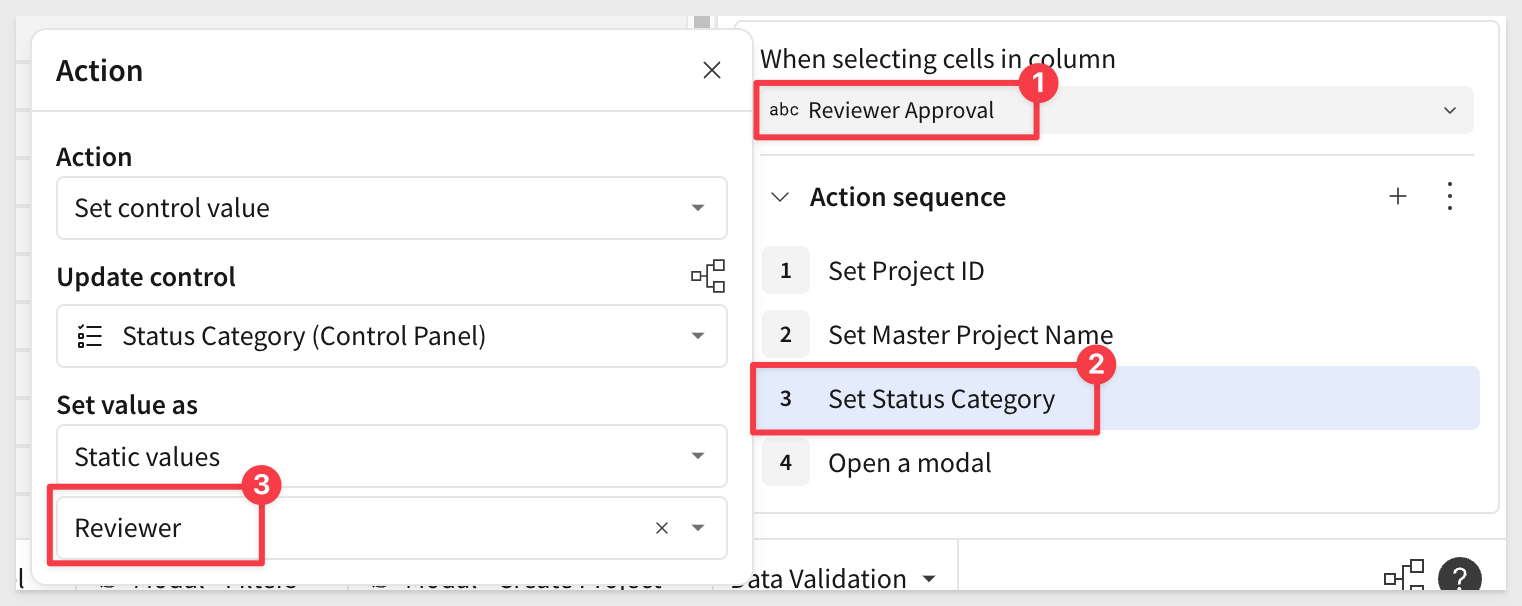
Now select the Project Tracker Input Table > Actions and duplicate the Update Project Status action.
Scroll to the bottom of the actions list to see the duplicate action.
Change the target to Reviewer Approval.
Change Set Status Category to be Reviewer too:
Step 10:
Select Click to Review in any cell and confirm again that the Modal - Update Status only shows the values that corresponding to the category Project Reviewer View.
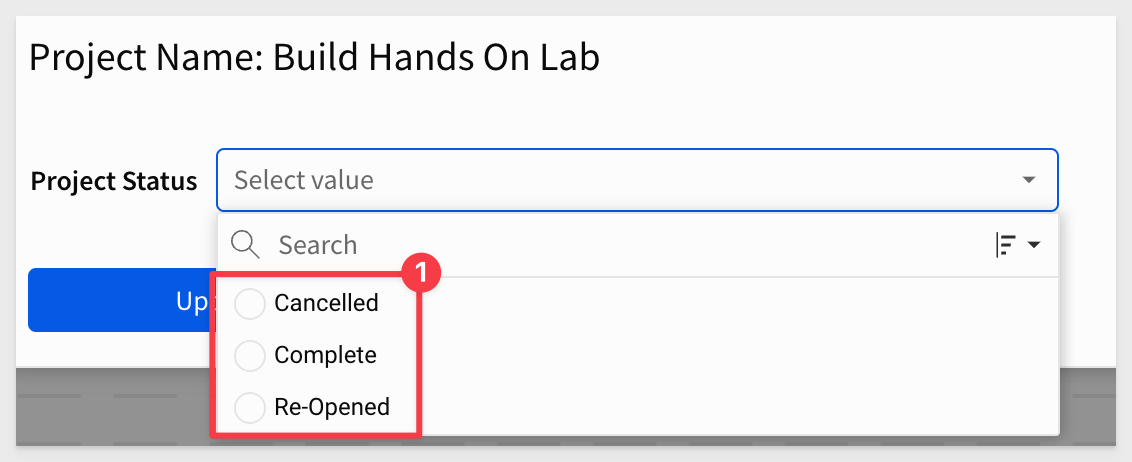
Test the view comparing Project Owner and Project Reviewer Views to test conditional actions and how these scenarios direct access, inputs, and functionality.
Step 11:
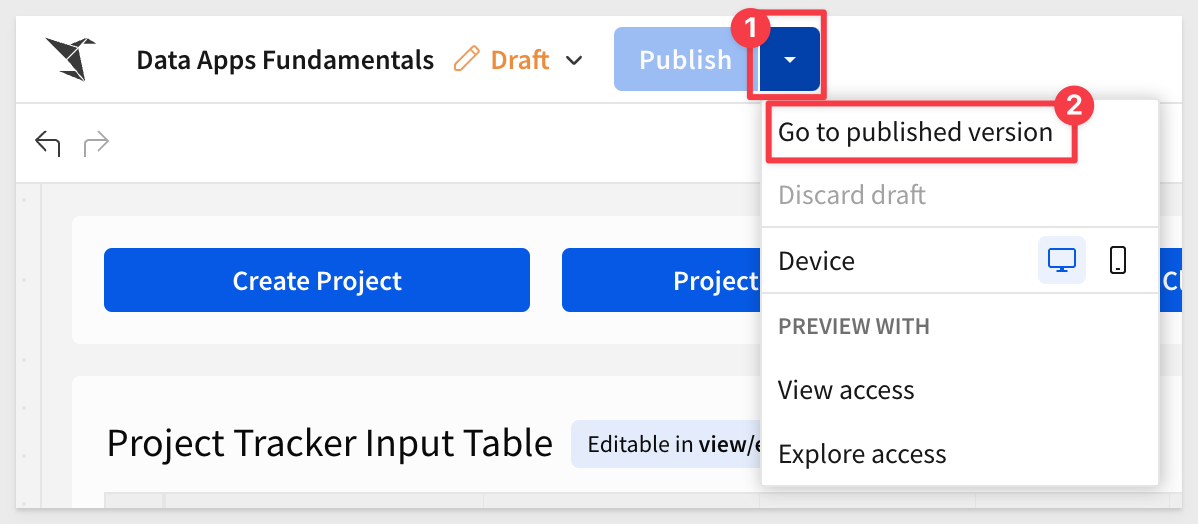
Hide all pages except the Project Tracker page and click Publish.
Switch to the Published version and test the entire data app:
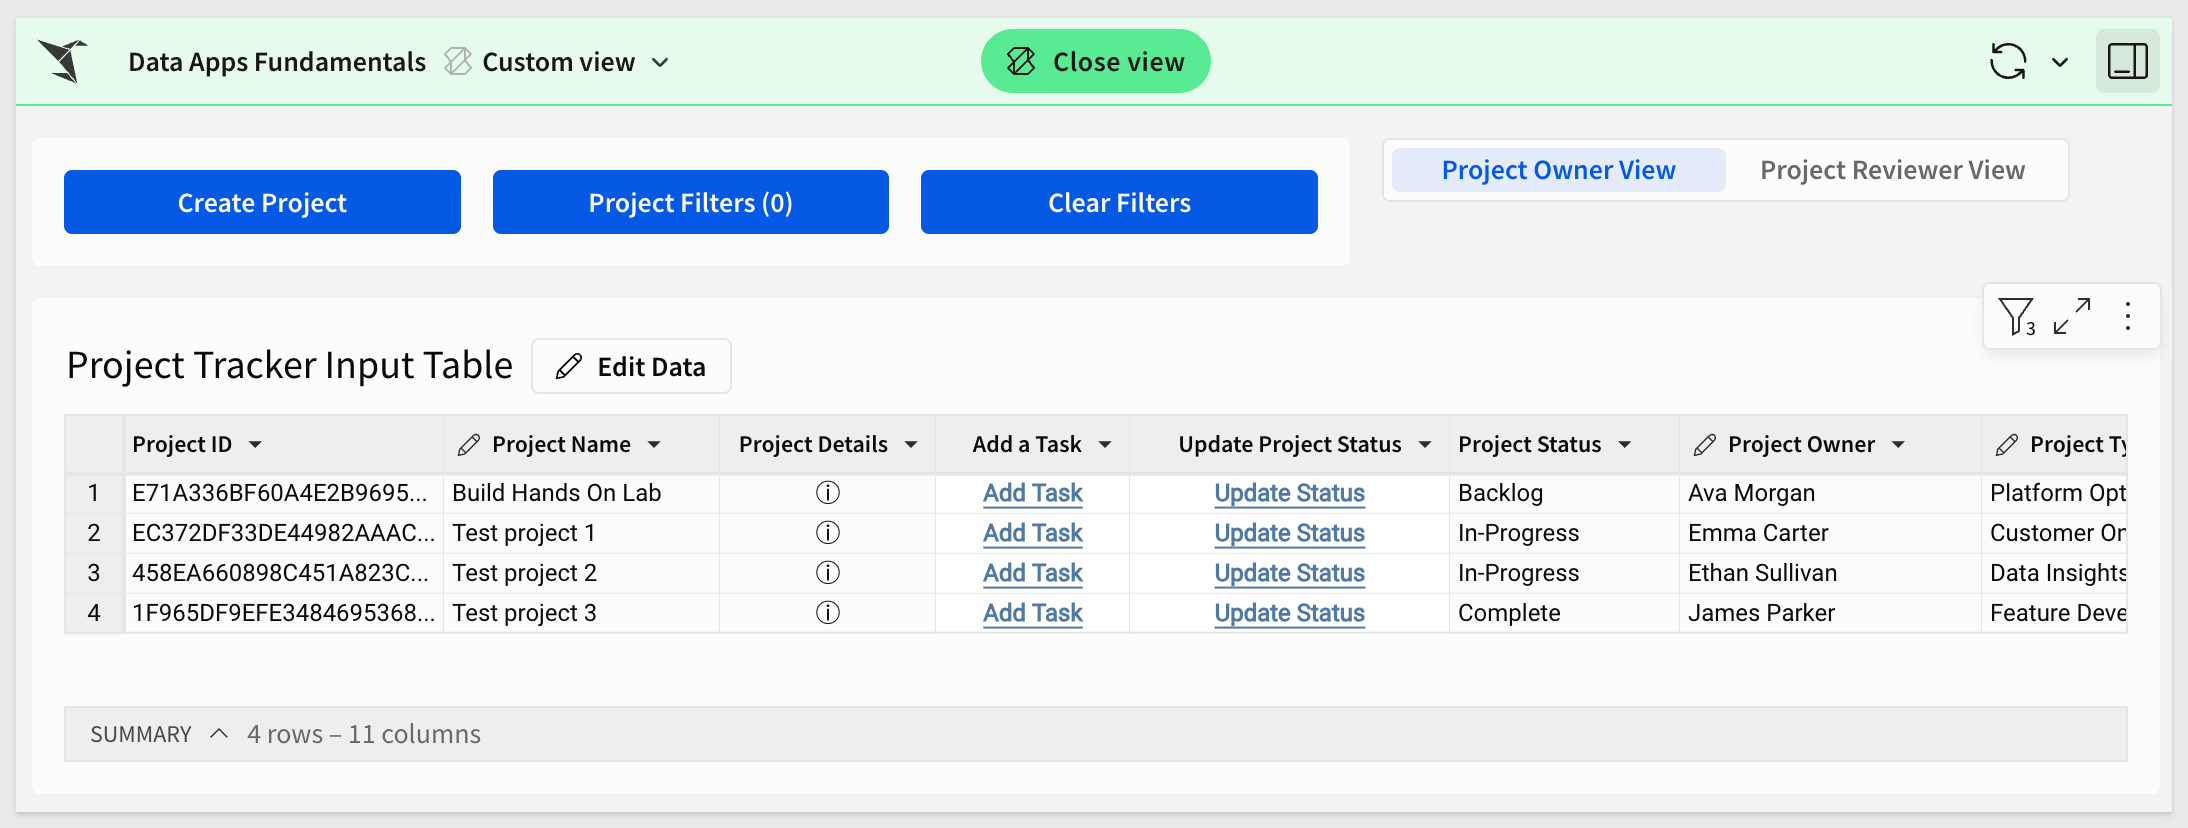
The data app should look like this now:
Step 12: Data Lineage
Sigma Review the data lineage view to review and confirm all connections and lookups.
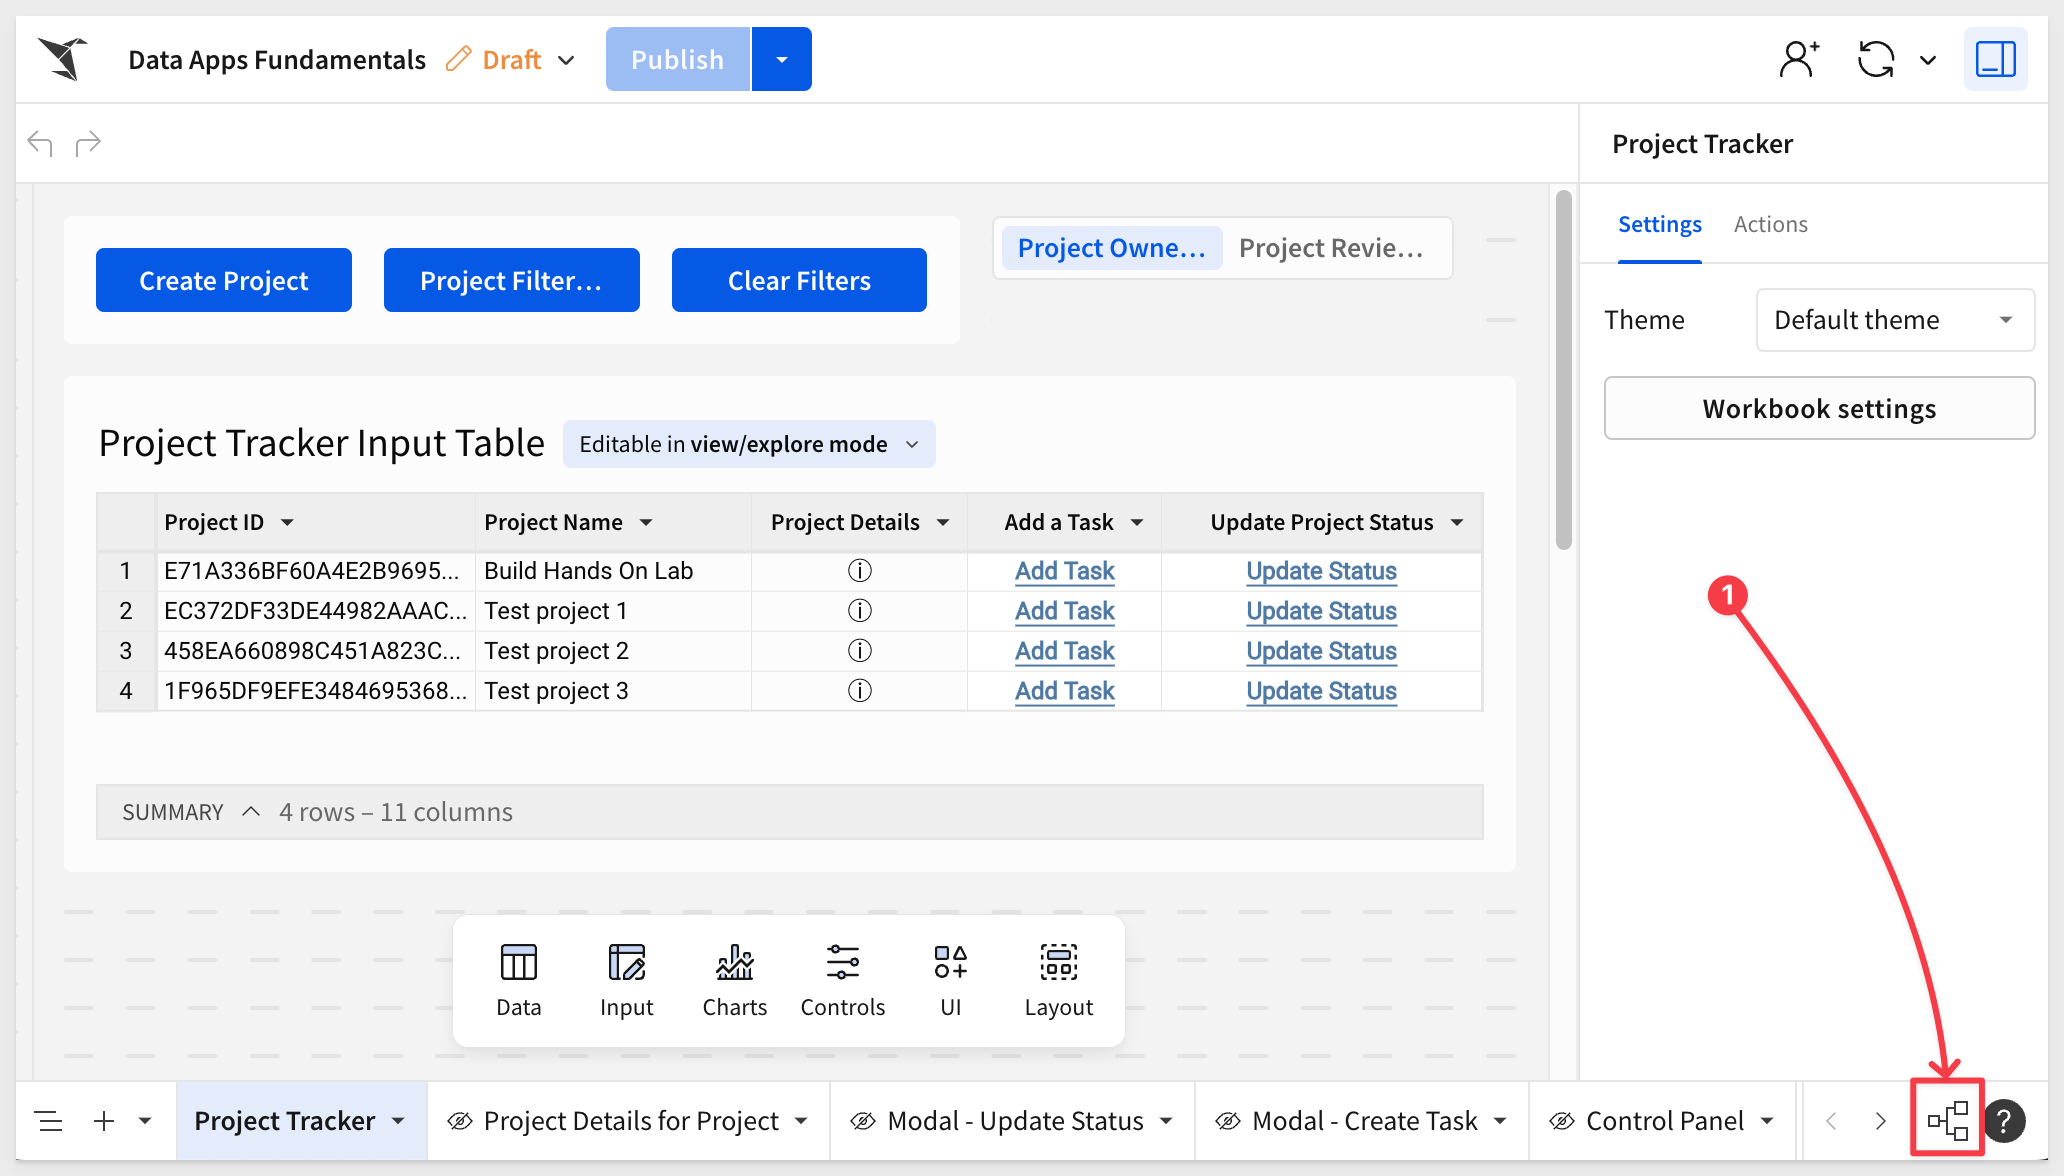
Click the green  button, and then click the
 edit link.
Open the workbook's lineage:
When workbooks become large, working with the lineage is a great way to find what you are after, jump right to the desired element and even see the SQL use to create the data for an element too.
Here is a quick demo:
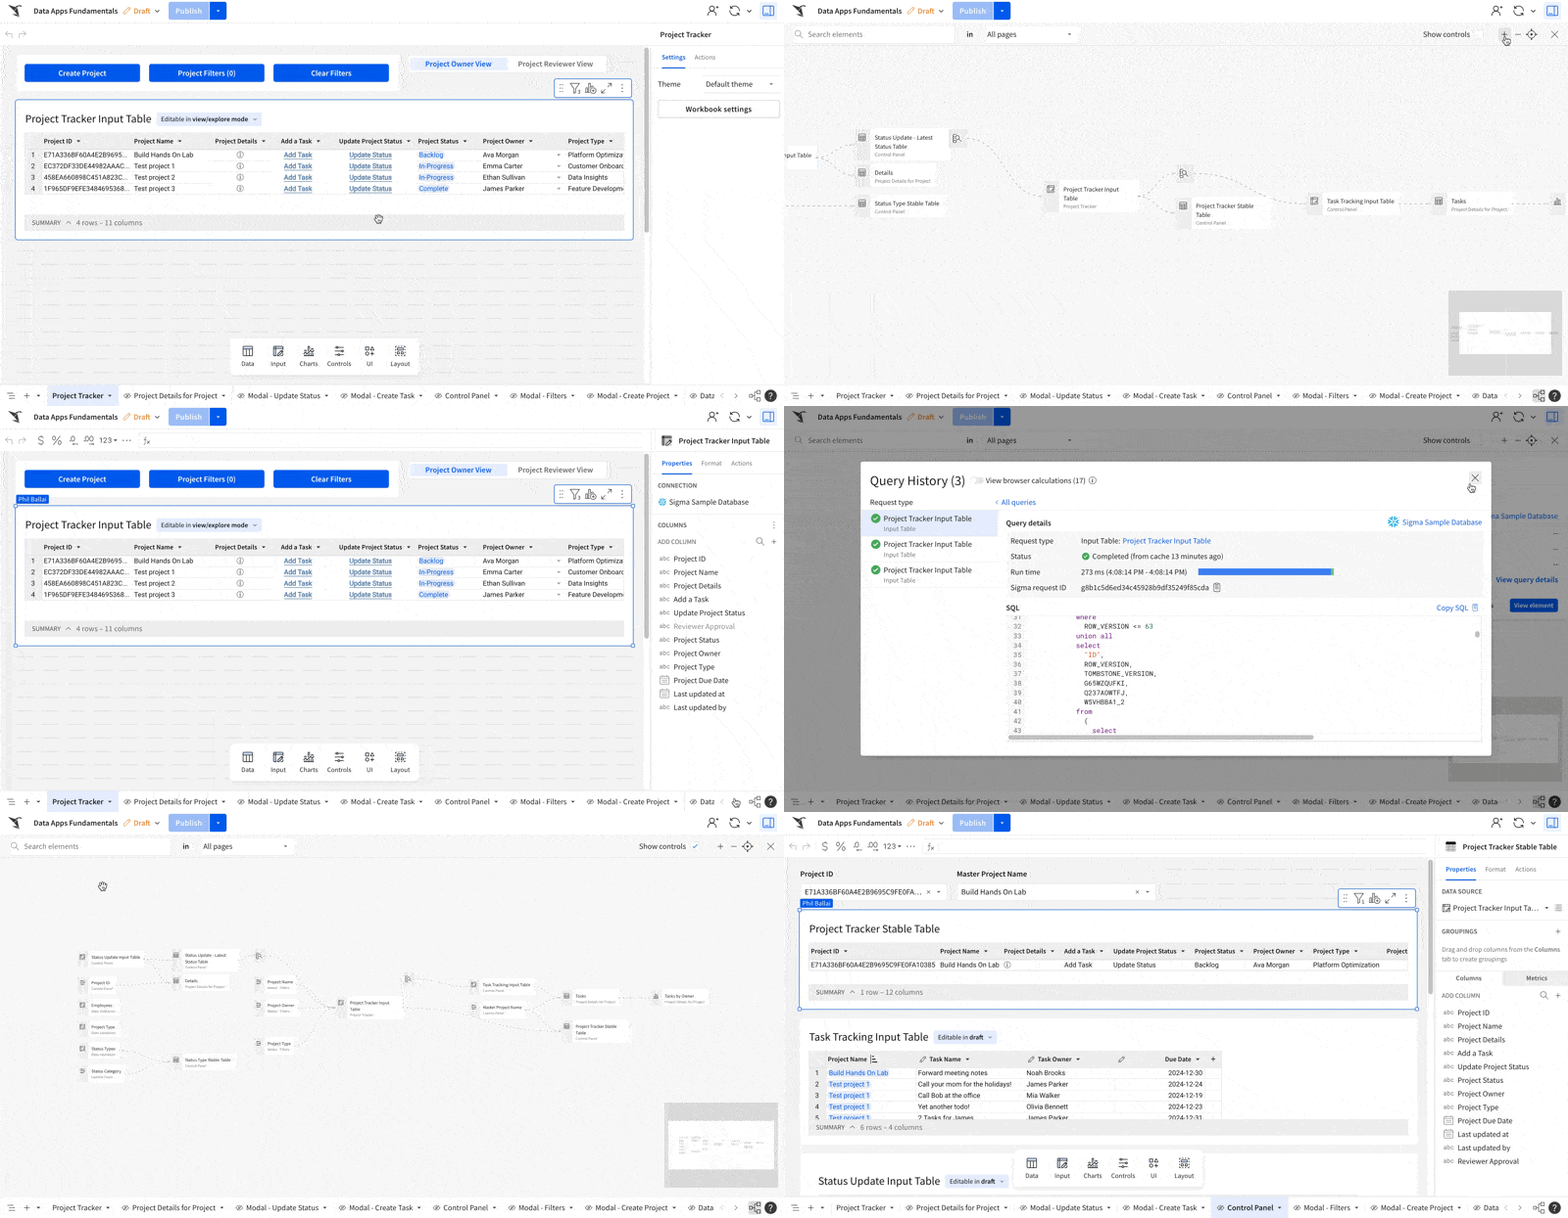
To learn more about workbook data lineage in Sigma see View workbook data lineage

Step 1:
With the bulk of the data app functionality complete, visual design and accessibility is the next step.
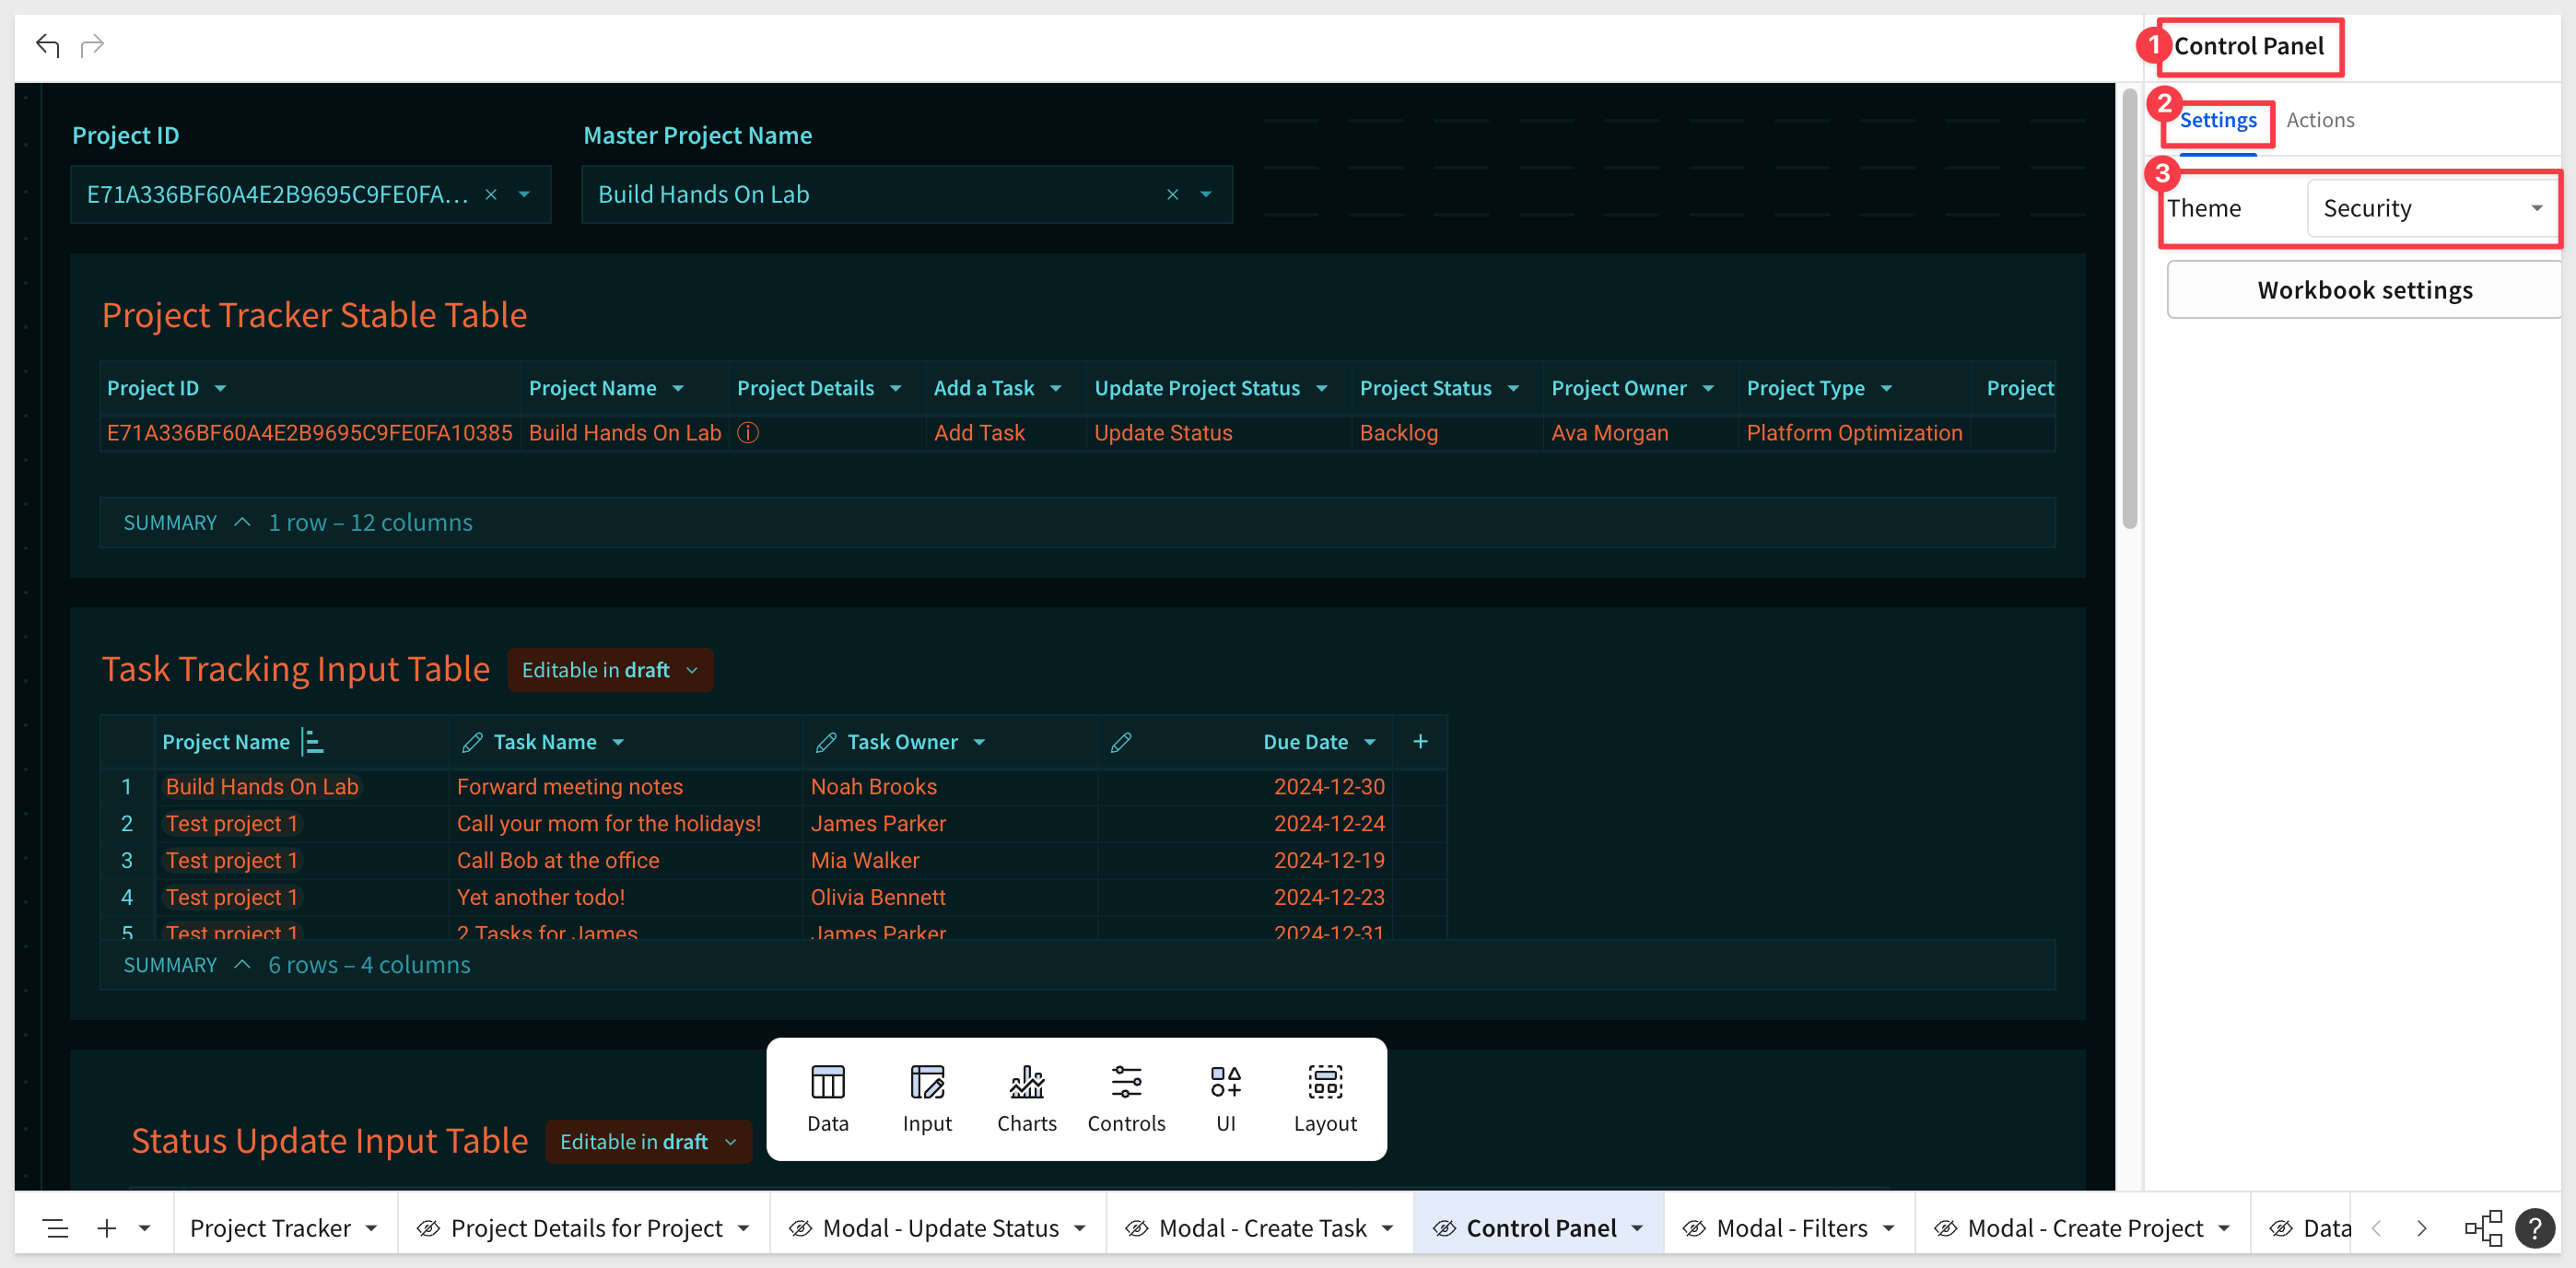
Sigma provide many "out-of-the-box" themes; experiment with them and adjust from there are desired too.
This enables a range of functionality including the ability to toggle between light and dark modes, preset swapping, custom colors that affect elements throughout the workbook (big time saver), fonts, layouts, and additional design settings:
Step 2: Containers - Containers - Containers
It is a good practice to package elements in containers in a manner that will be easy for users to access and understand.
We have also demonstrated the other cool benefit of using containers; they can be targeted by an action!
Step 3:
With Sigma, your AI apps can support whatever branding may be required.
You can customize to match your own branding and style considerations while maintaining accessibility and visual design best practices.
Images and icons can be added for additional personalization:

Here are some example of styled AI apps in Sigma:

In this QuickStart, we built a fully functional project tracking application using Sigma and sample data. Hopefully, this was a smooth and eye-opening process that showed just how easy building AI apps can be with Sigma. Additional resources are provided below.
Additional Resource Links
Blog
Community
Help Center
QuickStarts
Be sure to check out all the latest developments at Sigma's First Friday Feature page!


