This QuickStart is part of a series of QuickStarts designed to instruct new users on how to use the variety of controls Sigma offers.
Control elements (controls) and data elements work hand-in-hand in Sigma.
Data elements display the data (ie: tables or visualizations), and controls manipulate the displayed data by filtering and/or using parameters.
Controls are basically filters, and sometimes the terminology is interchangeable.
The line gets blurred more since controls can also be used as parameters.
To read more about creating flexible reports with parameters, see here.
If you already completed QuickStart fundamentals 1-5, you have already used controls.
In Fundamentals 2 - Working with Tables, we created a filter directly from a table column (Store Region), and converted that filter into a page control. This control is an example of a List control.
In Fundamentals 4: Working with Pivot Tables v2, we used a Segmented control to present a different filtering experience.
Selecting the correct control is often more art than science, as there many controls to choose from.
In general, if using the control is obvious to the user, requires the minimum number of clicks, and produces the desired results, it is a good choice.
Since we have already used a few controls, we will focus on areas of interest that have not been covered, but are important to understand as you build in Sigma.
We will be working with some common sales data from our fictitious company Plugs Electronics, reusing content we created in the QuickStart Fundamentals 1: Getting Around.
For more information on Sigma's product release strategy, see Sigma product releases.
Target Audience
Sigma combines the unlimited power of the cloud data warehouse with the familiar feel of a spreadsheet, with no limit on the amount of data you wish to analyze. Sigma is awesome for users of Excel and even better for customers who have millions of rows of data.
The typical audience for this QuickStart includes users of Excel, common Business Intelligence or Reporting tools, and semi-technical users who want to try out or learn Sigma. Everything is done in a browser, so you already know how to use that. No SQL or technical skills are needed to do this QuickStart.
Prerequisites
- A computer with a current browser. It does not matter which browser you want to use.
- Completion of the QuickStart "Fundamentals 1: Getting Around"
- Access to your Sigma environment. A Sigma trial environment is acceptable and preferred.
- If have not already, you can sign up for a Sigma Trial here:

Open the Fundamentals workbook created in earlier fundamentals QuickStarts.
Add a new page and rename it to Controls.
Add a child table to the page, based on the PLUGS_DATA table on the DATA page. We can do this in just a few mouse clicks; how slick is that!
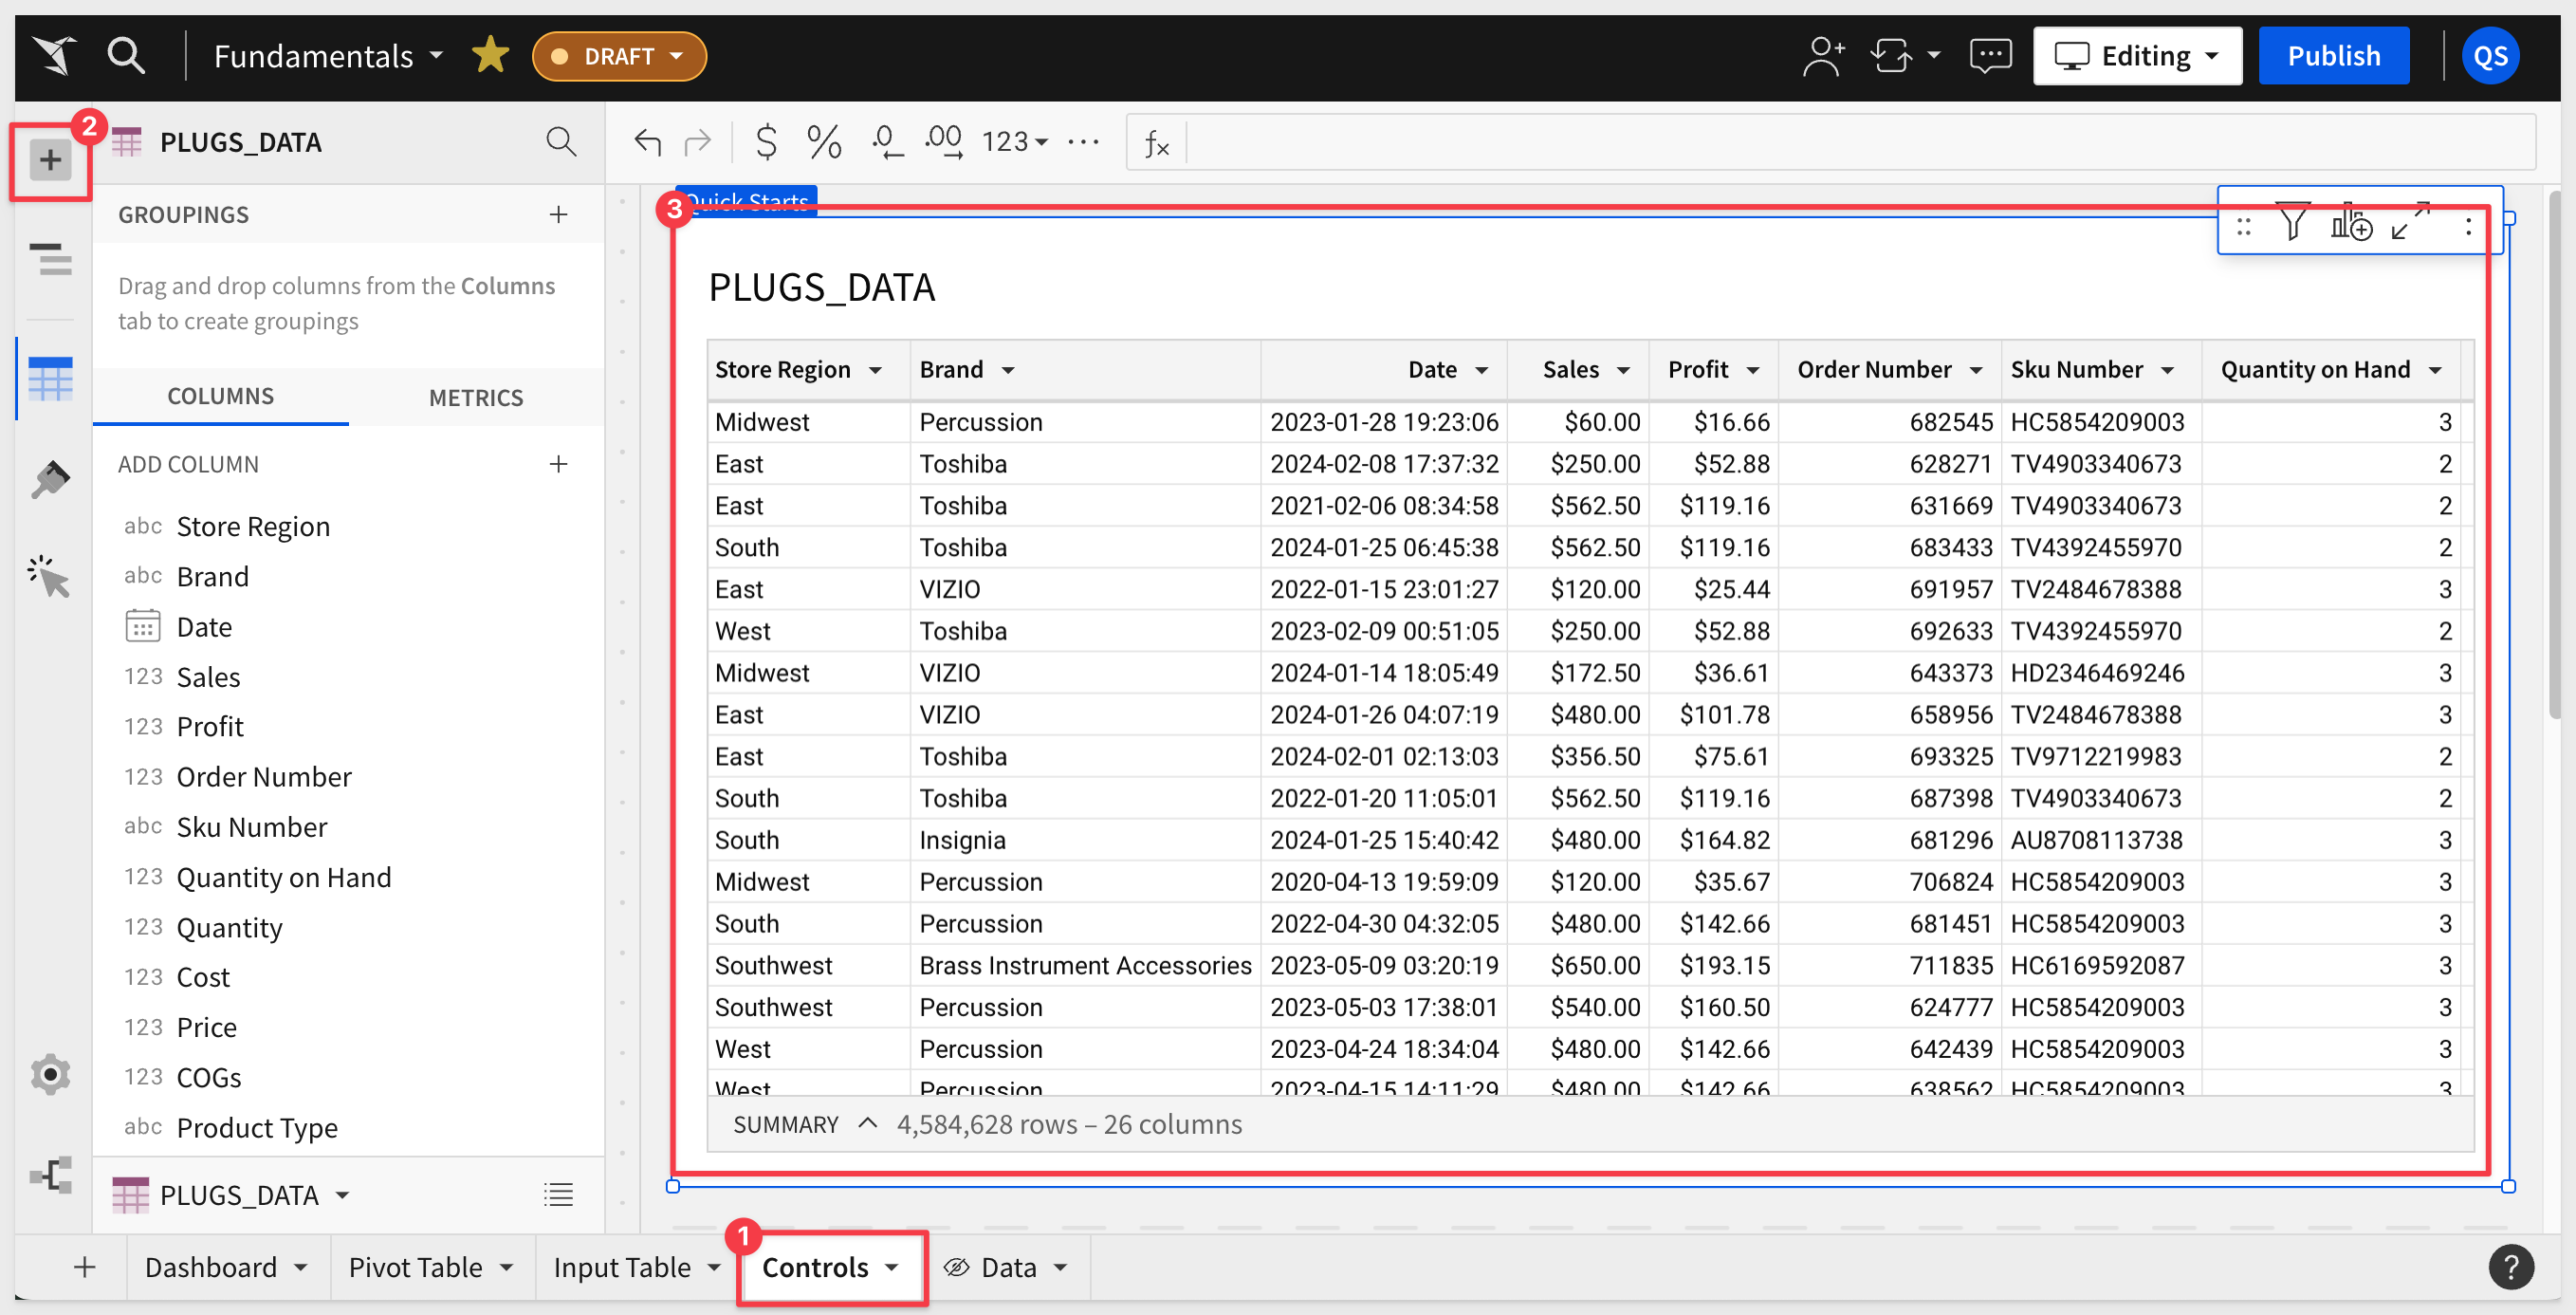
Clicking the + icon in the element panel, we can see that there are several different controls available:
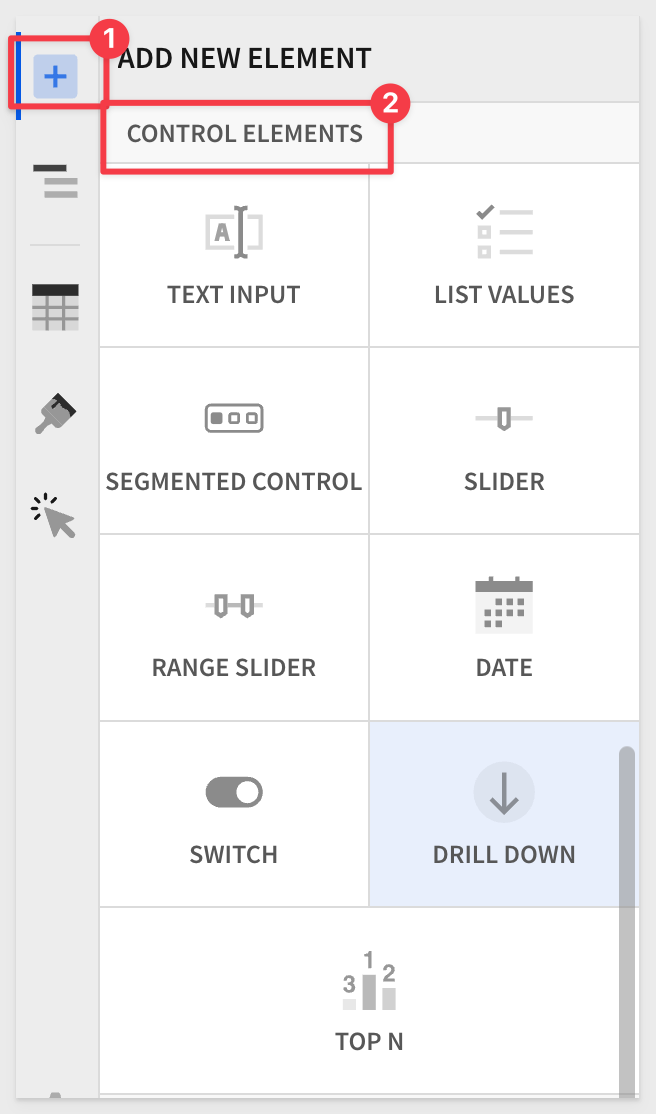
- Text Input: Provides a free-form, search-like field for users to type values into manually.
- List Values: Provides a fixed or data-driven menu of values from which users can select.
- Segmented Control: Allows users to choose from a small set of predefined, mutually exclusive options, displayed as buttons.
- Slider: Enables users to select a single value from a continuous range by sliding a handle along a track.
- Range Slider: Allows users to select a range of values by moving two handles along a track to set the minimum and maximum.
- Date: Provides a calendar interface or date picker for users to select a specific date.
- Switch: Allows the user to switch between True and False values.
- Drill Down: Allows the user to view pre-defined layers of data.
- Top N: Useful to see the top values in a sorted list, instead of the whole list.
For the controls we haven't used yet, we will provide examples. Don't feel pressured to build each one; simply following along is perfectly fine.
Use this QuickStart as a guide for the controls that interest you, and refer to the others as needed in the future.
The process for adding the control to the canvas is the same, regardless which control is selected, so we will skip that part and just show what each configured control looks like.
The slider control enables users to select a single value from a continuous range by sliding a handle along a track.
Lets say we want to see who are big spenders are, by filtering Sales to display high values.
First, it would be nice to know the min and max values in our 4.5M row table.
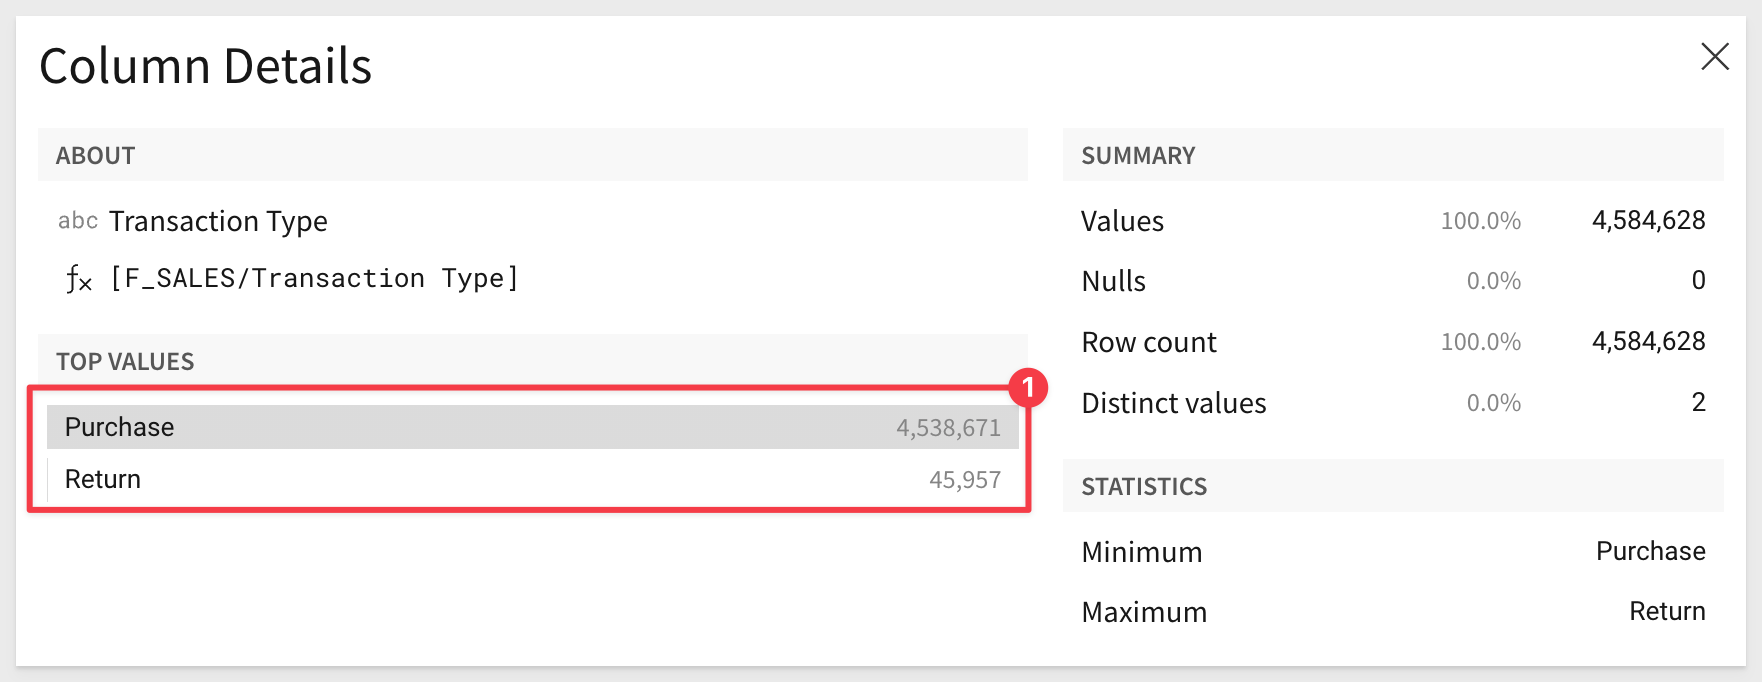
Open the Sales columns menu and select Column details to see:
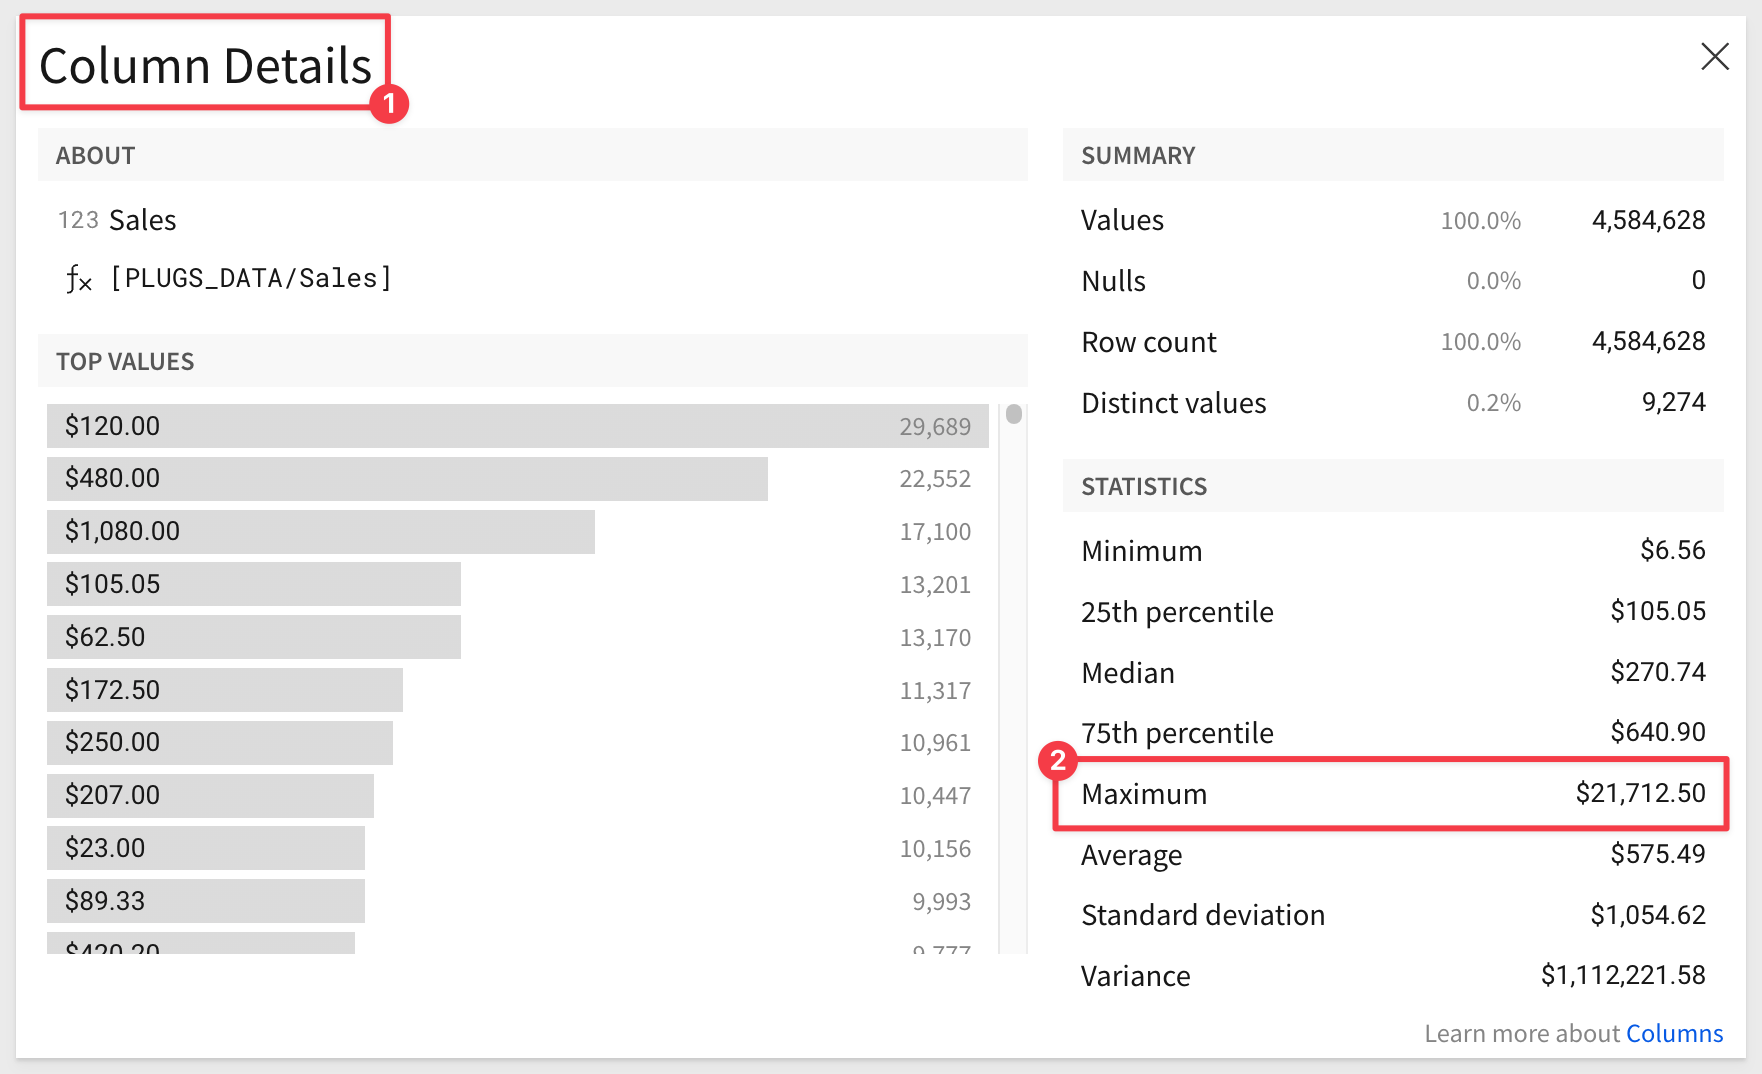
Now we can see we need to set the maximum value for Sales higher than $21,712.50.
Lets use 30,000 to be safe.
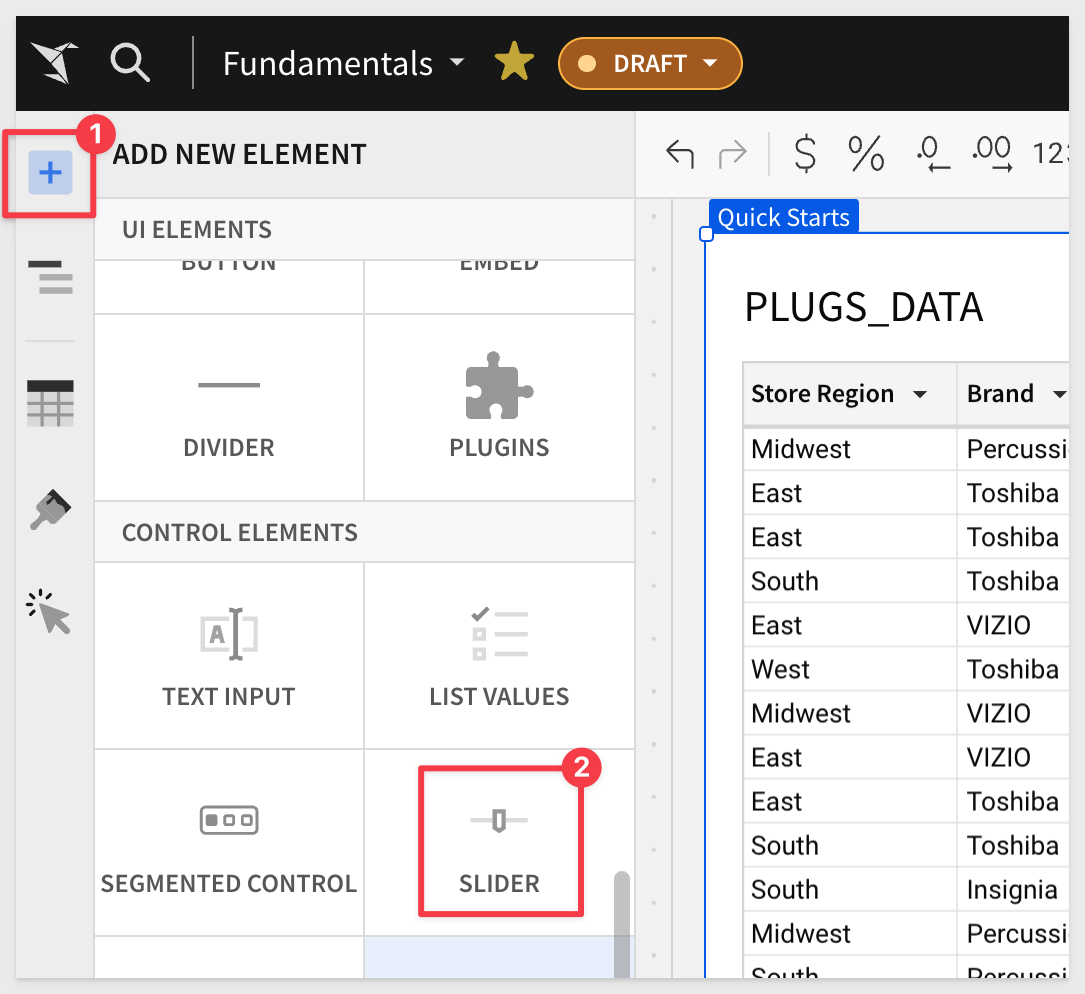
Add a new Slider control to the page:
Configure the control as:
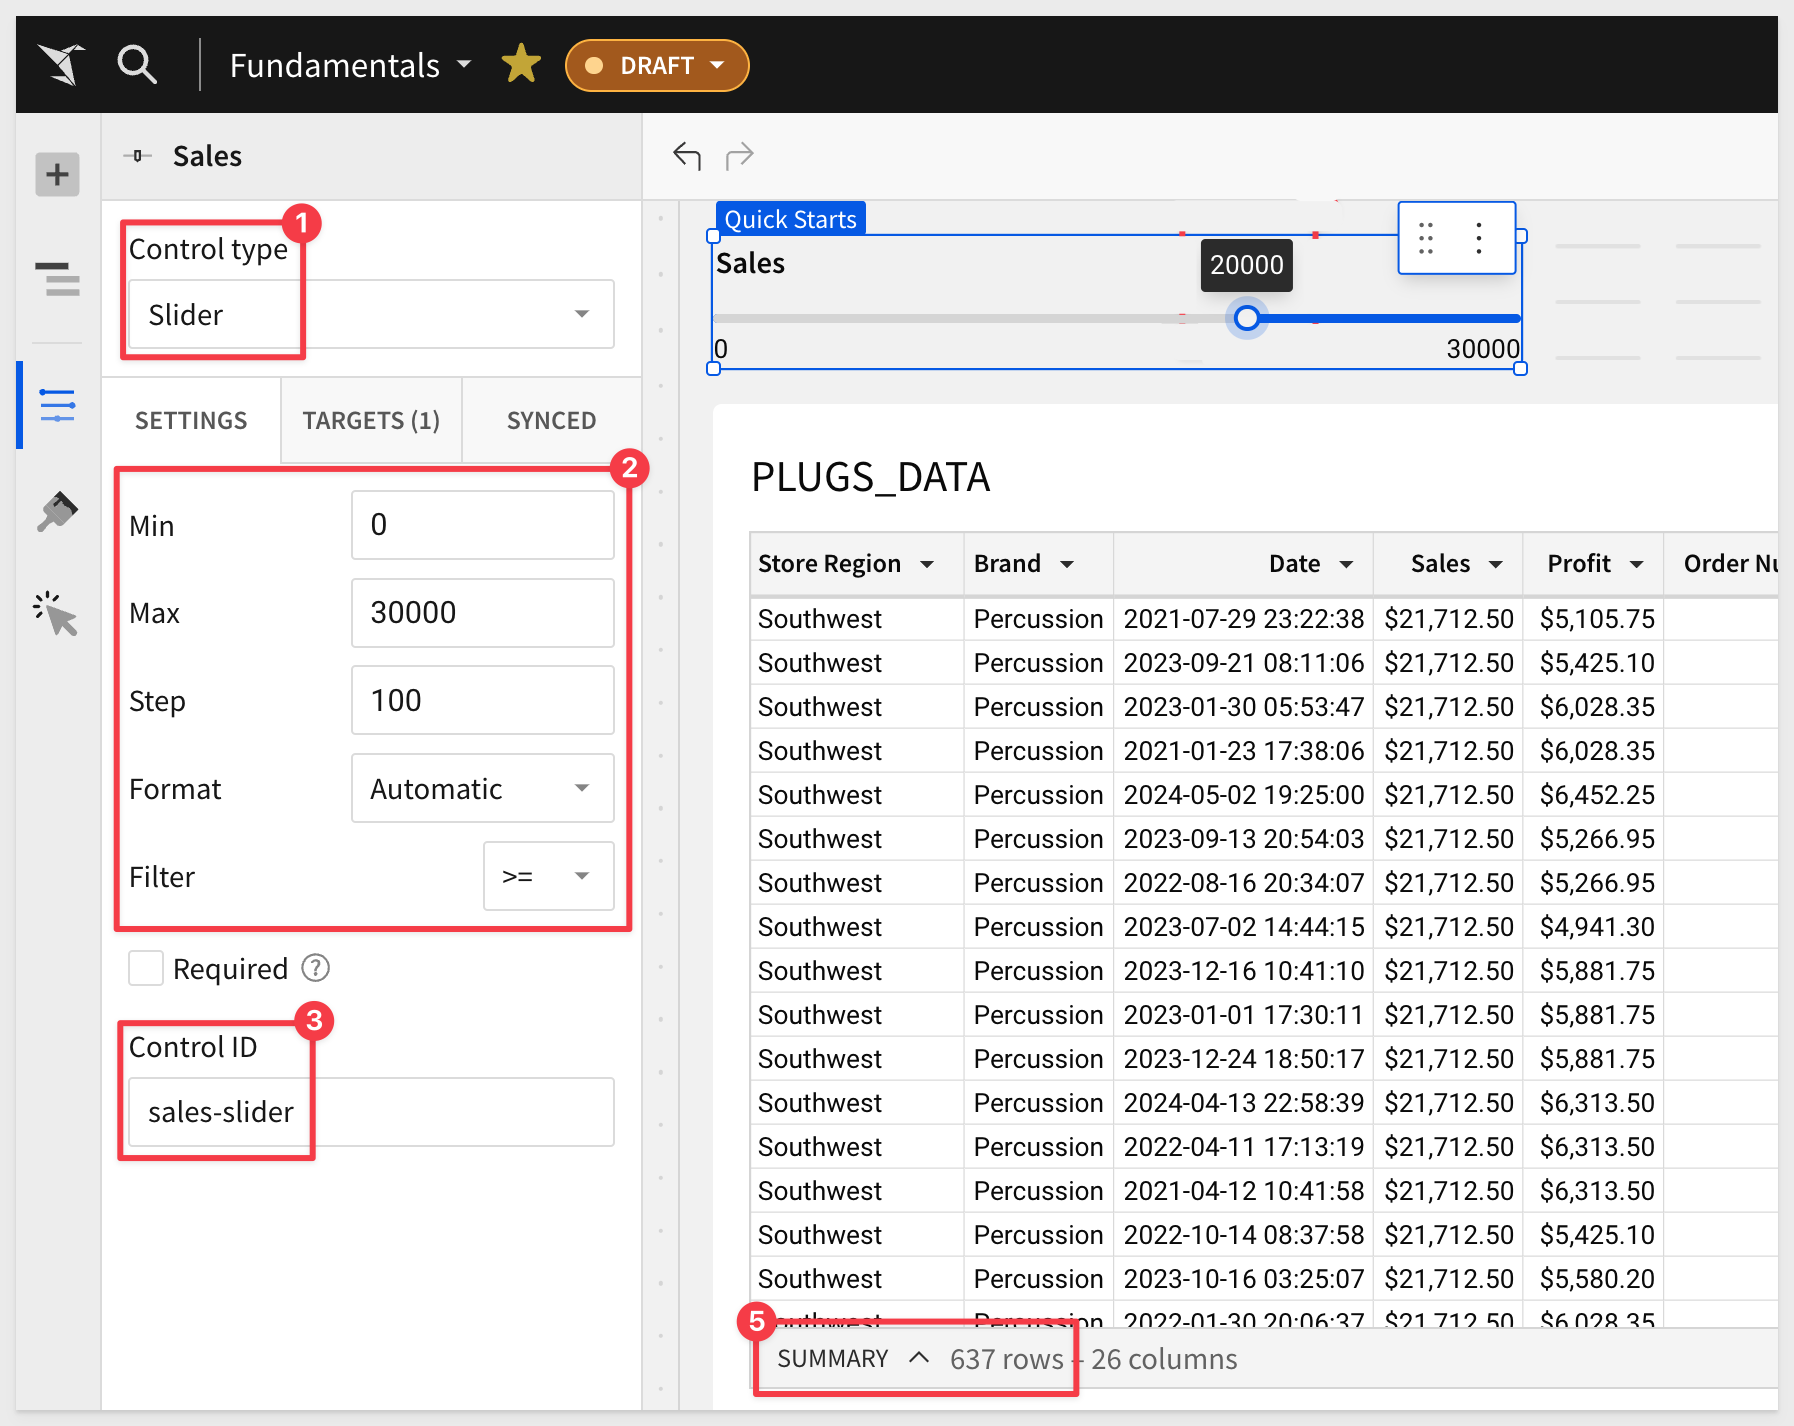
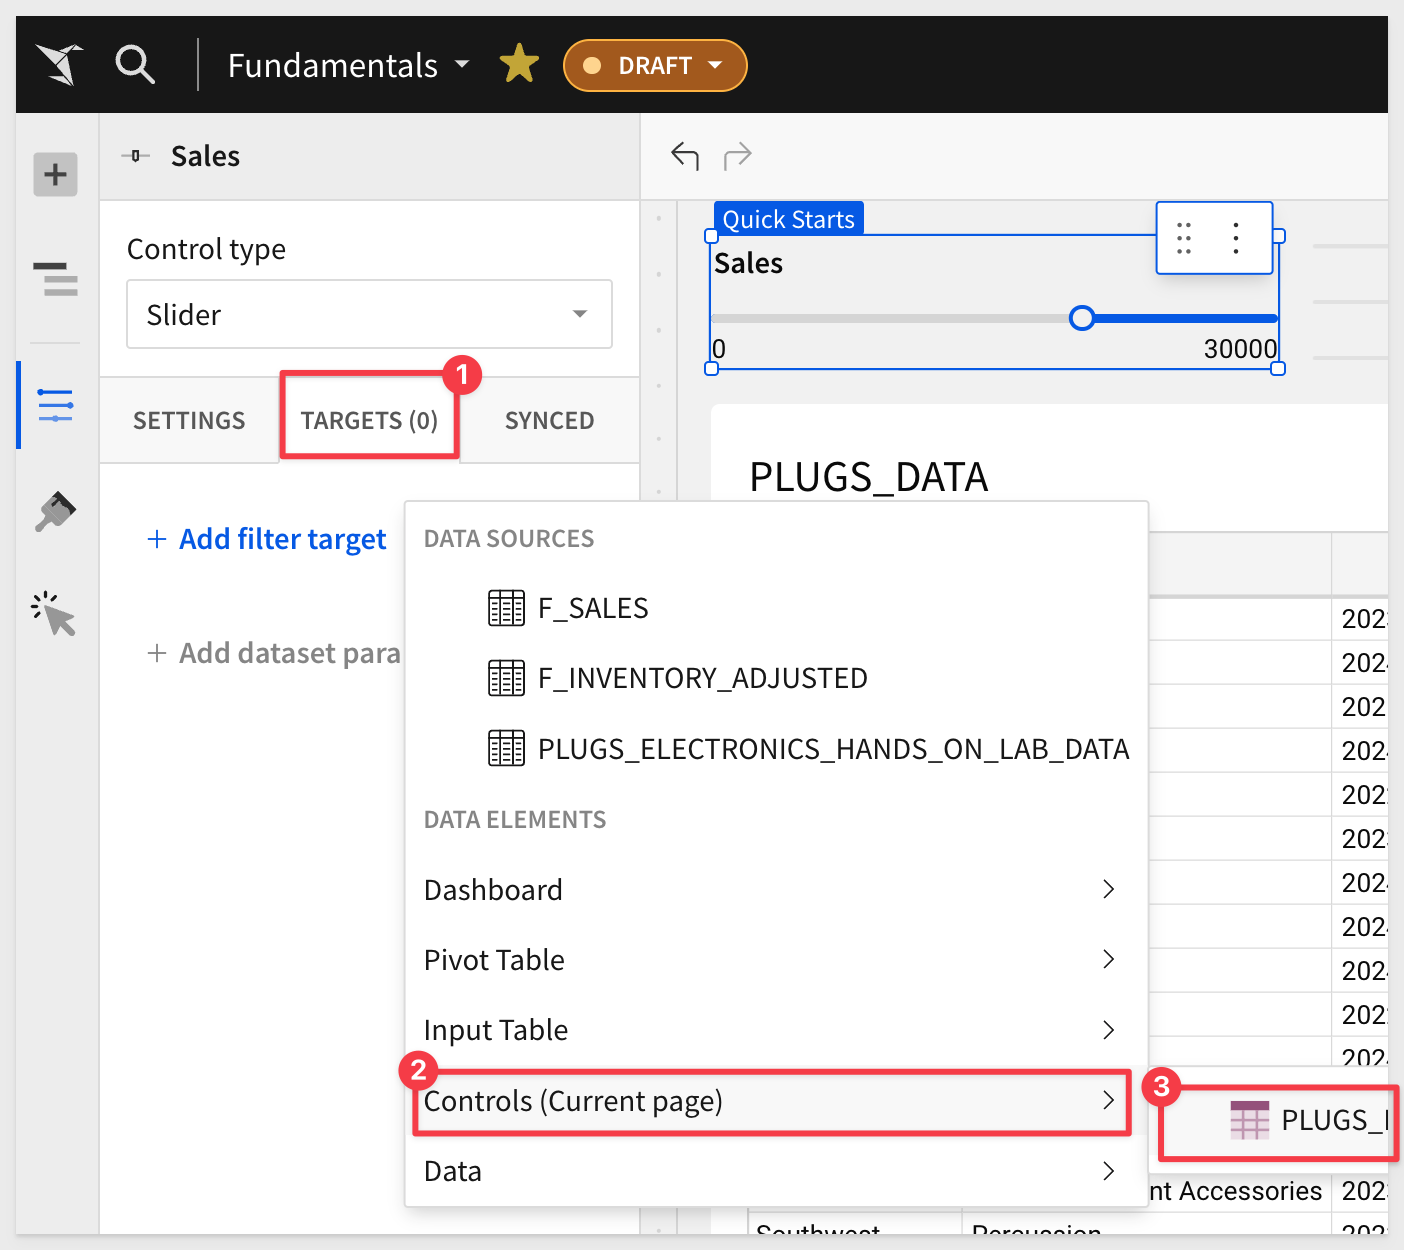
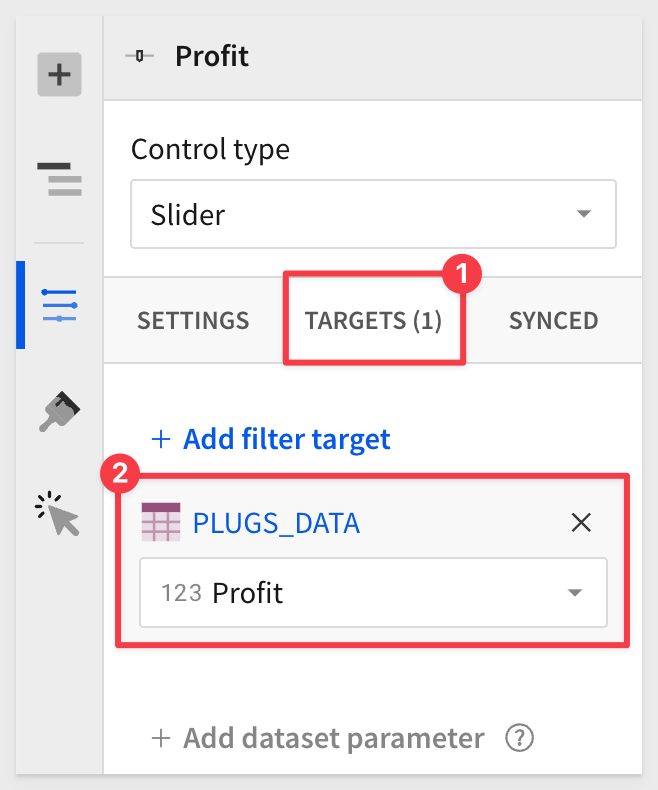
Set the Target of the control to Controls > PLUGS_DATA:
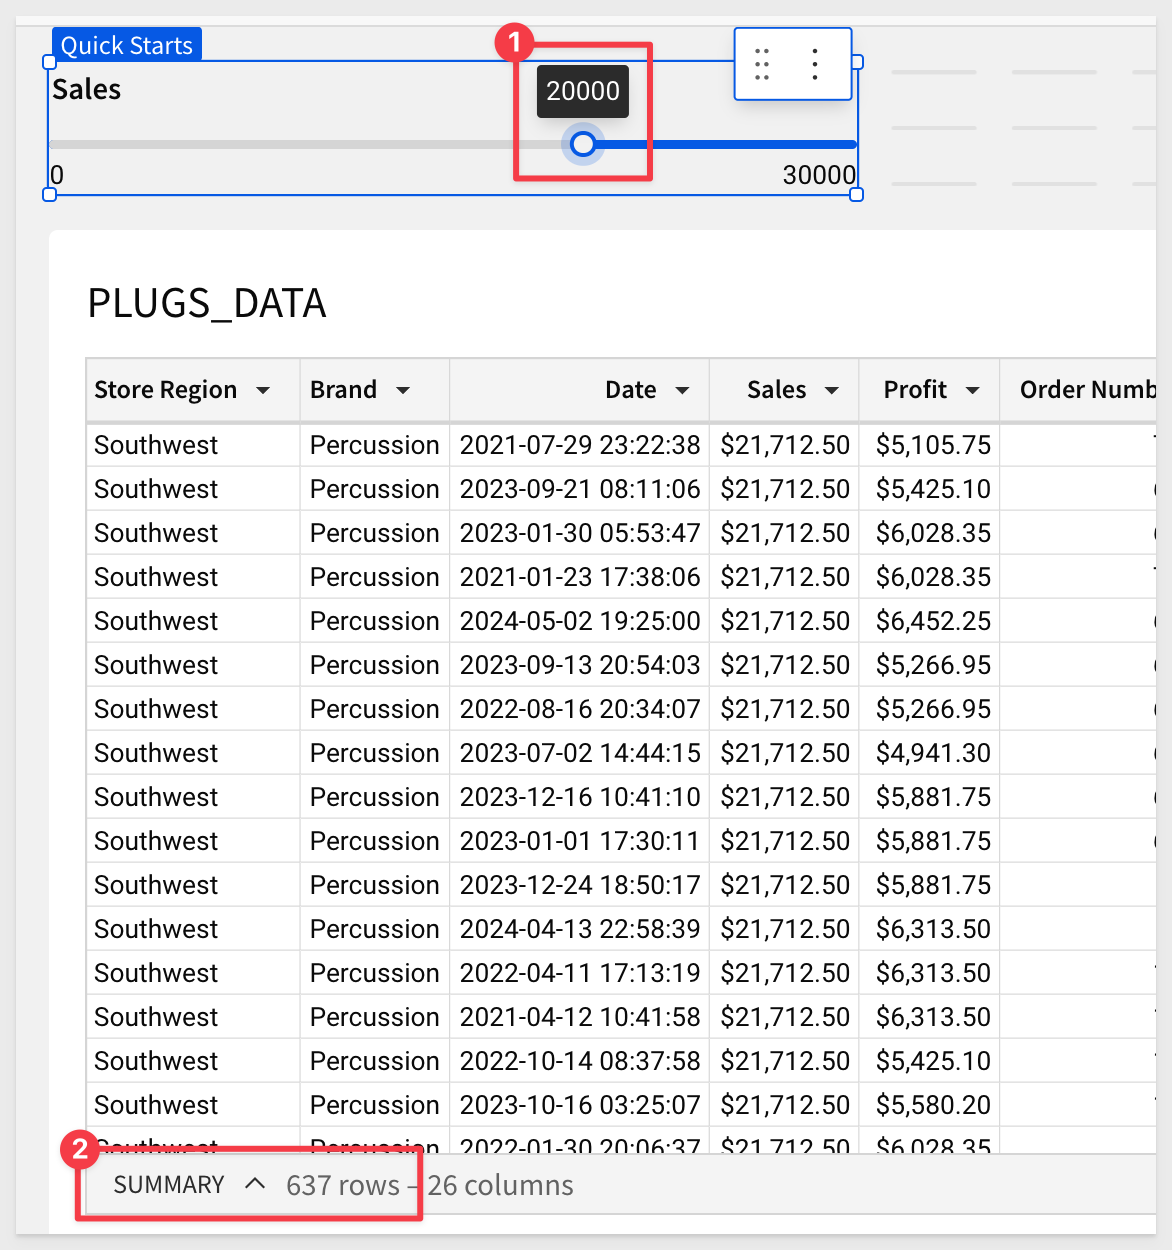
Slide the control to around 20k. These customers might make a good list for a marketing campaign:
However, big spend does not always mean big profit. We should evaluate for both to refine our marketing target list.
Duplicate controls
Sigma makes it really simple to add copies of existing controls, saving you time
Lets say we want to also get all the rows sold at high margin, amongst the list of "big spenders".
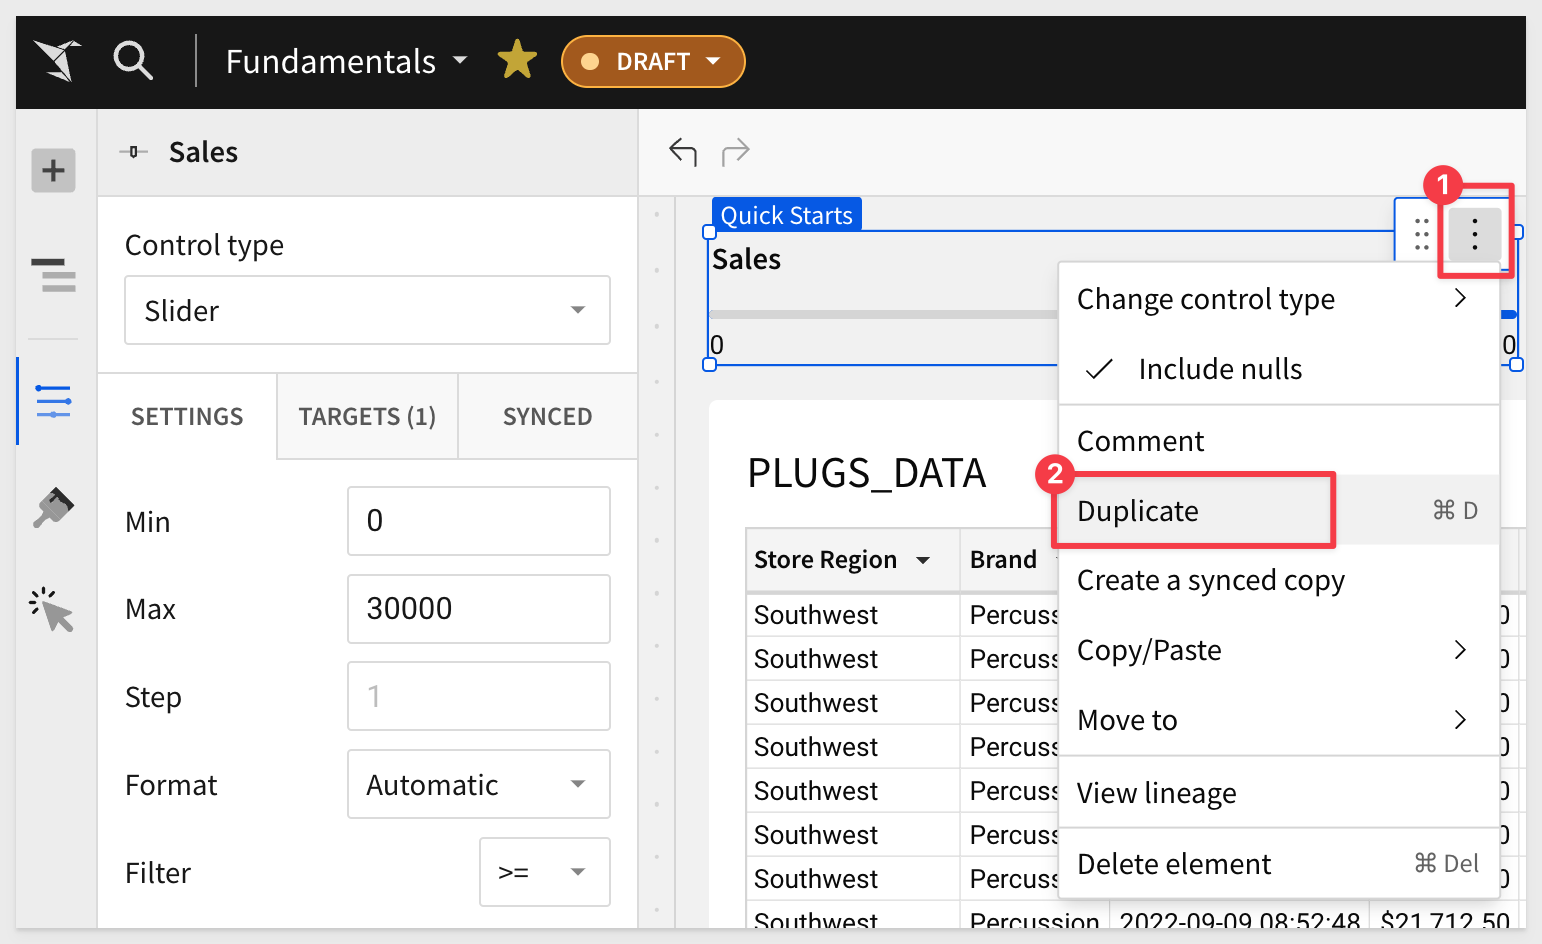
Open the slider control's menu and click Duplicate:
We use the slider to allow the user to quickly return all the orders with a profit greater than (or equal to) the maximum value configured:
Drag the control to be side-by-side with the Sales control.
Modify the target for the new control targets the PLUGS_DATA table > Profit column and rename the control to Profit:
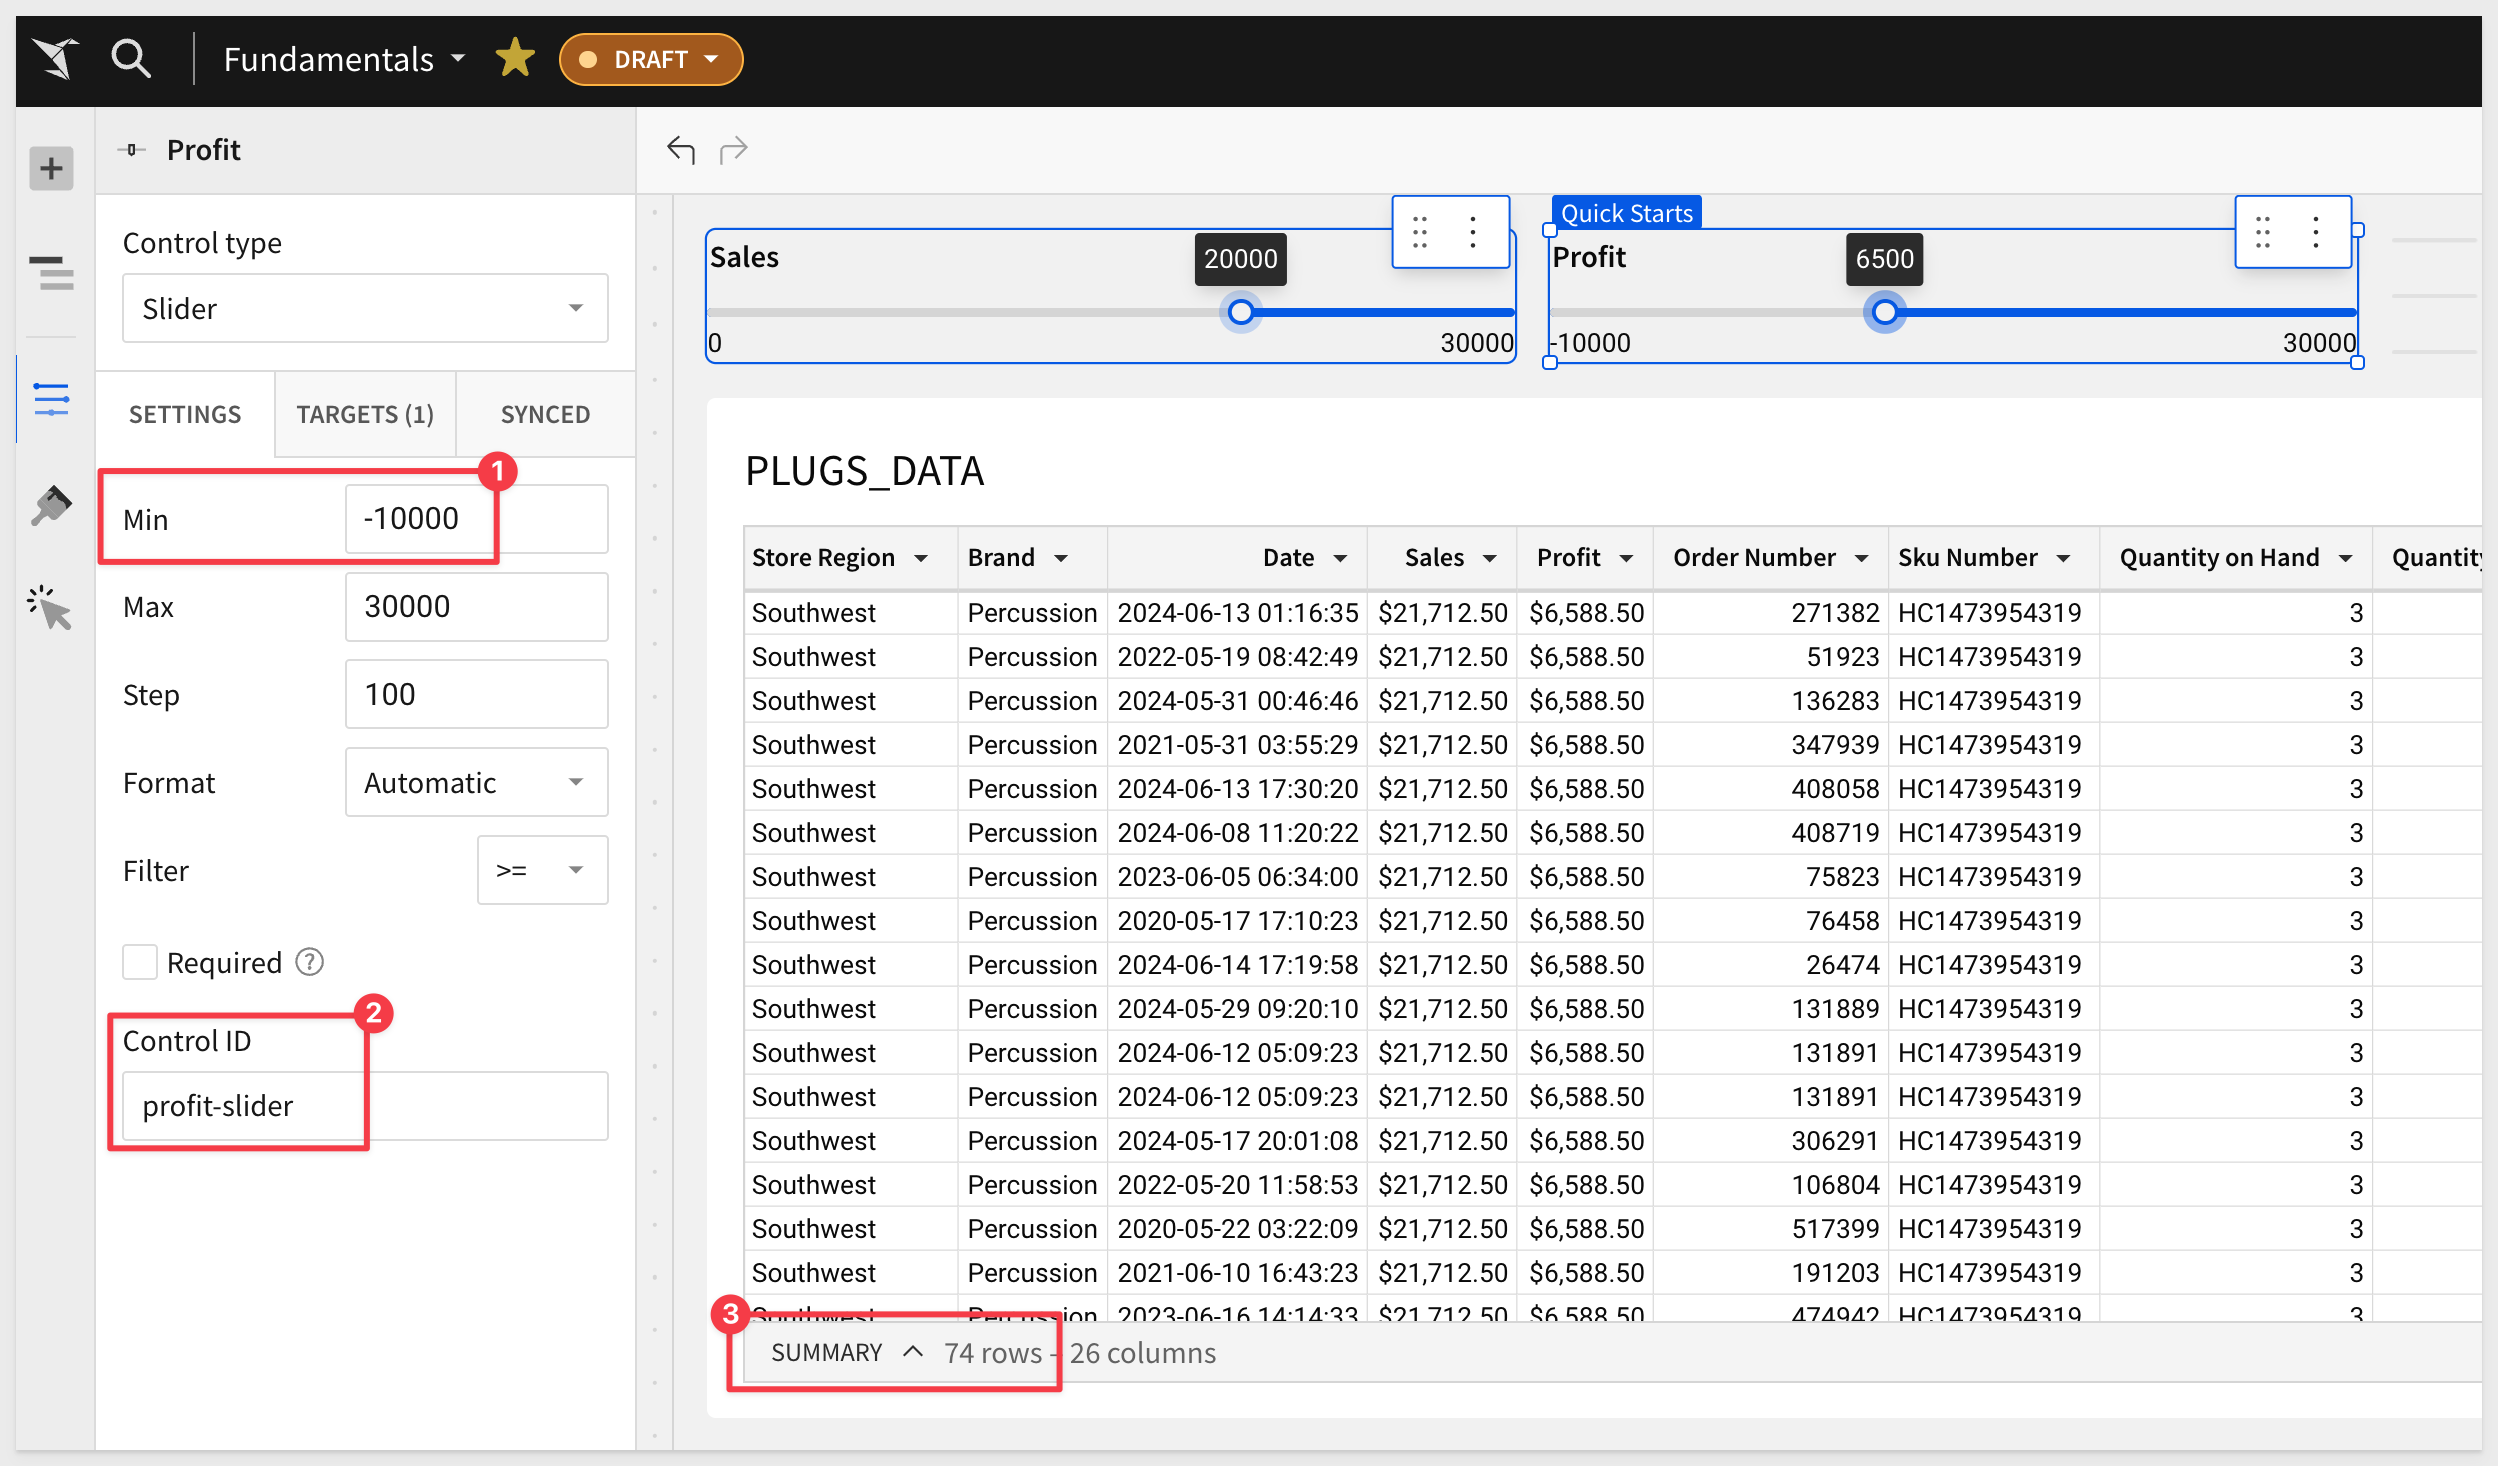
We checked and found there are some orders sold a big losses, so we set the minimum value to -10,000 for the Profit slider.
Also set the Control ID for Profit to profit-slider.
Now adjust the Profit slider to be around $6500. These are are target high-value customers:
Sanity Check
When creating controls, it is always a good idea to make sure the row counts are what is expected. For example, we just set our maximum sales value over the highest value in the table and no minimum.
We would expect the table to have the same row count as our un-filtered source table, and it is easy to compare the two, as a quick validation.
We want to ensure that we did not inadvertently create a filter that does not initially show all the rows, based on its configuration (unless that was intended).
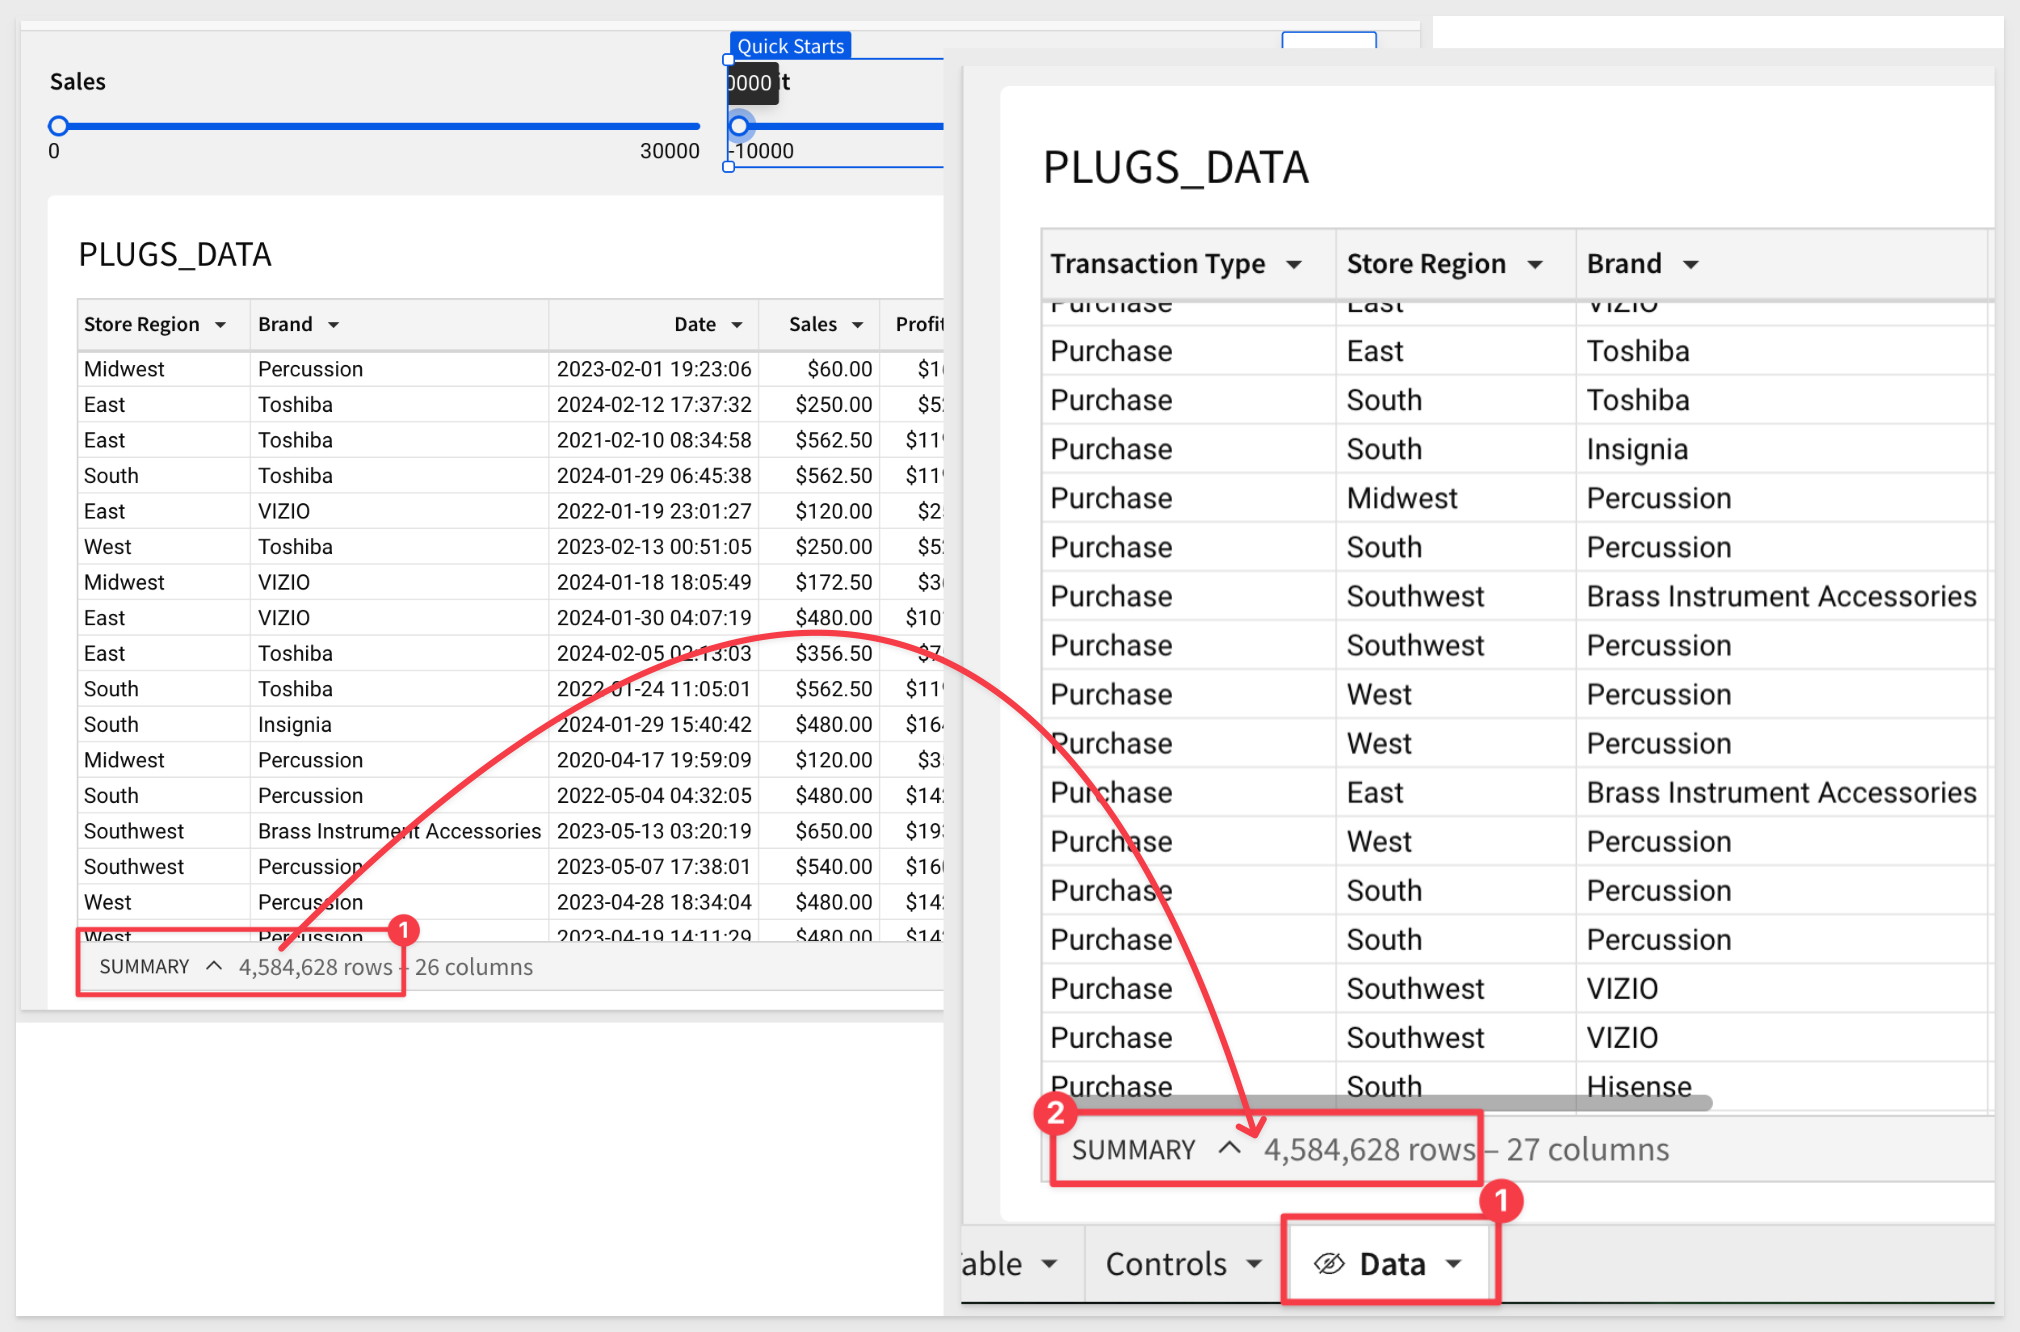
Reset both controls to show all rows, and verify the total row count matches the total row count on the Data page > PLUGS_DATA source table.
Check that the values match:
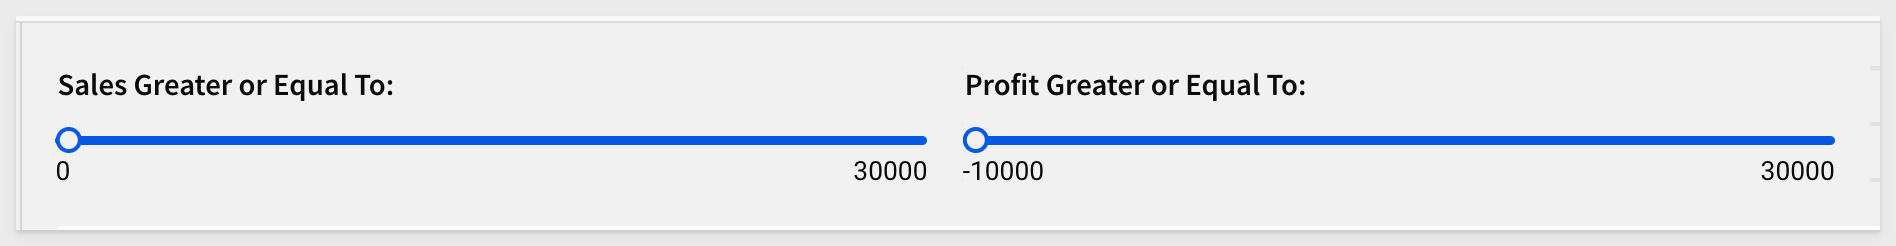
It is recommended to rename the controls, so users understand them as best possible.
Also, reset the two sliders to show the full range of data for now:
Click Publish.
This control is very similar to the slider, except that the user is able to adjust both the min and max values in the control itself.
For example, we might want to target customers who spent a fair modest amount of money on computers, to see if we can sell them upgrades or accessories.
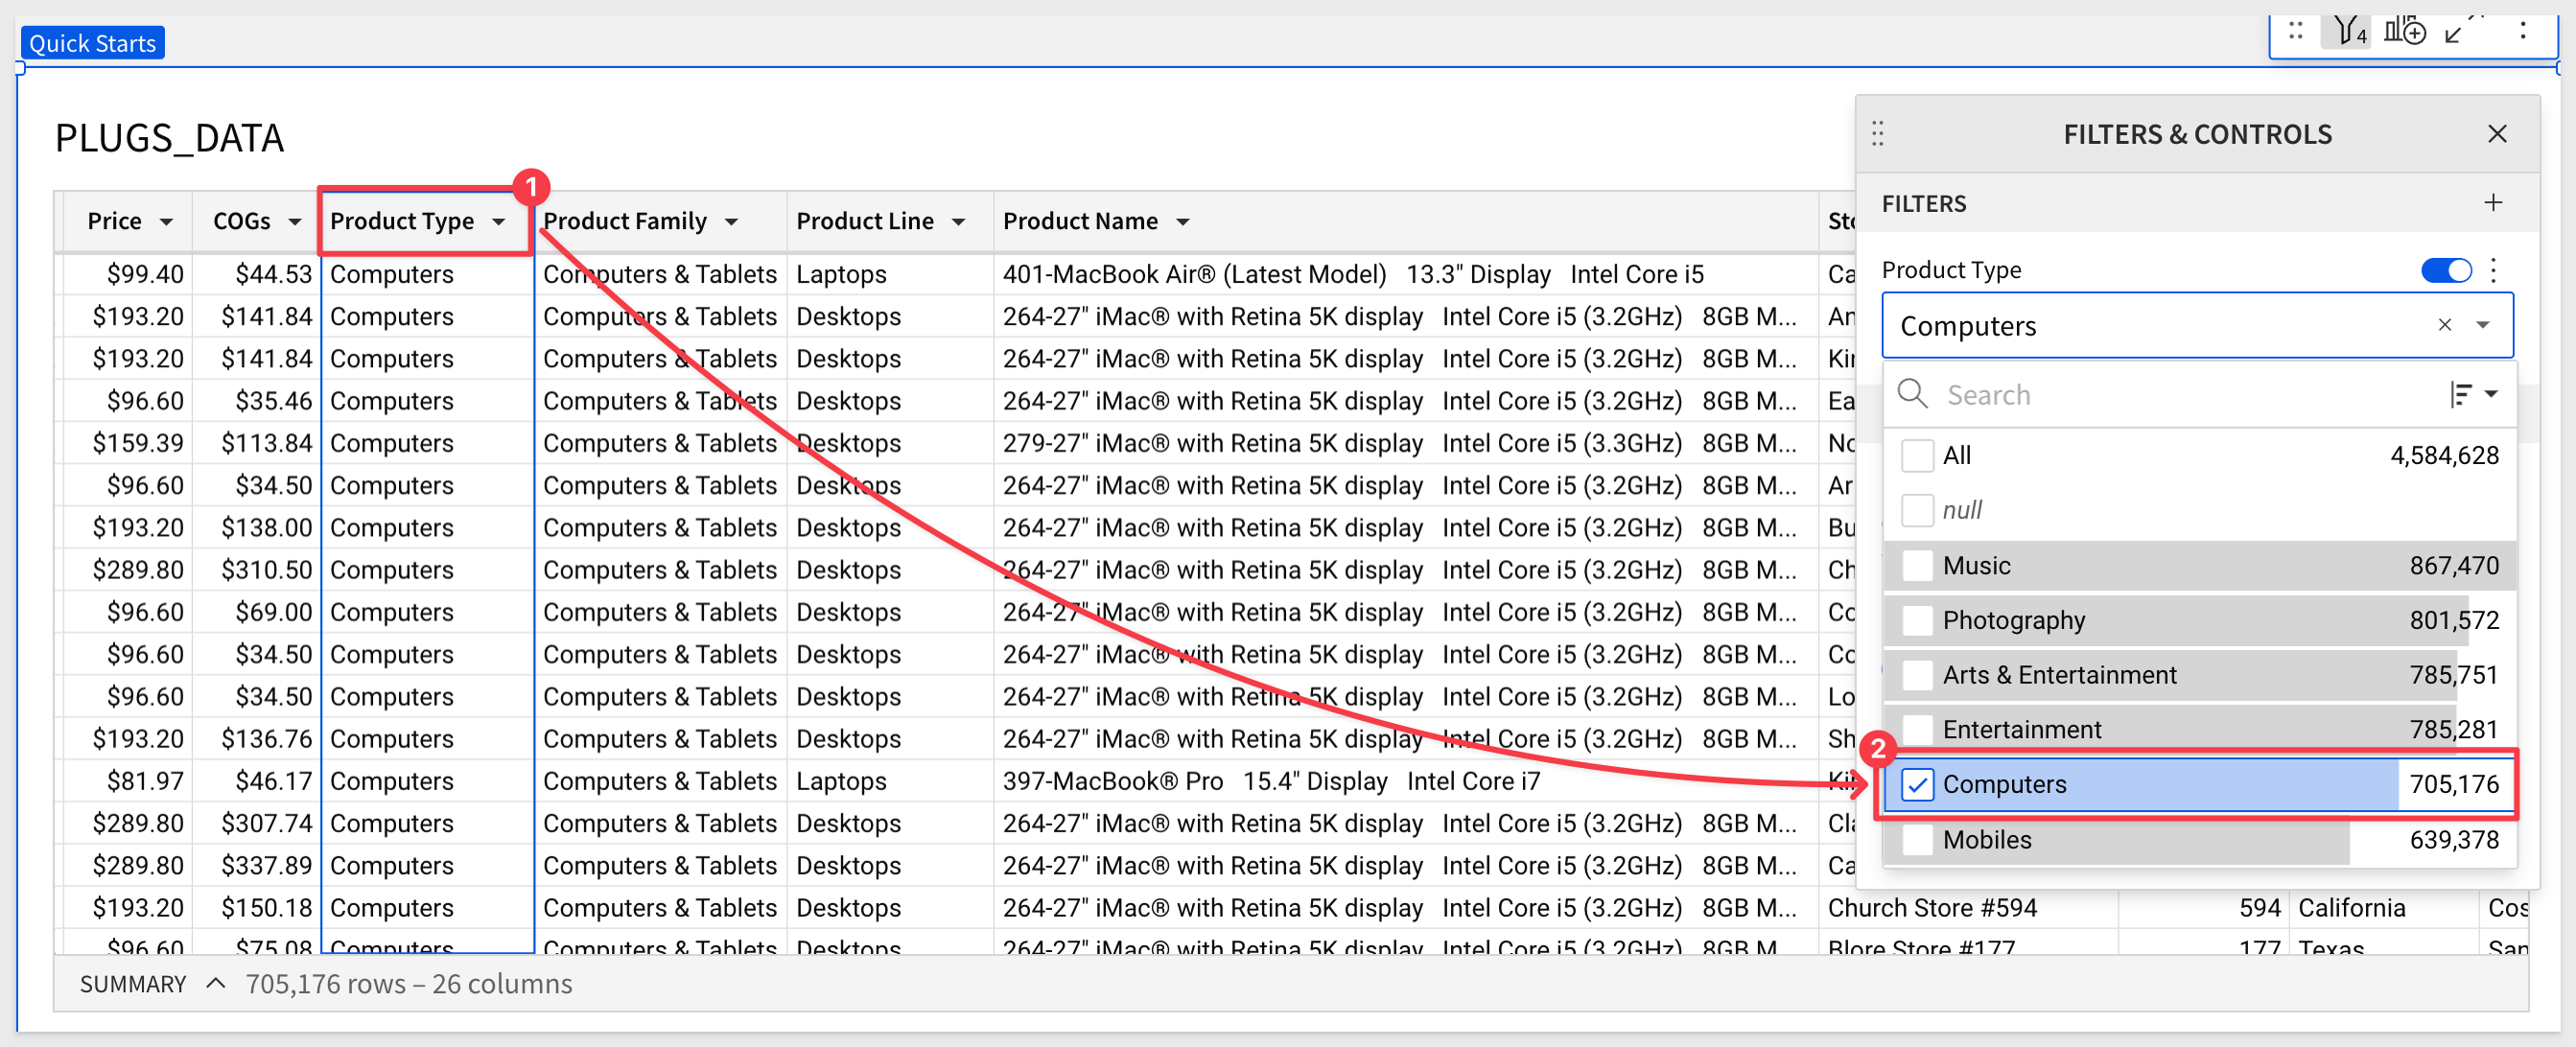
We can easily filter for computers:
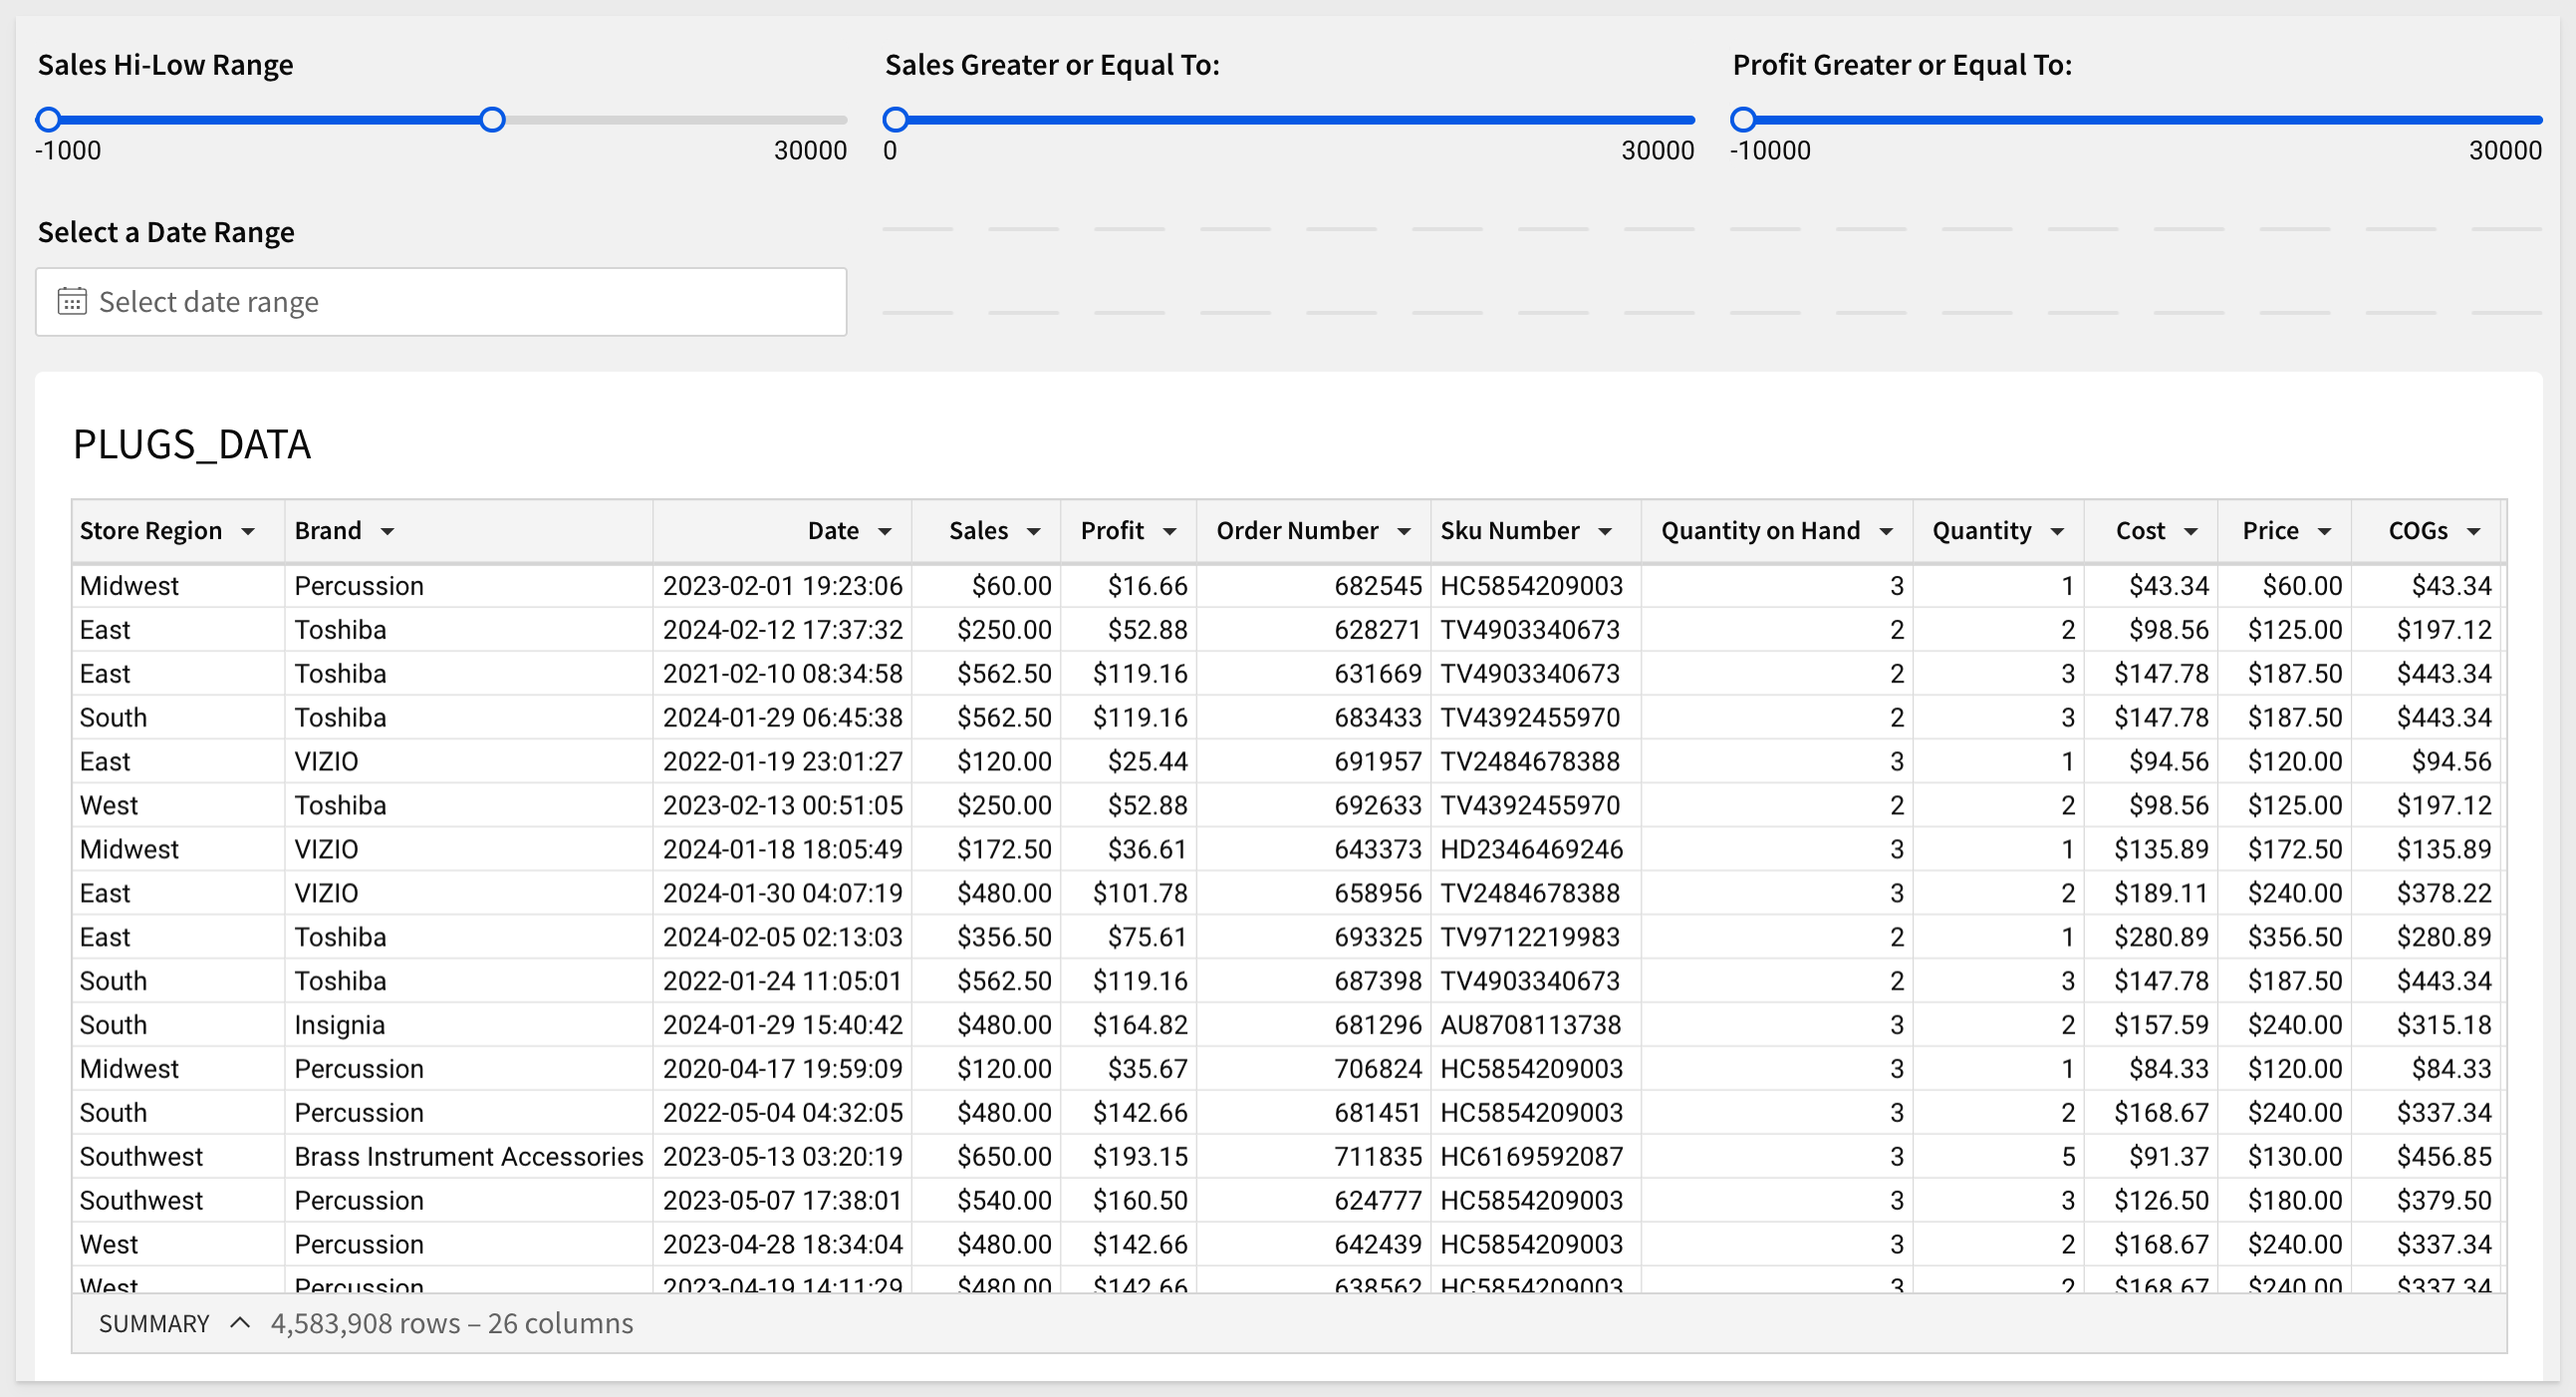
Add a Range Slider control, configure it, set the target to the Sales column, rename it to Sales Hi-Low Range and then adjust it as:
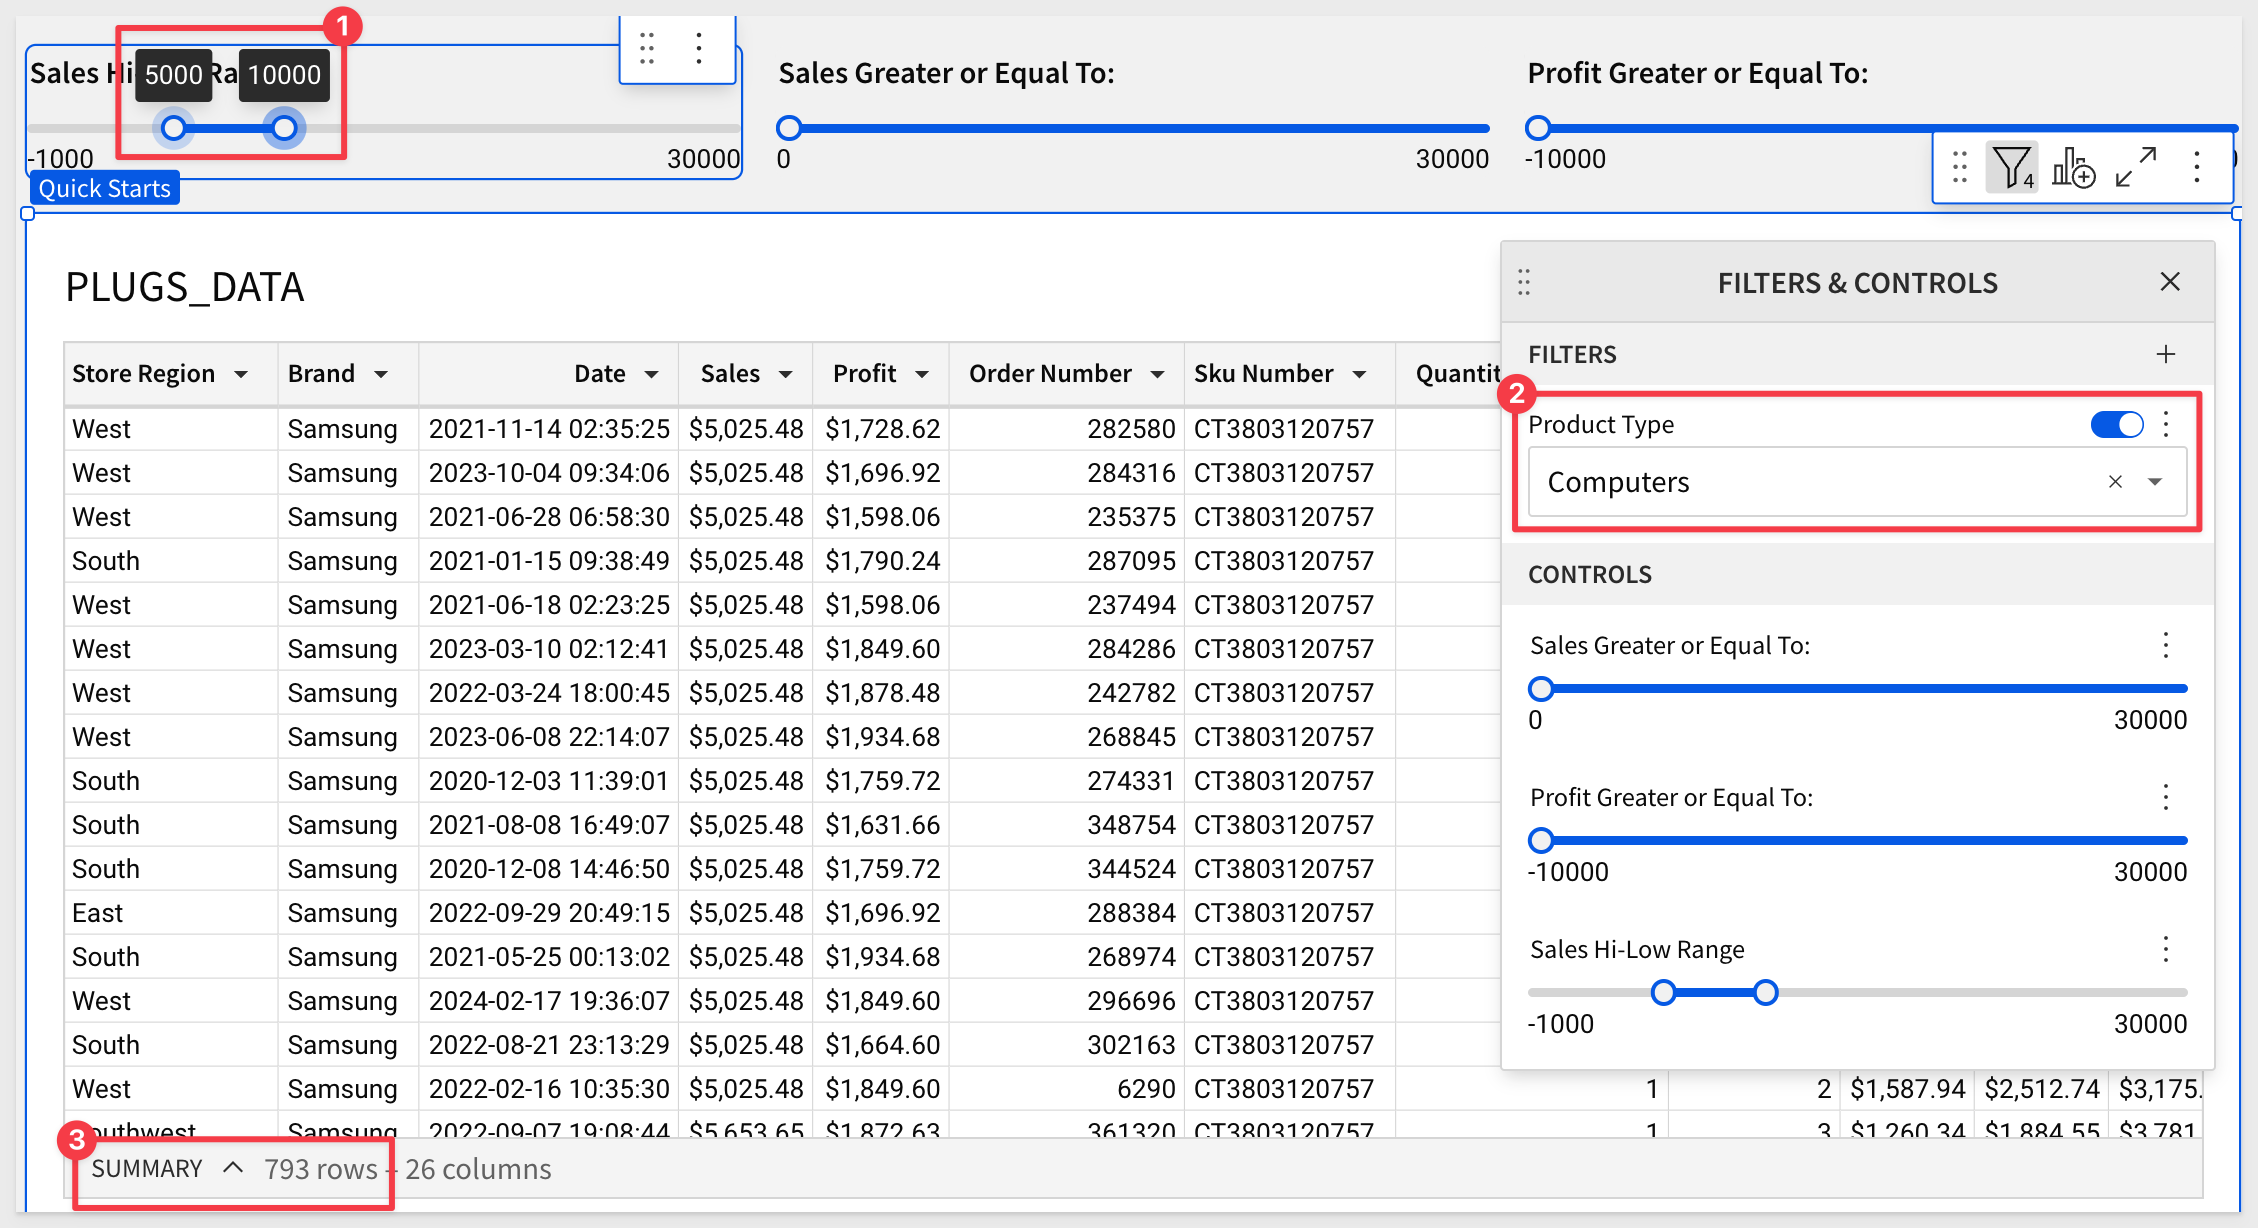
We now have a target list for our campaign.
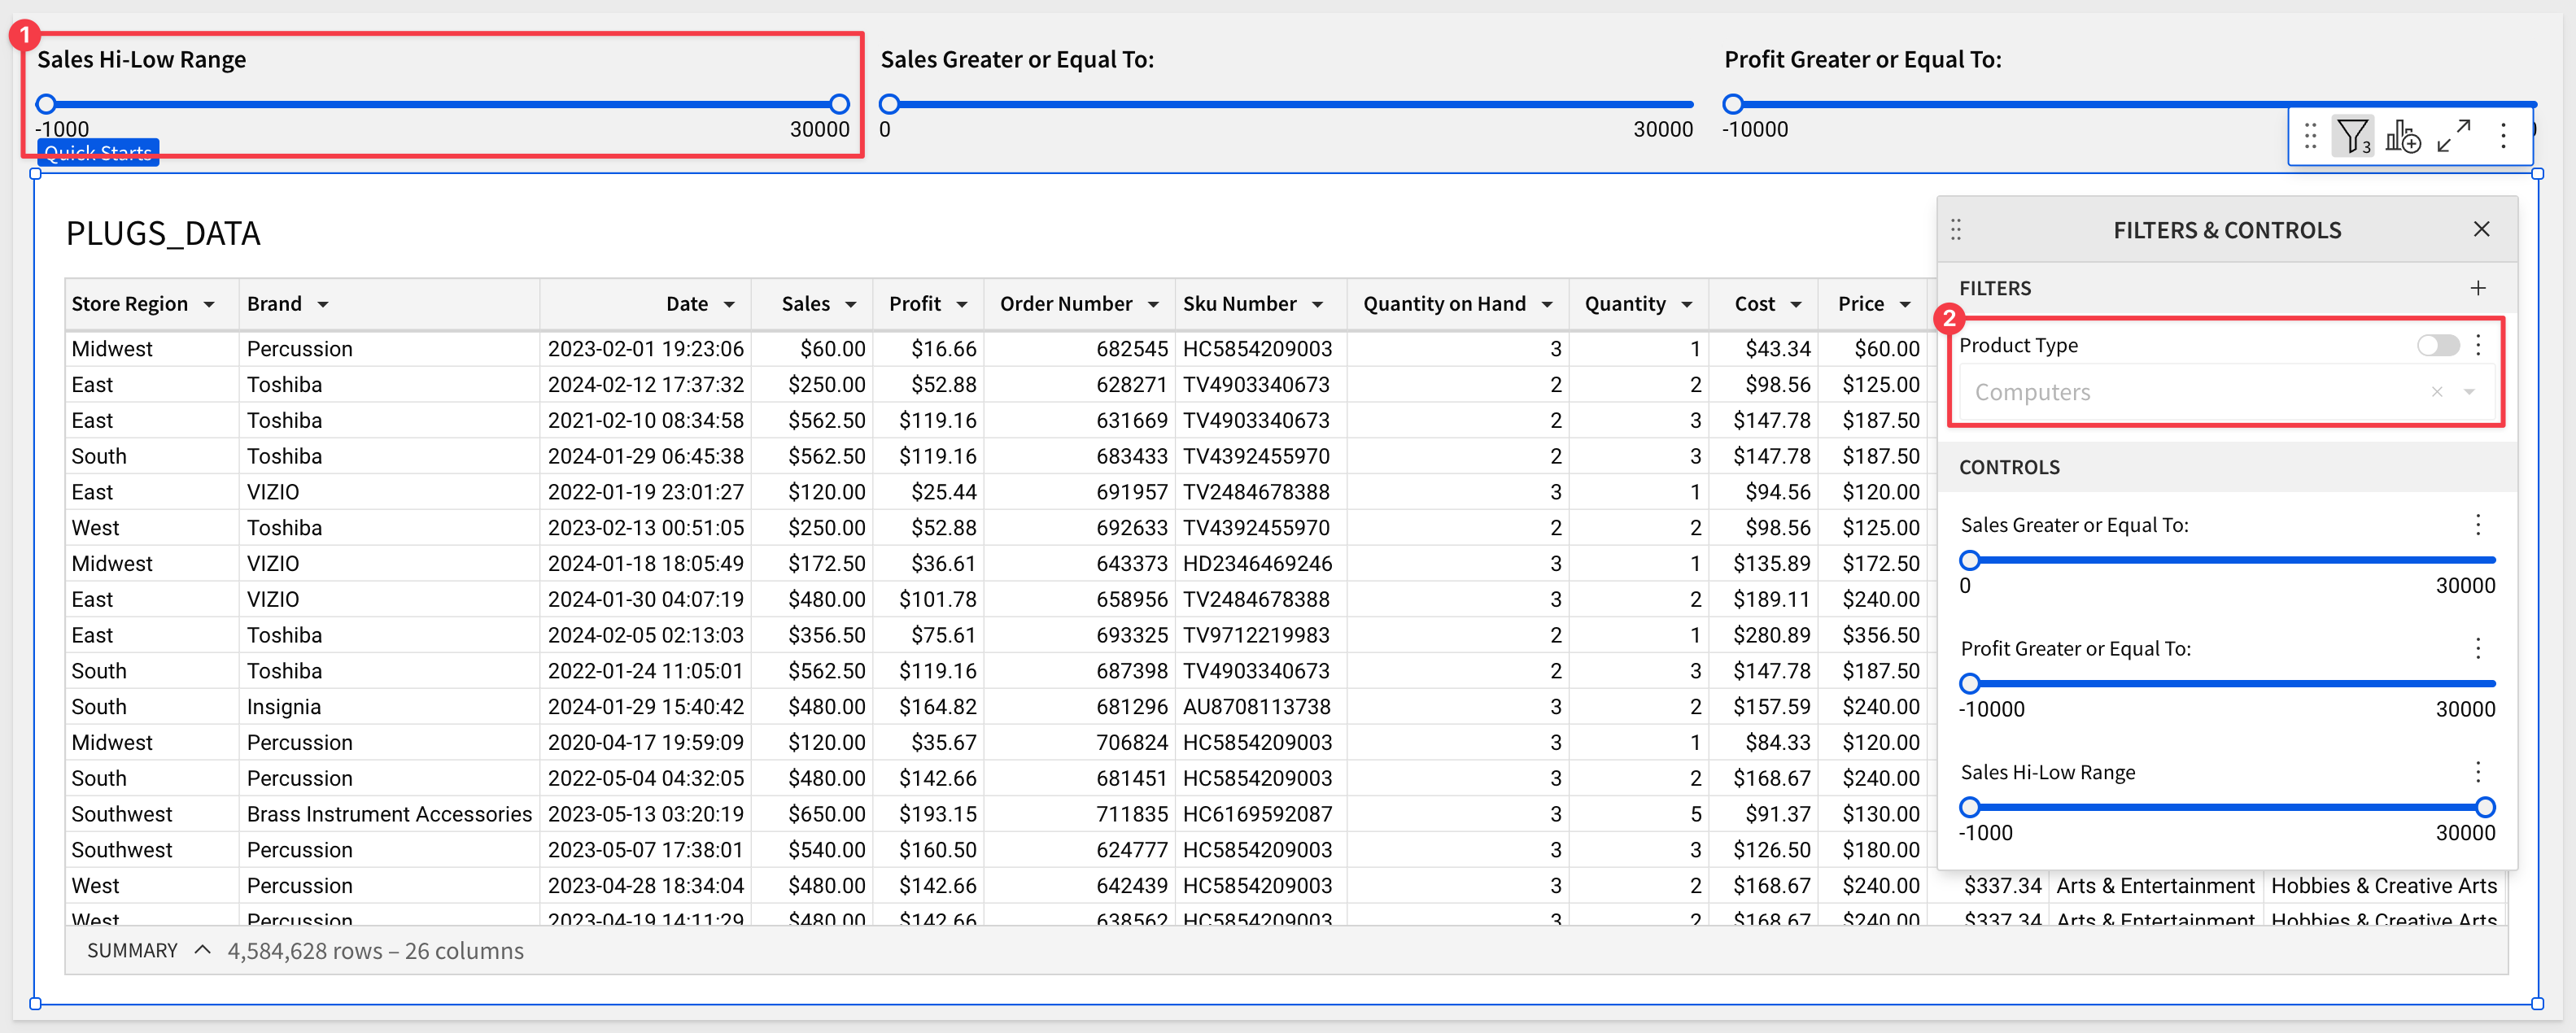
Reset the range slider control to show all rows (don't forget to clear the Product Type filter on computers) and click Publish:
Configuring a basic date control is done in just a few clicks, giving it a target of DATA > PLUGS_DATA > DATE and a Control ID:
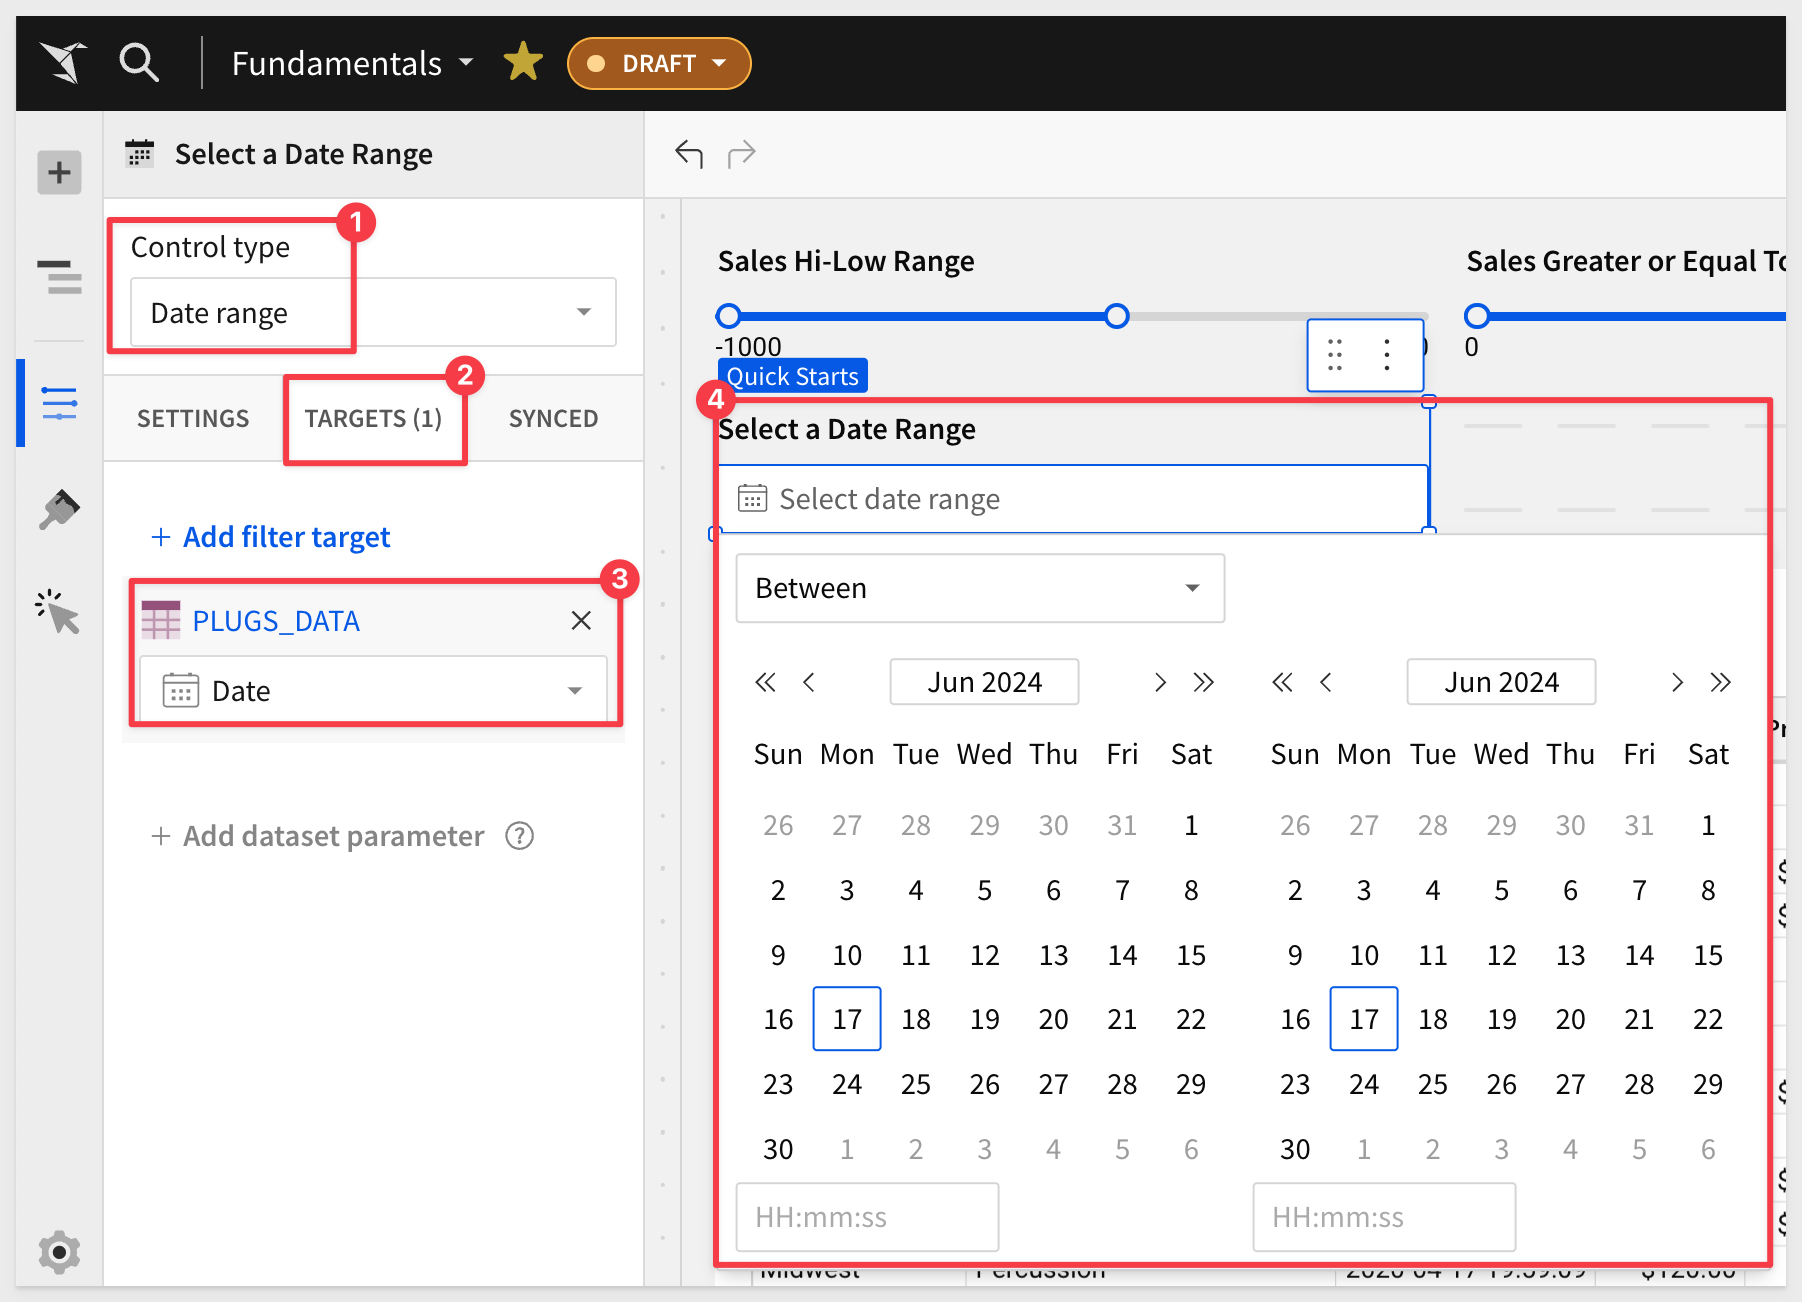
The default for the date control is Between two dates:
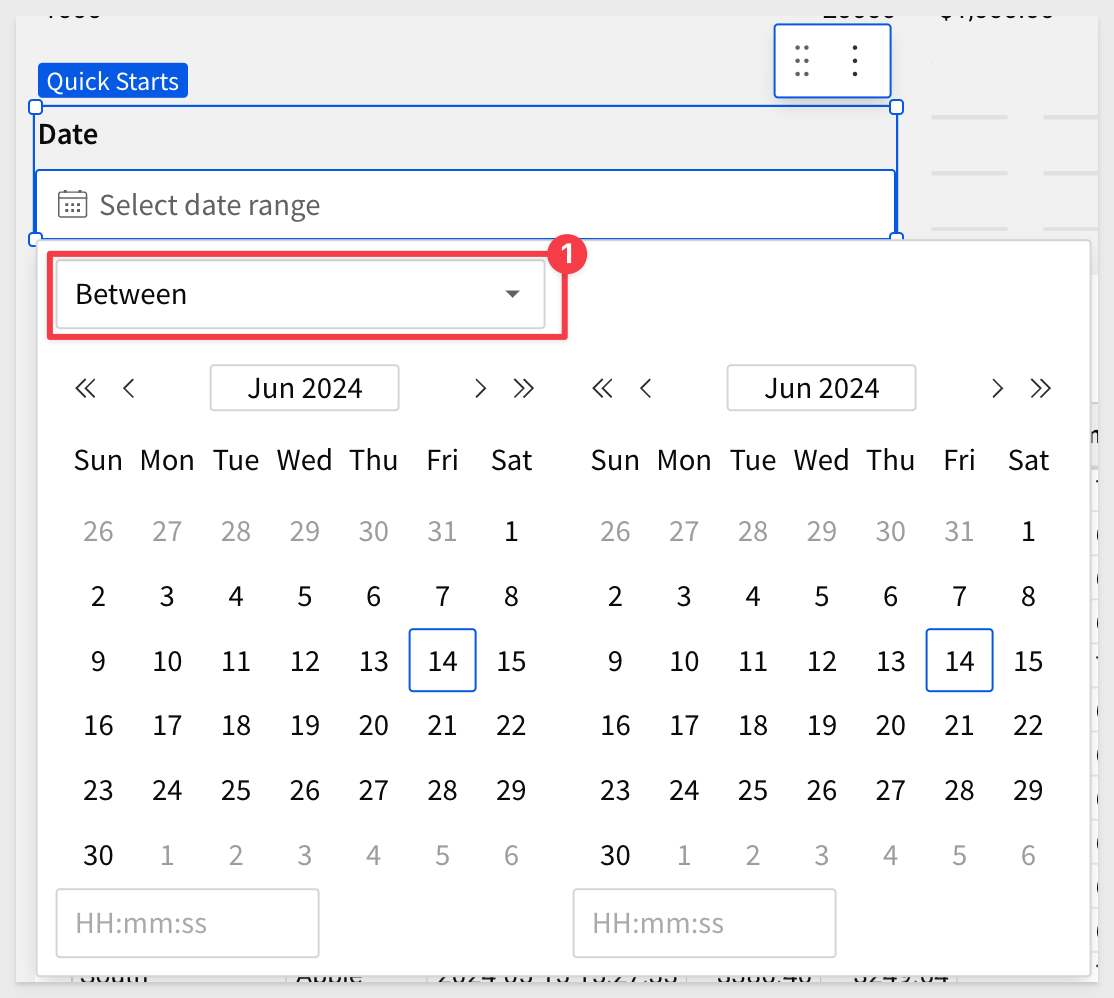
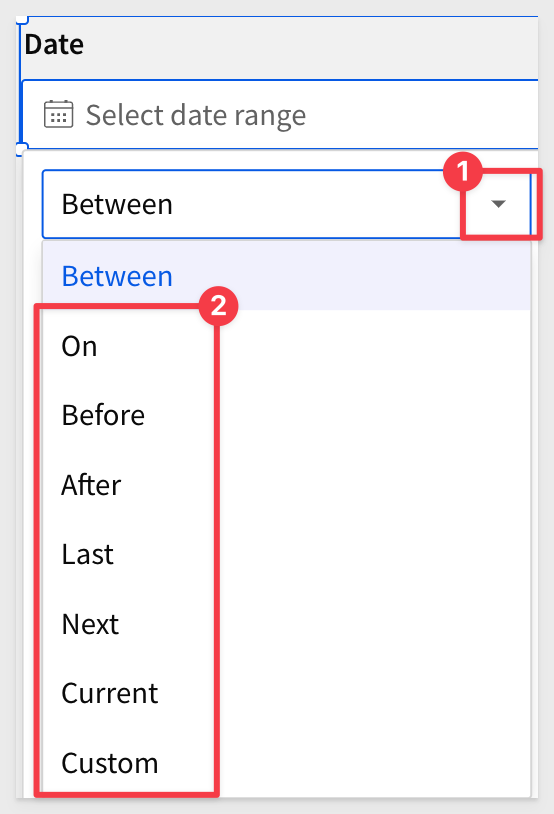
Opening the date options menu exposes all the other selection criteria available to the user, including a custom option:
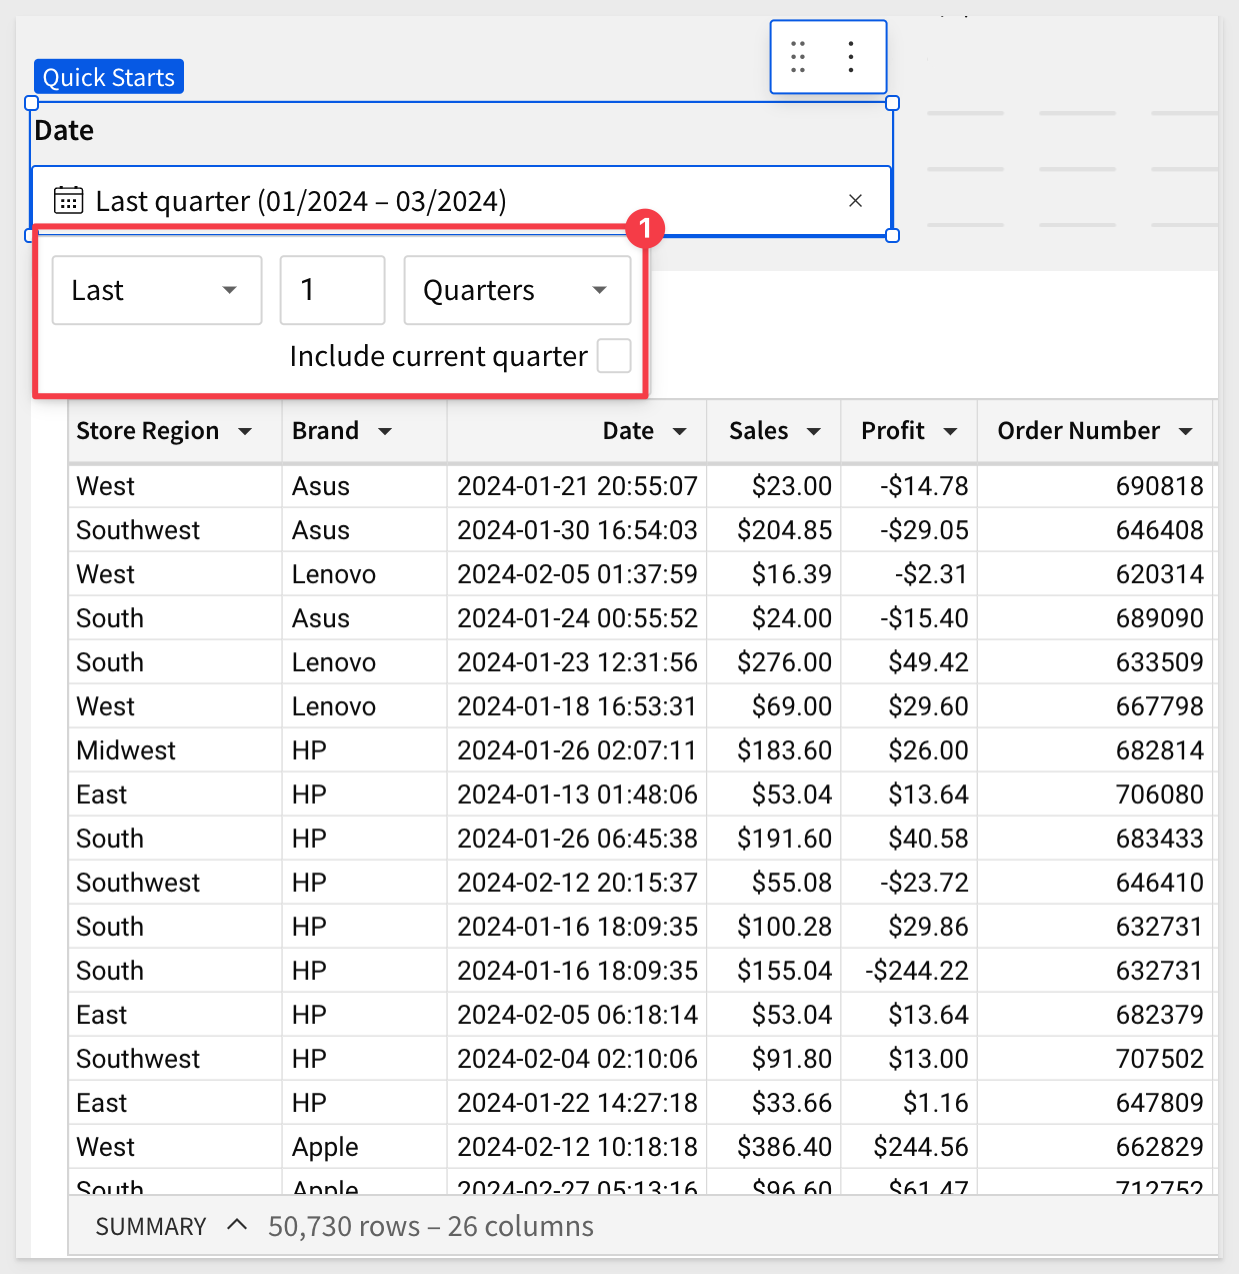
The date control's options make it really simple to get to the data that you need quickly:
Reset both controls to show all rows, and click Publish:
If you have done any of the other sections, you know how to make the Top N control work.
Here is what that might look like, targeting the Profit column:
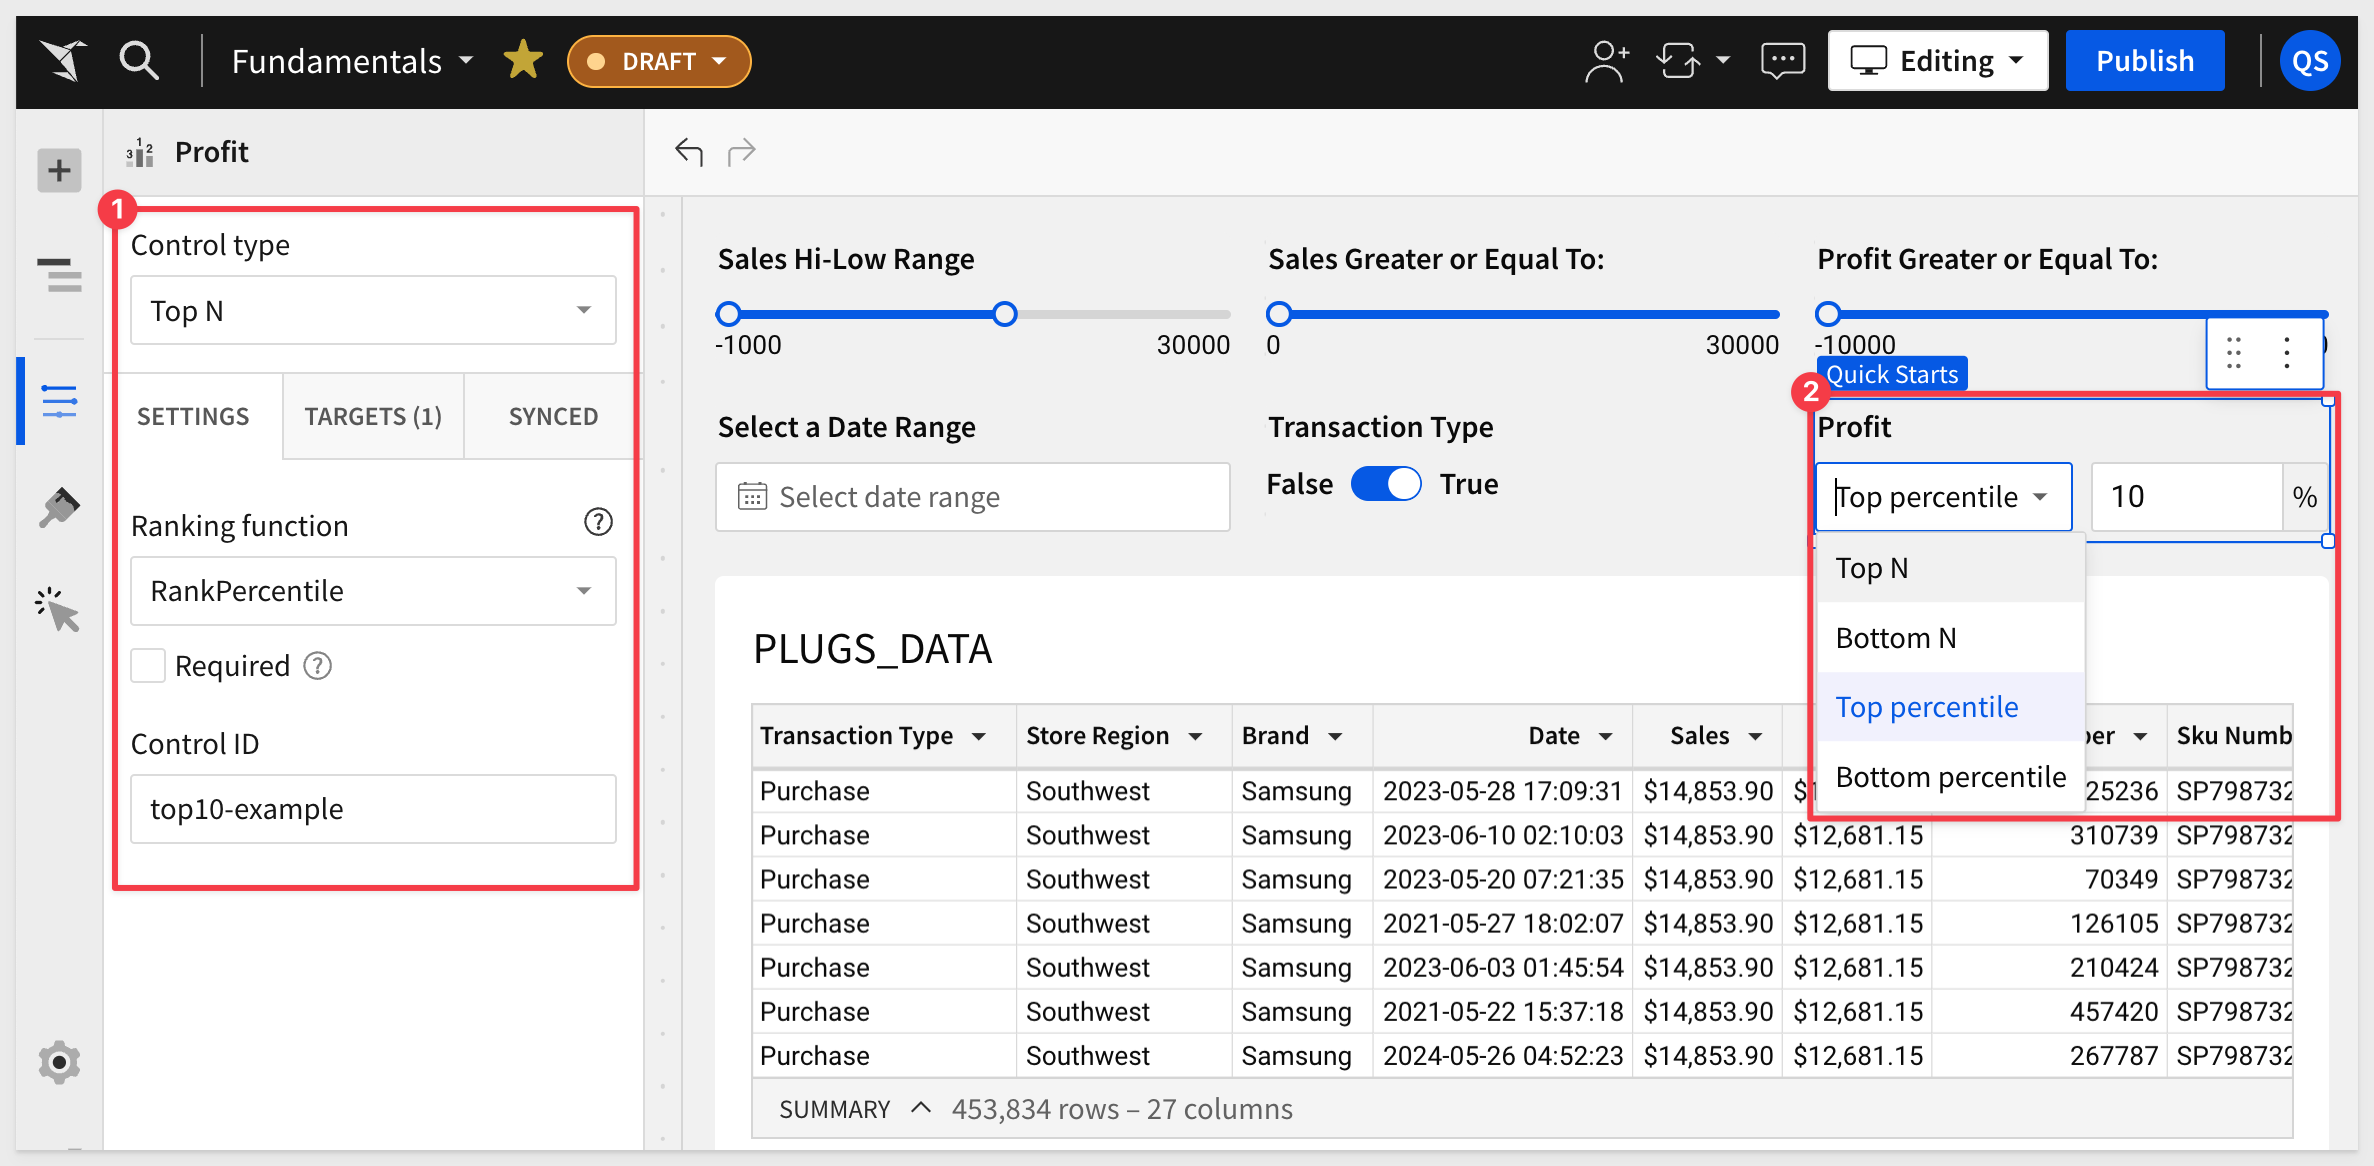
The Top N control provides the user the ability to select from four different groupings of values, as shown in the image above, #2.
The Switch control2 in Sigma allows users to toggle between True and False values, and then filter for matching records.
It is a simple "on/off" toggle that can be used to dynamically adjust the rows within a dashboard, based on a binary choice.
Lets create a simple example, based on filtering our PLUGS_DATA by transaction type.
Scenario:
Imagine Plugs users want to analyze sales transactions, differentiating between Purchase and Returns.
By using the switch control, users can easily toggle between Purchase and Returns, within a dashboard. From there, users can drill further into the data to gain the insights that interest them.
A problem we notice right away is that our PLUGS_DATA table is missing the transaction type column; we need to add that.
Sigma is flexible, and the decision of where to add this column has some implications.
We could add it independently of PLUGS_DATA, so that other tables in the workbook do not have access to this column. However, this column ‘feels useful', so we want all the other "child elements" of PLUGS_DATA to be able to use it if desired.
Since this column does not exist anywhere in our workbook, we can't use a Sigma Lookup, but we can create a join to it, as it does exist in a related table in the warehouse.
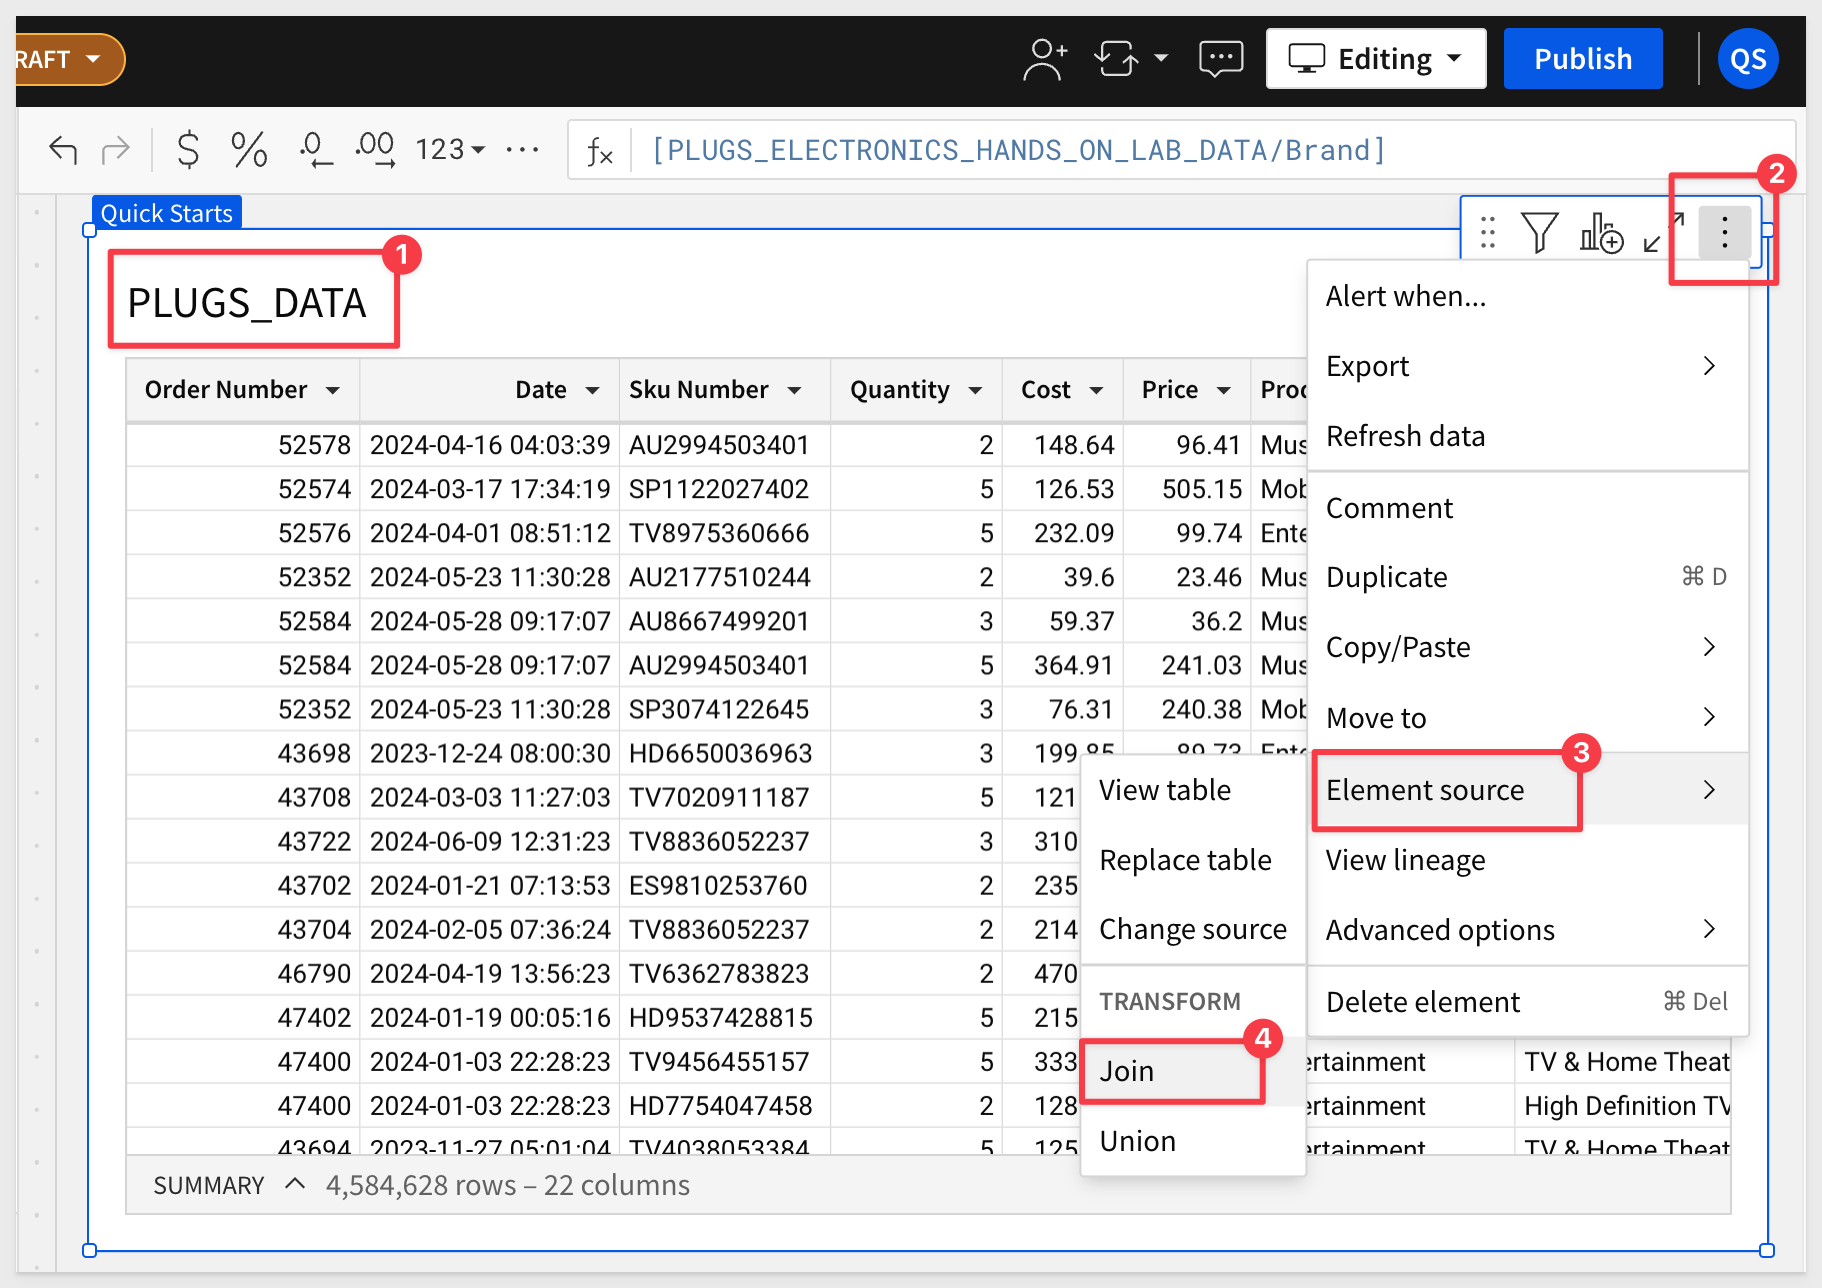
Navigate to the Data page, select the PLUGS_DATA table and open its menu.
Click Element source and Edit join:
Using the source selector, search for F_Sales and click to select it:
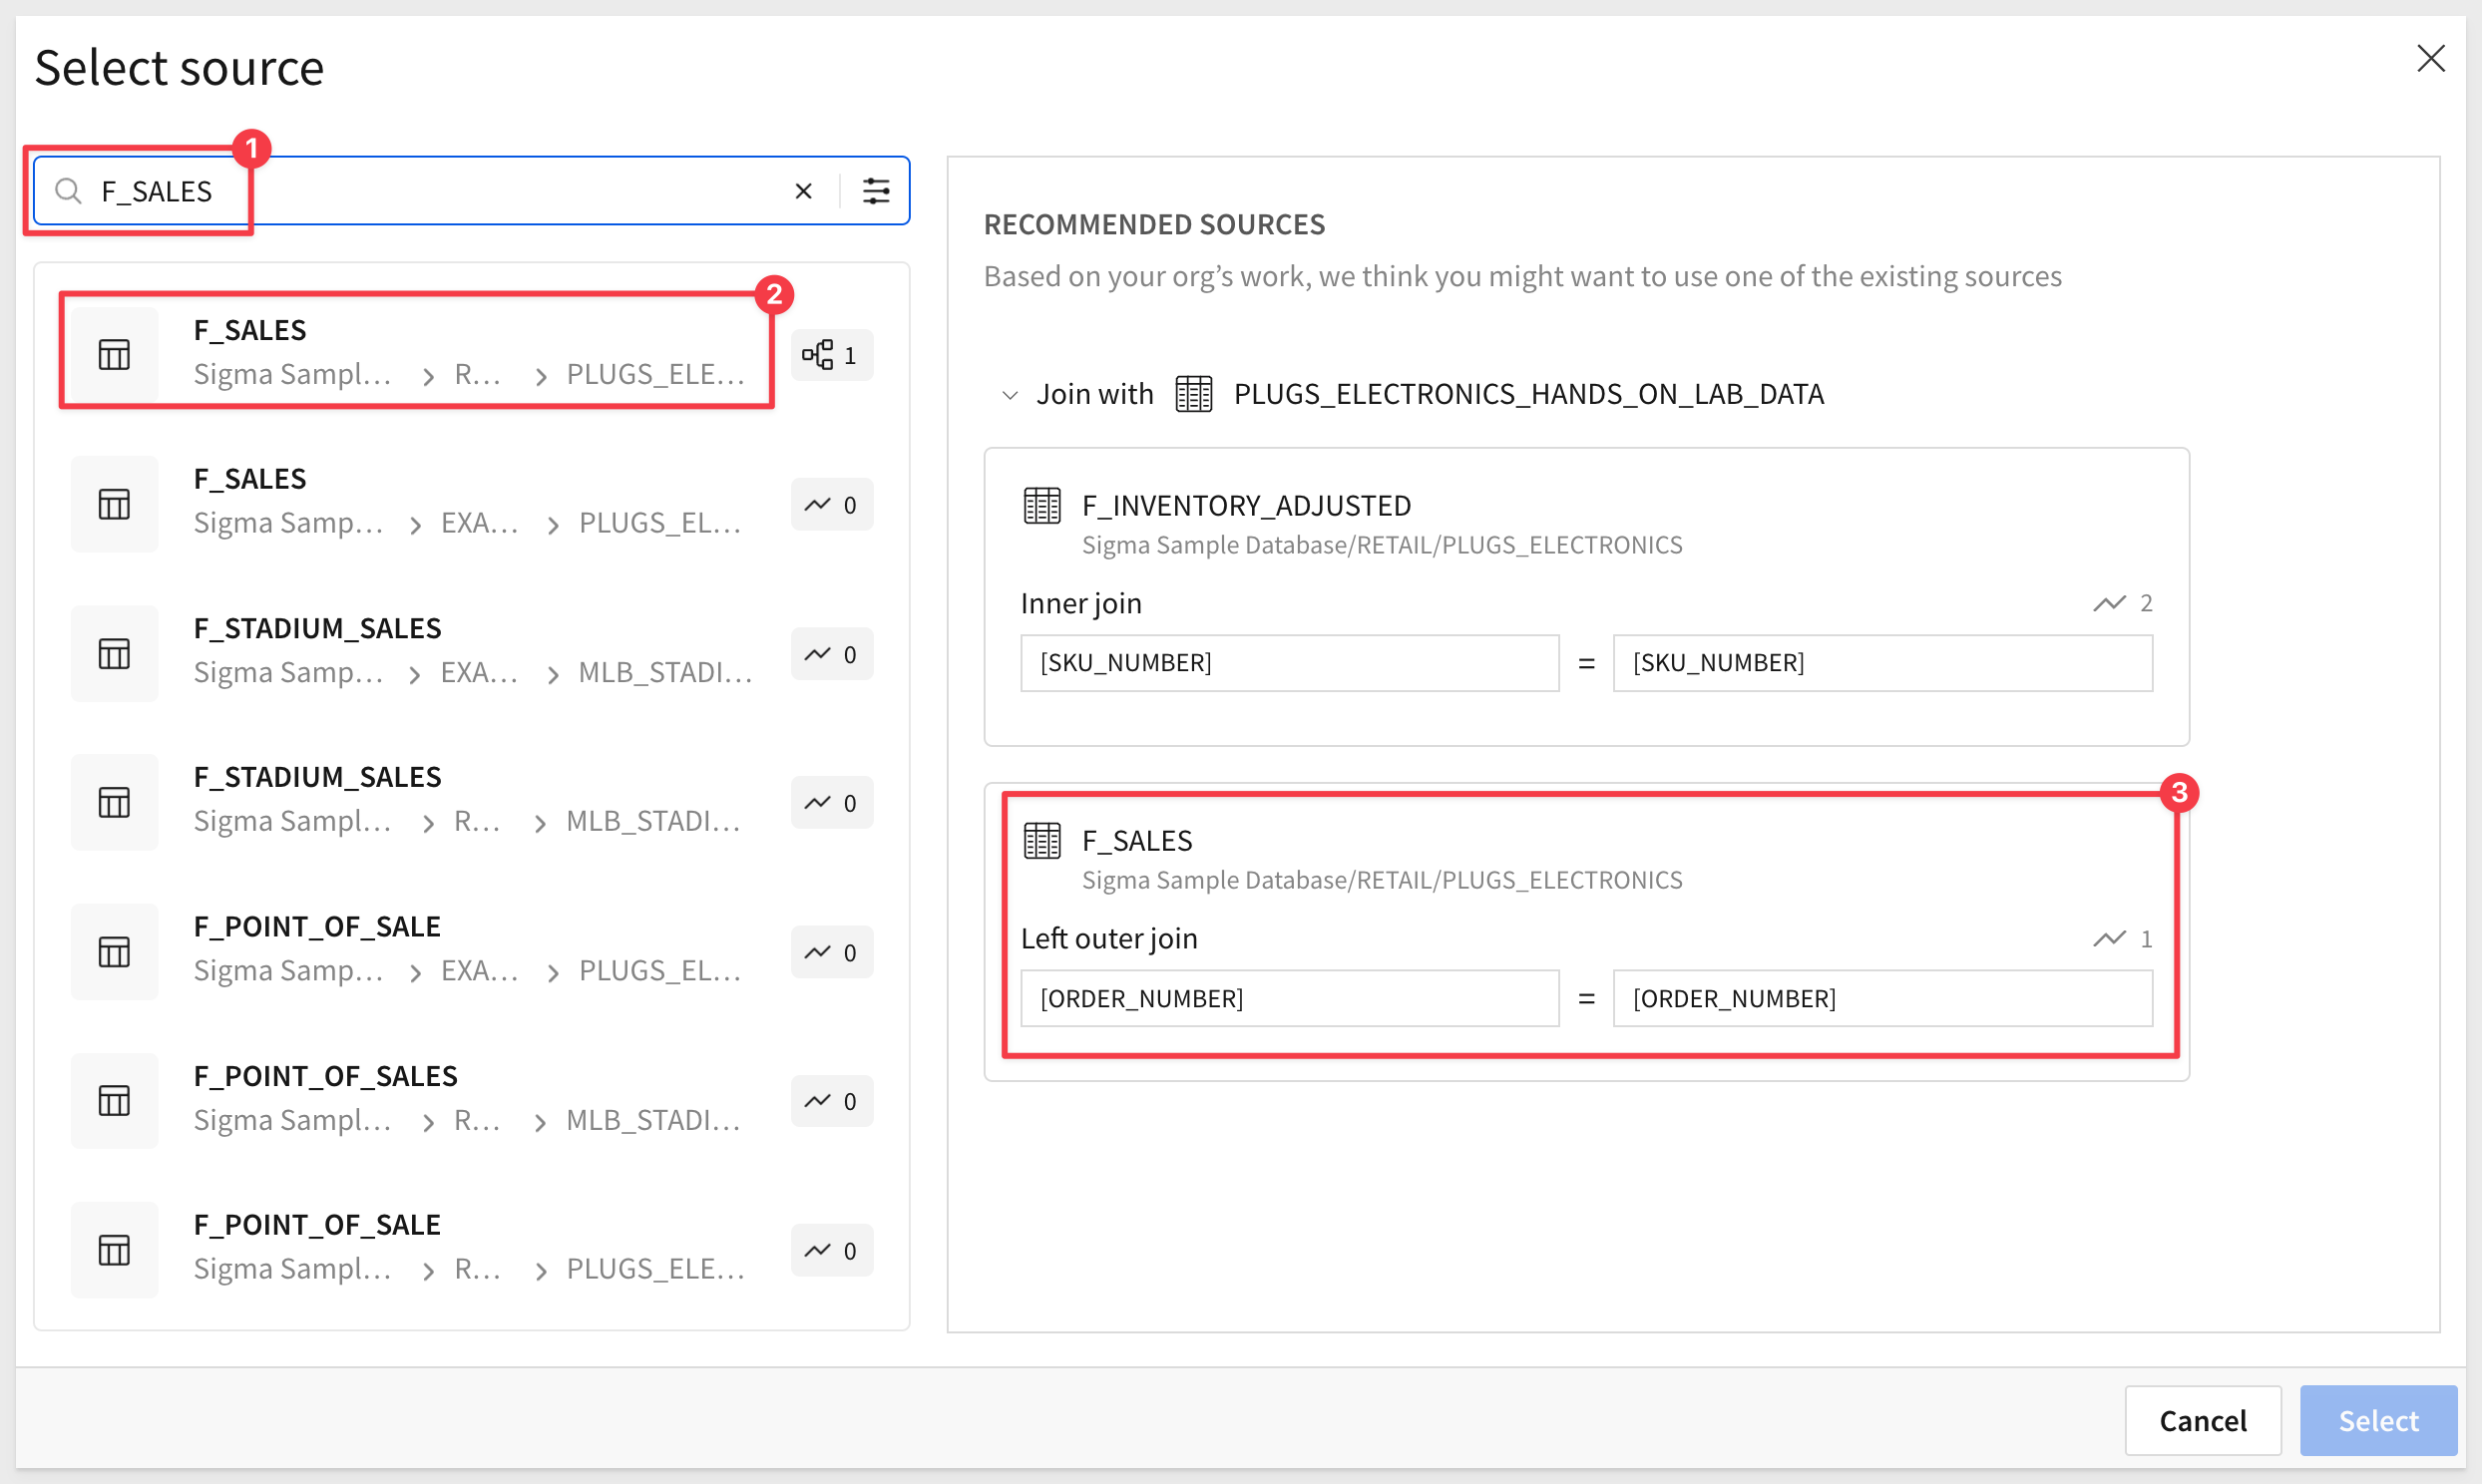
Notice that Sigma makes table suggestions to save time. In this case, we searched and selected the F_SALES table.
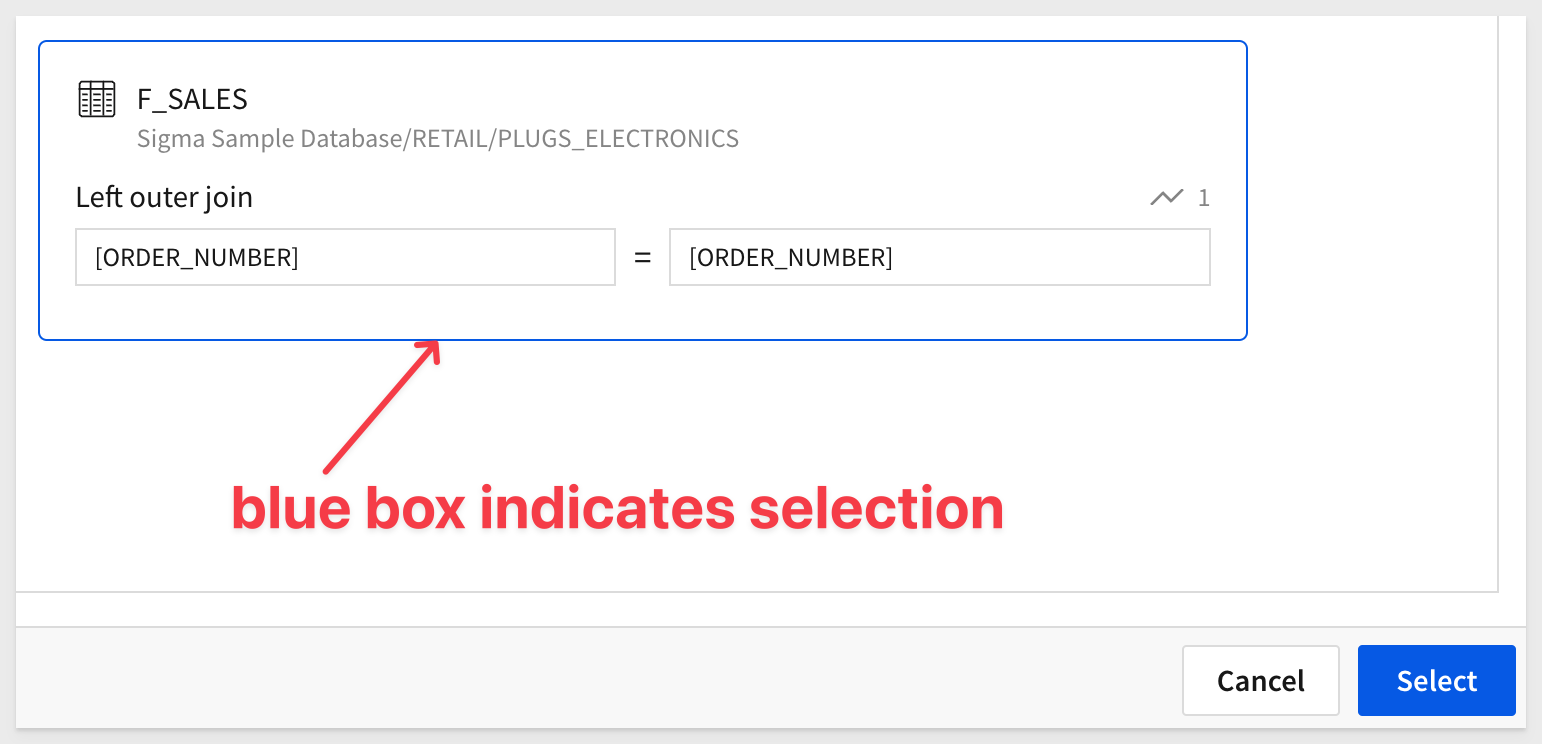
Sigma suggests that we might want to join on matching ORDER_NUMBER columns. We don't have to accept that, but since it is correct, we click to select that join condition and then click Select:
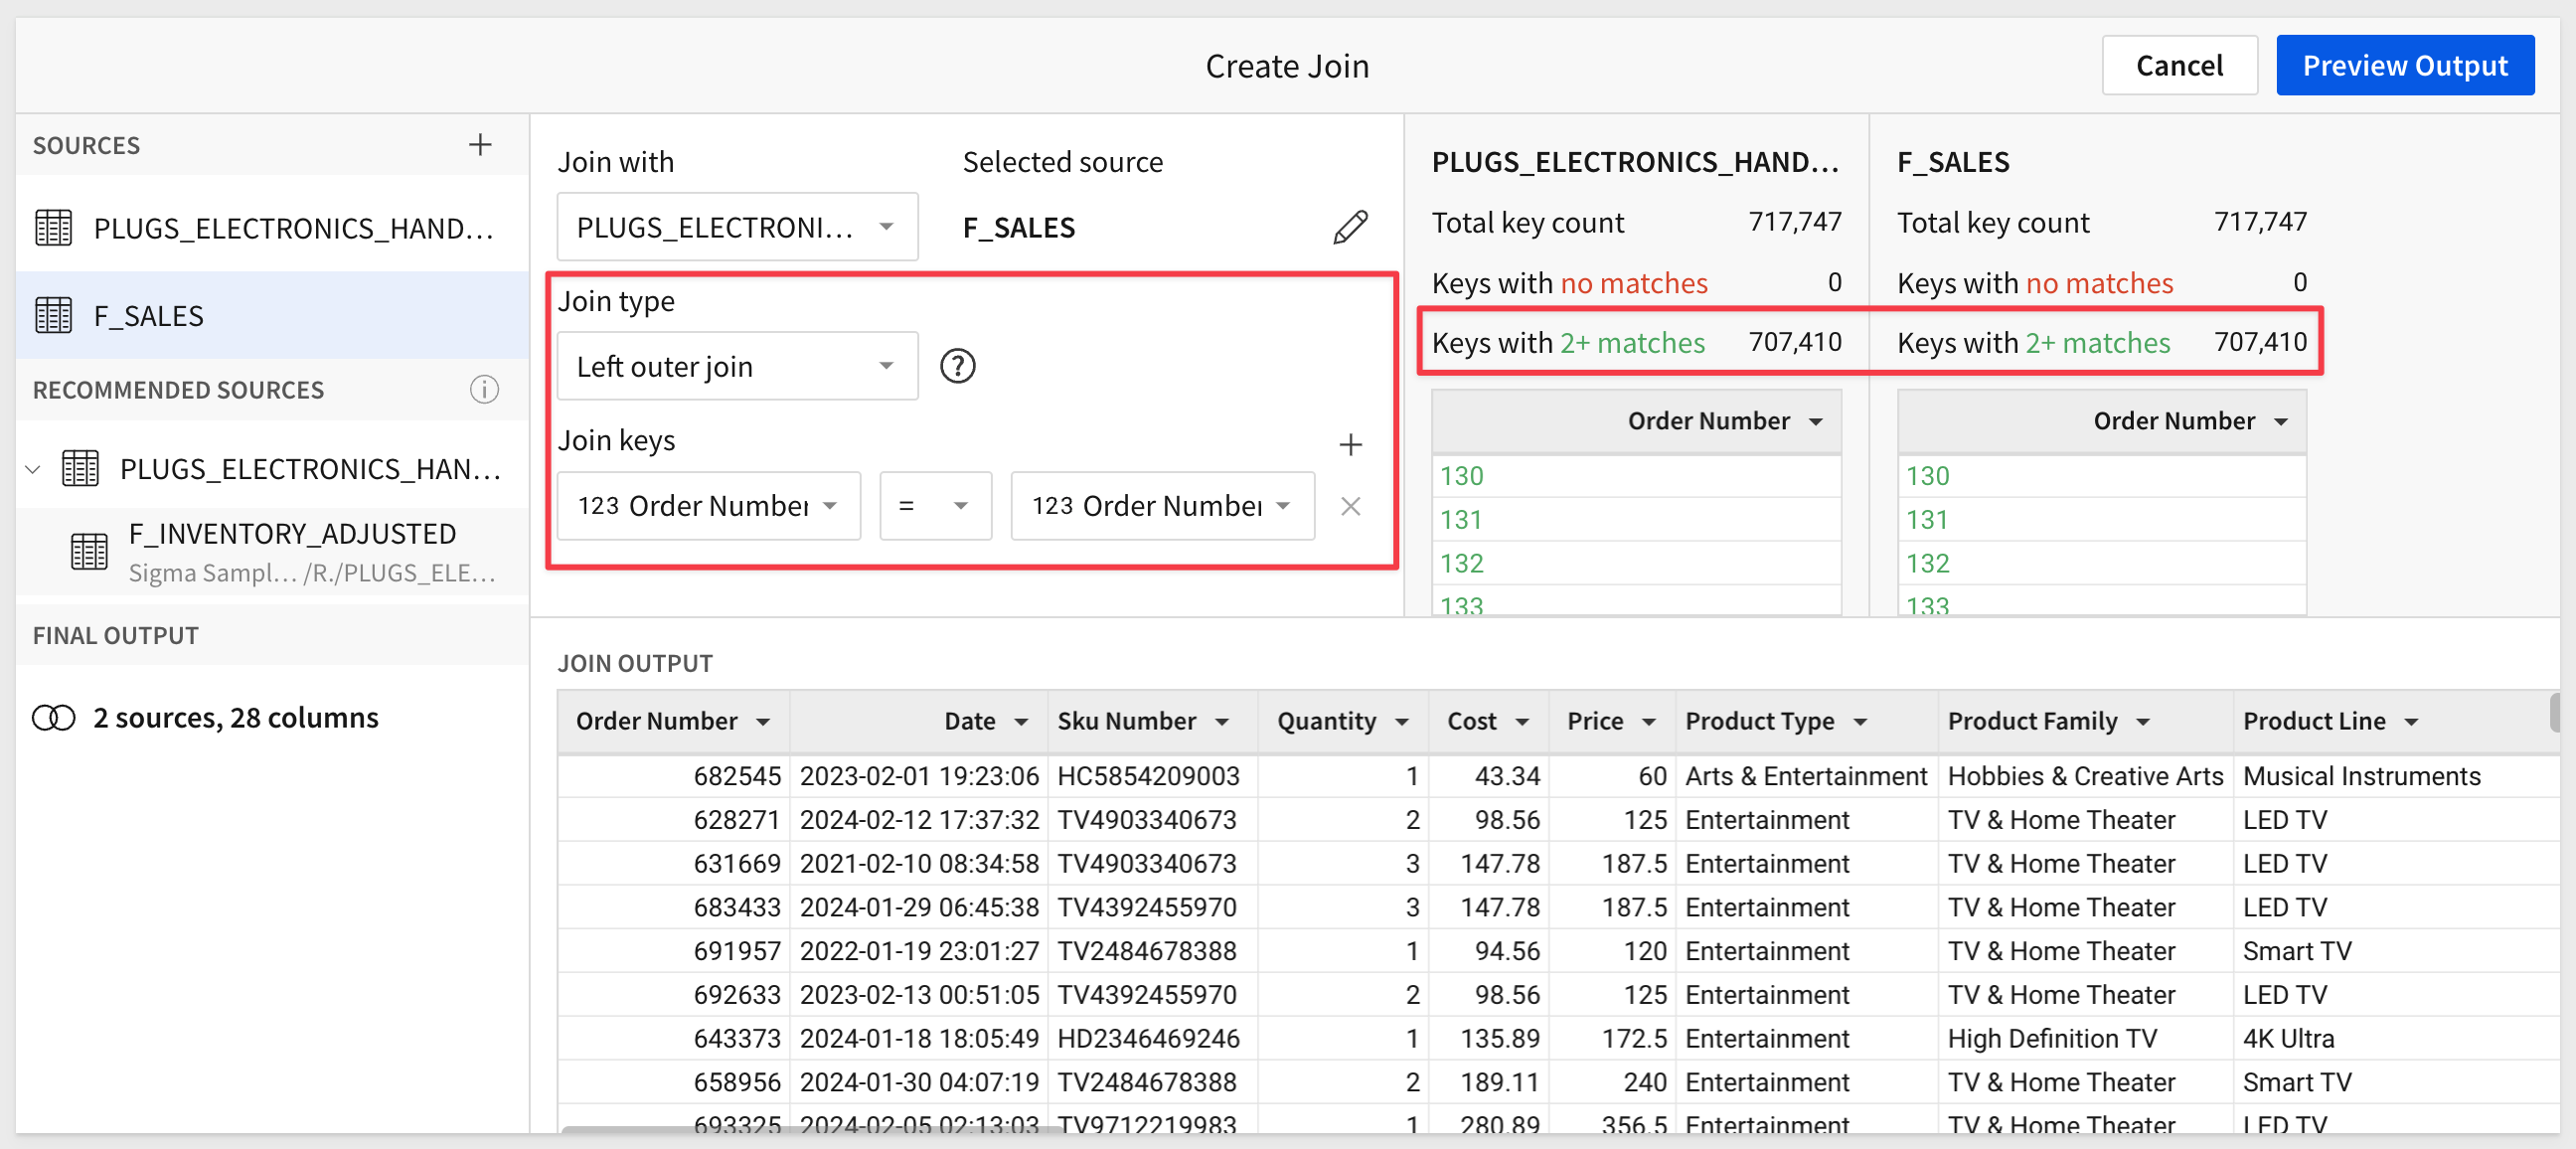
The next step shows us the current join configuration, allowing us to make adjustments, add more sources and the results.
In this case, there are less matched records than total records, which indicates that some transactions do not have a matching record. This is because our sample data does not have order numbers for cash sales transactions. That is fine; we can ignore those for now.
Click Preview Output:
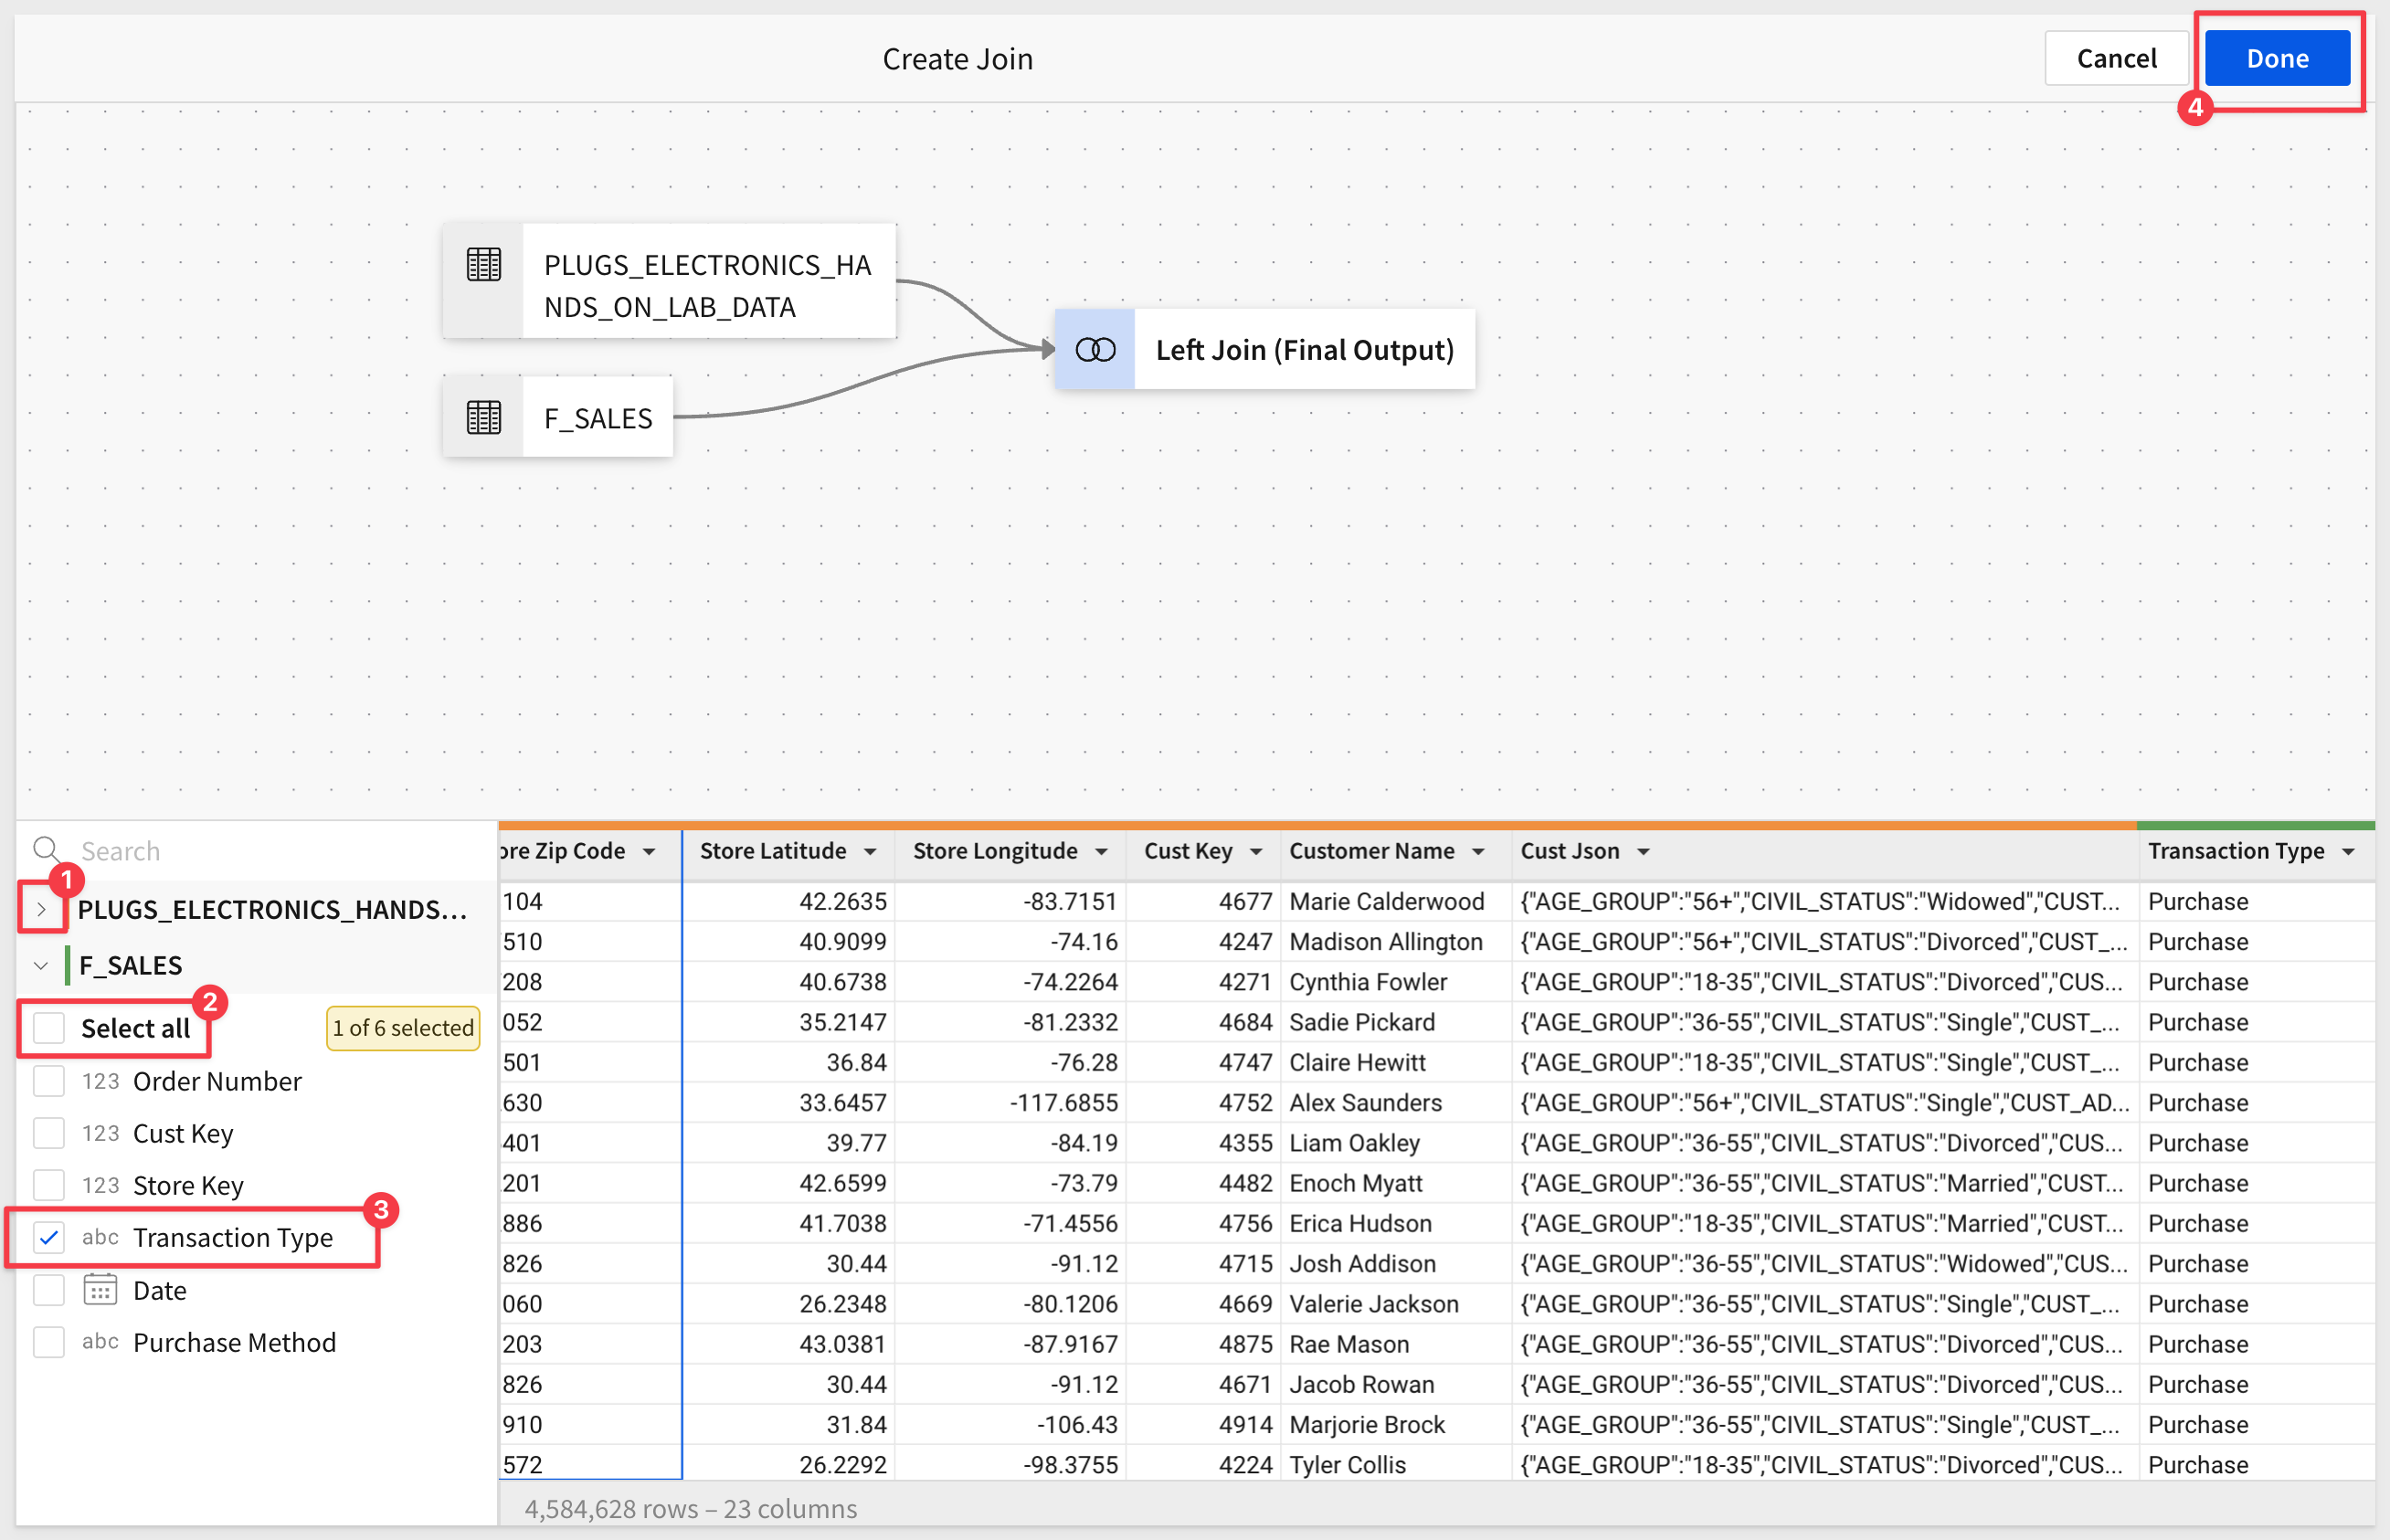
In the next page, we want to only select the Transaction Type column.
Collapse the PLUGS_ELECTRON.... (#1 in image below), deselect all columns from F_SALES (#2 in image below), and check the box for Transaction Type.
Click Done:
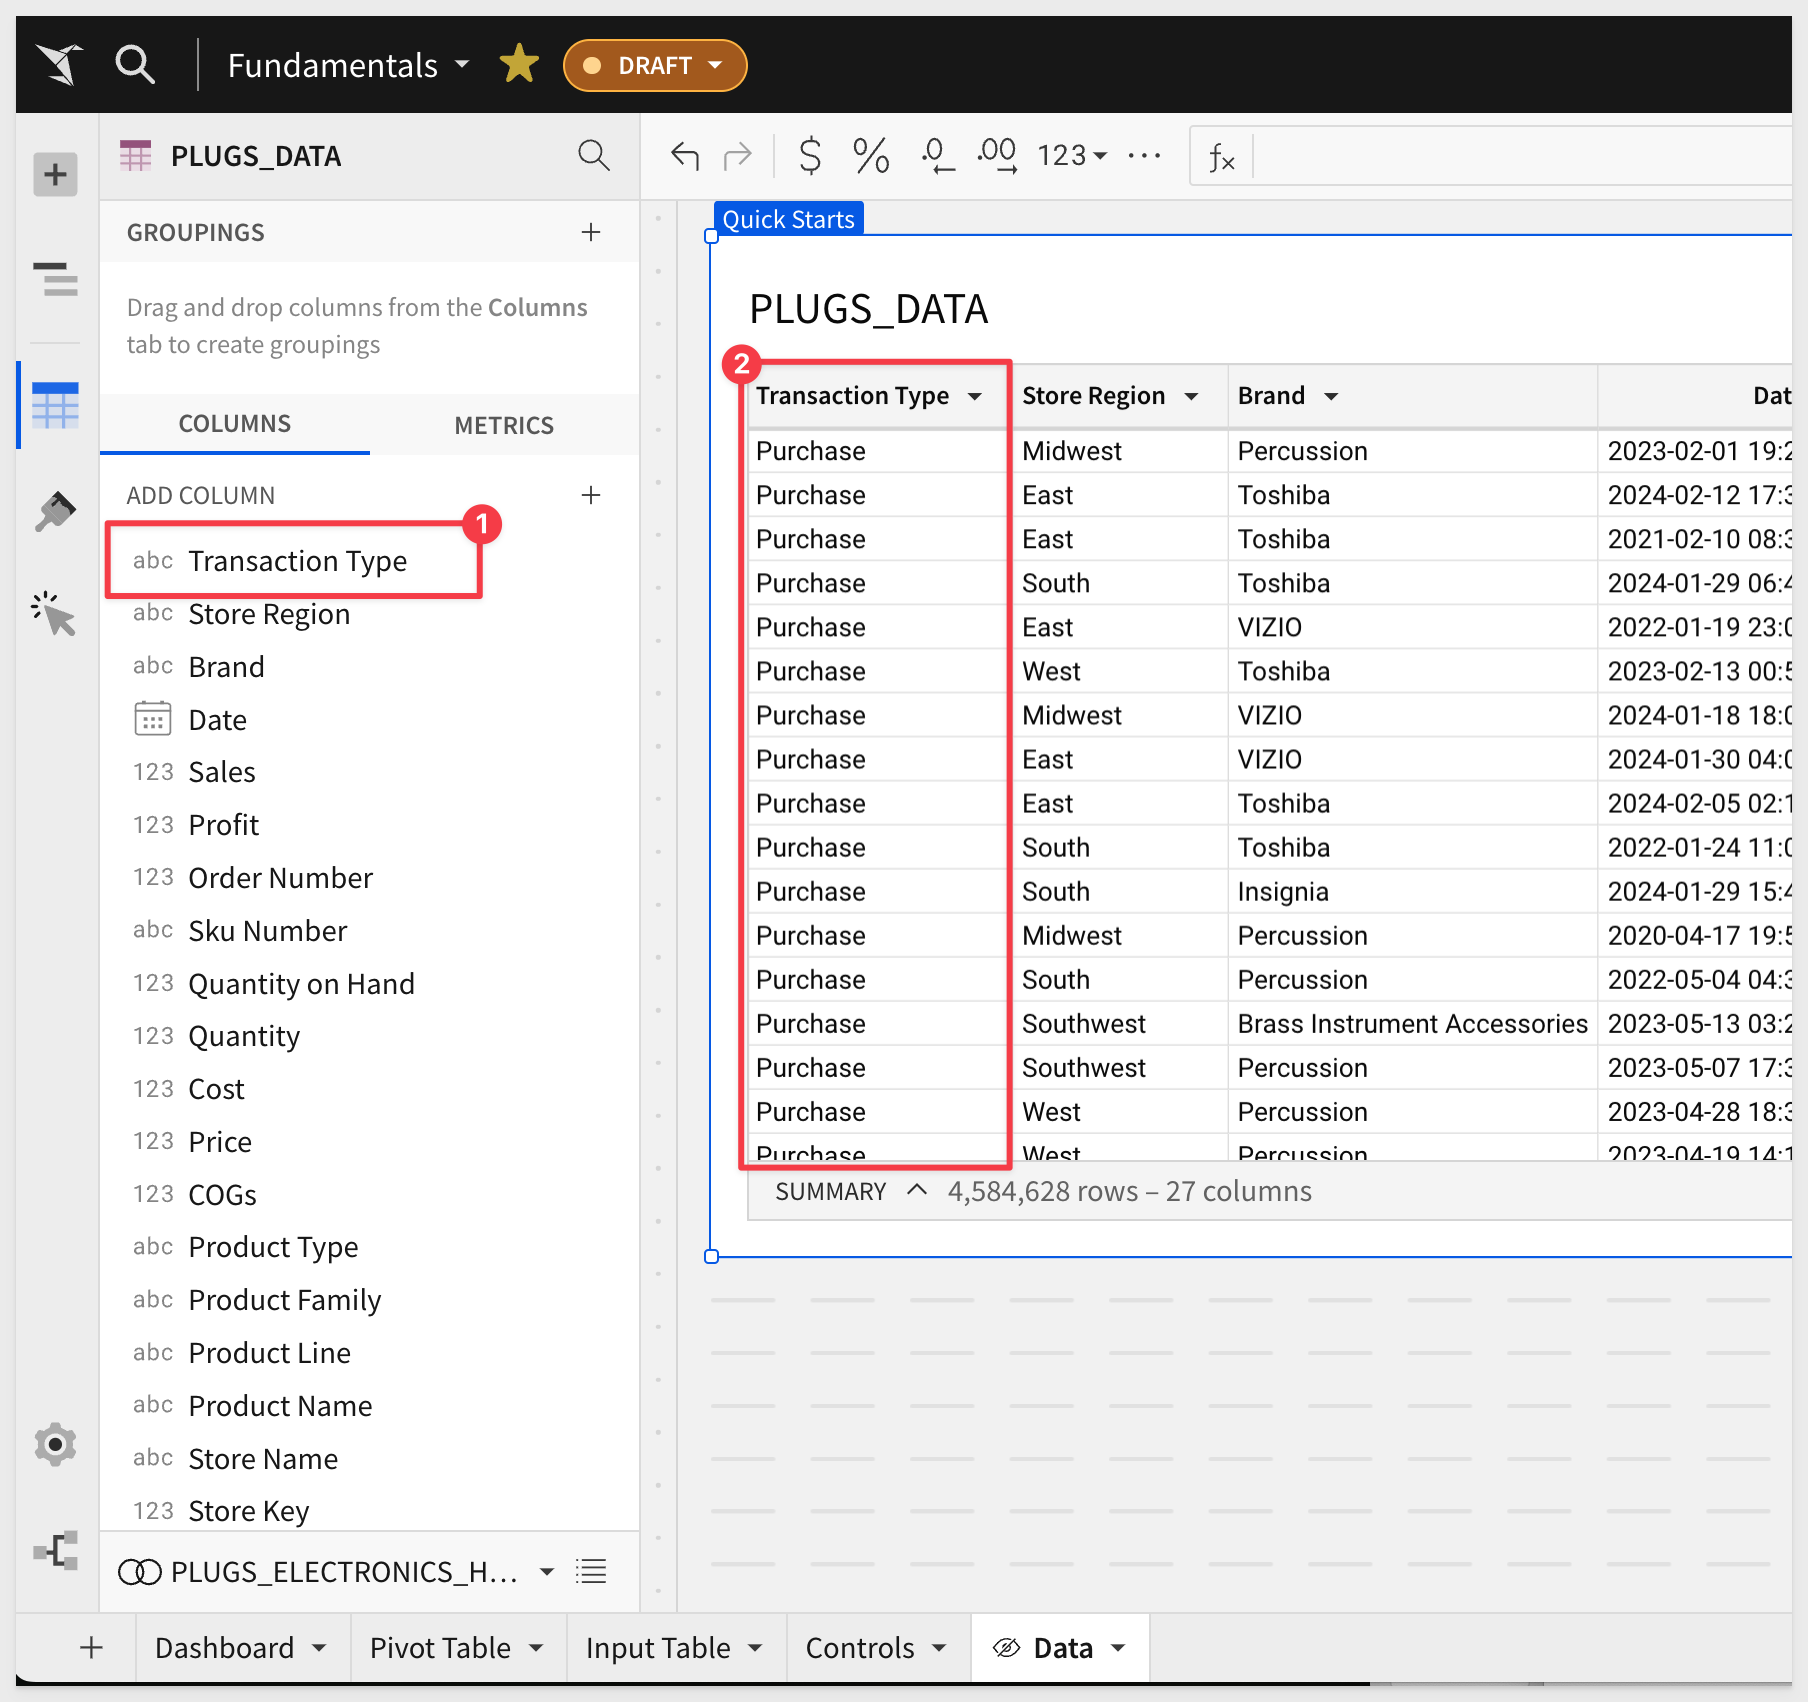
The column is added to the last position on the PLUGS_DATA table. We moved it to first column for the screenshot:
If we want to see the distribution of purchase to online transactions, we can look at column details:
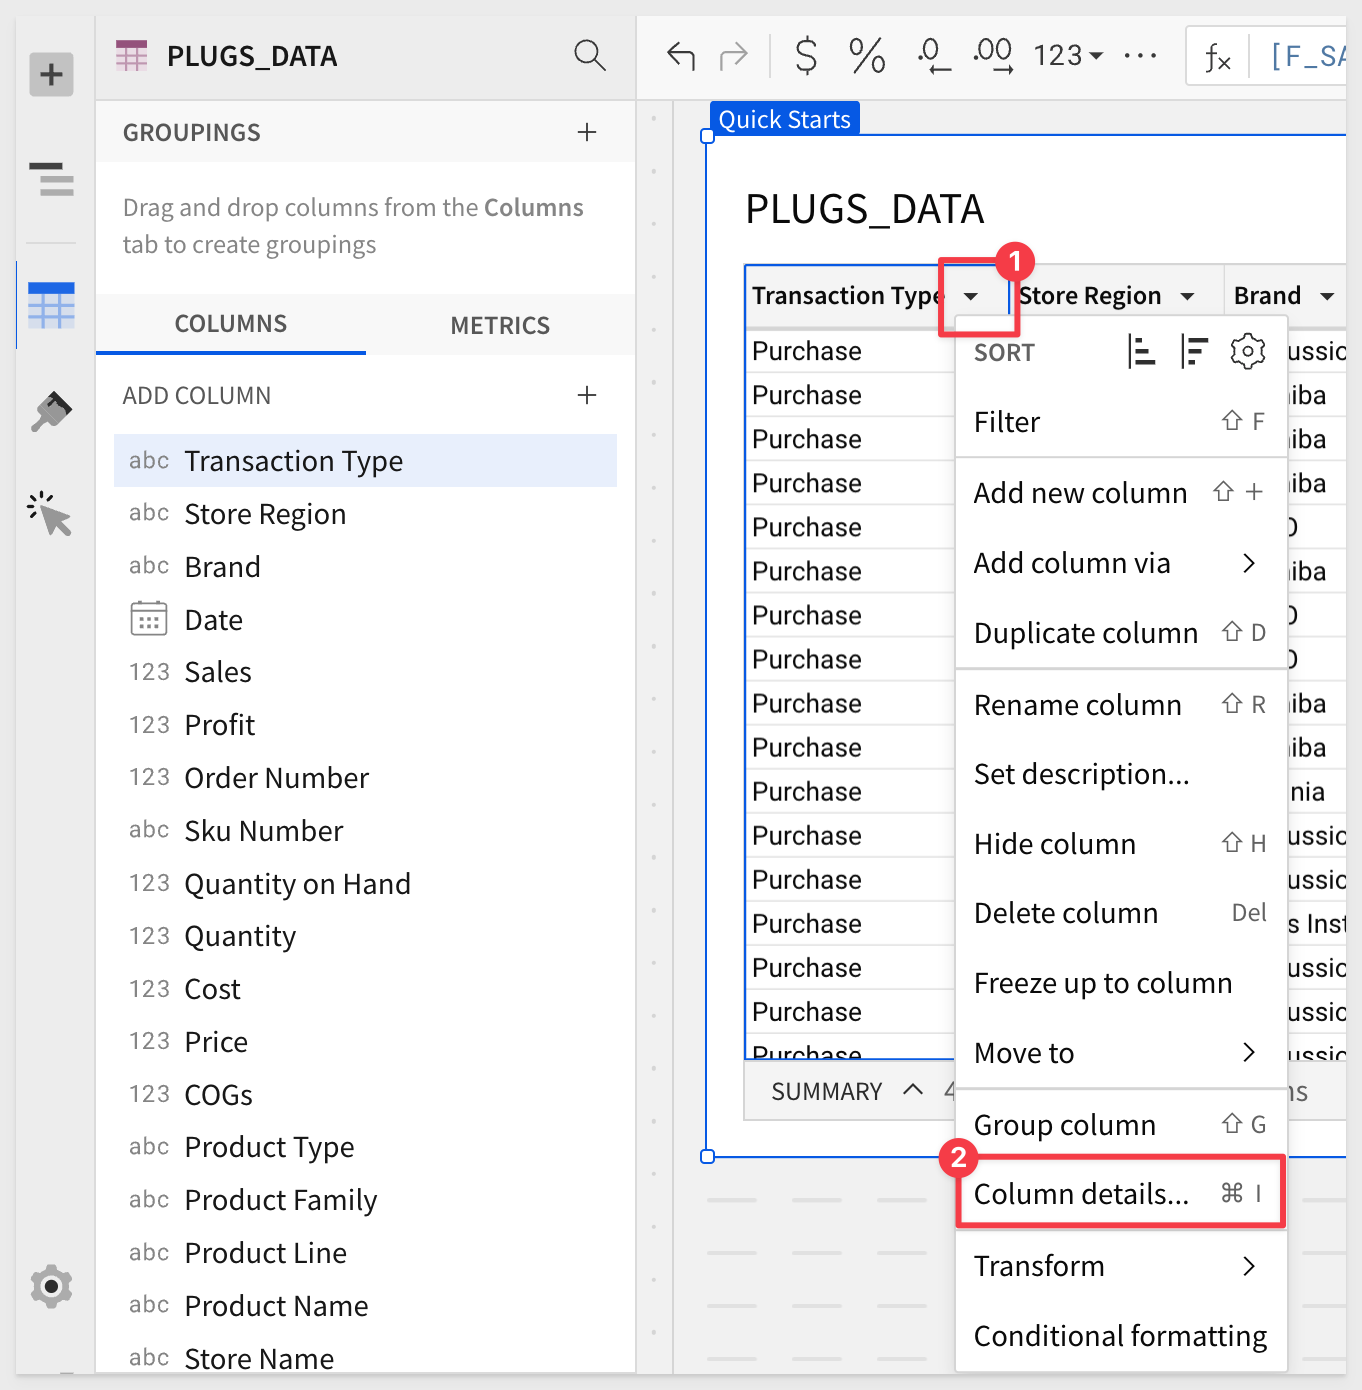
We can see the row counts for purchase and return. Now we know what to expect when we enable our switch control.
It is handy to know ahead of time what the row counts will be, so we know switch is working right when we implement that.
Close the details modal.
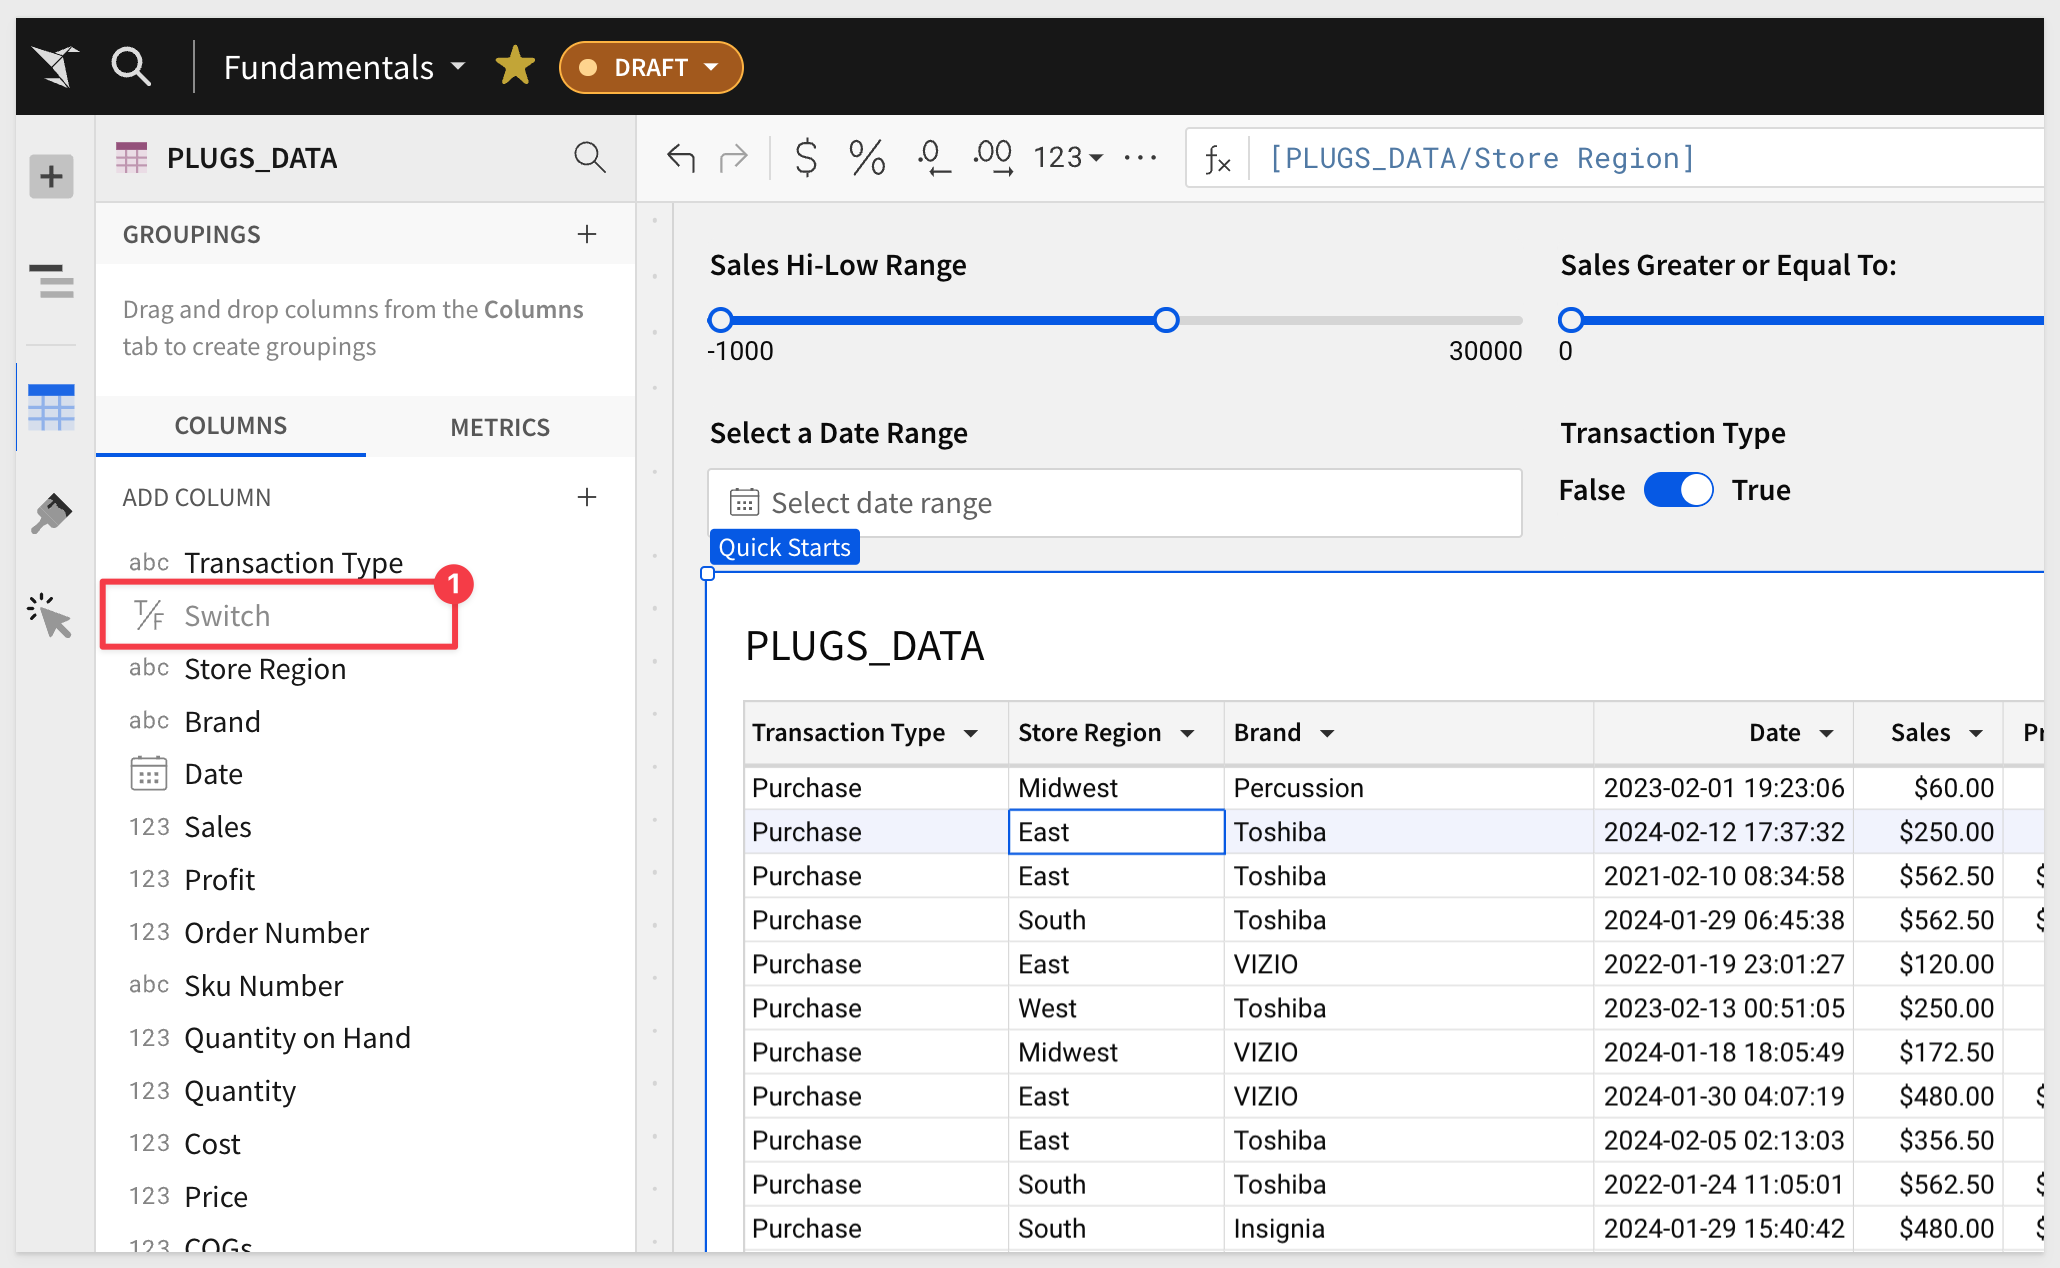
The last step is to expose the new column on the Controls page.
Open the PLUGS_DATA table column control on the Controls page and locate the Transaction Type column.
Check the box on so, that the column is made visible:
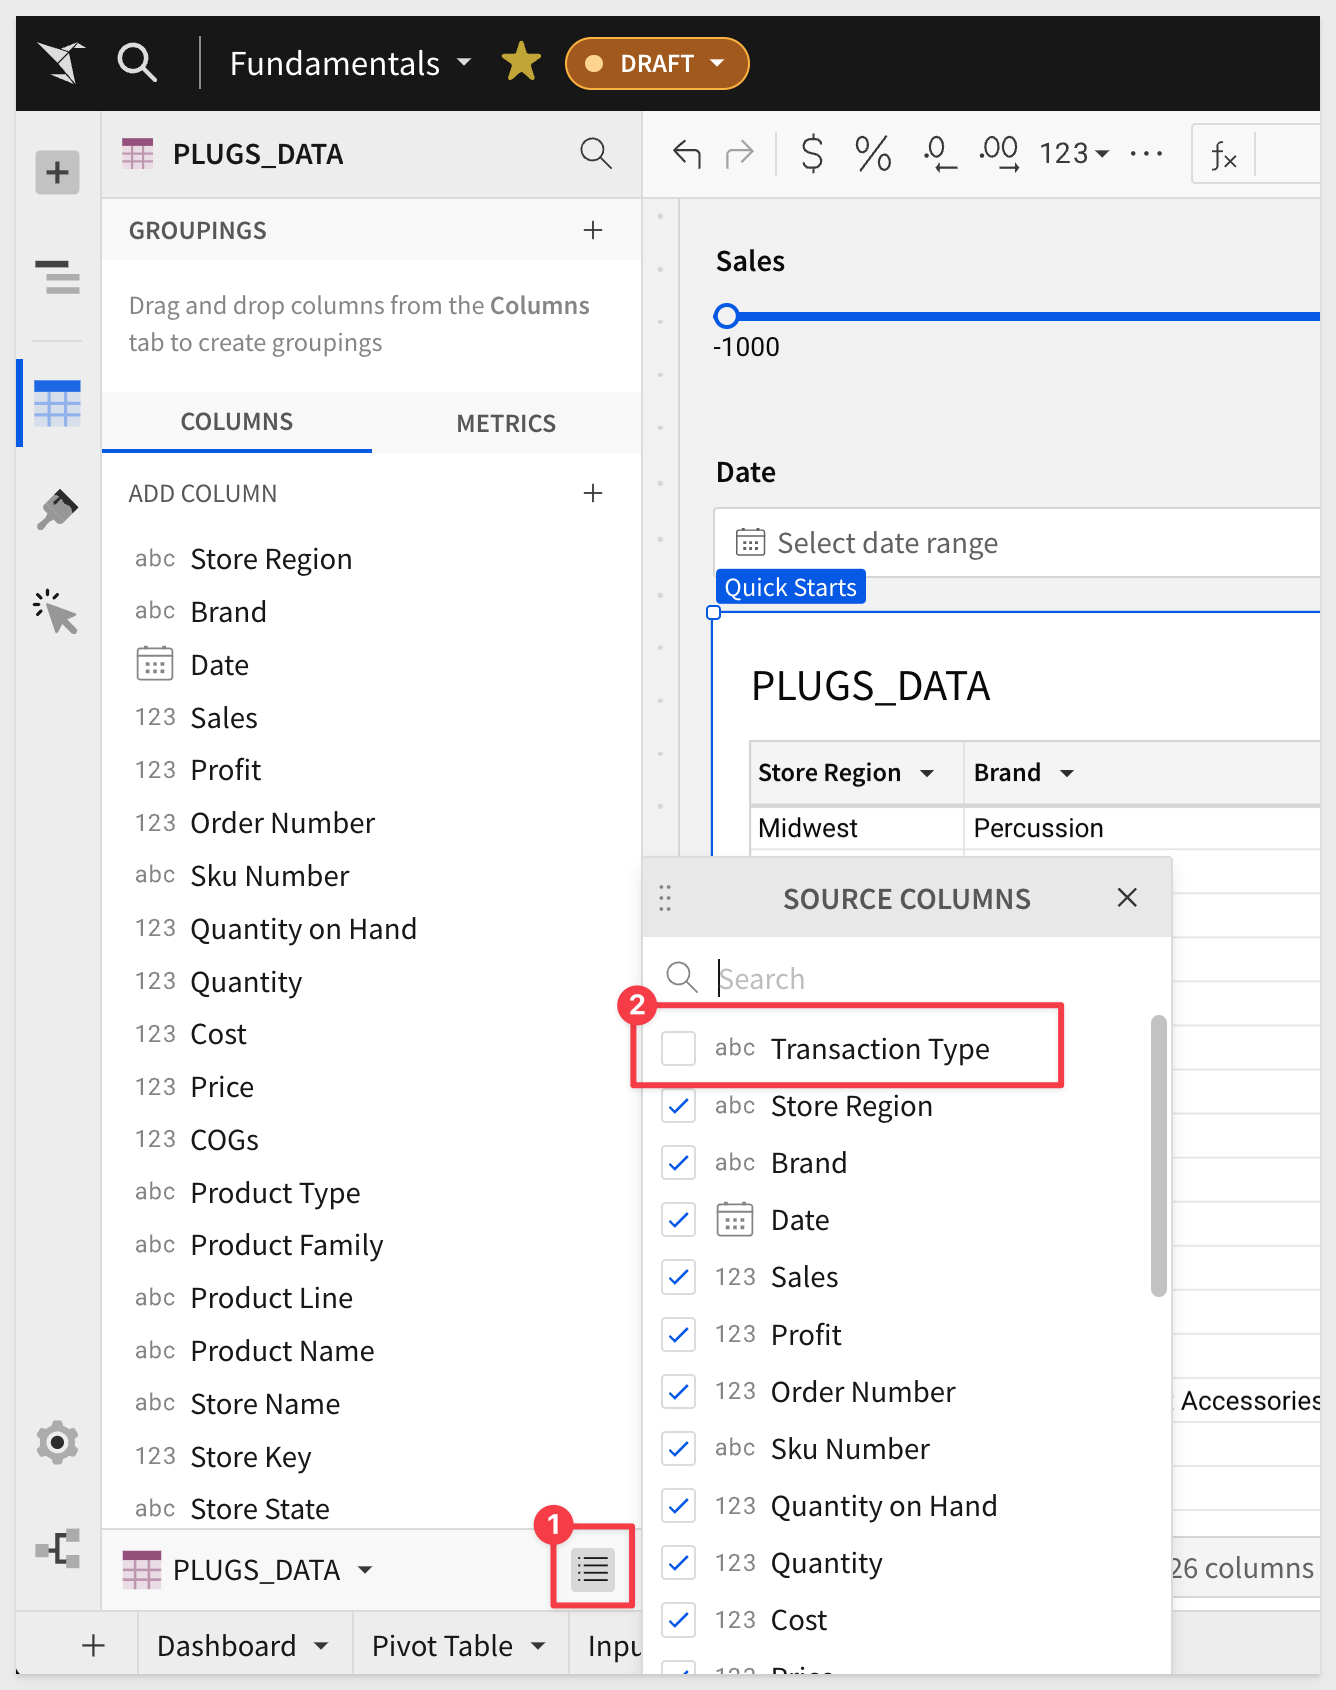
Drag the column to be the first column in our table.
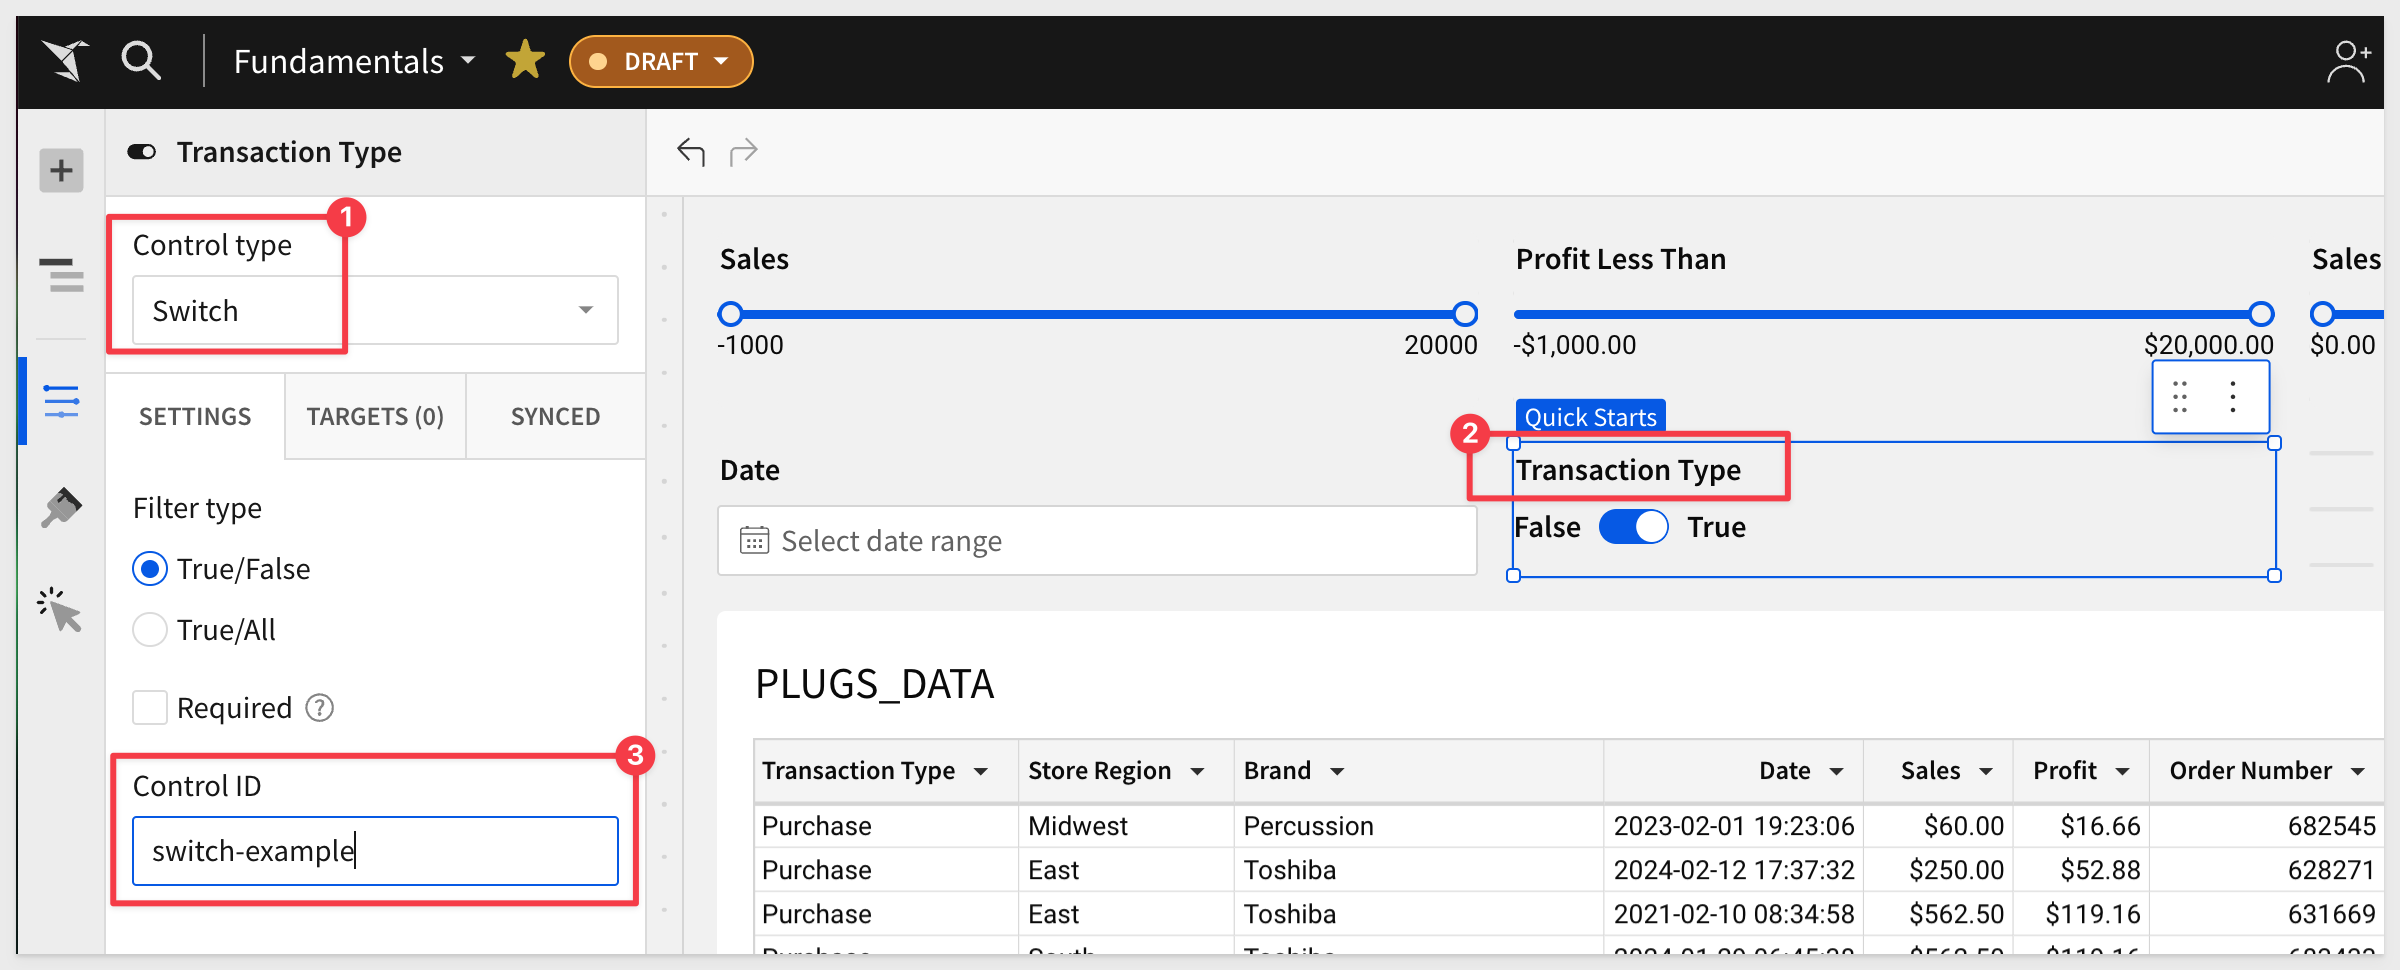
Add a Switch control to the page, rename it Transaction Type and set it's Control ID to switch-example:
We can now toggle the switch control on and off, but the table is "aware" of it yet.
We need to make the table respond to this controls value, as it is changed.
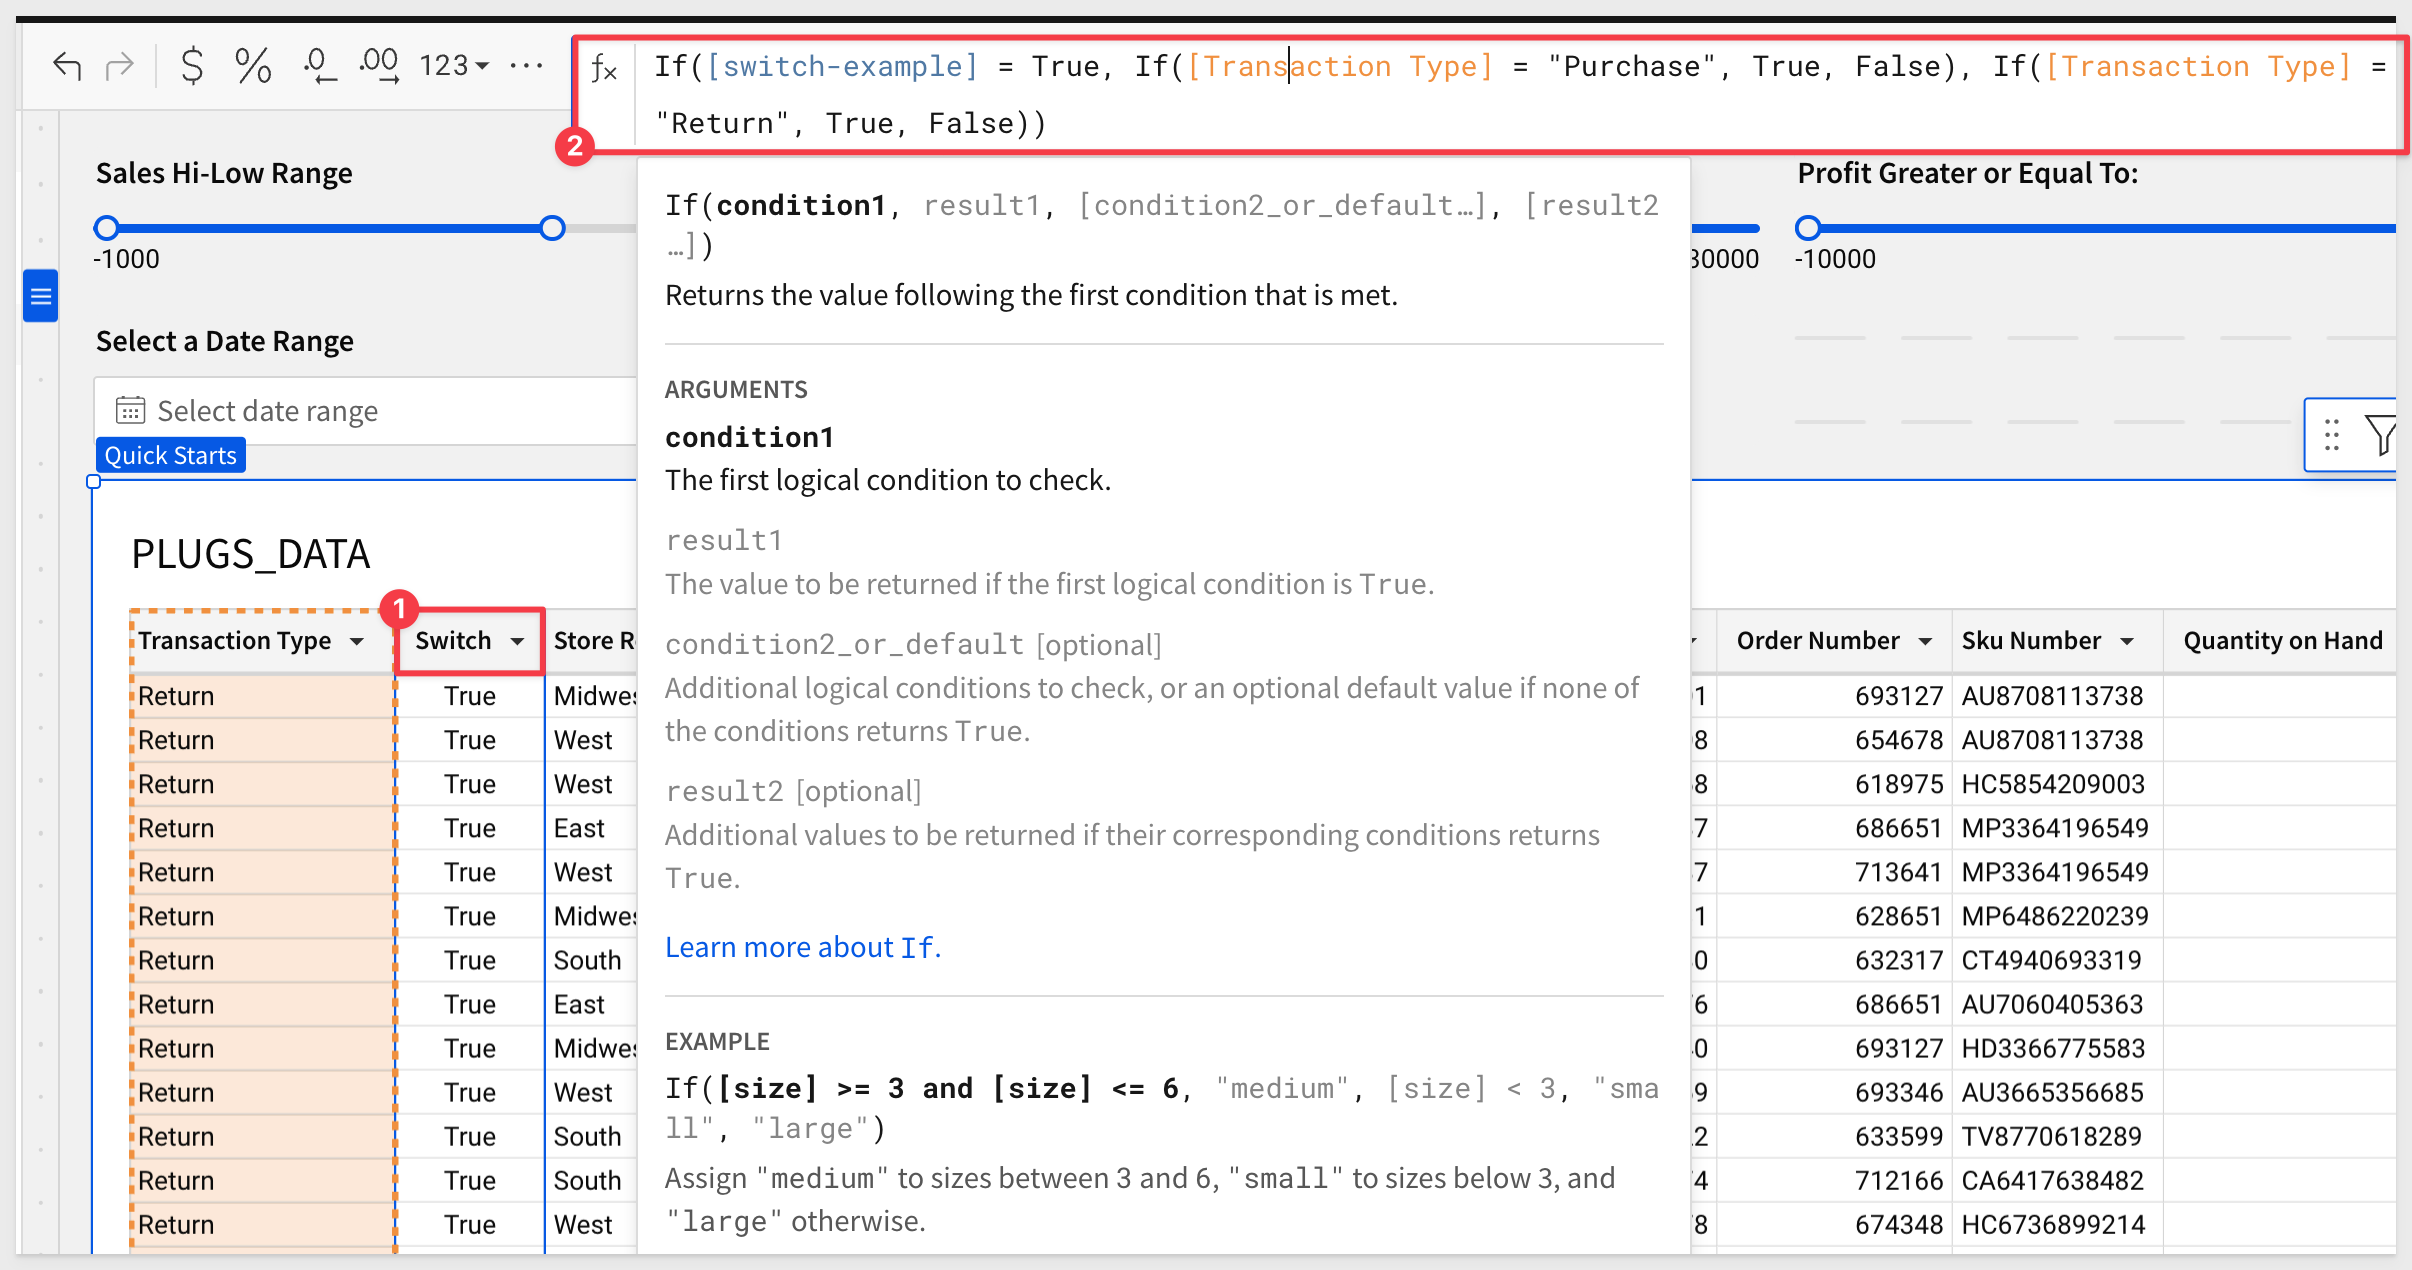
Add a new column next to Transaction Type, rename it to Switch and set its formula to:
If([switch-example] = True, If([Transaction Type] = "Purchase", True, False), If([Transaction Type] = "Return", True, False))
How It Works in Detail:
When [switch-example] is TRUE:
- The function checks if Transaction Type is "Purchase".
- If Transaction Type is "Purchase", the function returns TRUE.
- If Transaction Type is not "Purchase", the function returns FALSE.
When [switch-example] is FALSE:
- The function checks if Transaction Type is "Return".
- If Transaction Type is "Return", the function returns TRUE.
- If Transaction Type is not "Return", the function returns FALSE.

The last step is to add a table filter on the Switch column, so that it responds to changes of the control.
Be sure to select only the True value, as that is what the control should be set to while we create this filter:
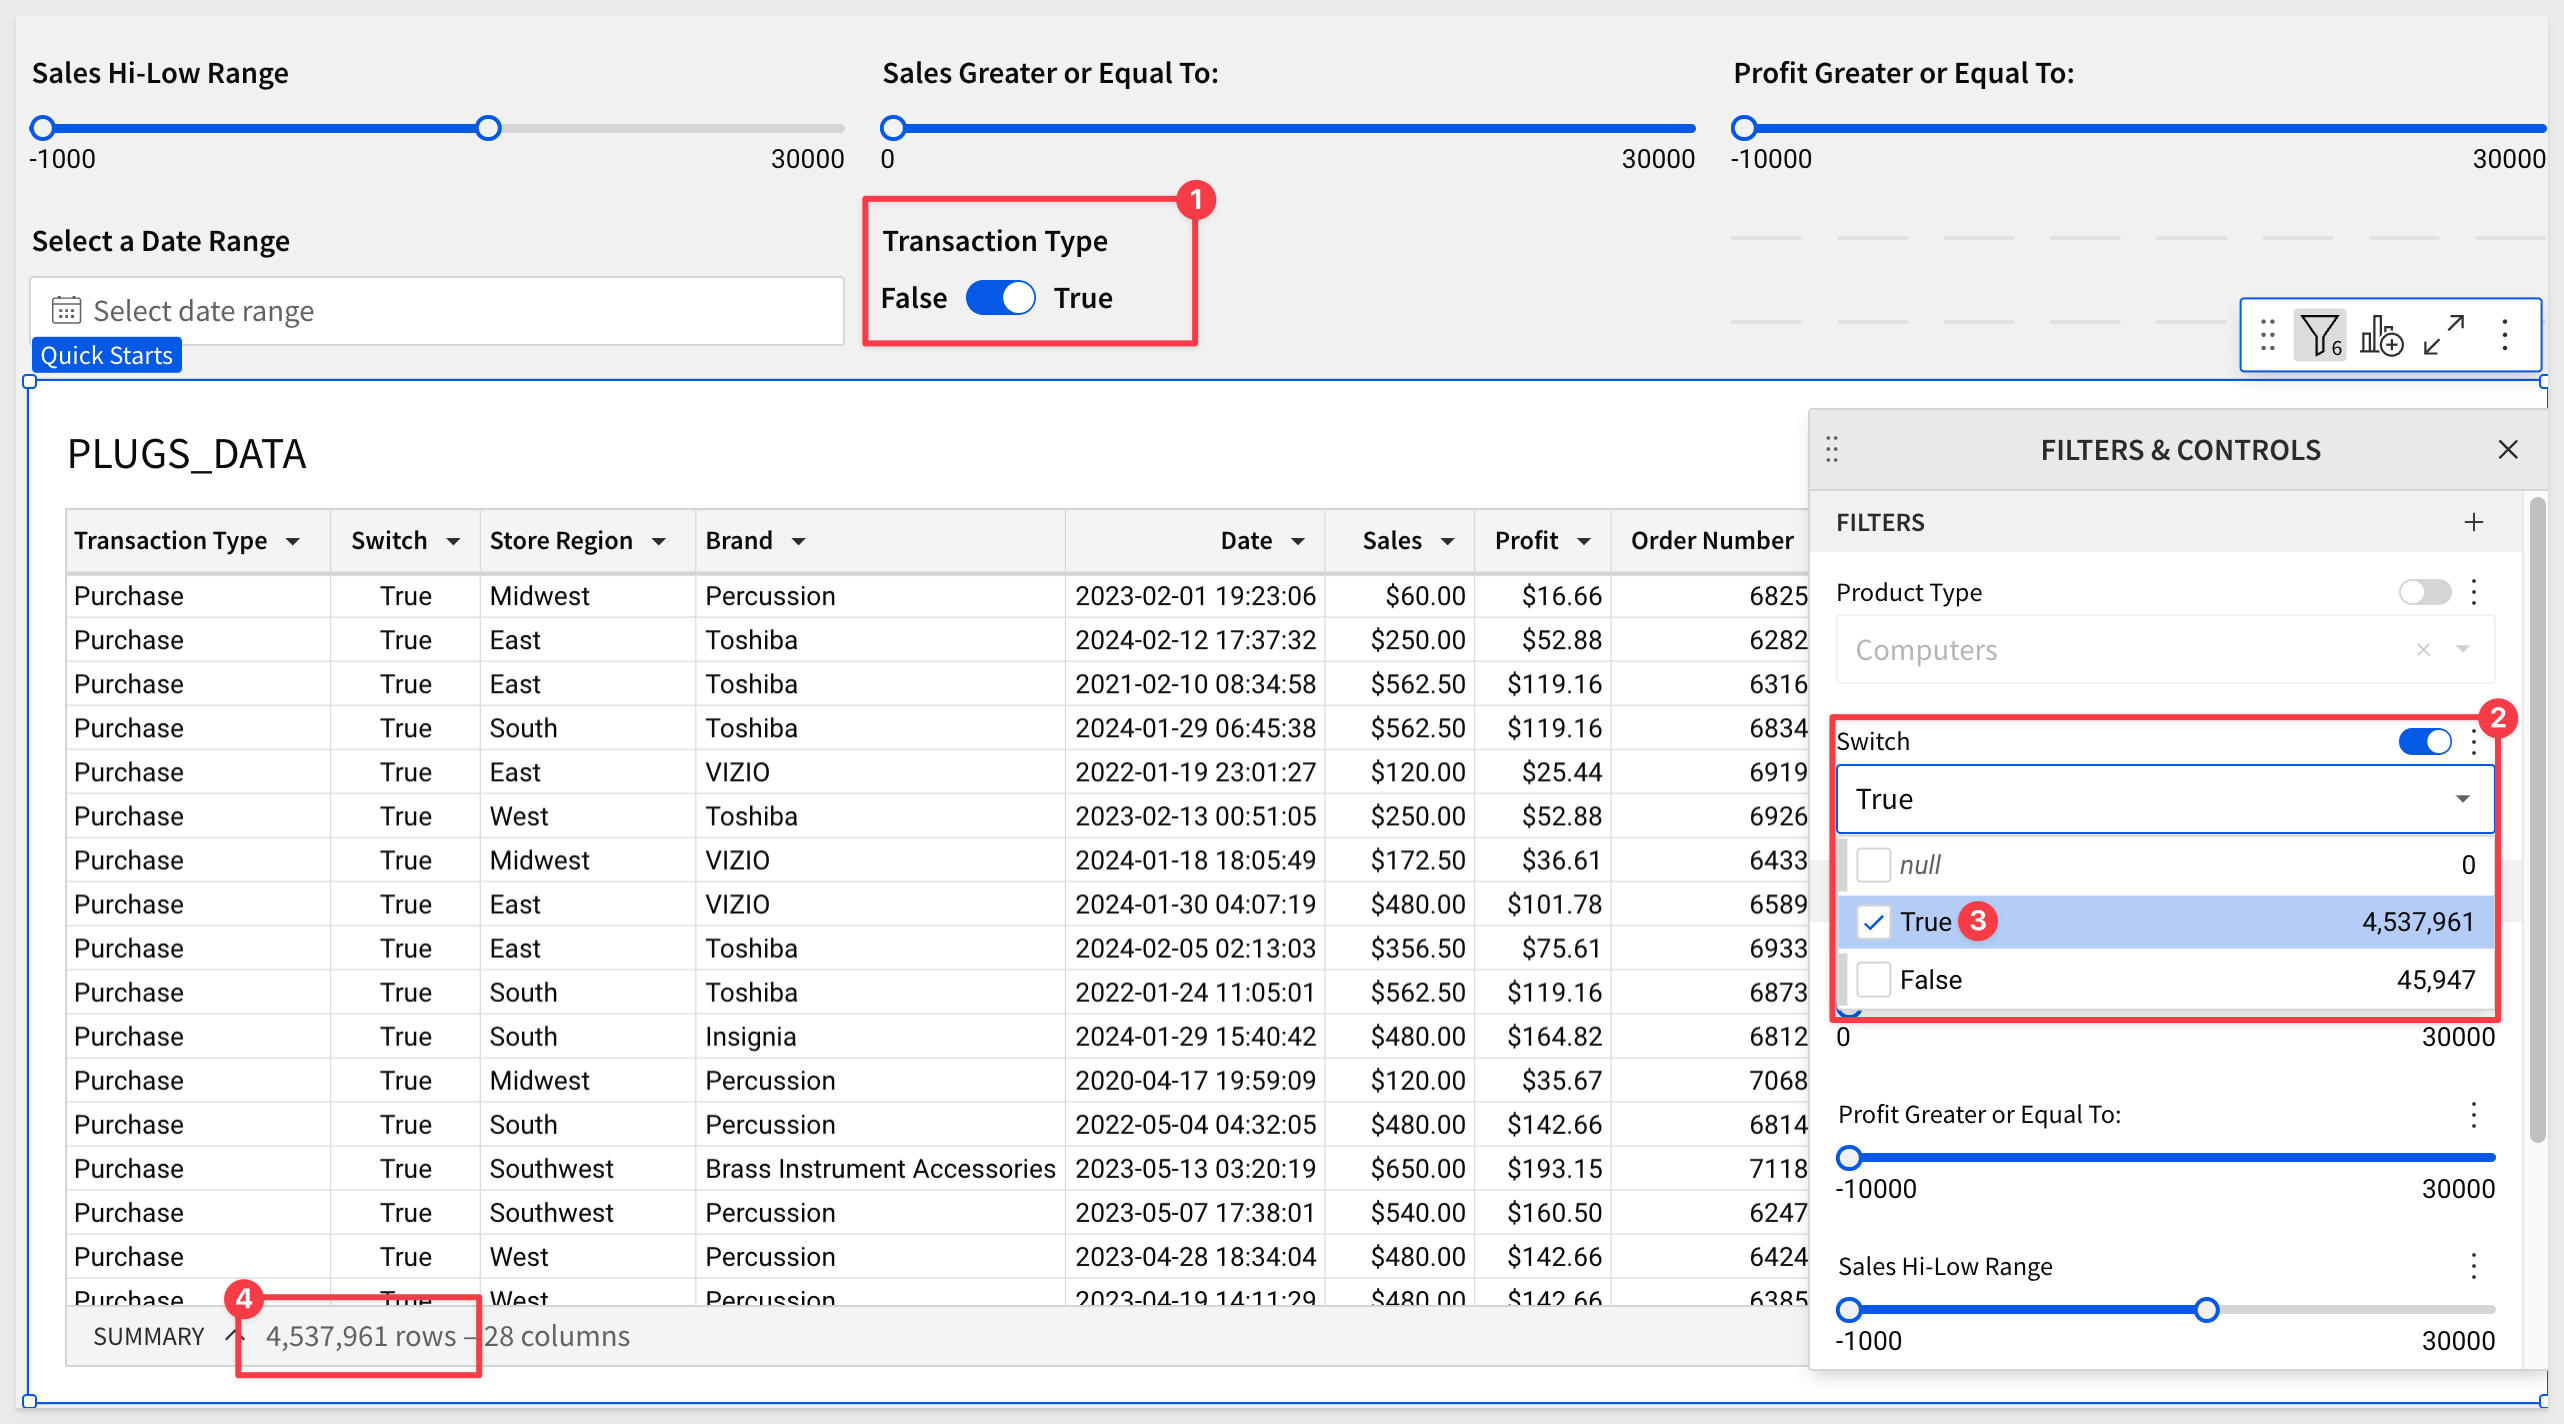
Now we can toggle between Purchase and Return transactions:
Hide the Switch column, as users do not need to see that:
Click Publish.
A Synced control is different than a Duplicate copy.
For example, you may want to track your organization's high-level sales data on one page and drill down into region-specific data on another.
If the same filter control targets elements on both pages, we recommend that you display the control on both pages; this enables you and your workbook's viewers to edit the control value from either page, instead of switching back and forth.
Add a new page and rename it to Synced Controls.
Add a Table to the page, using the PLUGS_DATA table on the DATA page as the source.
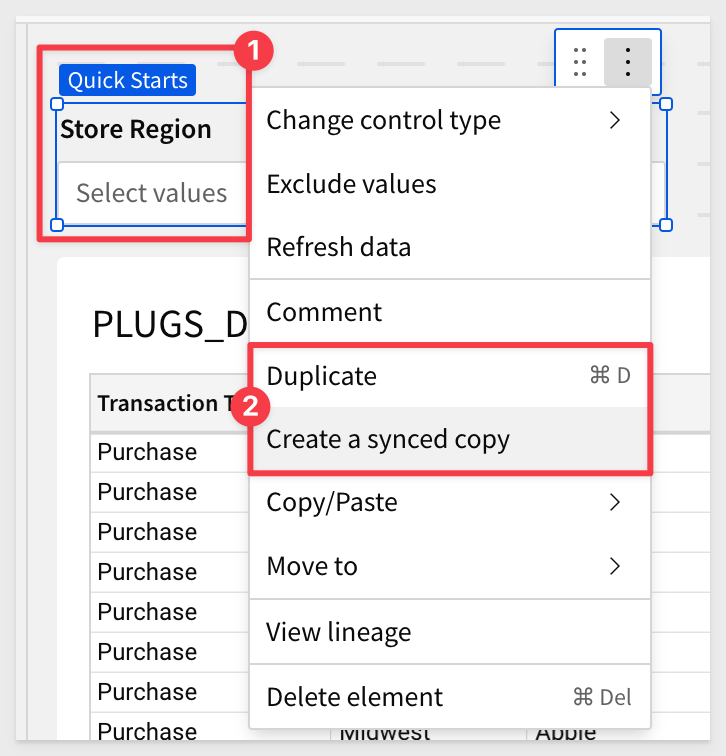
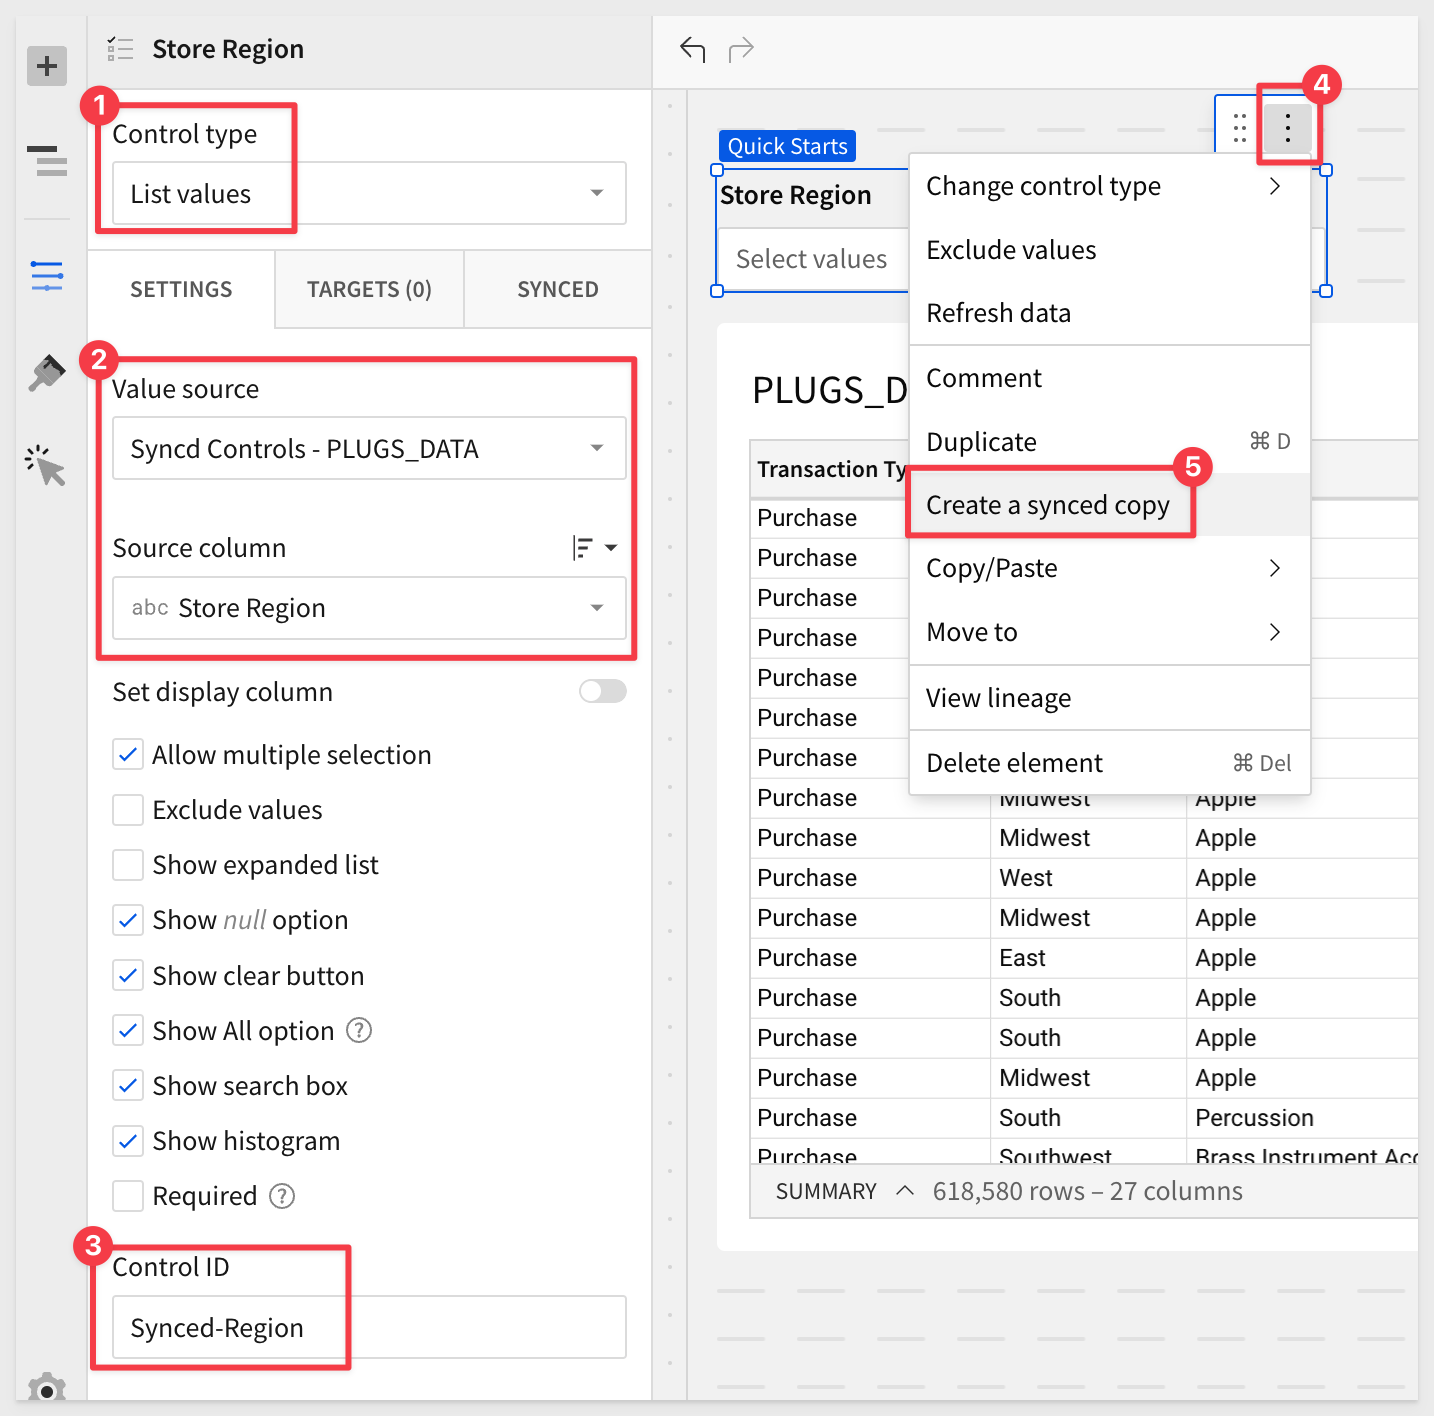
Add a new List control to the page and set it to use the PLUGS_DATA > Region column.
Set the Control ID to Synced-Region.
Now Create a synced copy from the Synced-Region control:
Now the second control can be moved to another page in the workbook, and be set to target some other element.
There are a few use cases where this functionality can be useful:
1: Two controls, one target.
2: Maintaining context across pages.
3: Preselecting control values for users.
To read more about synced controls, see here.
One of the "ah-ha" moments, is when users realize that controls can be created based on a formula too.
Lets explore that concept.
Add a new page and rename it to Formulas.
Add a Table to the page, using the PLUGS_DATA table on the DATA page as the source.
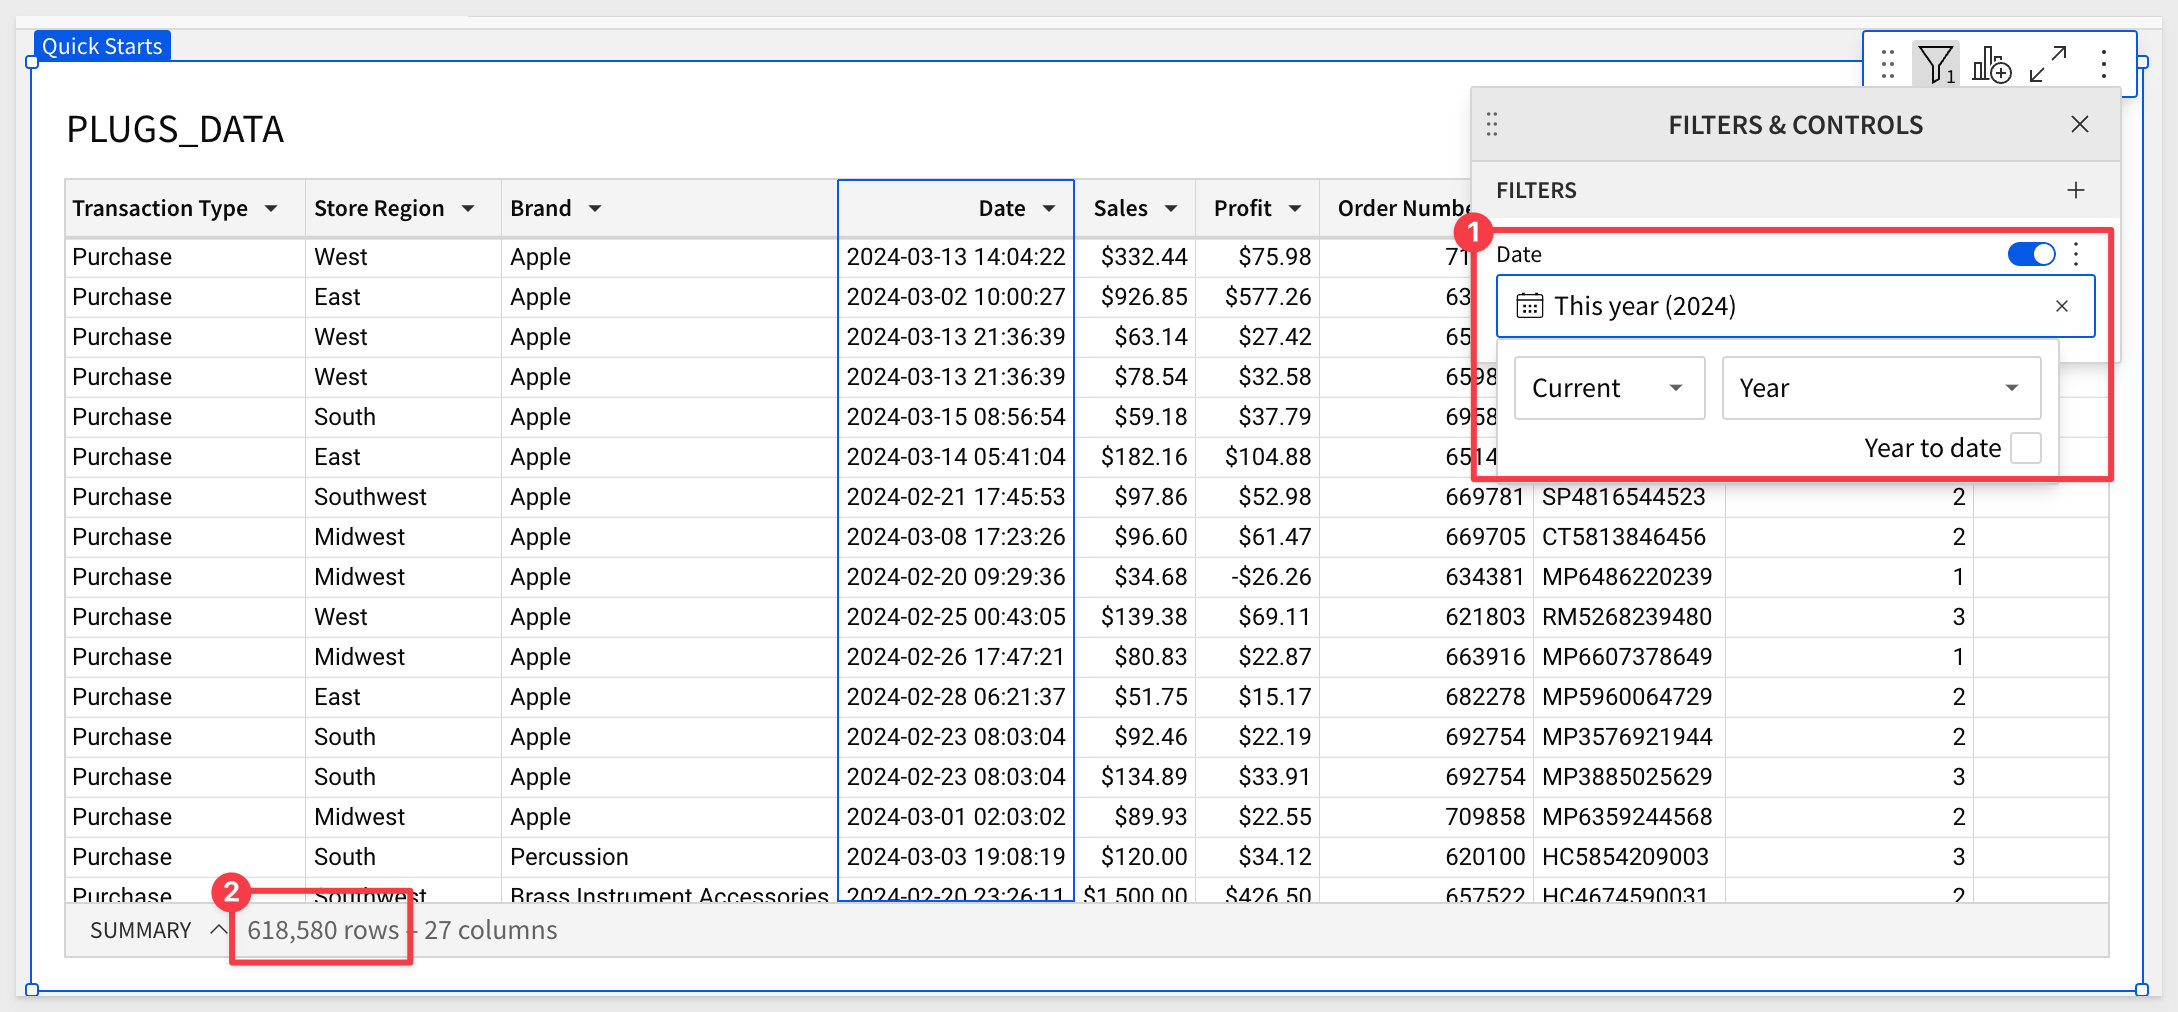
For this exercise, lets reduce the available data down so that refresh is as fast as possible.
Filter the Date column to the current 1 year only, to reduce the data to around 600k records.
Add a List control to the page and configure as:
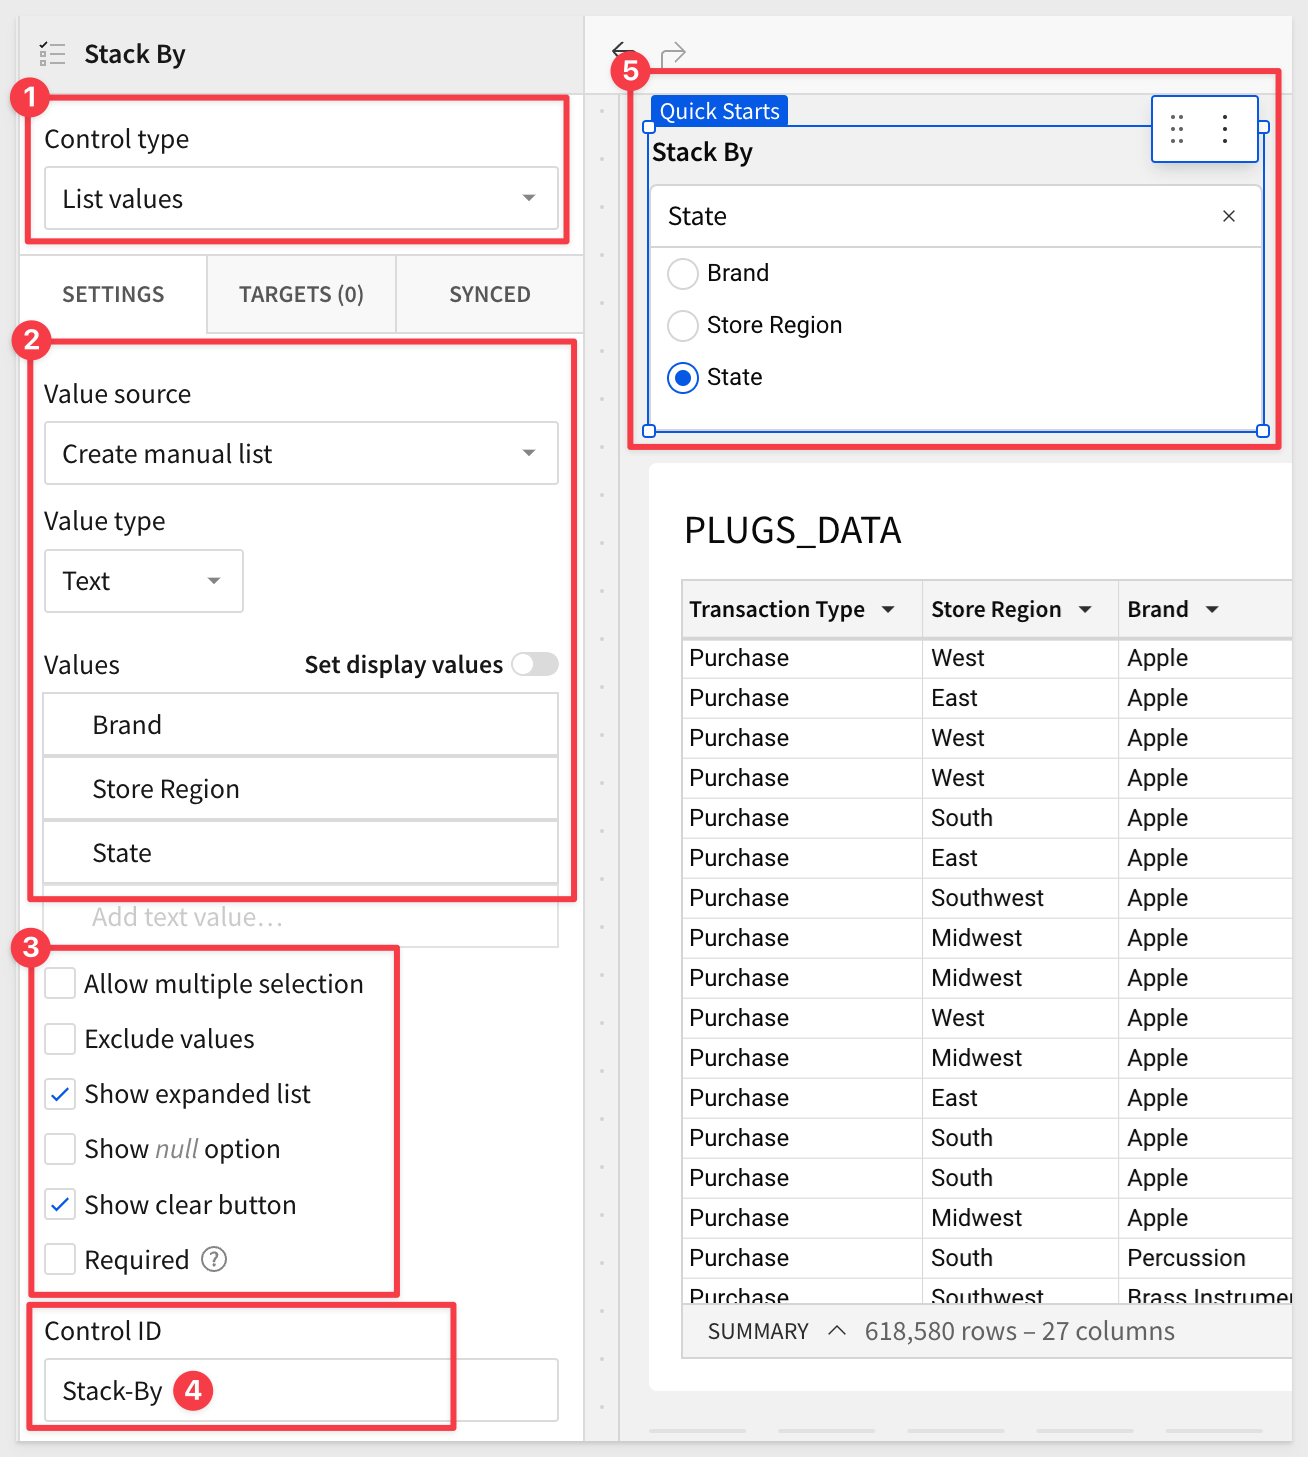
Make sure the Control ID is set to Stack-By; we will reference that in our formula, so syntax matters.
Add a new column to the table, in the first position. Rename it to Stack By and set it's formula to:
Switch([Stack-By], "State", [Store State], "Store Region", [Store Region], "Brand", [Brand])
This formula will change the Stack By columns value, based on the selection made in the control.
As a last step, we can Group the table by Stack By. How slick is this!
Click Publish.
In this QuickStart, we covered the the variety of the more popular controls provided by Sigma. We explored using them to manipulate sample data and demonstrated just how easy it can be to solve business problems.
For more information on Sigma controls, see here.
The next QuickStart in this series covers administration in Sigma.
Additional Resource Links
Be sure to check out all the latest developments at Sigma's First Friday Feature page!
Help Center Home
Sigma Community
Sigma Blog