This QuickStart is part of a series of QuickStarts designed to instruct new users on how to use the variety of controls Sigma offers.
Control elements (controls) and data elements work hand-in-hand in Sigma.
Data elements display the data (e.g., tables or charts), and controls manipulate the displayed data by filtering and/or using parameters.
Controls are basically filters, and sometimes the terminology is interchangeable.
The line gets blurred more since controls can also be used as parameters.
To read more about creating flexible reports with parameters, see here.
If you already completed QuickStart fundamentals 1-5, you have already used controls.
In Fundamentals 2 - Data, we created a filter directly from a table column (Store Region), and converted that filter into a page control. This control is an example of a List control.
Selecting the correct control is often more art than science, as there are many controls to choose from.
In general, if using the control is obvious to the user, requires the minimum number of clicks, and produces the desired results, it is a good choice.
For more information on Sigma's product release strategy, see Sigma product releases
If something is not working as you expect, here is how to contact Sigma support
### Target Audience The typical audience for this QuickStart includes users of Excel, common Business Intelligence or Reporting tools, and semi-technical users who want to try out or learn Sigma.
Prerequisites
- A computer with a current browser. It does not matter which browser you want to use.
- Completion of the QuickStarts Fundamentals 1 and 2.
- Access to your Sigma environment. A Sigma trial environment is acceptable and preferred.
- If you have not already, you can sign up for a Sigma Trial here:

Open the Fundamentals workbook created in earlier fundamentals QuickStarts.
Add a new page and rename it to Fundamentals 6.
Add a new Table from the Element bar and set the source to the Plugs_Store_Sales table on the Data page.
Opening the Controls group in the Element bar, we can see that there are many different controls available:
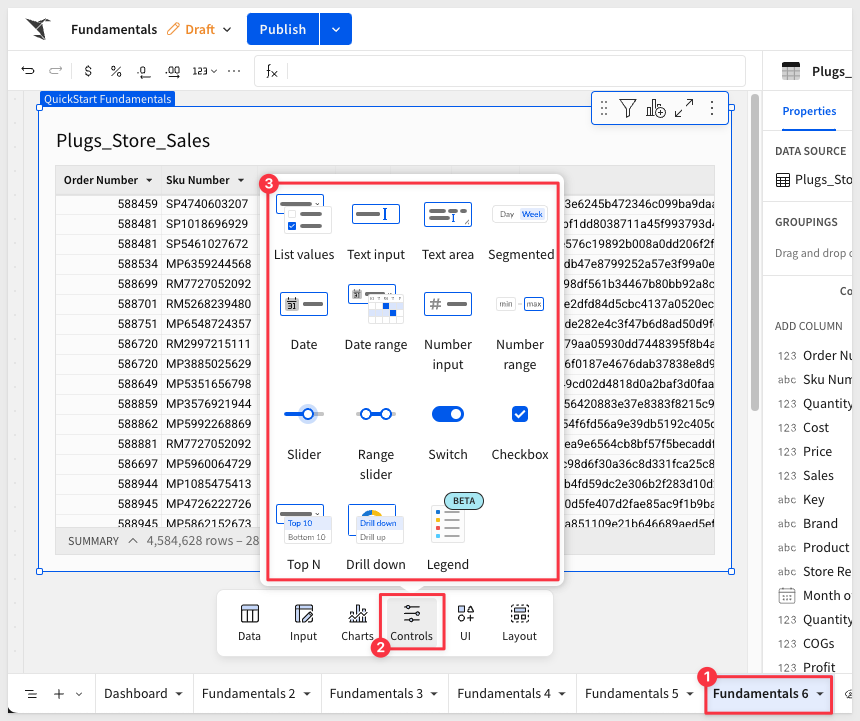
The process for adding and configuring any control to the canvas is very similar, regardless which control is selected.
The slider control enables users to select a single value from a continuous range by sliding a handle along a track.
Add a new Slider control to the page
Configure the control:
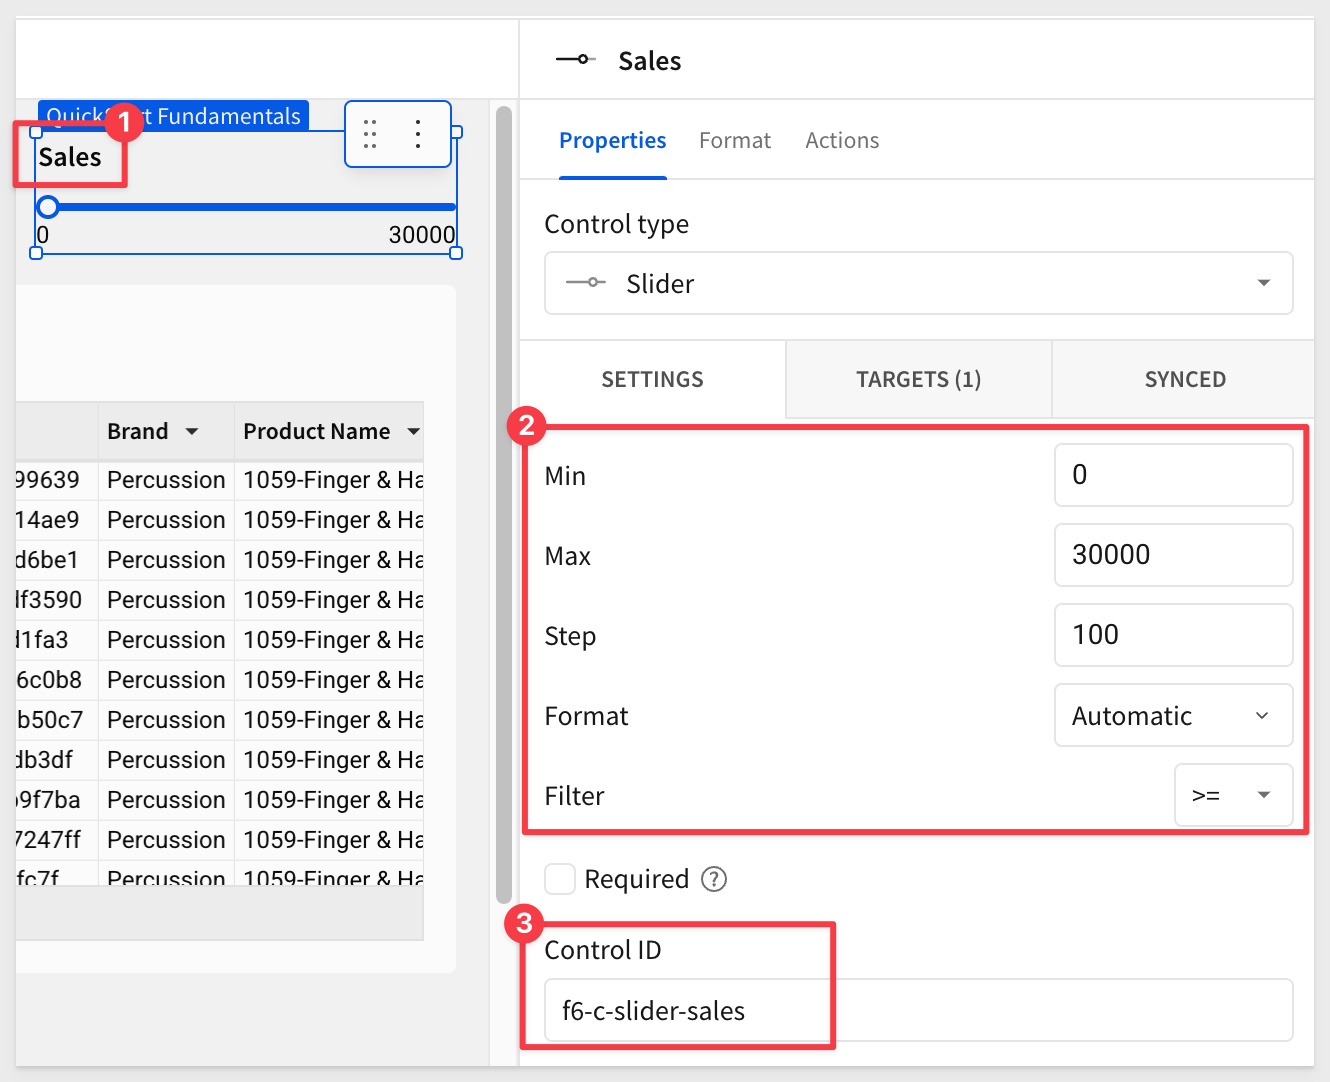
Pay attention to the setting for Control ID. The value used uniquely identifies the control and allows it to be used in formulas, actions and other areas of a workbook. It is a good practice to select a pattern that makes sense to you and others and stick with it.
For example, we used f6-c-slider-sales, which we translate to "the slider control on the Fundamentals 6 page that targets the sales column."
Set the Target of the control to the Fundamentals 6 > Plugs_Store_Sales table:

Select the Sales as the column to target.
Slide the control to around 20k. These "big-spender" customers might make a good list for a marketing campaign:
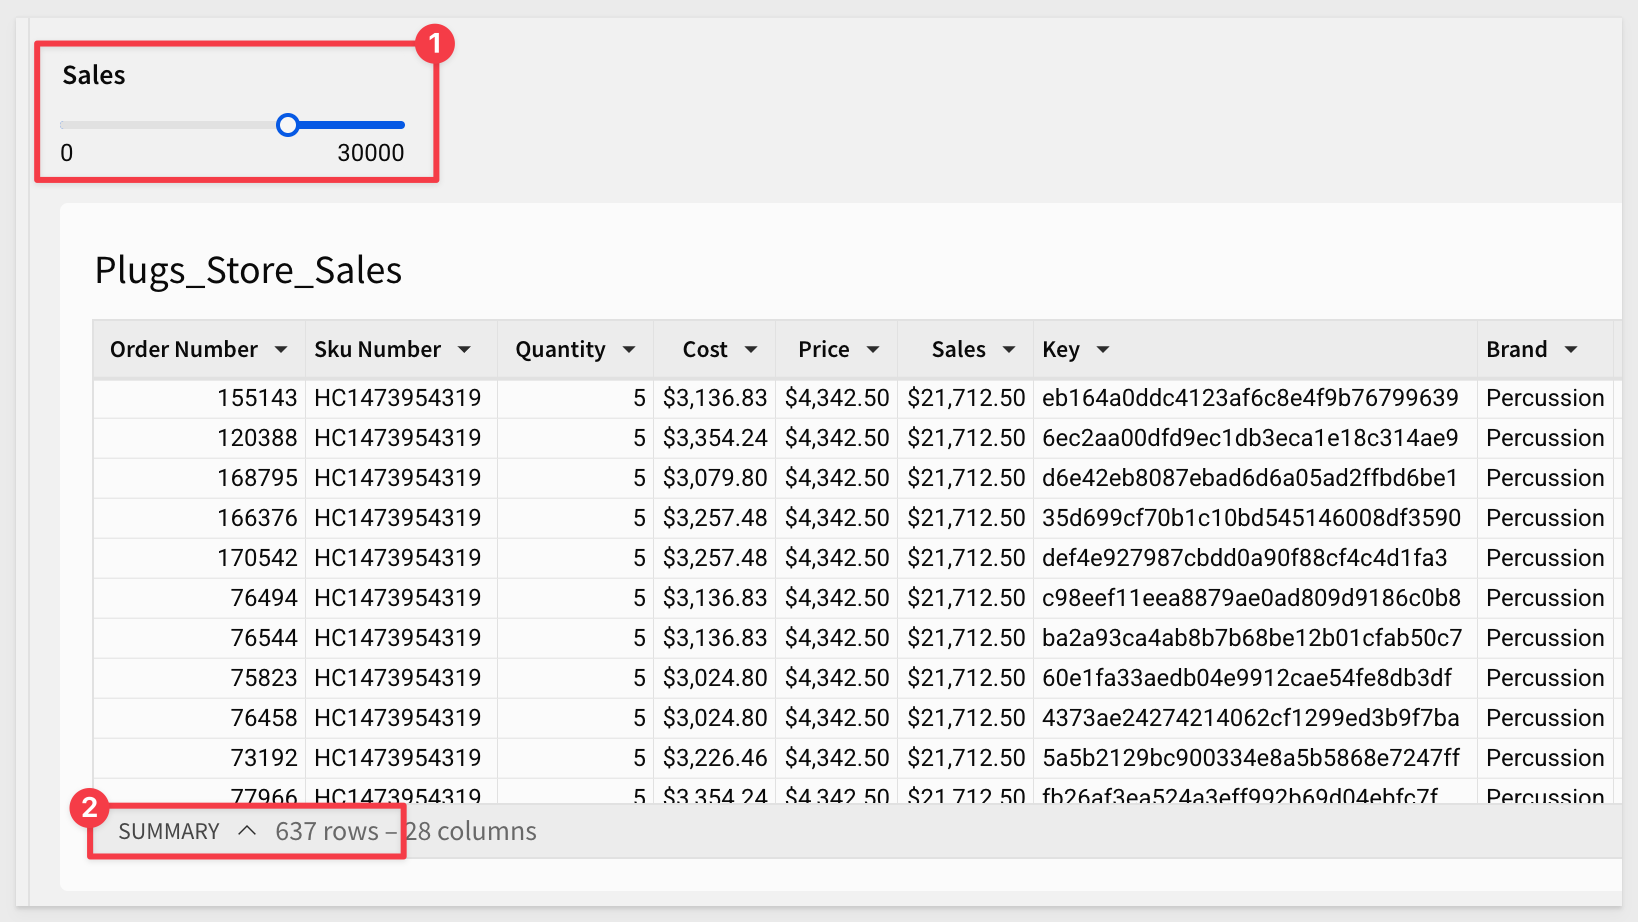
However, big spend does not always mean big profit. We should evaluate for both to refine our marketing target list.
Duplicate controls
Sigma makes it really simple to add copies of existing controls, saving you time.
Let's say we want to also get all the rows sold at high margin, amongst the list of "big spenders".
Open the slider control's menu and click Duplicate.
Drag the control to be side-by-side with the Sales control.
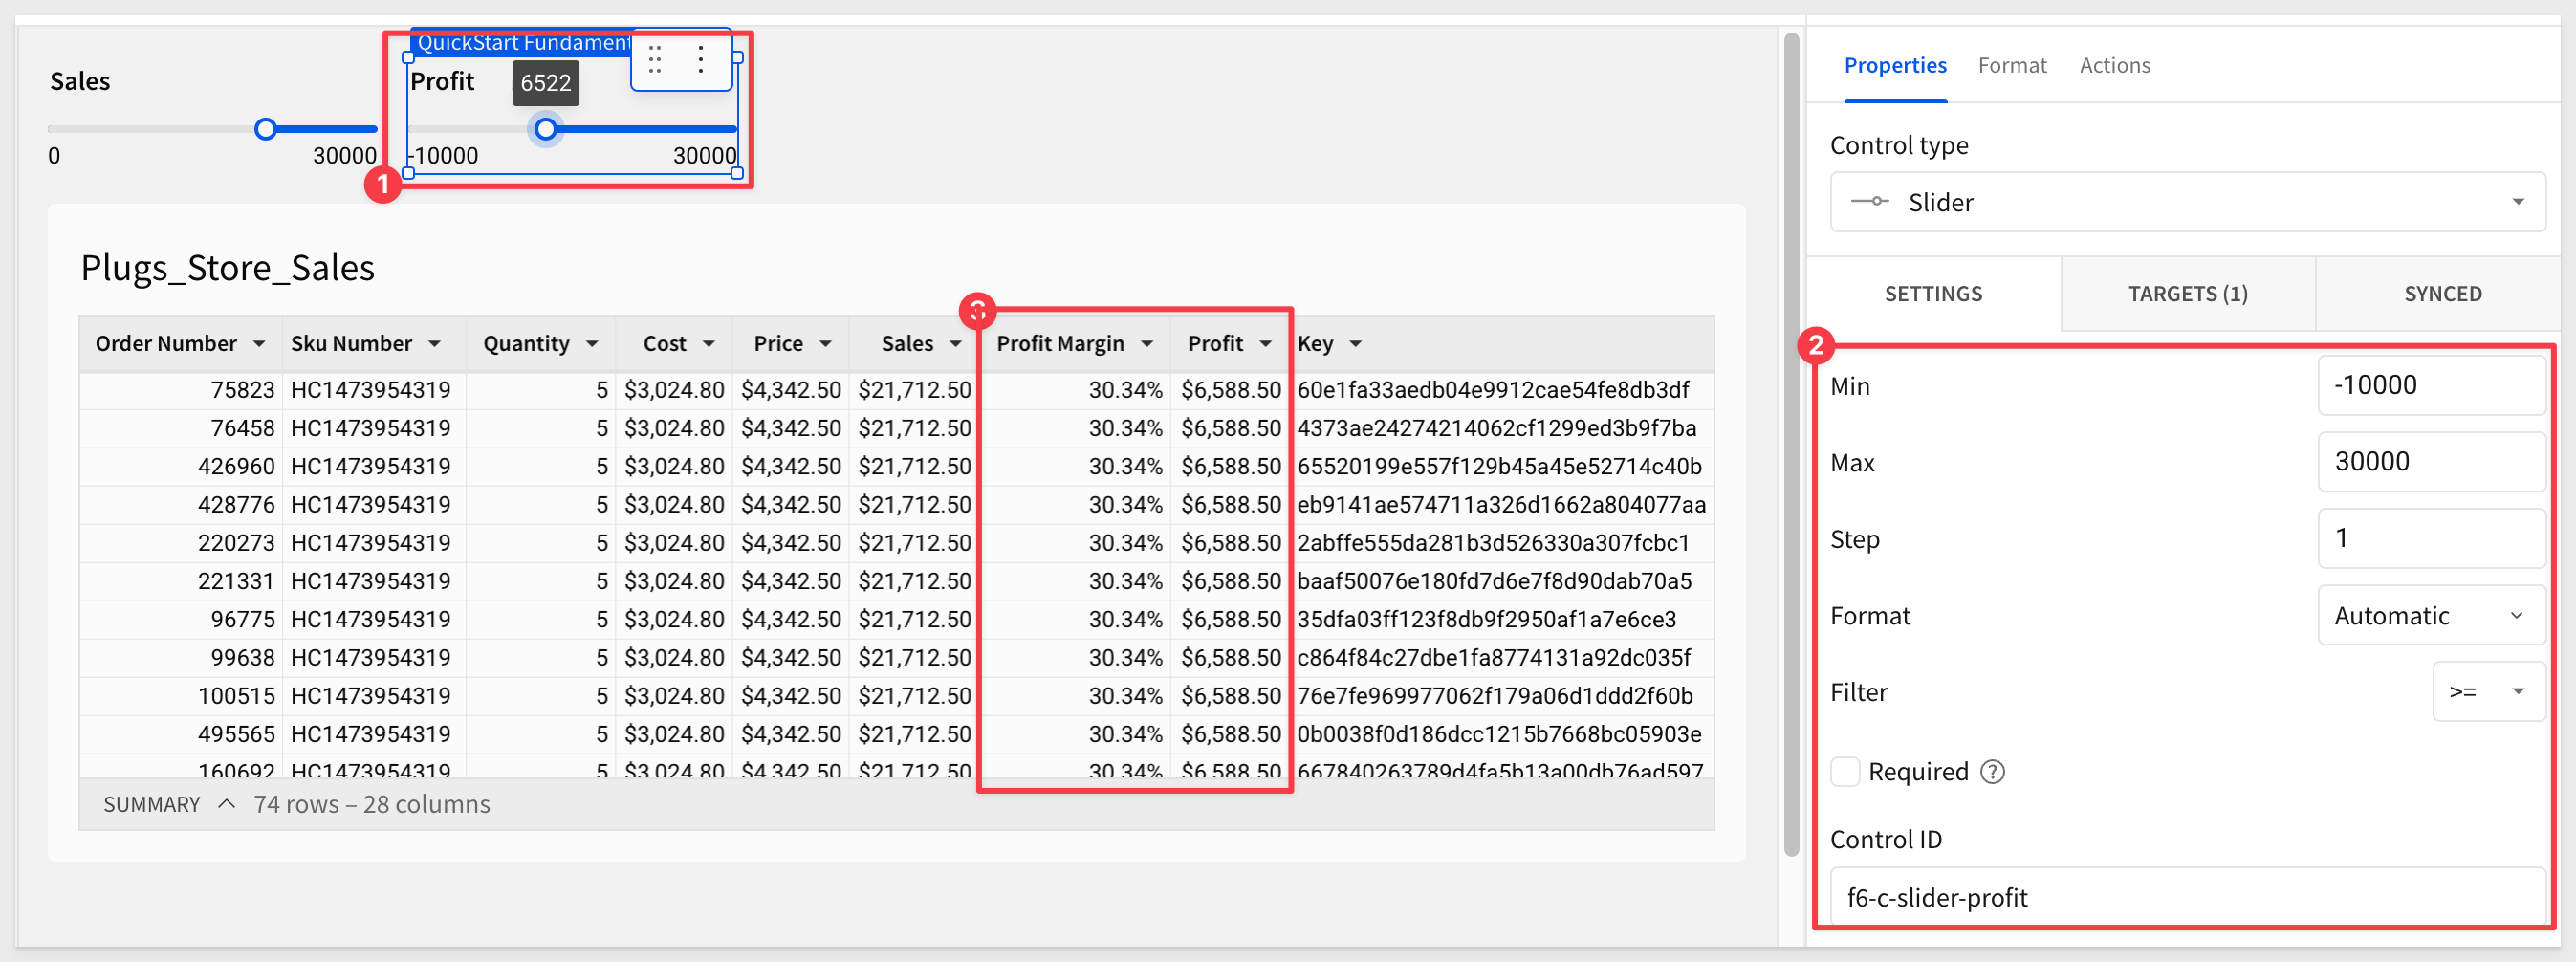
Configure the slider to allow the user to quickly return all the orders with a profit greater than (or equal to) the value configured.
Modify the target for the new control targets the Plugs_Store_Sales table > Profit column and rename the control to Profit.
We checked and found there are some orders sold at big losses, so we set the minimum value to -10,000 for the Profit slider.
Also set the Control ID for Profit to profit-slider.
Now adjust the Profit slider to be around $6500. These are our target high-value customers:
Sanity Check
When creating controls, it is always a good idea to make sure the row counts are what is expected.
We want to ensure that we did not inadvertently create a filter that does not initially show all the rows, based on its configuration (unless that was intended).
We would expect the table to have the same row count as our un-filtered source table, and it is easy to compare the two, as a quick validation.
Reset both controls to show all rows, and verify the total row count matches the total row count on the Data page > Plugs_Store_Sales source table.
Check that the values match:

Click Publish.
This control is very similar to the slider, except that the user is able to adjust both the min and max values in the control itself.
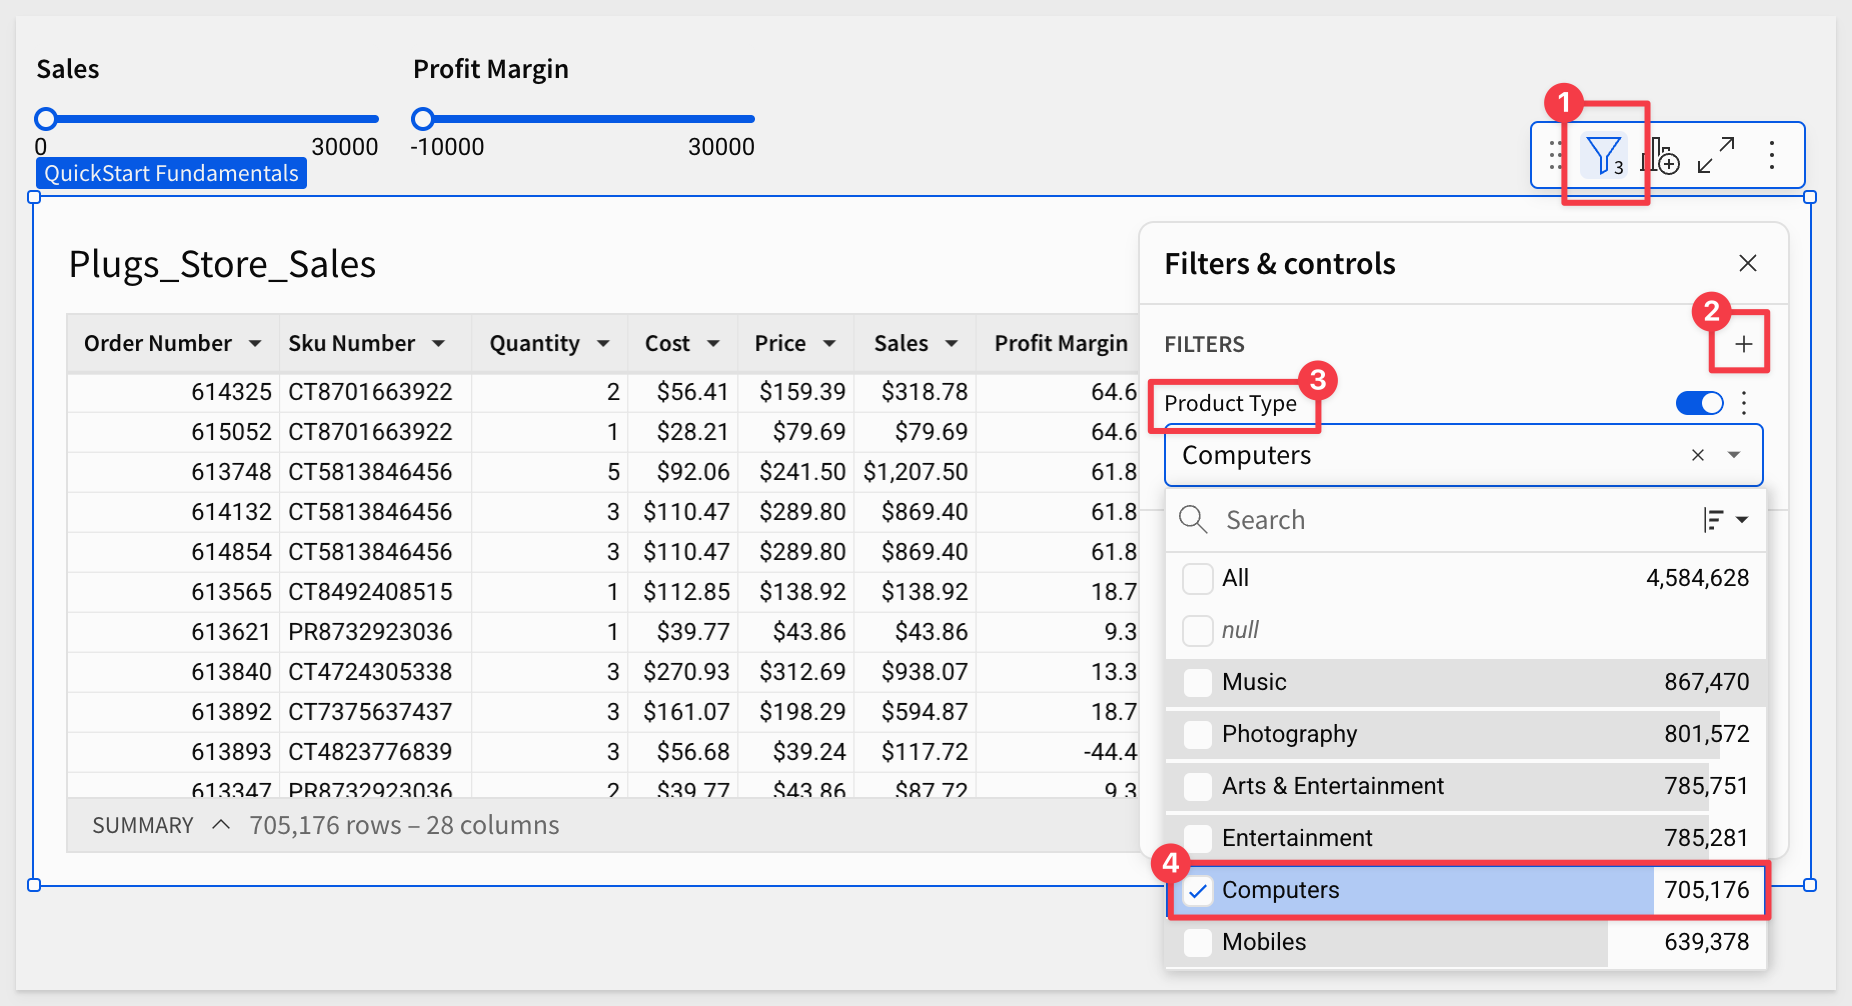
For example, we might want to target customers who spent a fair amount of money on computers, to see if we can sell them upgrades or accessories.
We can easily filter for computers:
Add a Range Slider control, configure it, set the target to the Sales column, rename it to Sales Hi-Low Range and then adjust the configuration to:
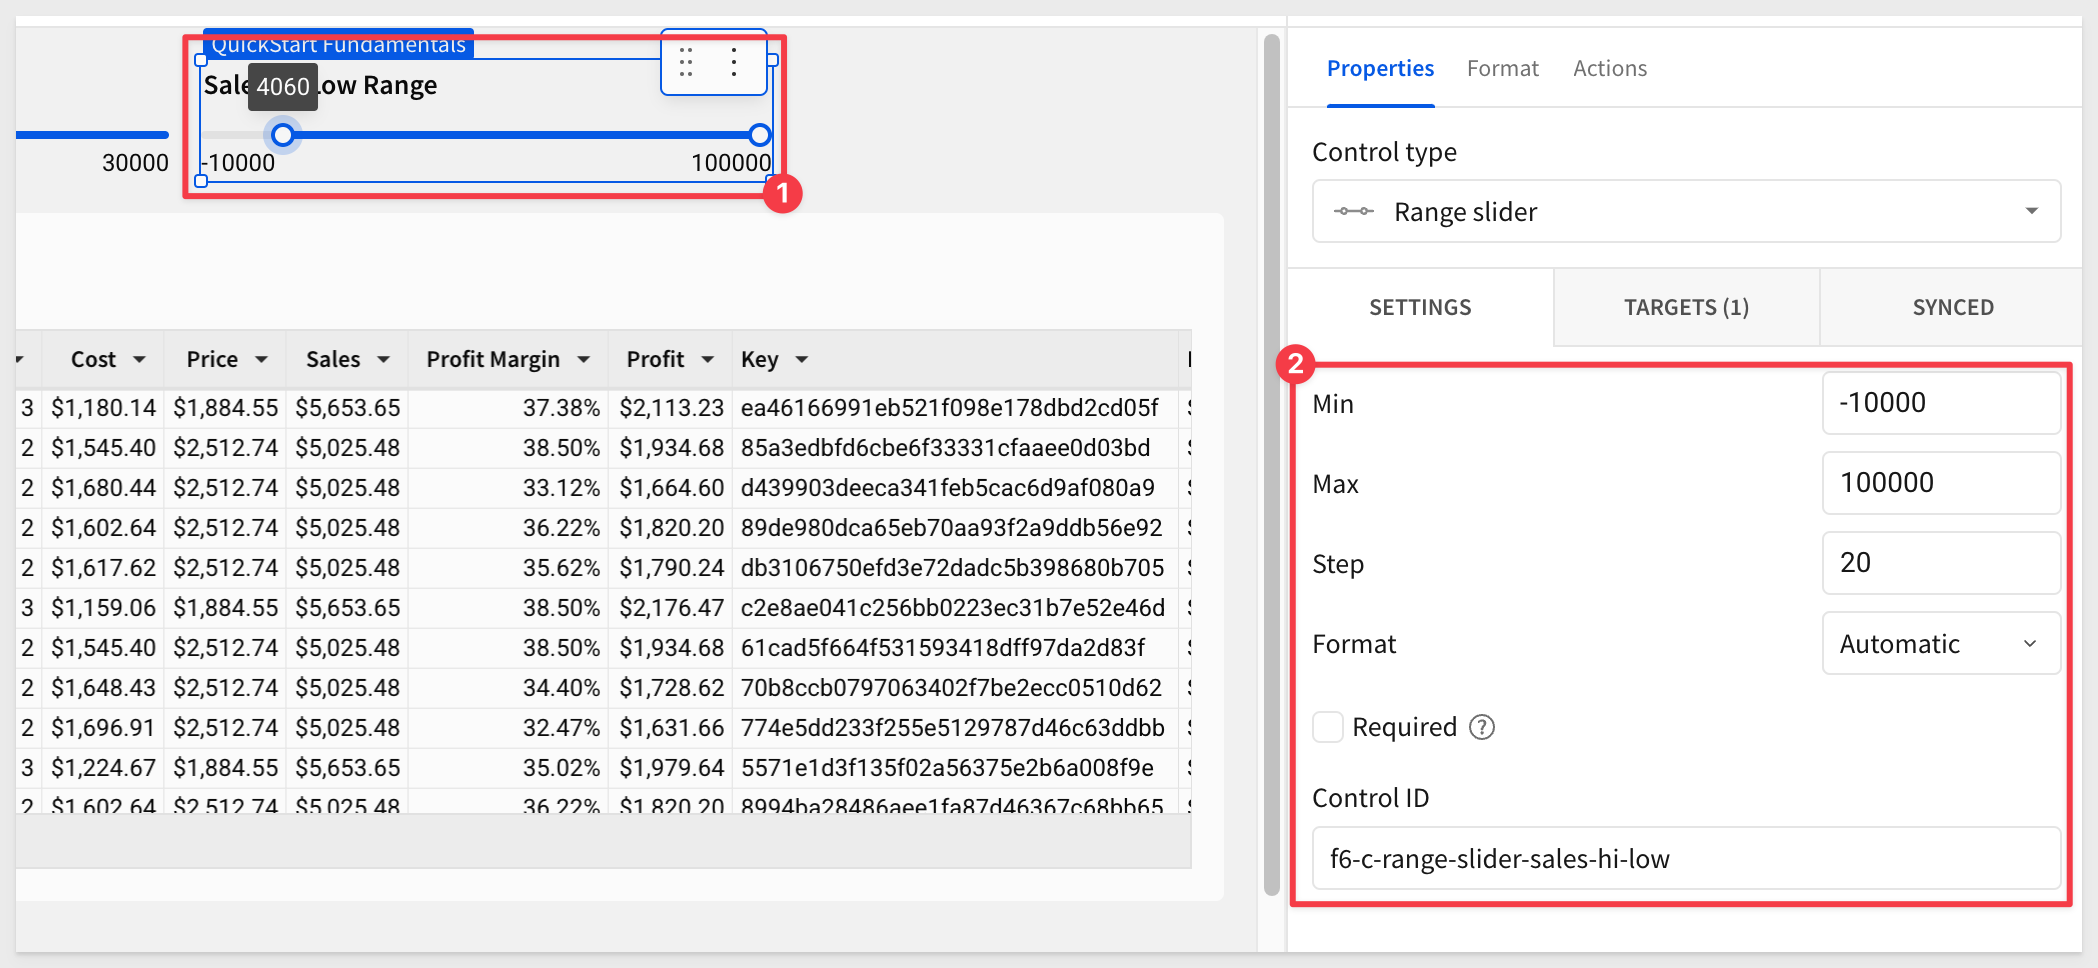
We now have a target list for our campaign.
Reset the range slider control and disable the filter for Computers to show all rows:
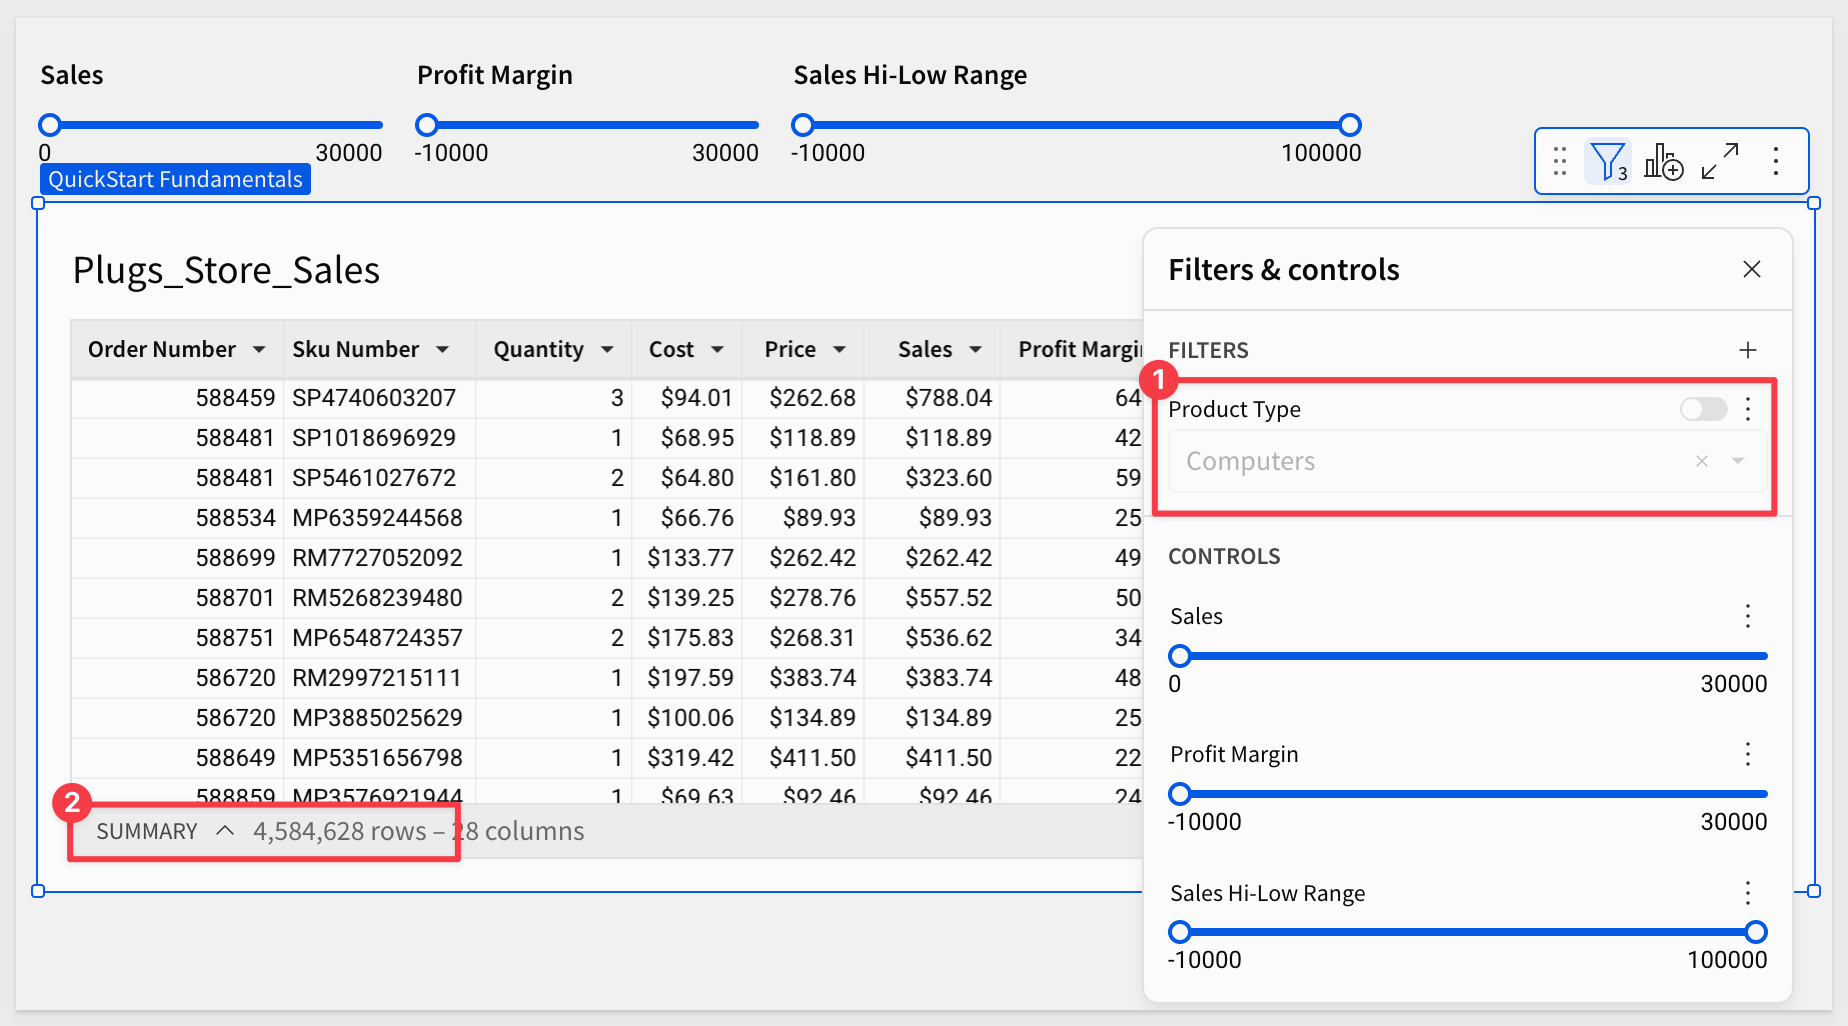
Click Publish:
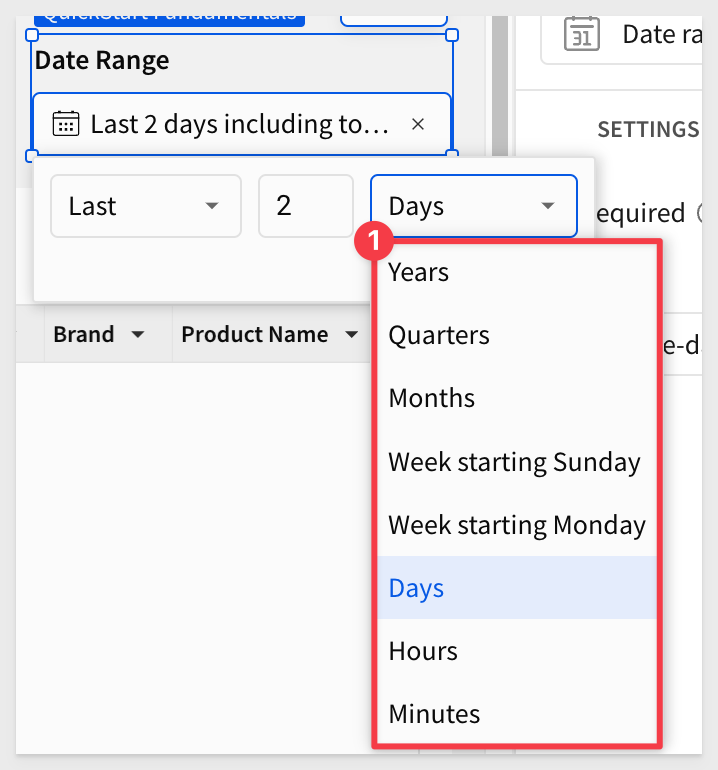
Add a Date Range control to the page.
Give it a target of Fundamentals 6 > Plugs_Store_Sales > Month of Date and a unique Control ID:

Already, we can see that the steps are common between different controls. This design pattern makes using controls much easier to do.
The default for the date control is Between two dates.
Opening the date options menu exposes all the other selection criteria available to the user, including a custom option:
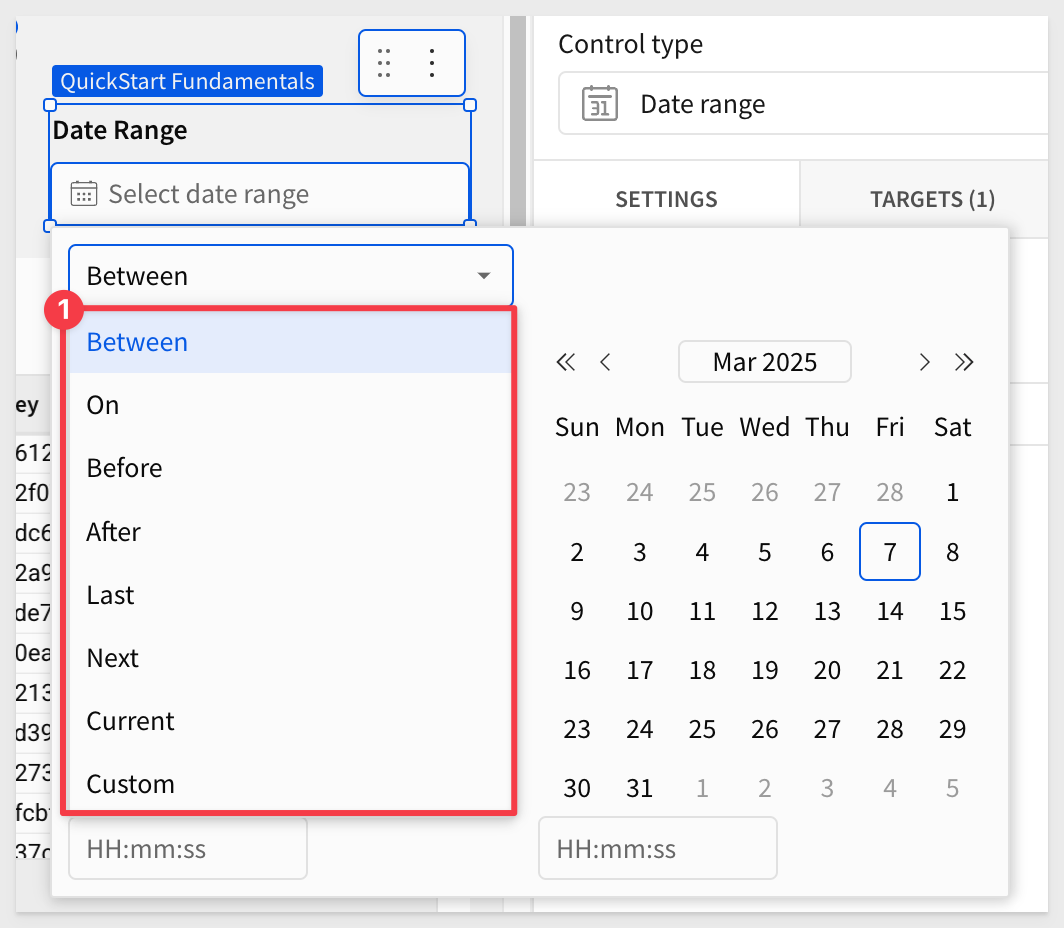
The date control's options make it really simple to get to the data that you need quickly:
Clicking the x in most controls will clear the control's selected value:

Reset the controls to show all rows again, and click Publish:
The Top N control provides the user the ability to select from four different groupings of values.
If you have done any of the other sections, you know how to make the Top N control work.
Here is what that might look like, targeting the Profit column:

Reset the controls to show all rows again, and click Publish:
The Switch control in Sigma allows users to toggle between True and False values, and then filter for matching records.
It is a simple "on/off" toggle that can be used to dynamically adjust the rows within a dashboard, based on a binary choice.
Let's create a simple example, based on filtering our Plugs_Store_Sales by transaction type.
Scenario:
Imagine Plugs users want to analyze sales transactions, differentiating between Purchase and Returns.
By using the switch control, users can easily toggle between Purchase and Returns, within a dashboard. From there, users can drill further into the data to gain the insights that interest them.
A problem we notice right away is that our Plugs_Store_Sales table is missing the transaction type column; we need to add that.
Sigma is flexible, and the decision of where to add this column has some implications.
We could add it to the existing Plugs_Store_Sales on the Data page, so that all the other "child elements" of Plugs_Store_Sales would be able to use it.
Instead, let's just add it to the Plugs_Store_Sales table on the Fundamentals 6 page.
On the Plugs_Store_Sales table, open the menu and select Element source and Join:

Using the source selector, search for F_Sales and click to select it:
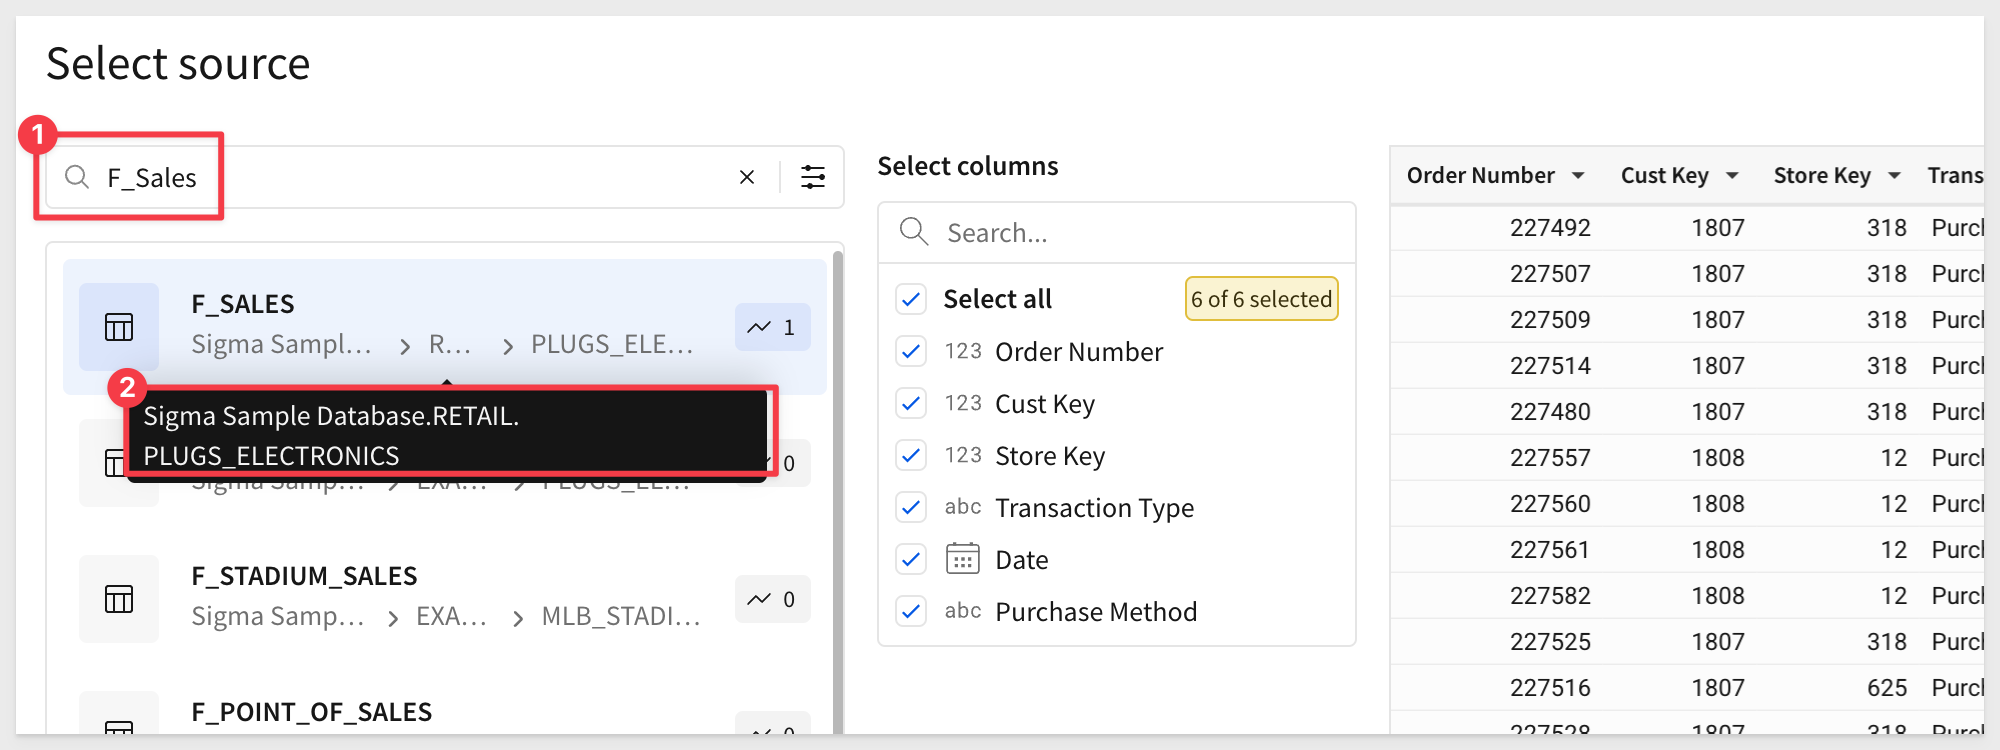
Click Select.
Notice that Sigma makes table suggestions to save time. In this case, we searched and selected the F_SALES table.
Sigma suggests that we might want to join on matching ORDER_NUMBER columns. We don't have to accept that, but since it is correct, we click to select that join condition and then click Preview output:
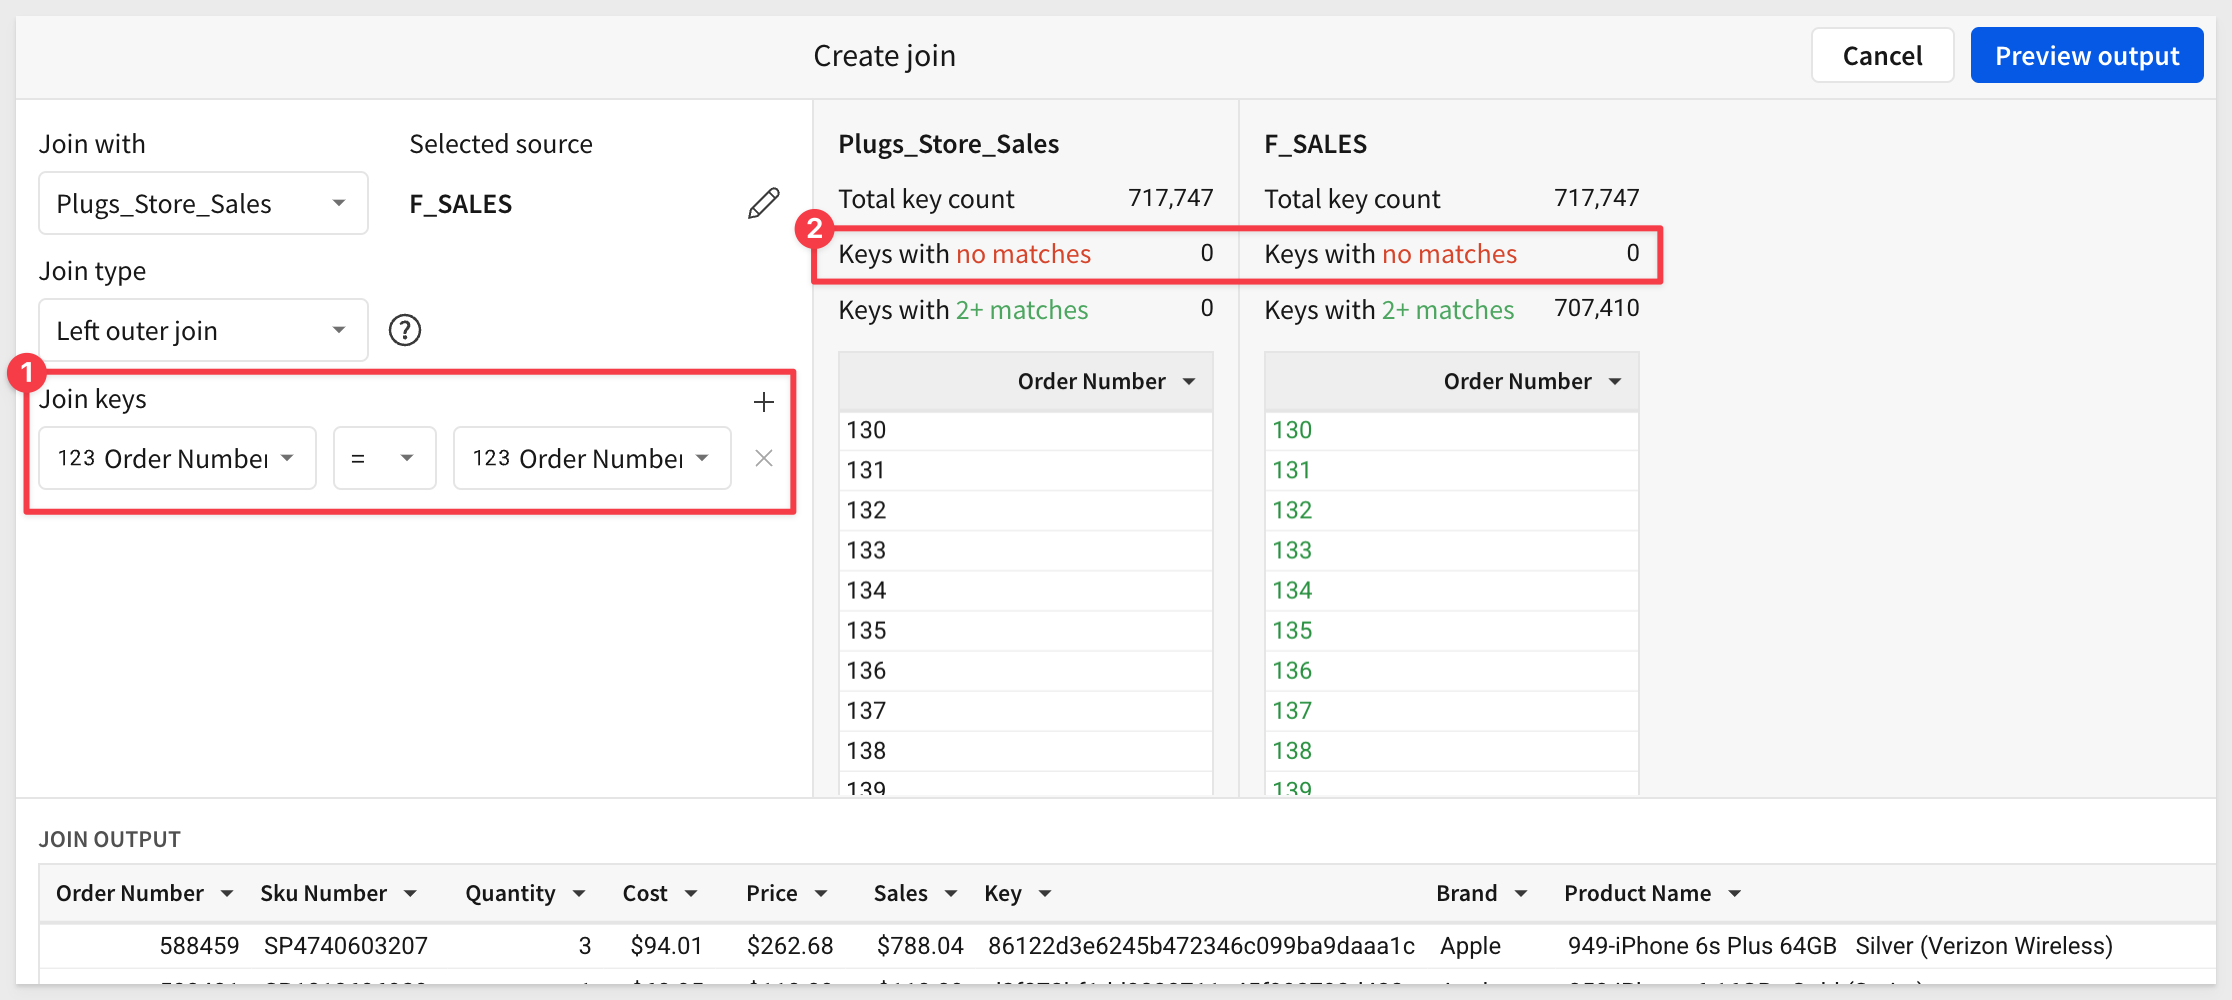
The next step shows us the current join configuration ("lineage"), allowing us to make adjustments, add more sources, and view the results.
Click Preview Output.
In the next page, we want to only select the Transaction Type column.
Collapse the PLUGS_ELECTRON...., deselect all columns from F_SALES, and check the box for Transaction Type.
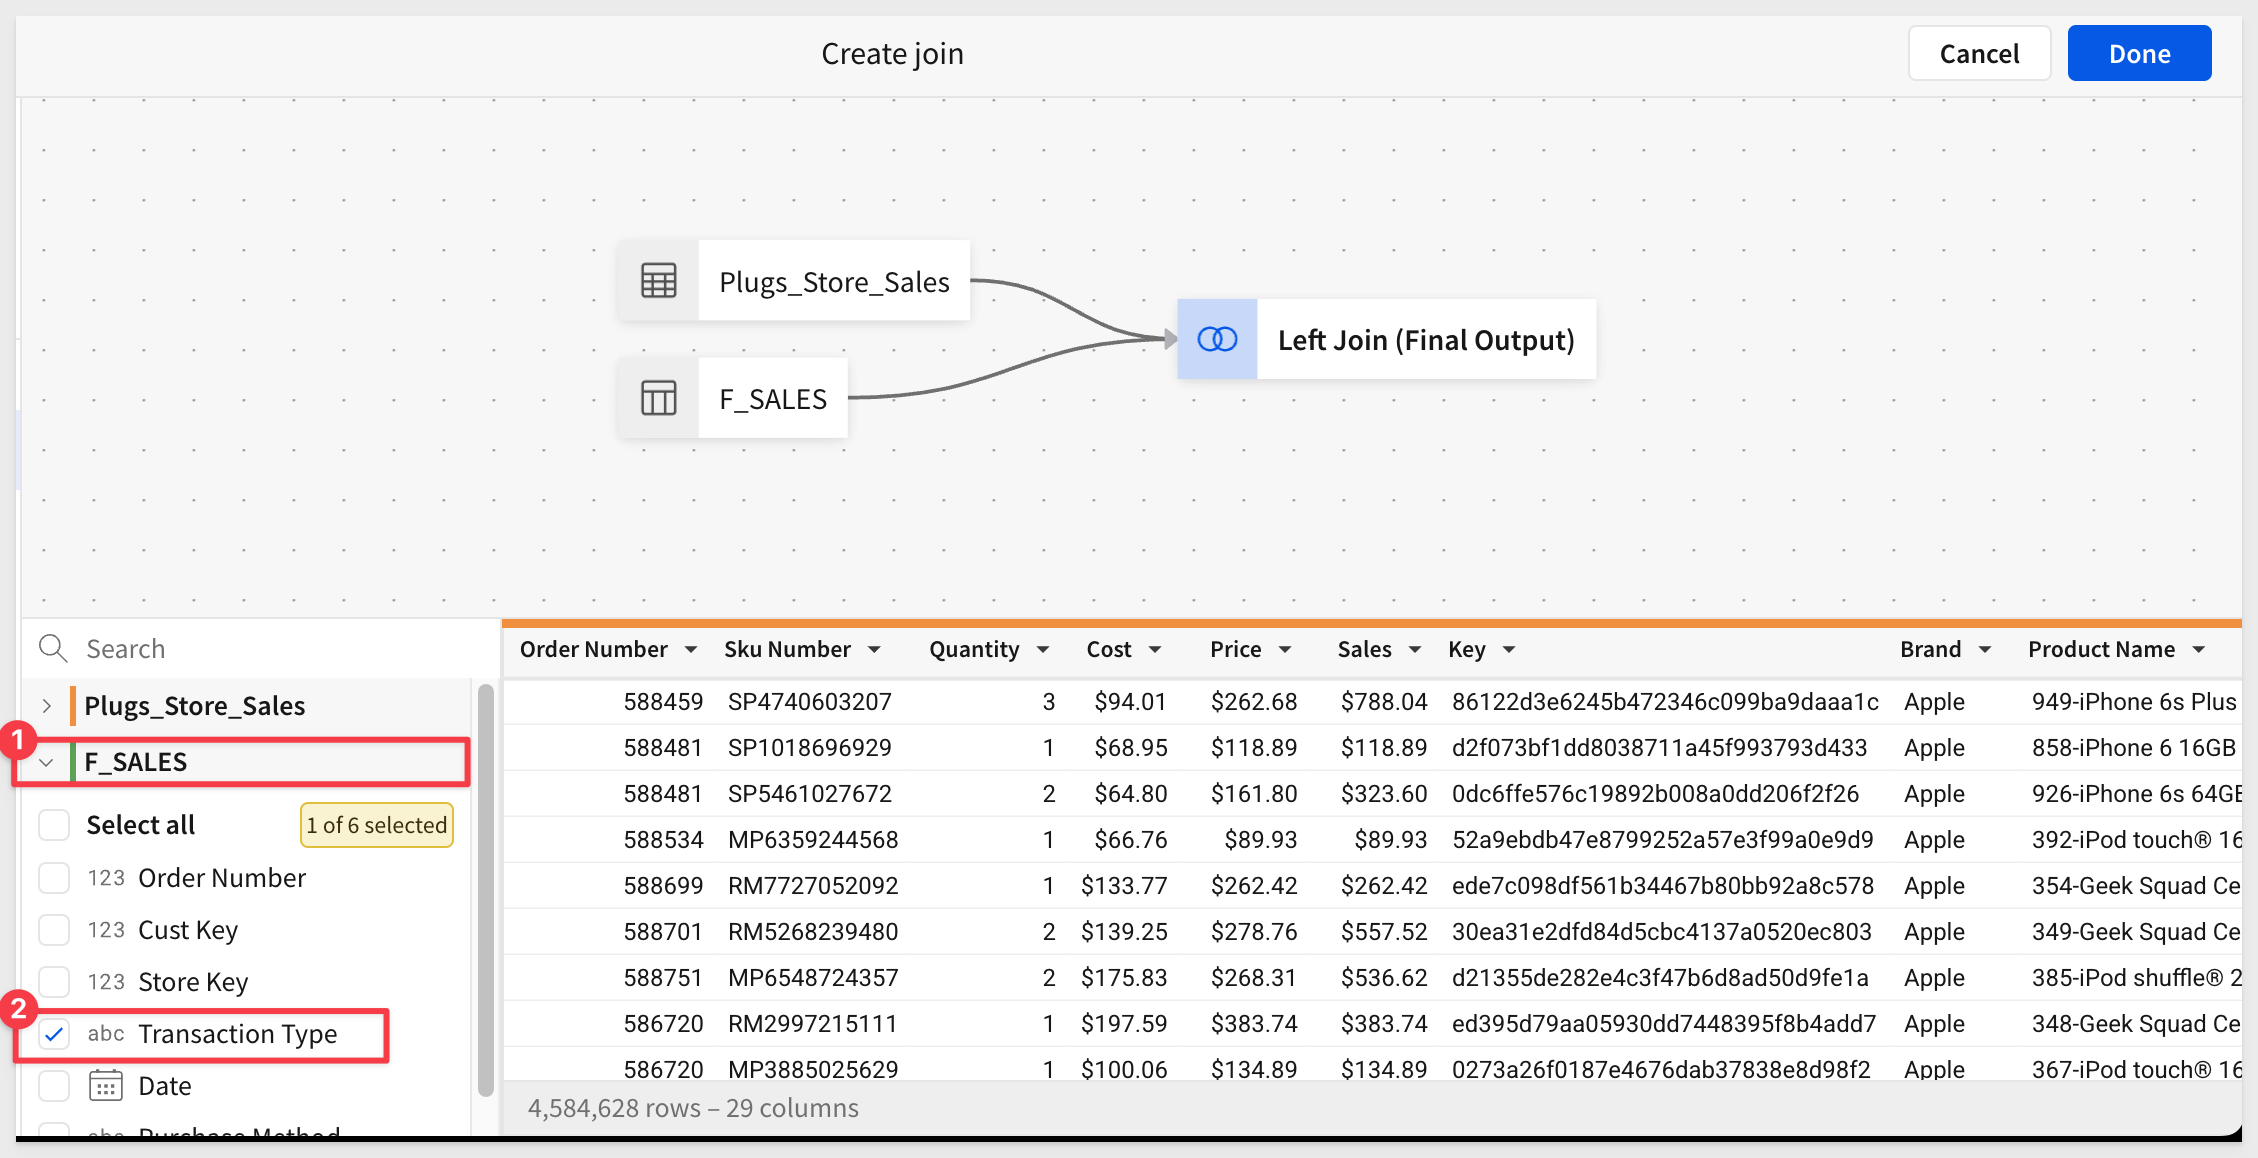
Click Done:
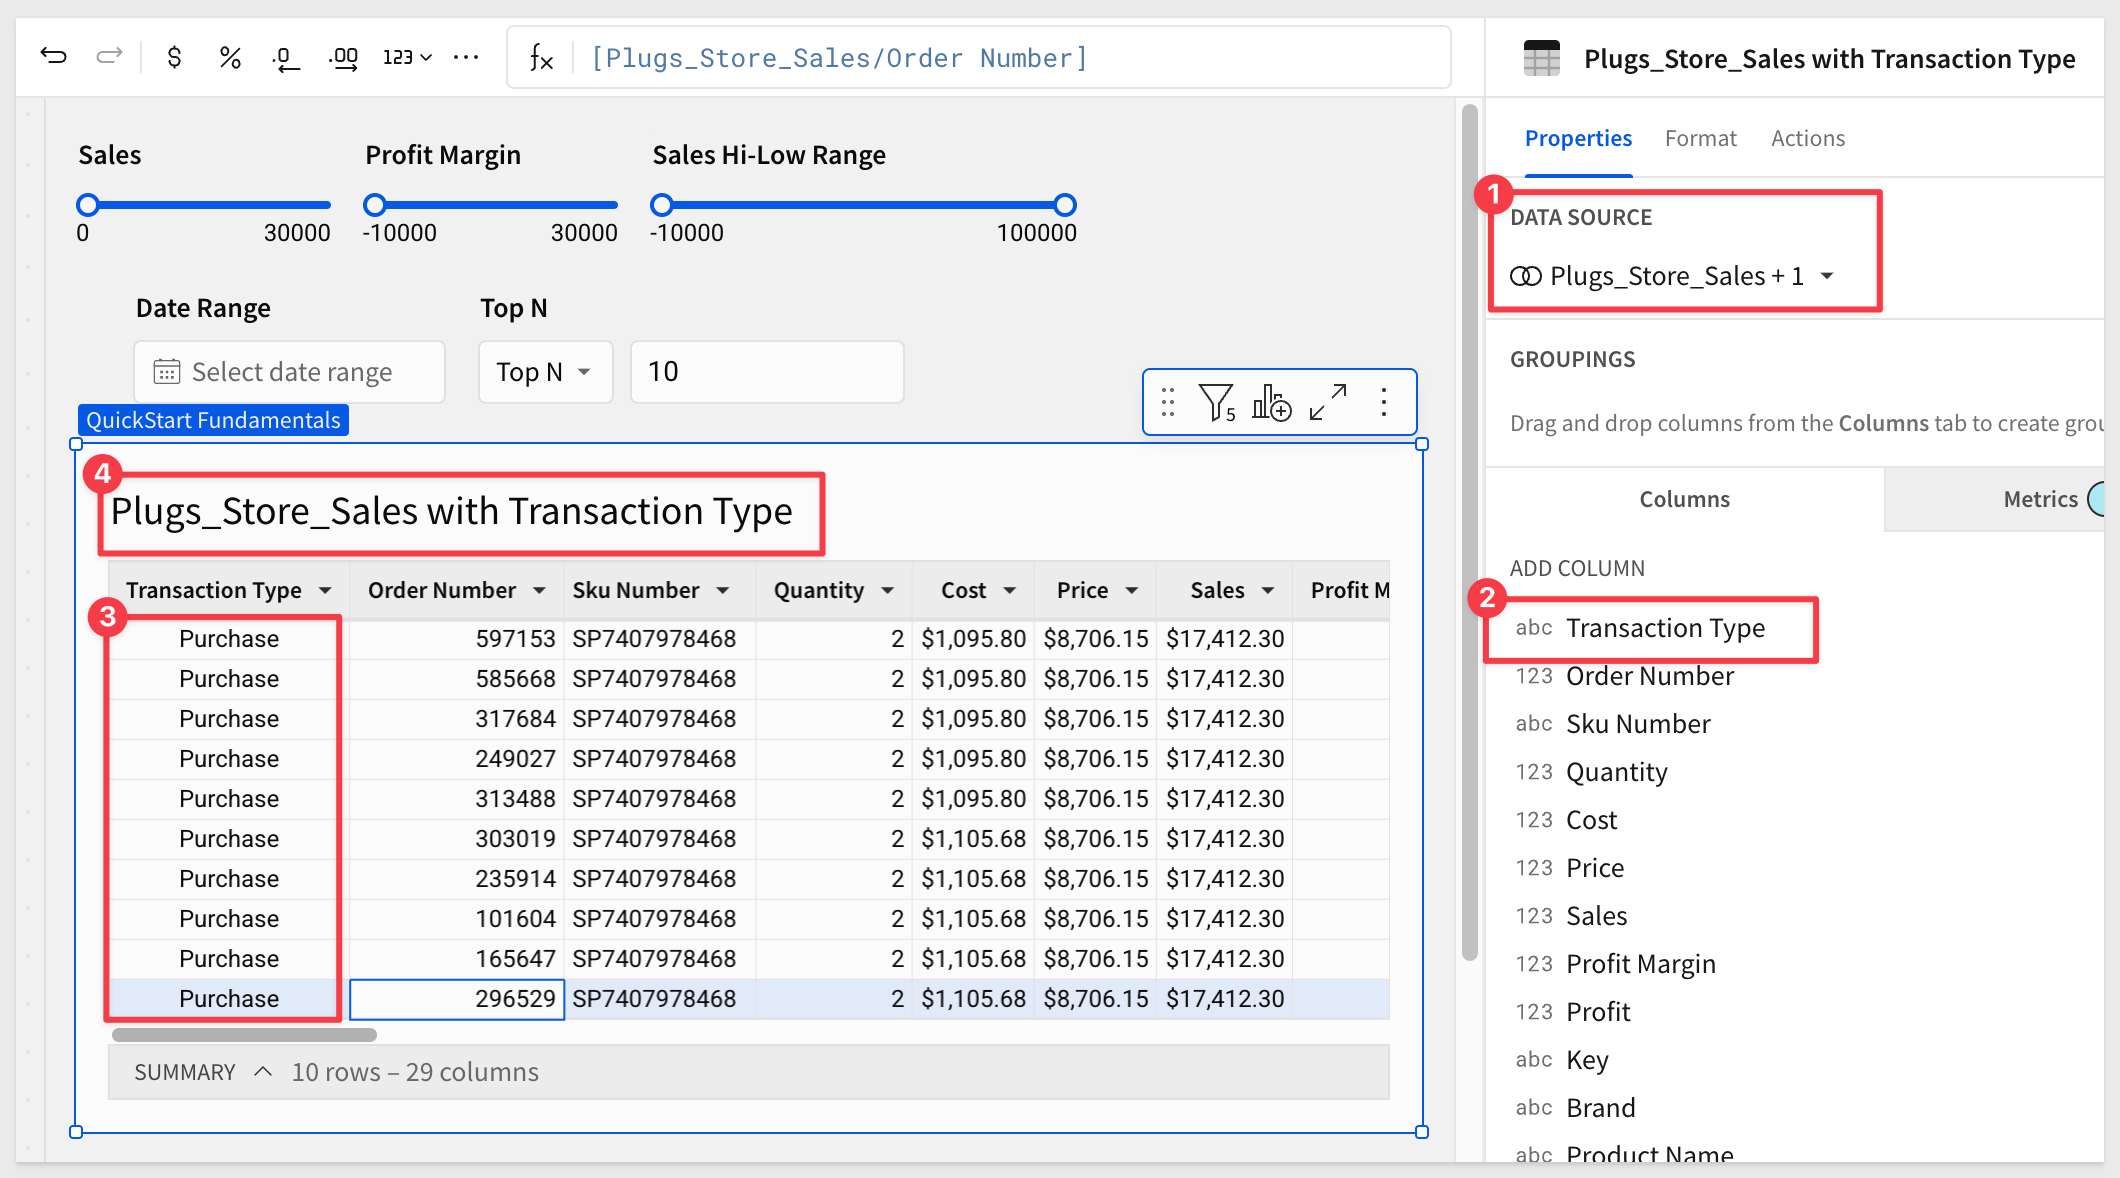
The column is added to the last position on the PLUGS_DATA table. We moved it to first column for the screenshot and renamed the table to Plugs_Store_Sales with Transaction Type.
Also notice that the DATA SOURCE indicates + 1 to let us know that there is a joined table.
Add the switch control
Add a Switch control to the page, rename it Transaction Type and set its Control ID to f6-c-switch-transaction-type and the Filter Type to True/False.
We can now toggle the switch control on and off, but the table is not "aware" of it yet.
We need to make the table respond to this control's value, as it is changed.
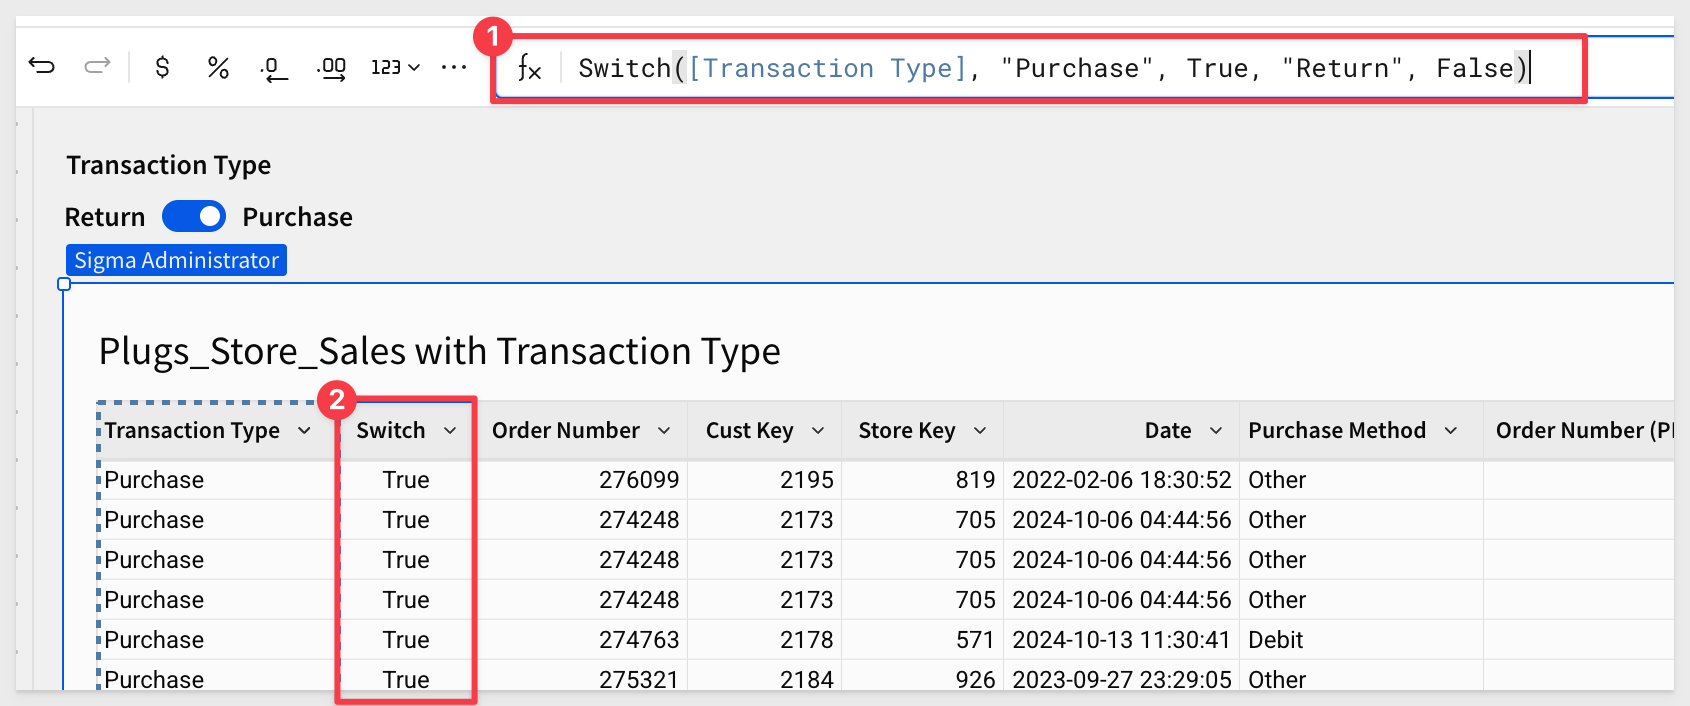
Add a new column next to Transaction Type, rename it to Switch, and set its formula to:
Switch([Transaction Type], "Purchase", True, "Return", False)
You can also change the control labels under Format > LABEL to replace On/Off with Purchase/Return.

In the switch controls configuration, add the PLUGS_SALES table as a TARGET and select the Switch column under that.
Now we can toggle between Purchase and Return transactions:
Now that it works, we can hide the Switch column, as users do not need to see that.
Click Publish.
A Synced control is different than a Duplicate copy.
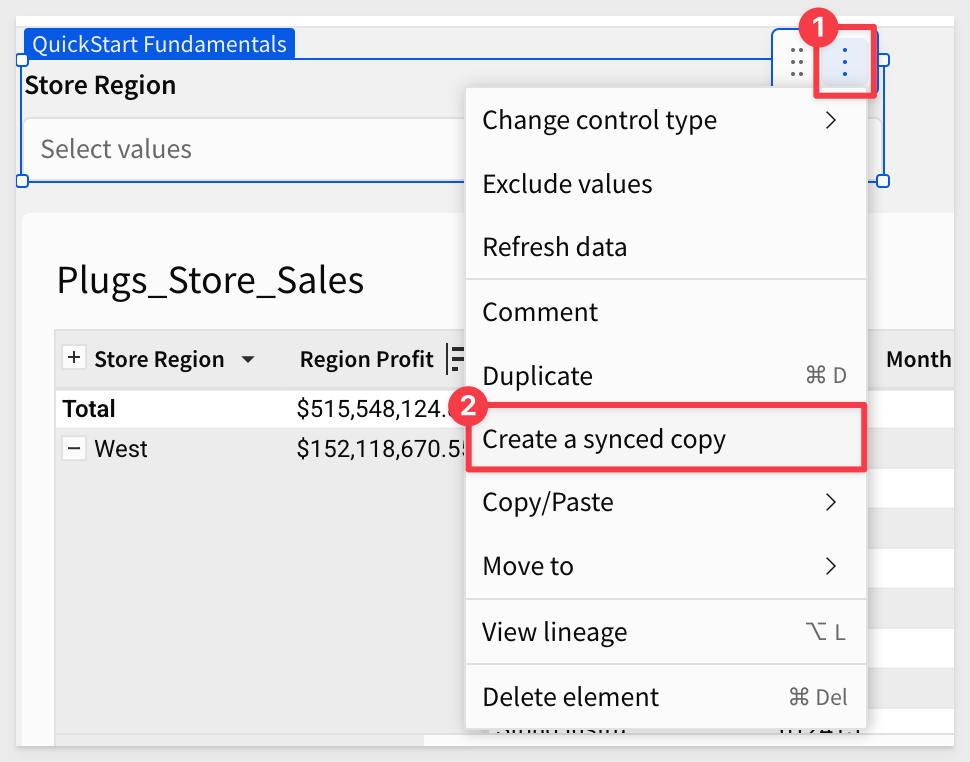
For example, you may want to track your organization's high-level sales data on one page and drill down into region-specific data on another.
If the same filter control targets elements on both pages, we recommend that you display the control on both pages.
This enables you and your workbook's viewers to edit the control value from either page, instead of switching back and forth.
There are a few use cases where this functionality can be useful:
1: Two controls, one target.
2: Maintaining context across pages.
3: Preselecting control values for users.
For more information, see Synced controls
As we saw with the switch control, we know that the current value of a control can be used in formulas. This is incredibly useful.
It is also true that the values used by a control can be created based on a formula too. That seems strange and kind of cool too.
Let's explore that concept.
For this exercise, let's reduce the available data shown by Plugs_Store_Sales with Transaction Type down, so that refresh is as fast as possible.
Filter the Date column to the current year only and the Transaction Type to True, to reduce the data to around 257K records.
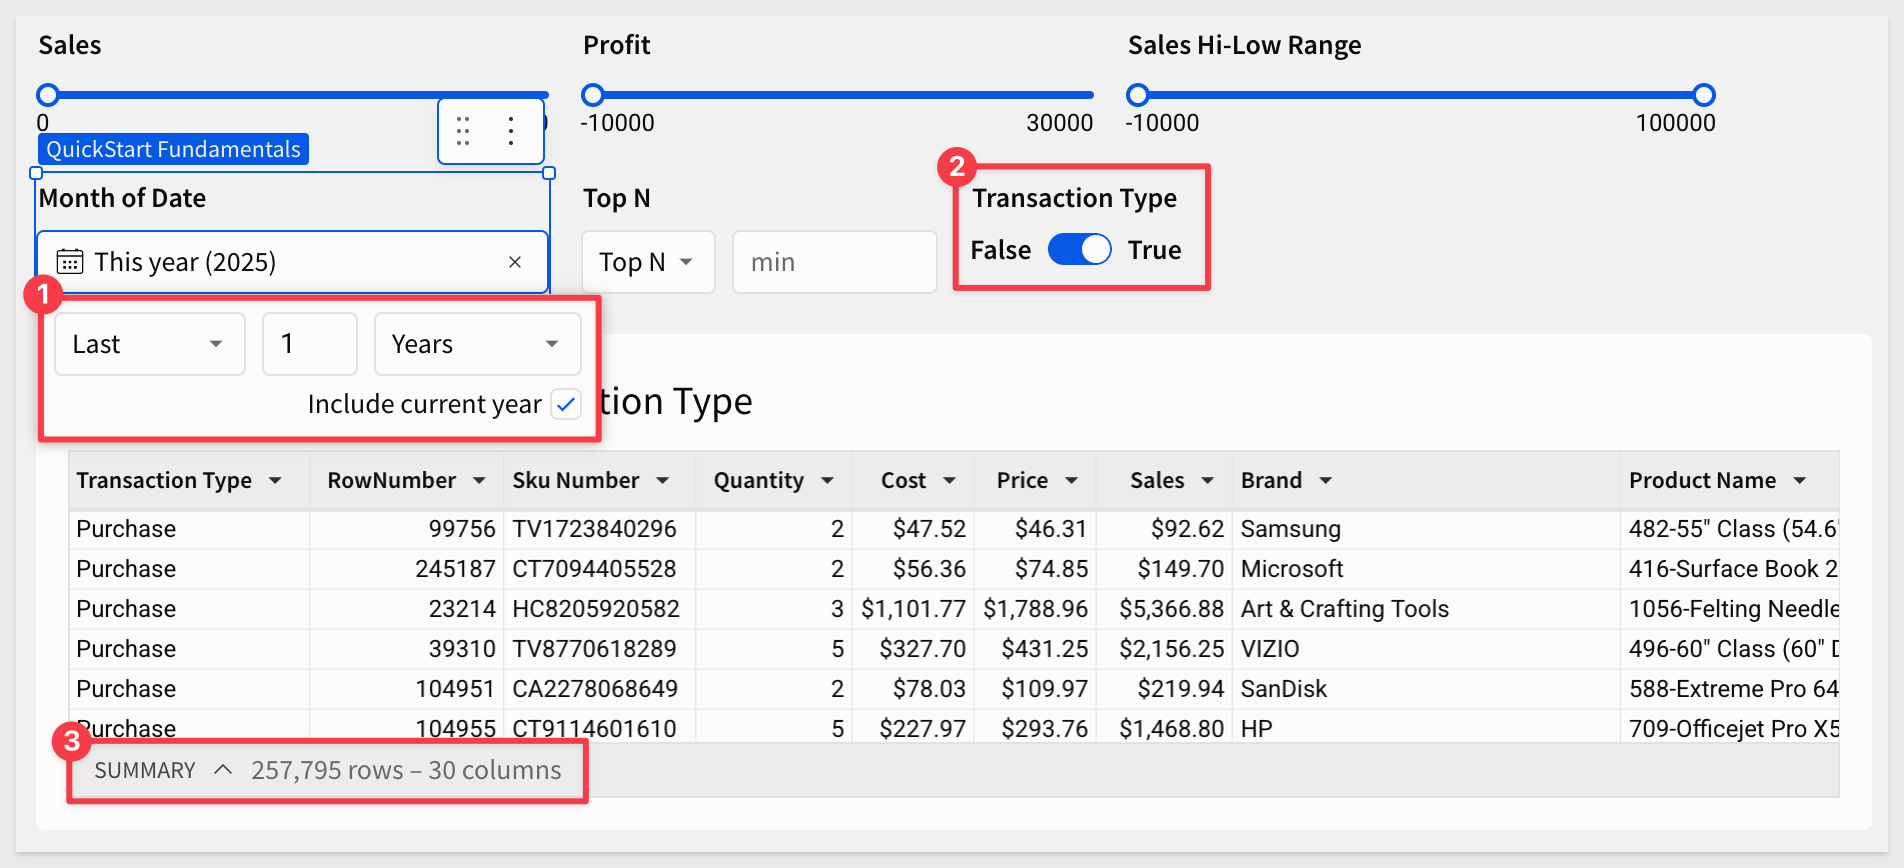
Add a List values control to the page and configure as:
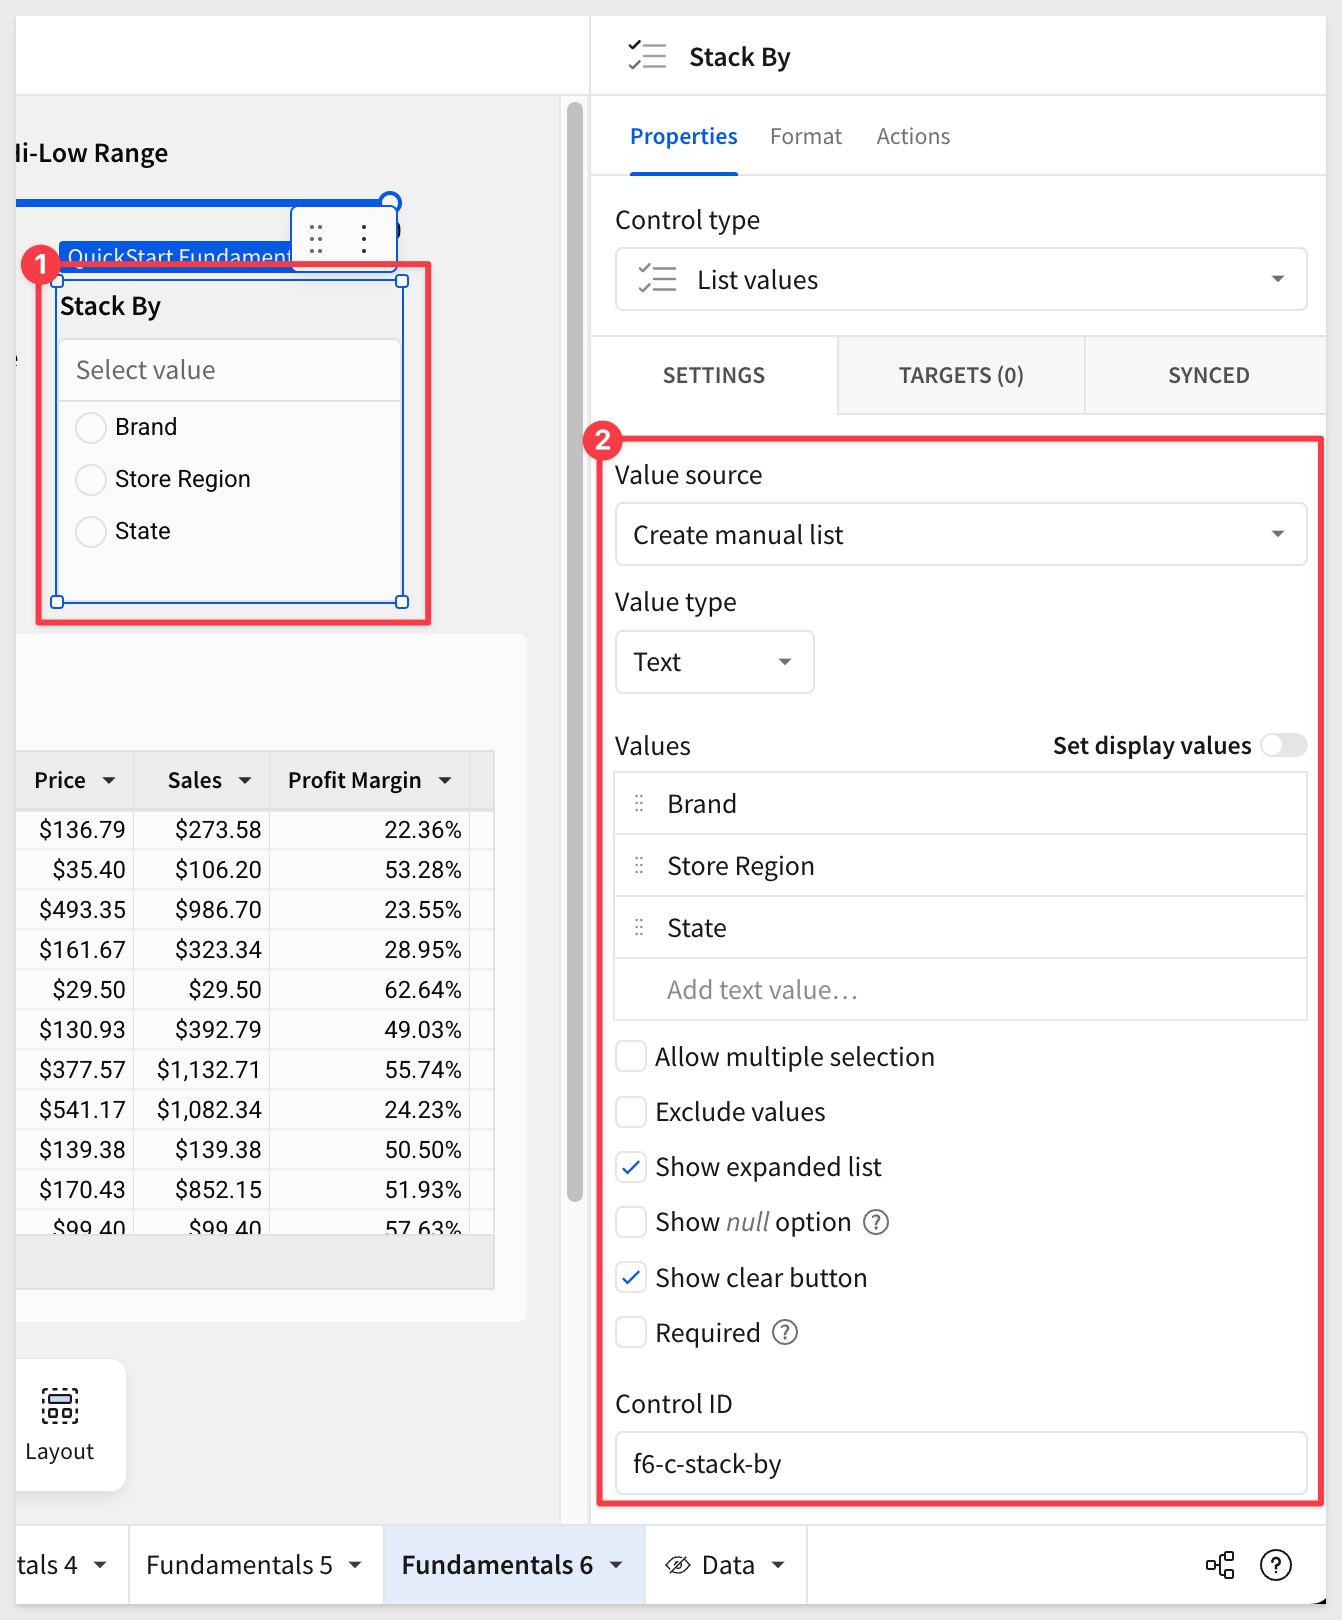
Make sure the Control ID is set to f6-c-stack-by; we will reference that in our formula, so syntax matters.
Next, we will add a column to the table that will reference the current value of the control.
This is how the table "targets" the control, as opposed to the control managing the target.
Add a new column to the table, in the first position. Rename it to Stack By and set its formula to:
Switch([f6-c-stack-by], "State", [Store State], "Store Region", [Store Region], "Brand", [Brand])
This formula will change the Stack By column's value, based on the selection made in the control.

As a last step, we can Group the table by Stack By, and test it out. How slick is that!
Click Publish.
In this QuickStart, we covered the variety of the more popular controls provided by Sigma. We explored using them to manipulate sample data and demonstrated just how easy it can be to solve business problems.
For more information, see Intro to control elements
The next QuickStart in this series covers design elements in Sigma
Additional Resource Links
Be sure to check out all the latest developments at Sigma's First Friday Feature page!
Help Center Home
Sigma Community
Sigma Blog