This entry-level lab introduces you to the core user interface and foundational capabilities of both Snowflake and Sigma. You'll learn how to use them together to build simple yet powerful analytics solutions.
The lab is designed to be used with the free Snowflake and Sigma trials, which you can access directly through Snowflake's Partner Connect.
In this QuickStart, you'll:
- Create Snowflake trial
- Launch a free Sigma trial using Snowflake Partner Connect
- Model, explore and analyze sample data, and build visualizations
- Create a Sigma workbook from a data model
For more information on Sigma's product release strategy, see Sigma product releases
If something isn't working as expected, here is how to contact Sigma support
Prerequisites
- Any modern browser.
- A Snowflake free 30-day trial environment.
- Sigma instance from Snowflake Partner Connect.

If not yet done, register for a Snowflake free 30-day trial
You will have different Snowflake editions (Standard, Enterprise, e.g.), cloud providers (GCP, AWS, or Azure), and Regions (US Central, Europe West, e.g.) Available to you.
We suggest you select the cloud provider and region which is physically closest to you and your data, and select the Enterprise edition so you can leverage advanced capabilities that are not available in the Standard Edition.
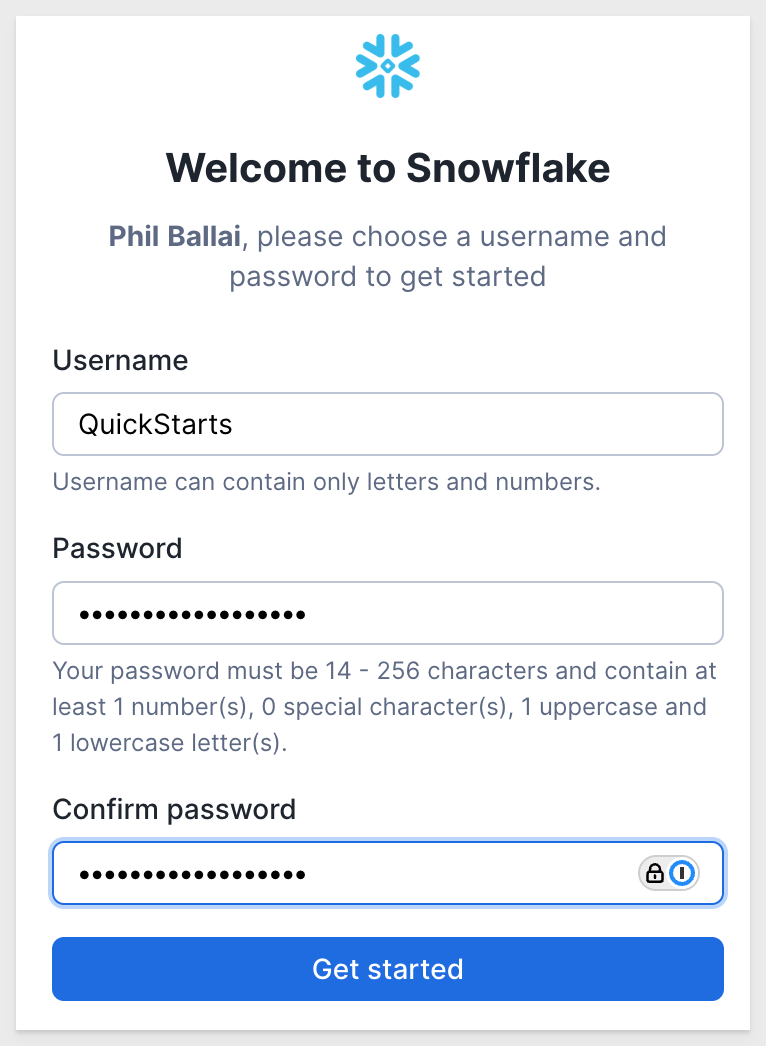
After registering, you will receive an email with an activation link and your Snowflake account URL. Bookmark this URL for easy, future access. After activation, you will create a username and password. Write down these credentials.
Open a browser window and enter the URL of your Snowflake 30-day trial environment. You should see the login screen below. Enter your unique credentials to log in.
Navigating the Snowflake Snowsight UI
For those not familiar, let's get you acquainted with Snowflake!
This section covers the basic components of the user interface to help you orient yourself. We will move top to bottom on the left panel of the UI.
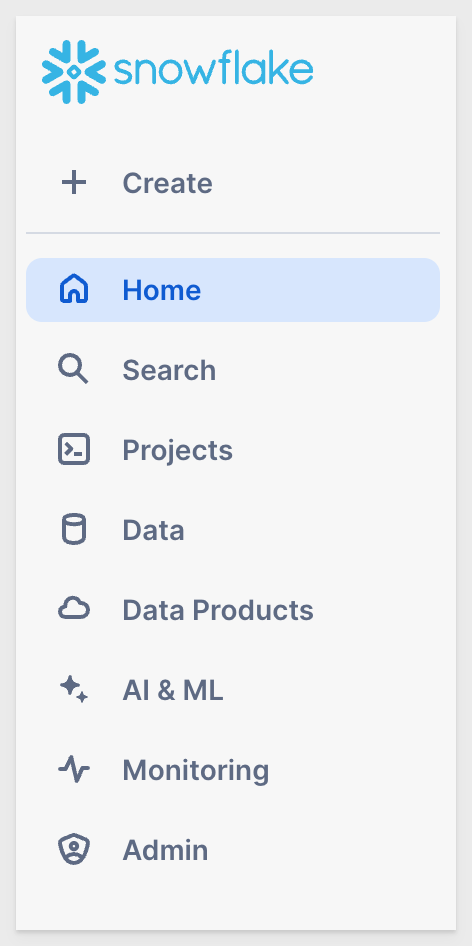
Create:
Launches options to create new objects such as databases, tables, warehouses, or worksheets.
Home:
Returns you to the main Snowflake landing page with quick access to recent items and resources.
Search:
Allows you to quickly find objects, queries, or metadata across your Snowflake environment.
Projects:
Provides access to Snowflake projects, including worksheets, scripts, and development tools.
Data:
Opens a view to browse and manage databases, schemas, tables, views, and other data objects.
Data Products:
Central location to discover, manage, and publish data listings and shares (e.g., Snowflake Marketplace).
AI & ML:
Access AI and machine learning capabilities such as Snowpark ML, Cortex functions, and model deployment tools.
Monitoring:
View dashboards and logs related to query performance, usage metrics, and system health.
Admin:
Manage users, roles, account settings, and security configurations for your Snowflake environment.
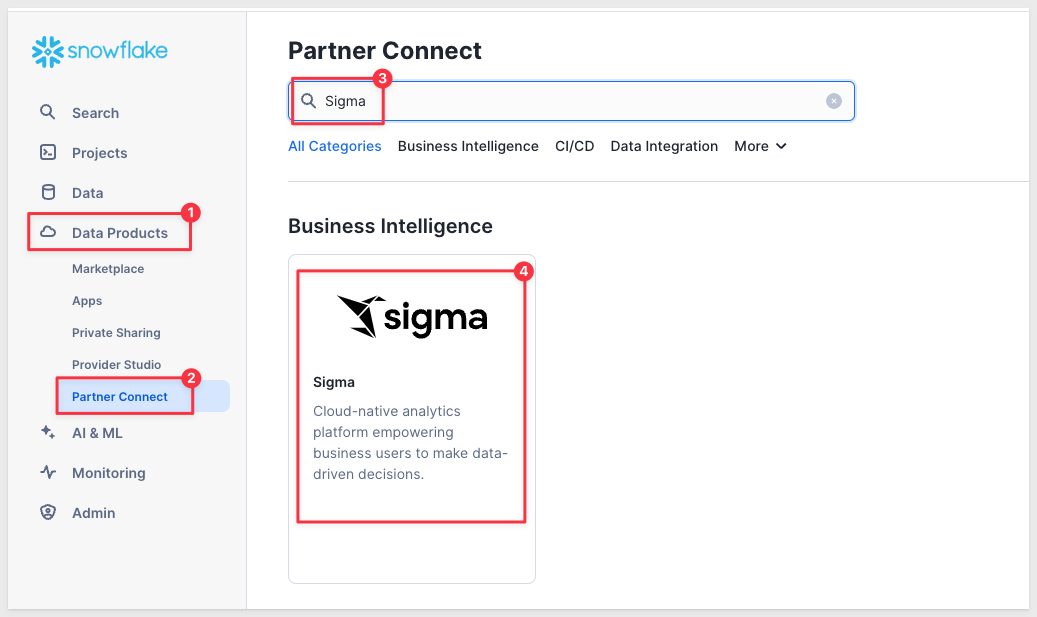
In the top ribbon of the Snowflake UI, click on the Partner Connect icon. Search for Sigma and click on the Sigma tile to start our new Sigma free trial.
- Sigma is the only cloud analytics and BI platform purpose-built as software-as-a service for Snowflake. Sigma offers a spreadsheet-like interface anyone can use to explore, analyze, and visualize data at unlimited scale.
- In this section we will provision a Sigma account (called an organization). Sigma is an Elite Snowflake BI Partner and a free trial of Sigma is available via the Snowflake PartnerConnect which is within the Snowflake UI.
Direct Connection to Snowflake
Sigma is unique versus many other BI products in that Sigma is fully-managed SaaS, offers a direct connection to Snowflake , and pushes all queries to Snowflake for execution. Benefits of this include:
- Data accessed by Sigma is always live and accurate
- Unlimited query speed and scale as Sigma leverages the compute resources of Snowflake. Queries across up to hundreds of billions of rows are performant.
- Stronger security and governance as data never leaves Snowflake and it is easy to control permissions via a single point of access.
- With many other BI products, data is extracted out of Snowflake to local desktops/servers for analysis which leads to stale data, limited scale and speed, and security issues with extracts scattered across many desktops and file shares.
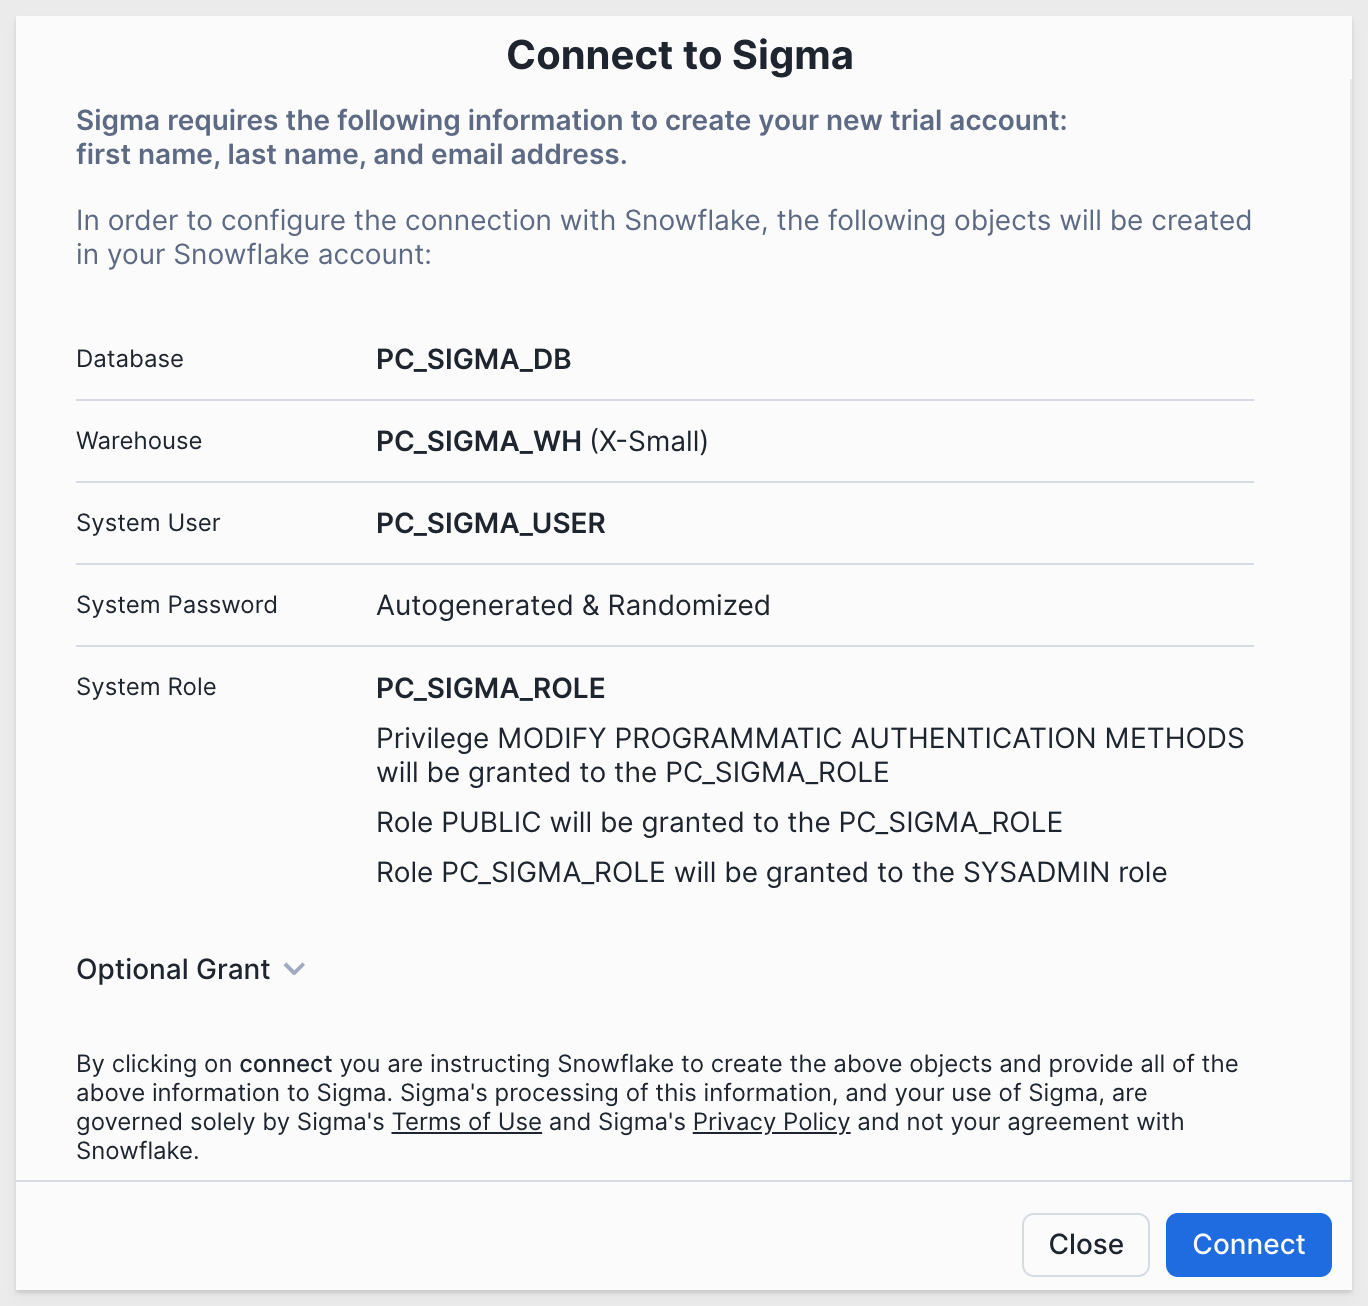
- You will see a dialog box that will show you the objects that will be created in your account. We will be using the
PC_SIGMA_WHwarehouse and thePC_SIGMA_ROLEfor this lab. These are automatically created for you as part of the LAUNCH.
Click Connect:
Now click Activate which will open a new tab:
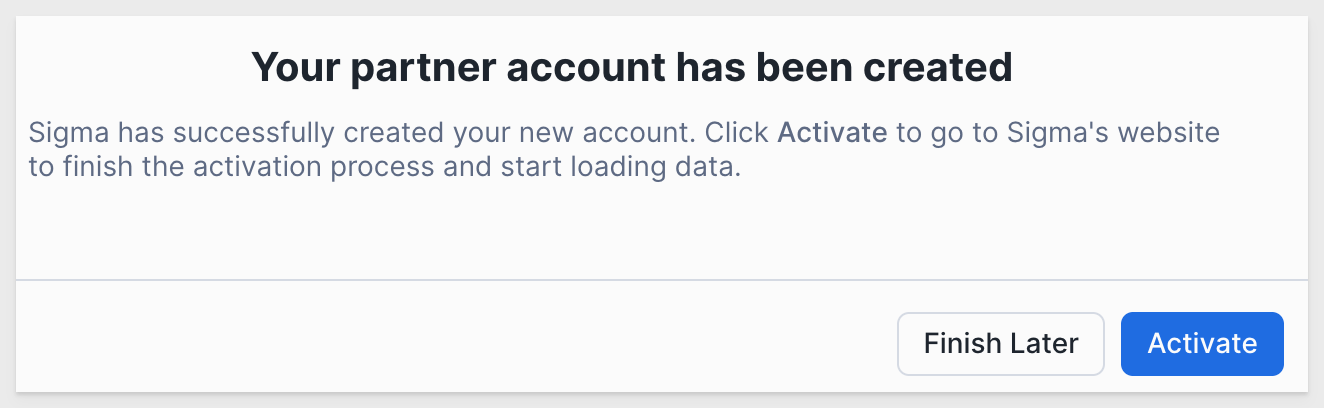
A new tab for connecting to Sigma will pop-up in your web browser.
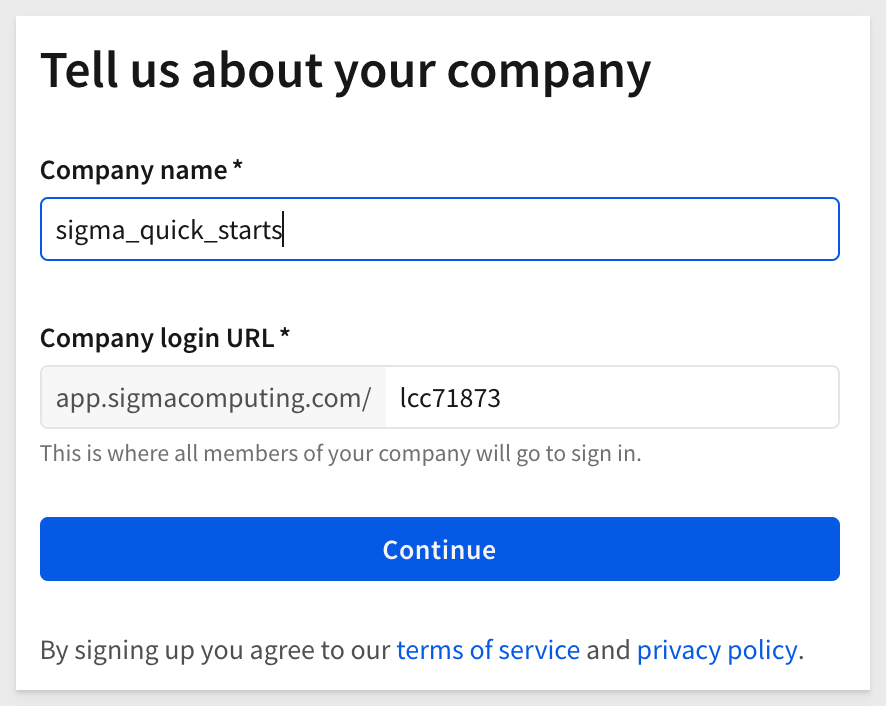
Provide a company name and click Continue:
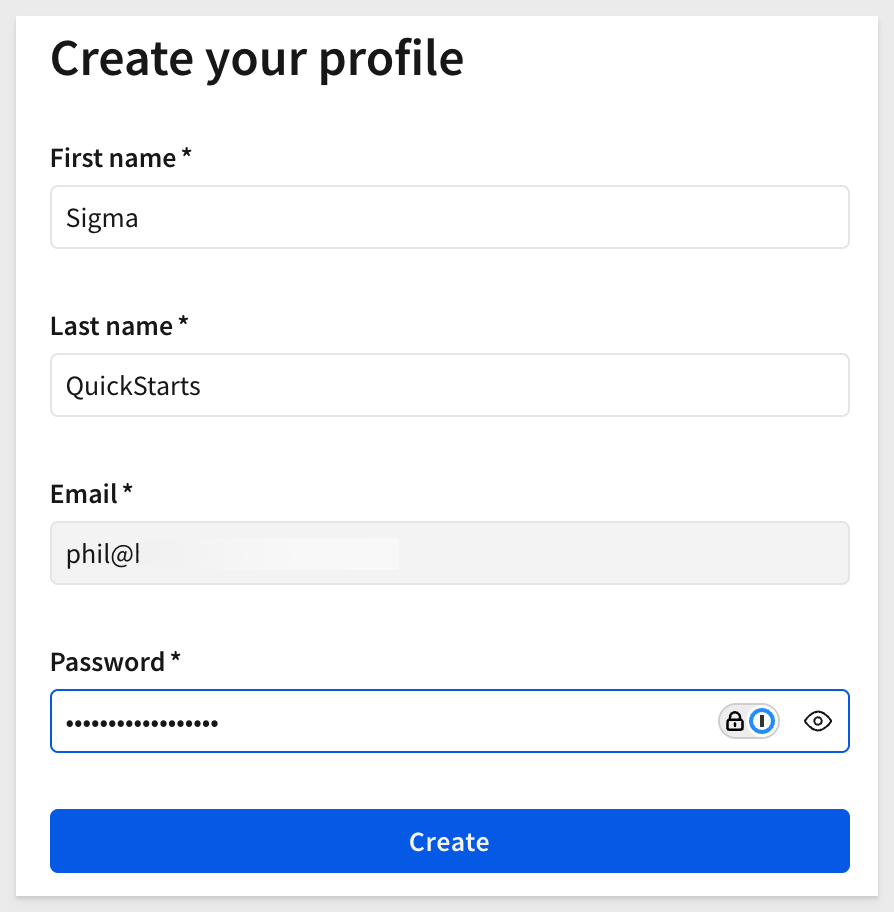
Create your profile:
When ready, Sigma will display some additional information and we can click Get started using Sigma:

Once on the homepage click the Hide link to close the trial guide:
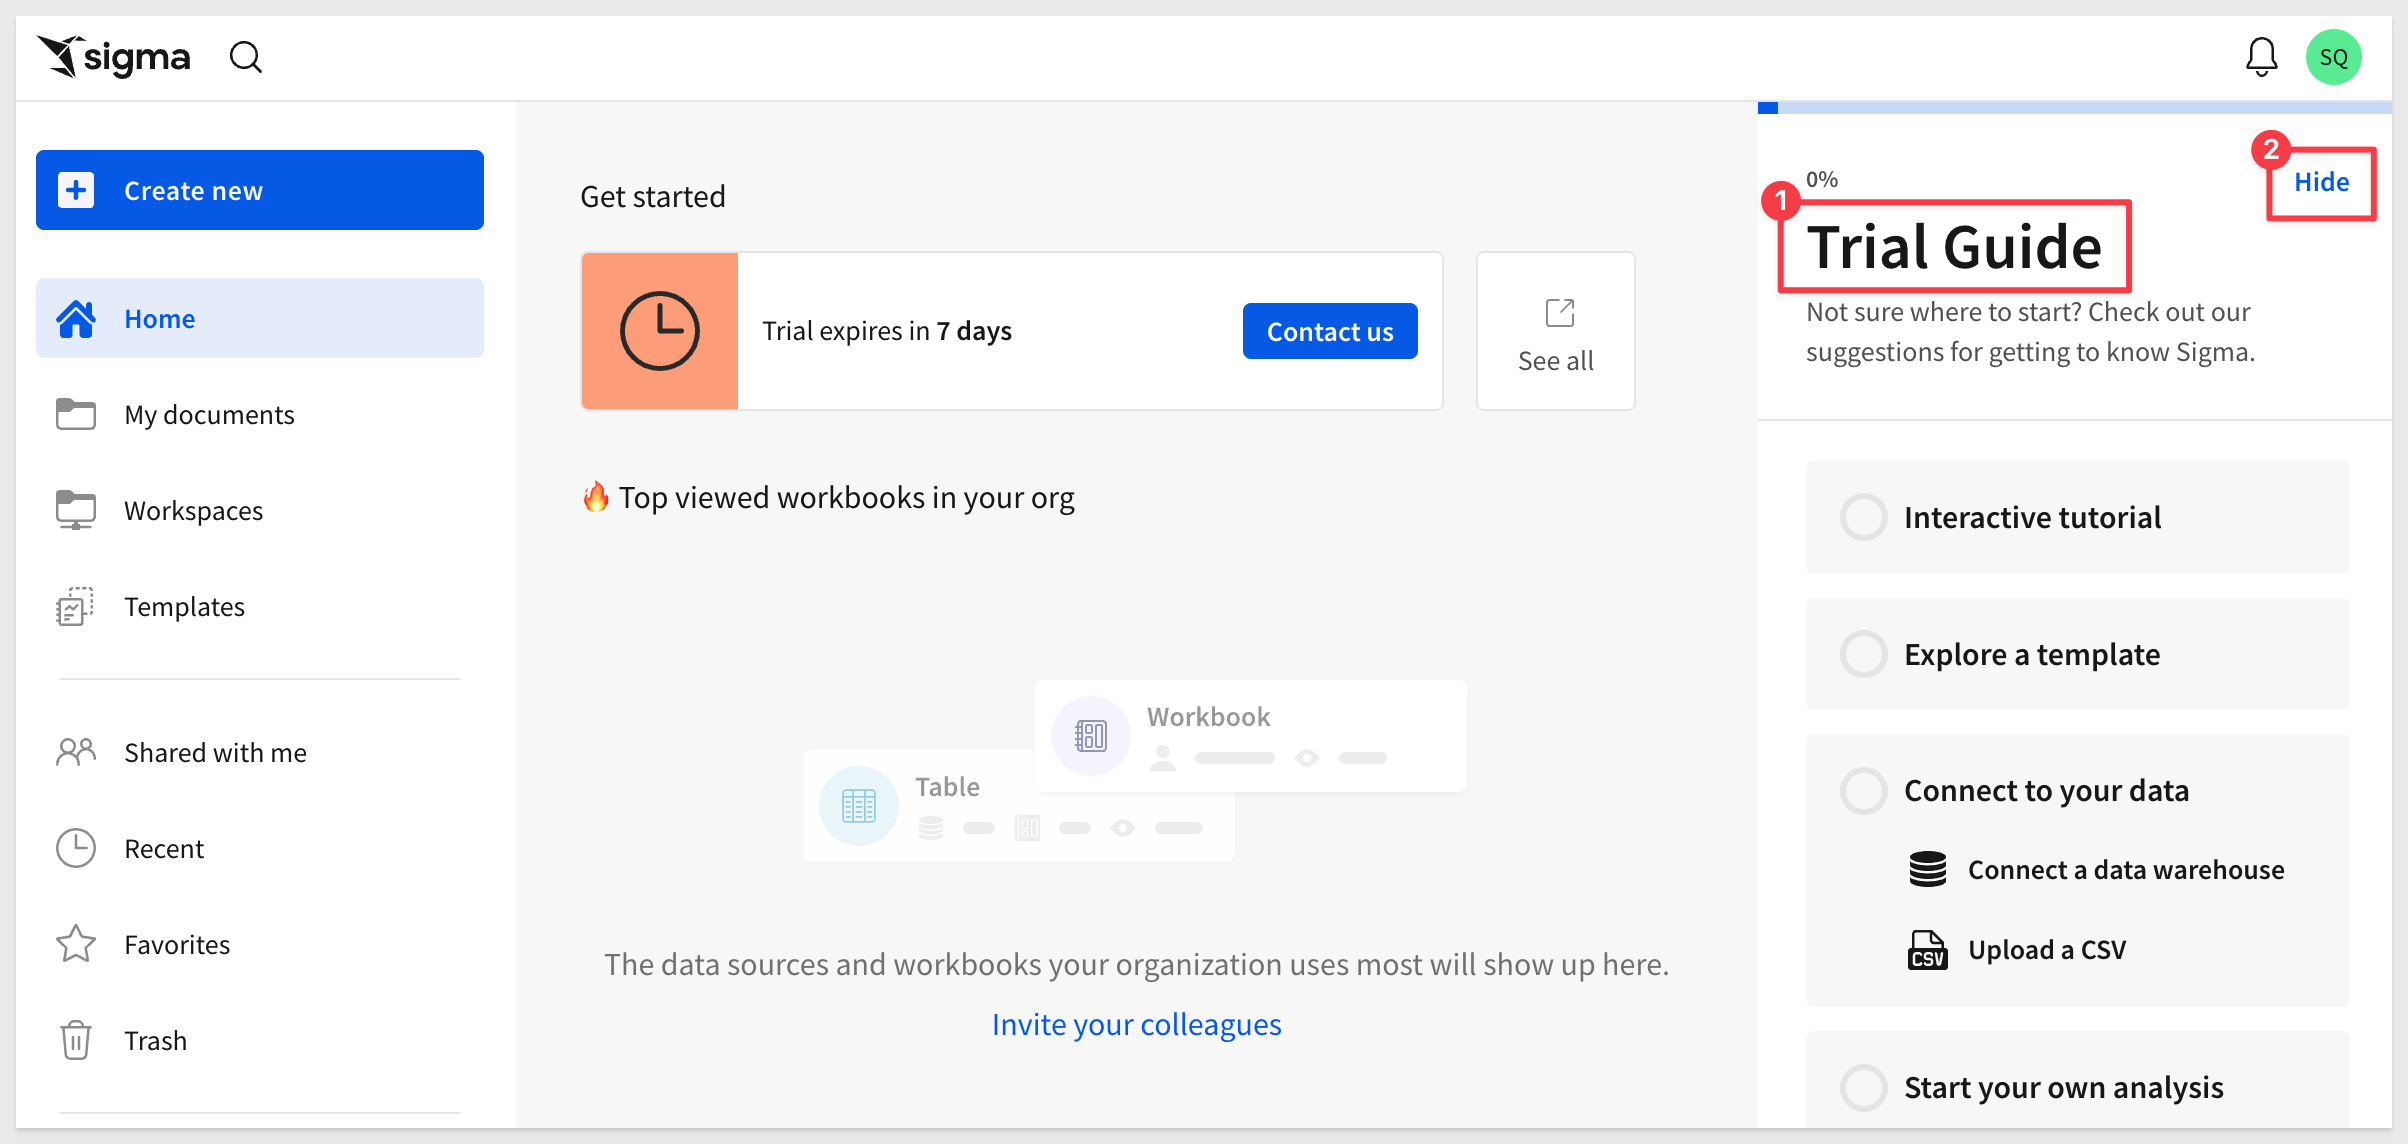
The home page is logically organized for quick access to key features.
The main functions are numbered and described below:
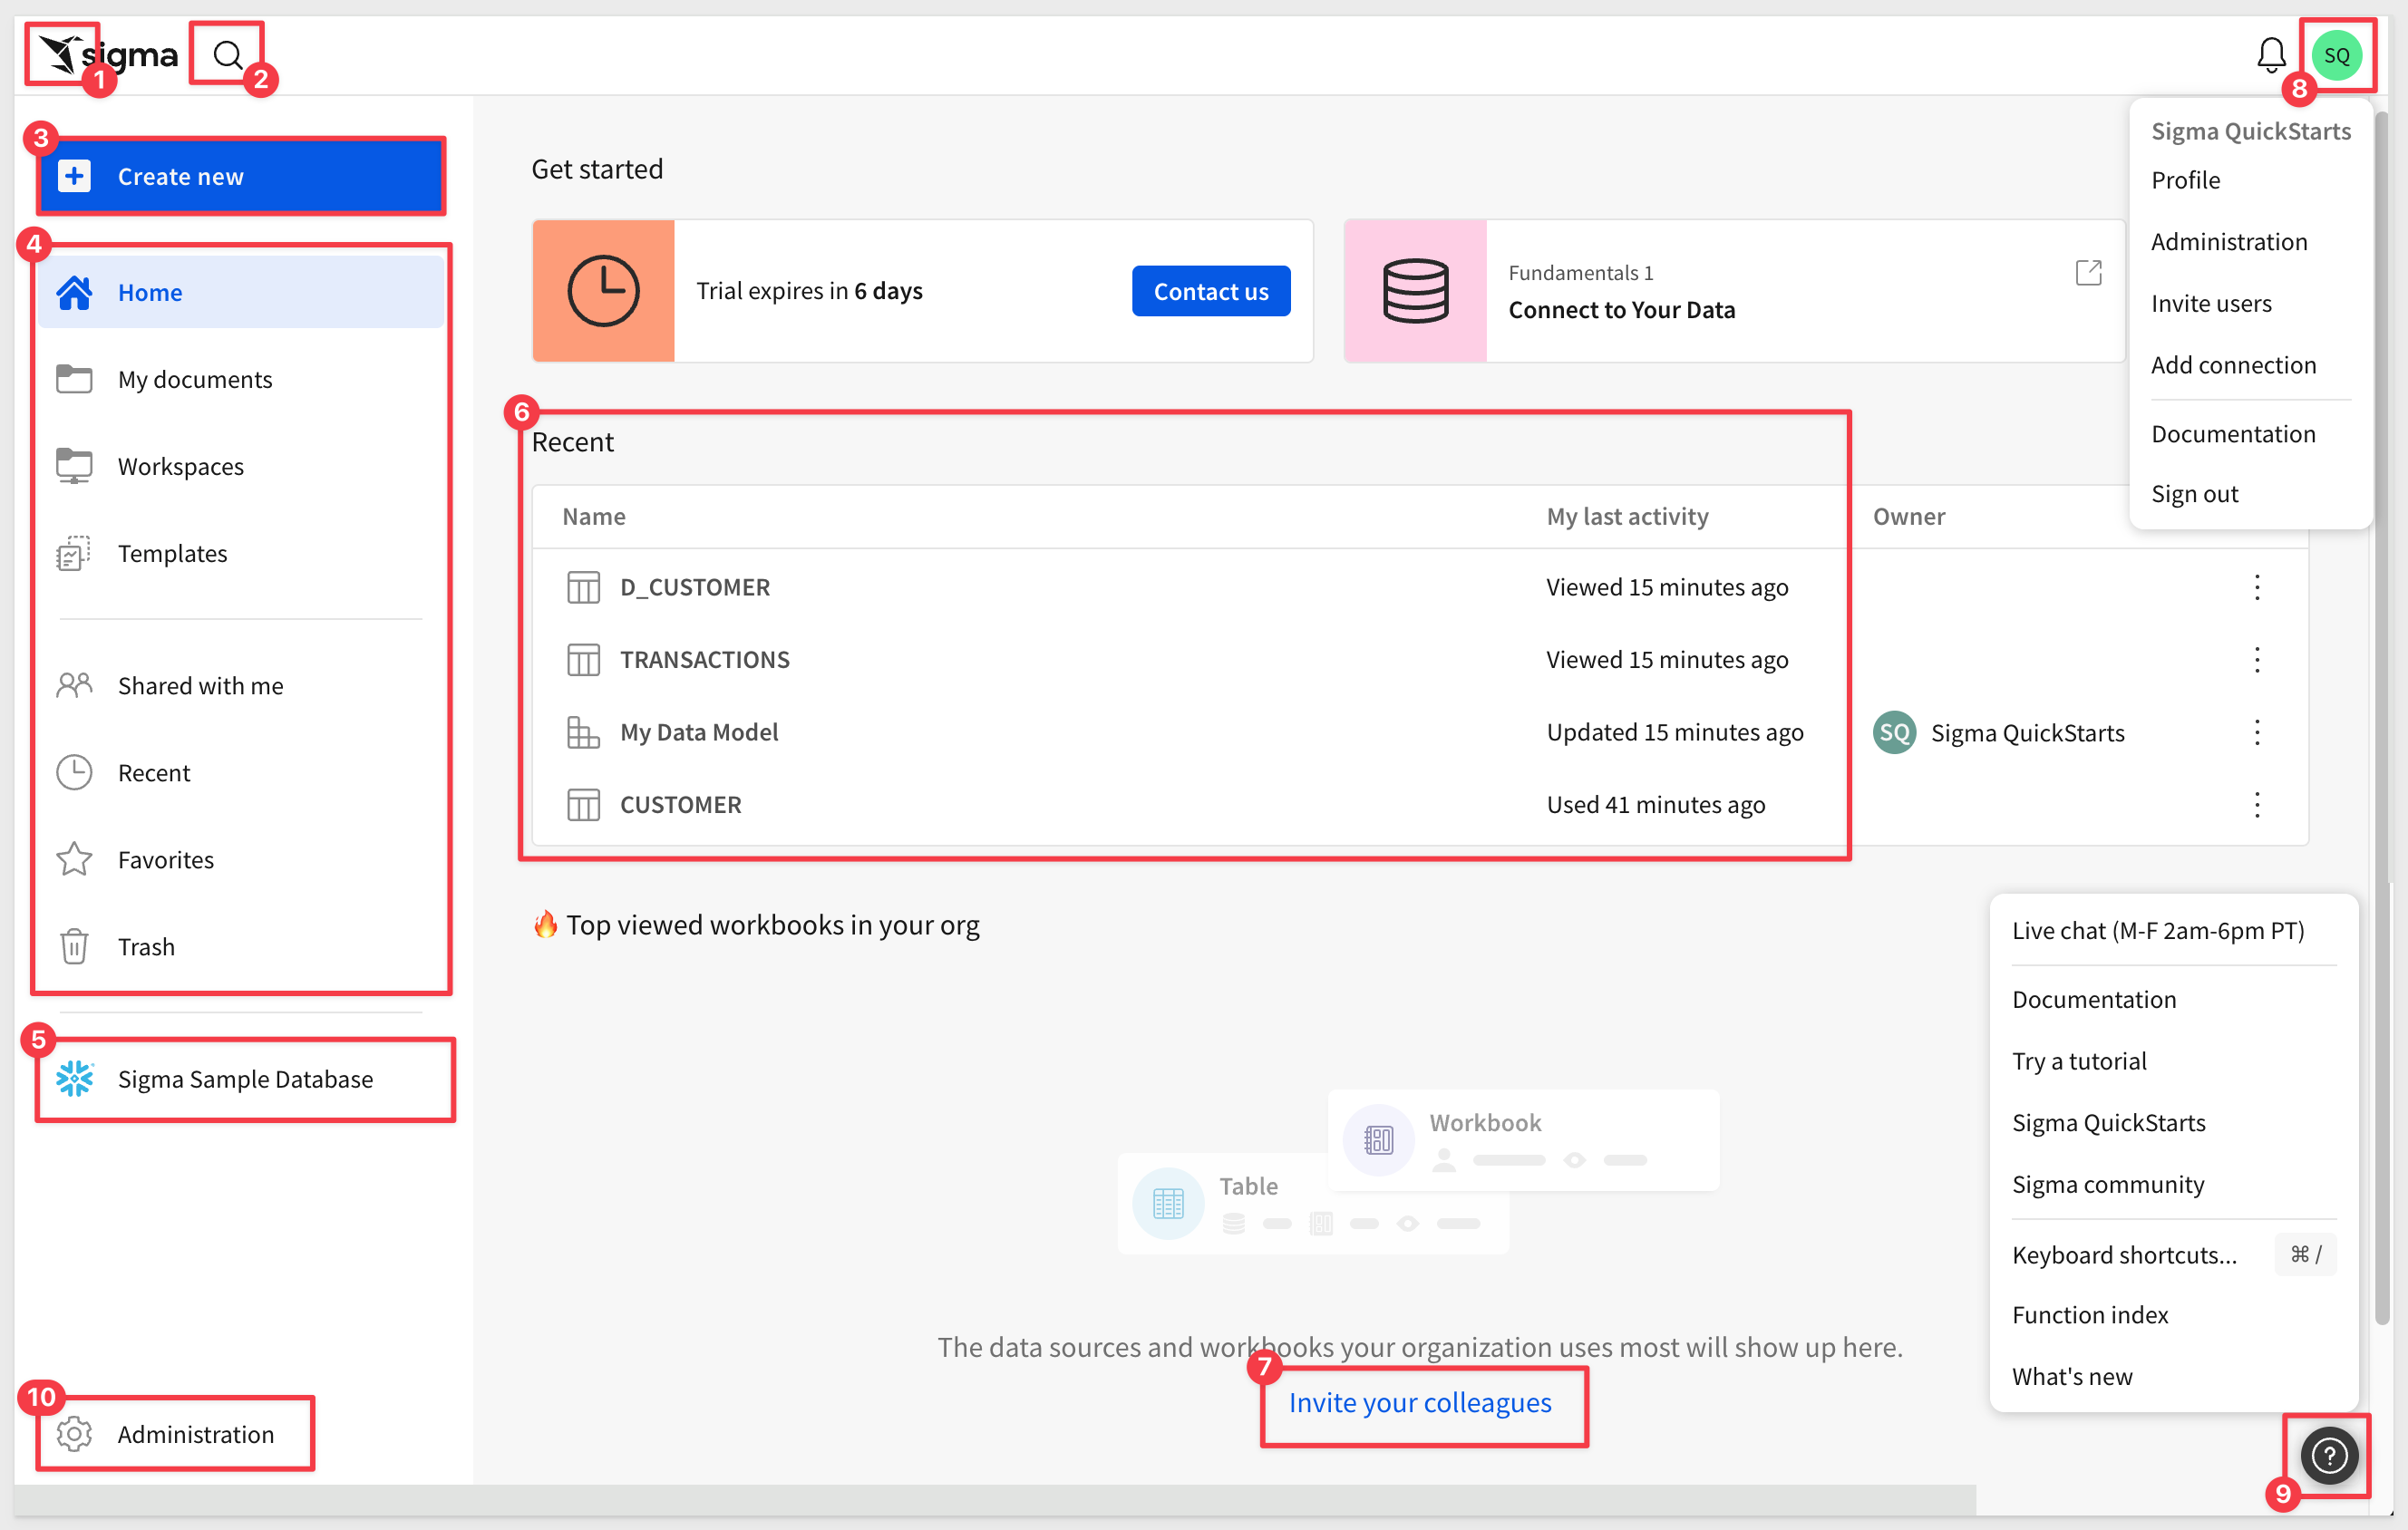
 Papercrane: If you want to get back to the home page from anywhere in the portal, just click the Sigma
 Papercrane logo in the upper left corner.
 Search: You can click in the search bar at any point to search for content within Sigma.
 Create New: Use this anytime you want to create new content.
<ul>
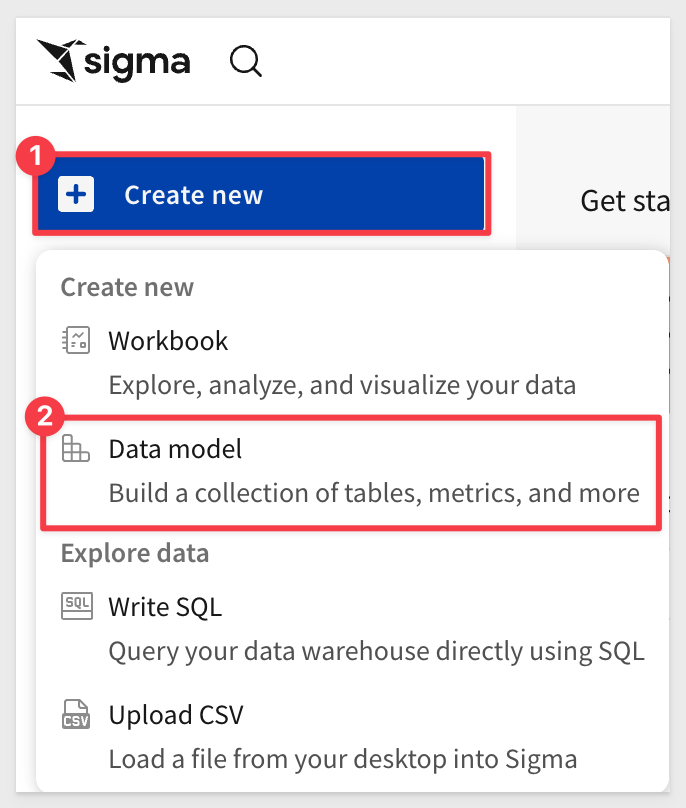
<li><strong>Workbook:</strong> our spreadsheet-like UI for analyzing data</li>
<li><strong>Data Model:</strong> A data model is a type of Sigma document that provides the framework for creating and managing a collection of reusable elements.</li>
<li><strong>Write SQL:</strong> allows you to write SQL to run against the data warehouse.</li>
<li><strong>Upload CSV:</strong> allows you to upload a CSV to the warehouse in order to perform analysis.</li>
</ul>
If at any time you notice an item labeled BETA, it means the feature is mature enough for all customers to evaluate while we finalize its release.
If you ever need to know what is new in Sigma, there are two resources for that:
We also provide a summary on the "First Friday" of each month, which includes everything released in the prior month, including bug fixes.
First Friday Features can be found here
 My Content:
 Connections Section: Visible to administrators and content creators by default, lists the data warehouses available.
Clicking on one of them shows the tables in that warehouse you can access. There can be many connections for a single Sigma account, each configured with different levels of access to the warehouse, to be shared with members or teams. The actual connection configuration is done in the administration section.
 Top viewed: Empty at the start, as teams start to create and use content, the most popular will float to the top of this listing.
 Invite your colleagues: Provides a quick method for adding users to your account. This is a configurable convenience; users in Sigma can be managed in the administration section or externally via any SAML 2.0 compatible identity management provider (i.e., Okta, Auth0 etc.).
 User Profile: In the top right corner, there is a box with your username initial. Clicking on it reveals your profile, where you can make changes to your preferences and sign out. Other UI options may or may not be visible to you depending on your permissions.
 Help: has lots of useful information for you to explore, to help you get the most out of Sigma.
 Administration: Dedicated area for user management and other common configuration settings. Only shown to users in the Admin role.
Now that we have our initial orientation done, we can move on to the next section.
Use case
For this demonstration, let's assume we are a data analyst at a retailer called Plugs Electronics. Marketing wants to do some ad-hoc analysis against sales transactions and wants to work from trusted data without making mistakes.
Corporate policy dictates that marketing should not have access to actual customer names and addresses but city/state information is fine.
The CFO wants to make sure that any calculations that are performed meet the published standard.
Set up the data model
Let's use Sigma's data modeling tools to create a reusable model to serve as the foundation for a workbook.
To create or manage a data model, the following is required:
- Users must be assigned an account type with the Create, Edit, and Publish datasets permissions enabled.
- Users must be the data model owner or be granted Can edit access to the data model.
By default, Sigma account types provide the following data modeling permissions:
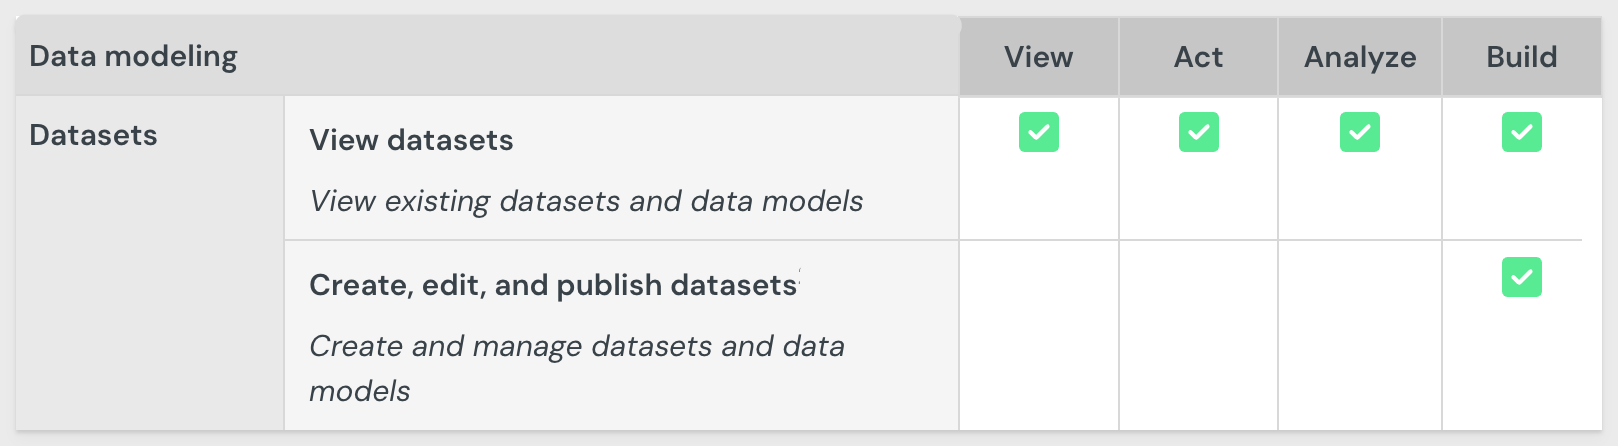
Access to individual data models and workbooks are determined by folder and document permissions
From the Sigma homepage, click Create new > Datamodel:
The data modeling page looks and behaves a lot like a standard Sigma workbook by design.
The more we work with Sigma, the more metadata becomes available, which helps drive Sigma's suggestions.
We can add elements to the page using the element bar. For example, we want to add a table:

In our case, we want to use tables from the Sigma Sample Database > Retail database and PLUGS_ELECTRONICS schema:
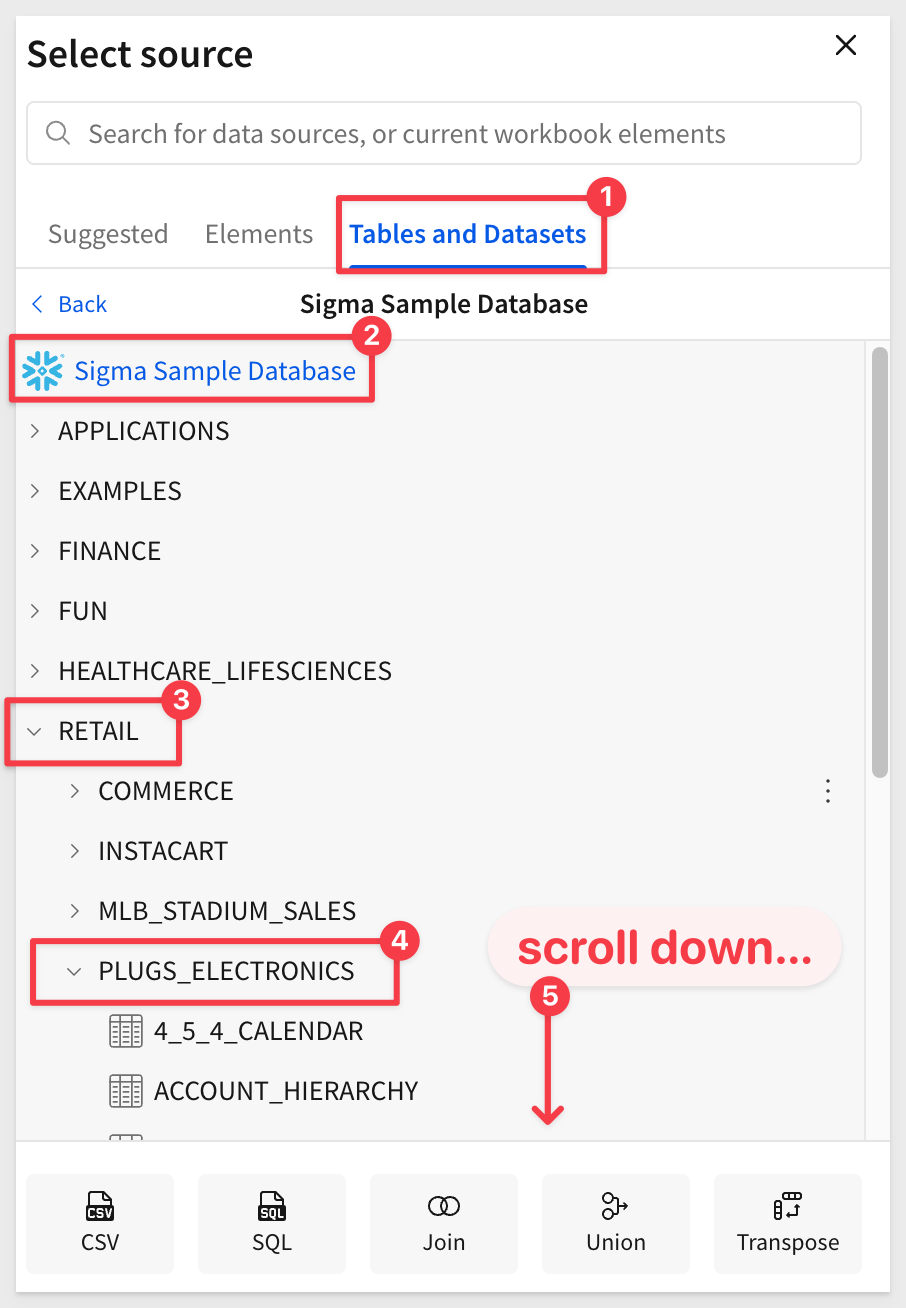
There are five tables that can provide the requested information for marketing.

Base table
To satisfy marketing's main request, we are going to create a "base table" by joining three tables together, culling the column list manually and creating a calculated column.
Much of the data model interface follows the familiar Sigma workflow to make things as easy as possible.
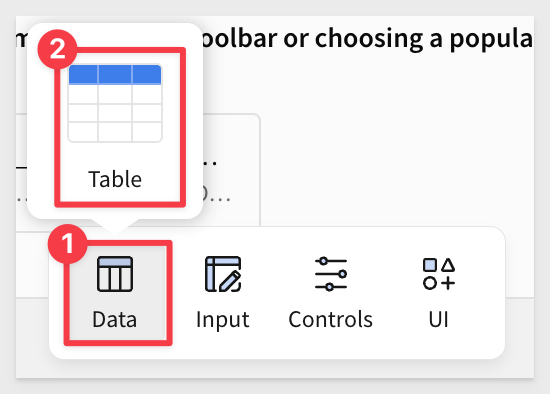
From the Element bar, select Data and drag a Table element onto the page:
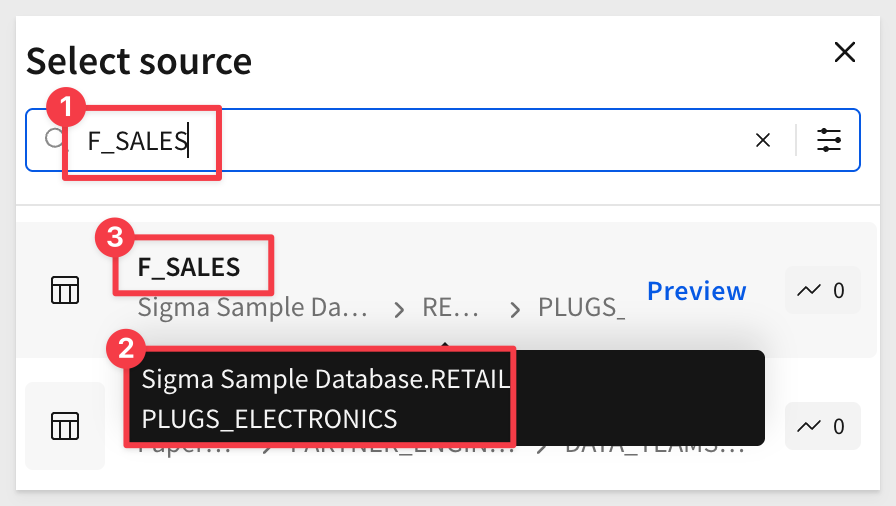
Click Select source.
We could navigate to the table but it is easier to just search for F_SALES and select the table from the RETAIL schema:
The table is added to the page and we can work with it just as we would in a Sigma workbook.
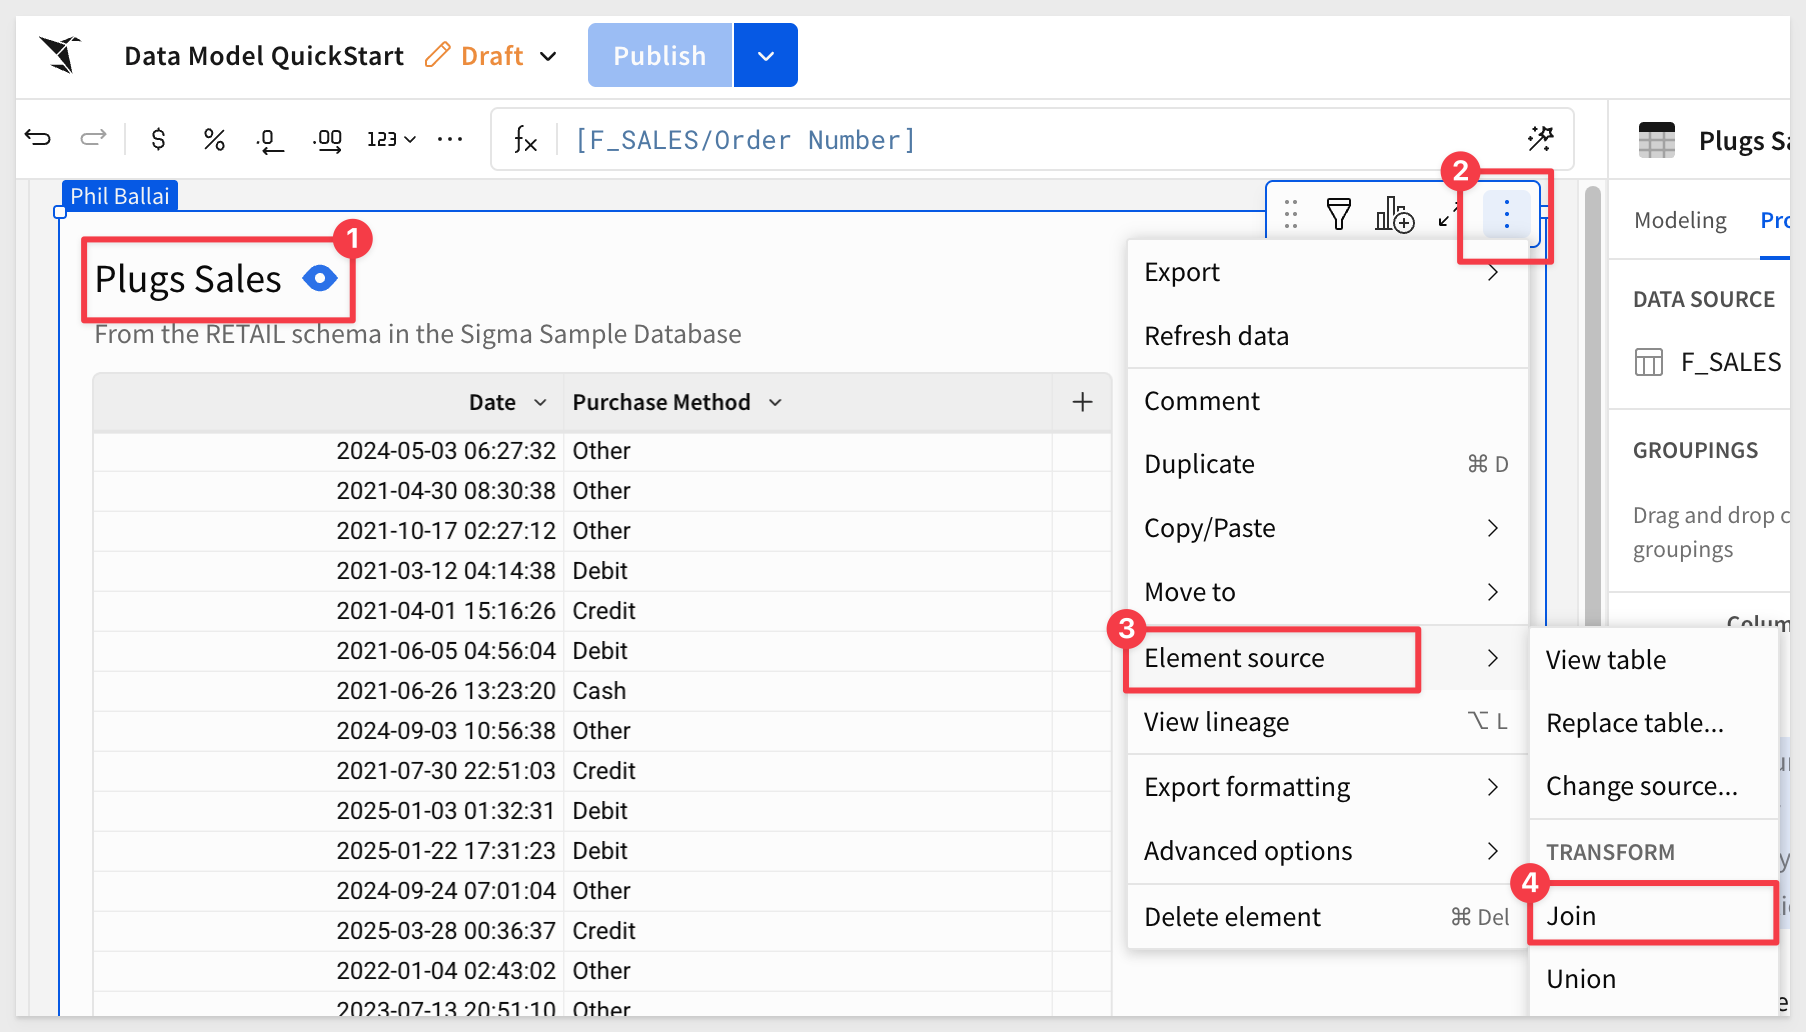
Rename the table to Plugs Sales.
Join more tables
Since we know that marketing will always need columns from the D_CUSTOMER and F_POINT_OF_SALE tables, we can join them directly.
Using joins, we'll connect these two tables. Combined with the base table, this satisfies marketing's initial request.
From Plugs Sales, select Element source > Join from the table menu:
Search for D_CUSTOMER and select the one from the RETAIL schema.
Accept all columns and set the Join keys to Cust Key. There are 105 customers who have never made a purchase:

Click the + icon to add another table to the join, this time selecting the F_POINT_OF_SALE table (from the RETAIL schema!) and joining on Order Number:
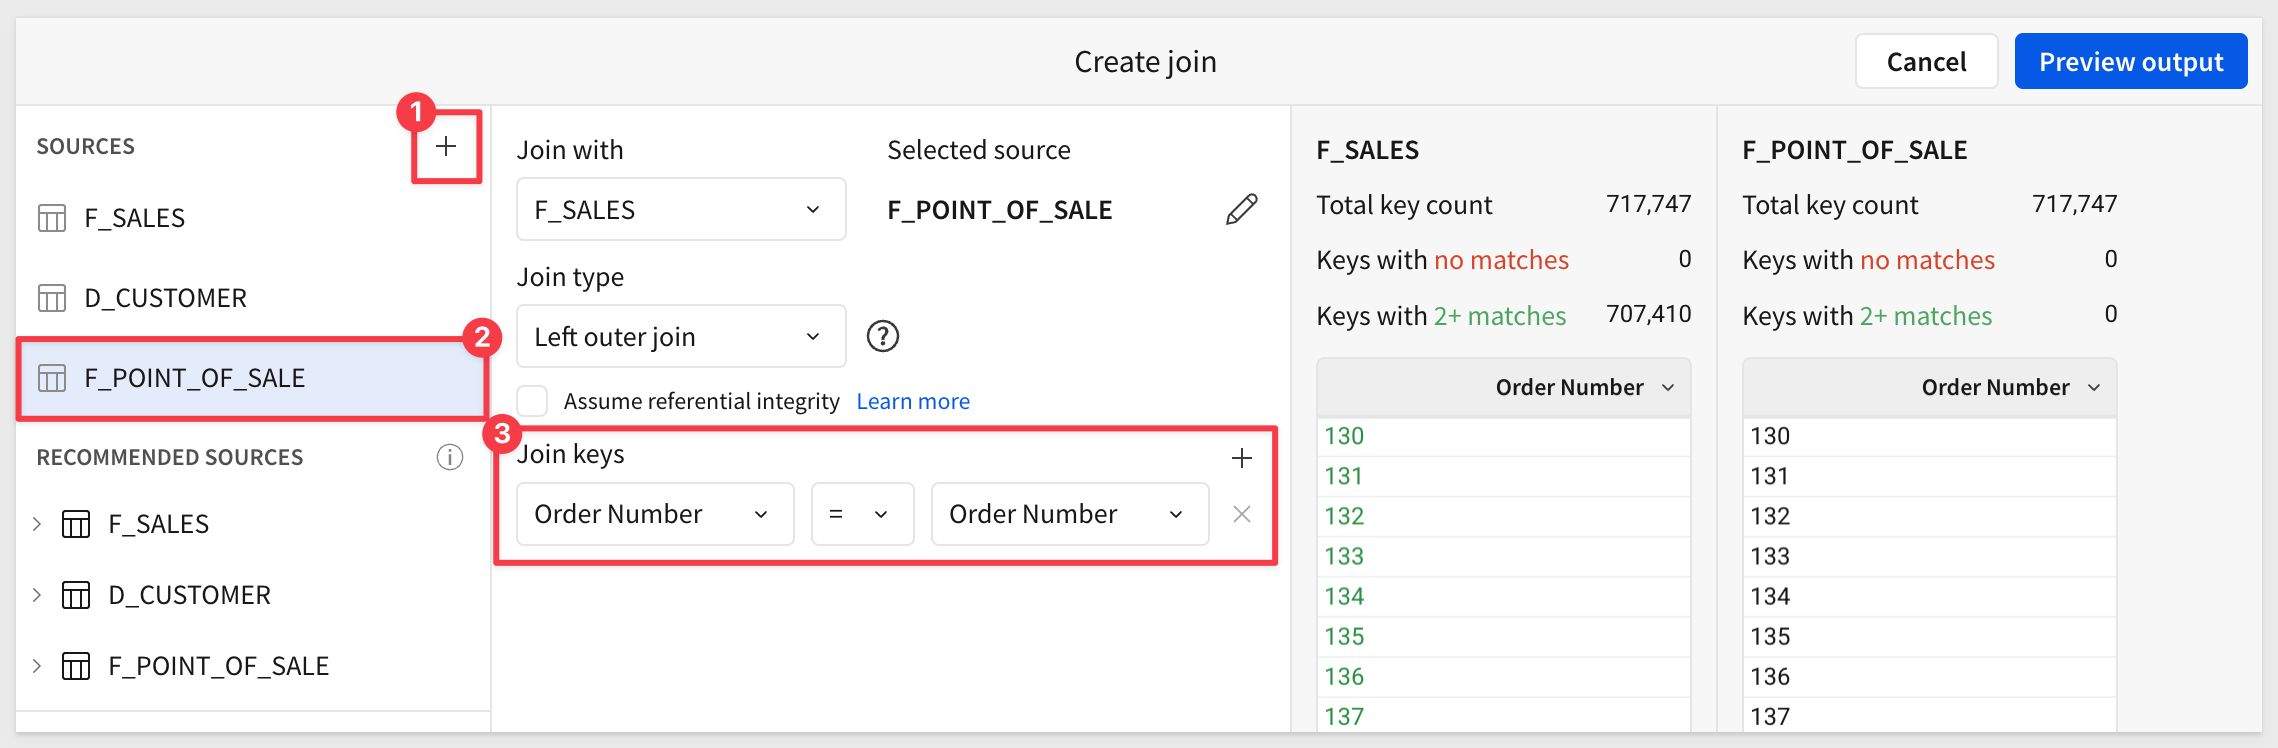
Click Preview output.
Sigma shows us the lineage of the joins and gives us an opportunity to deselect columns as needed:
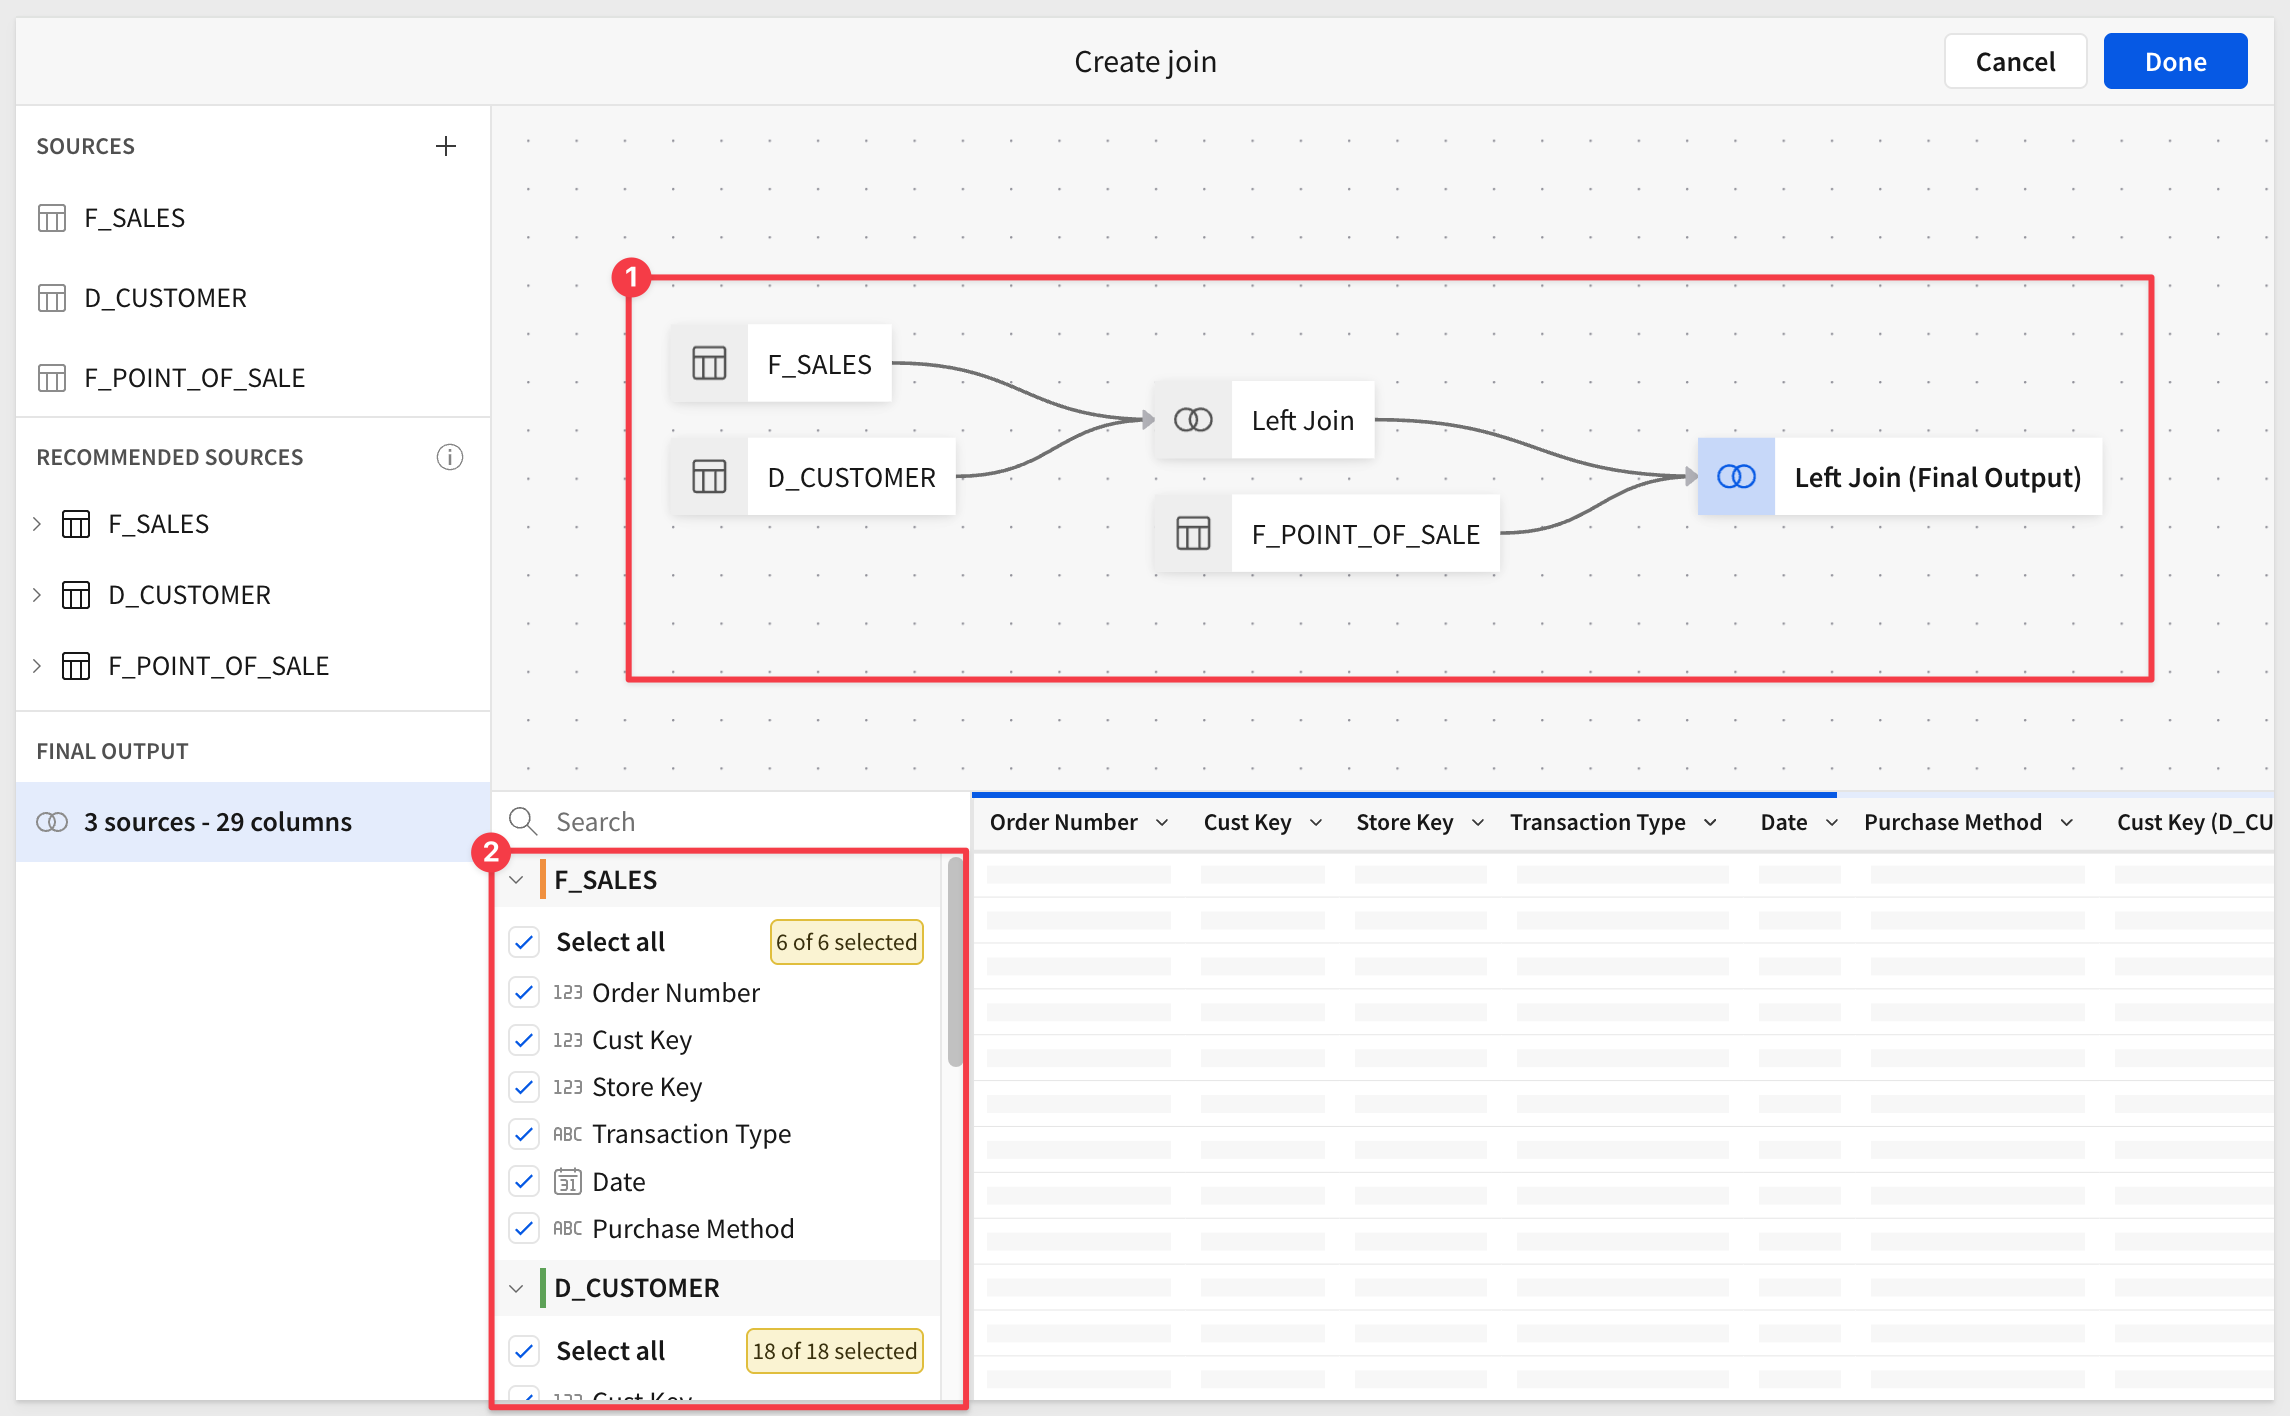
Since this is our "base table" it is a good idea to delete columns that users will never need. For example, columns with duplicate information or key columns that won't be used to create relationships later.
Click Done.
Calculated columns
Since our base table does not have columns for Revenue or Profit, we can add them easily:

Add a new column ,and rename it to Revenue. Set the formula to:
[Sales Amount] * [Sales Quantity]
Add another column, and rename it to Profit, and set the formula to:
[Revenue] - ([Cost Amount] * [Sales Quantity])
The results look like this:
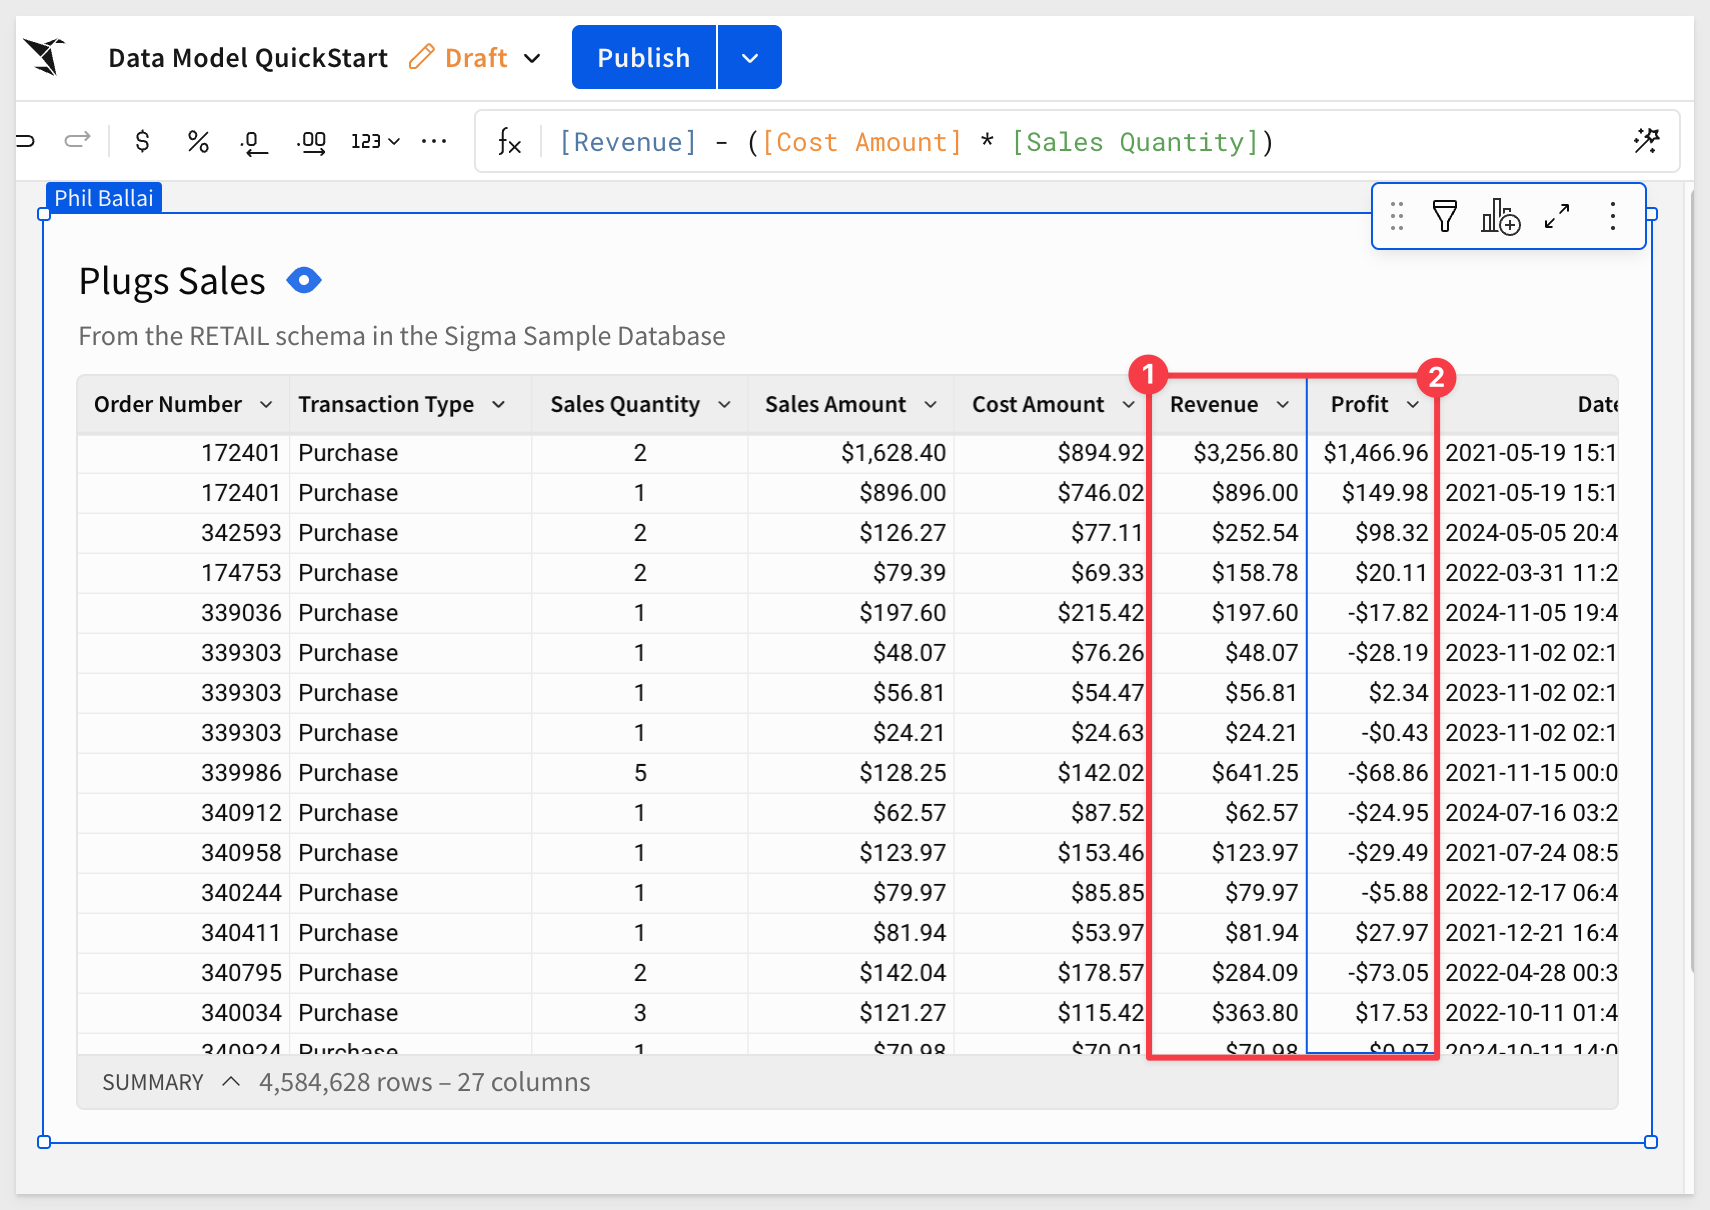
This are simple functions, but if you click on the "ƒx" icon to the left of the formula bar, you can see a full list of all the functions Sigma supports. Sigma also provides helpful tooltips and autocomplete within the formula bar to help guide users how to use the functions.
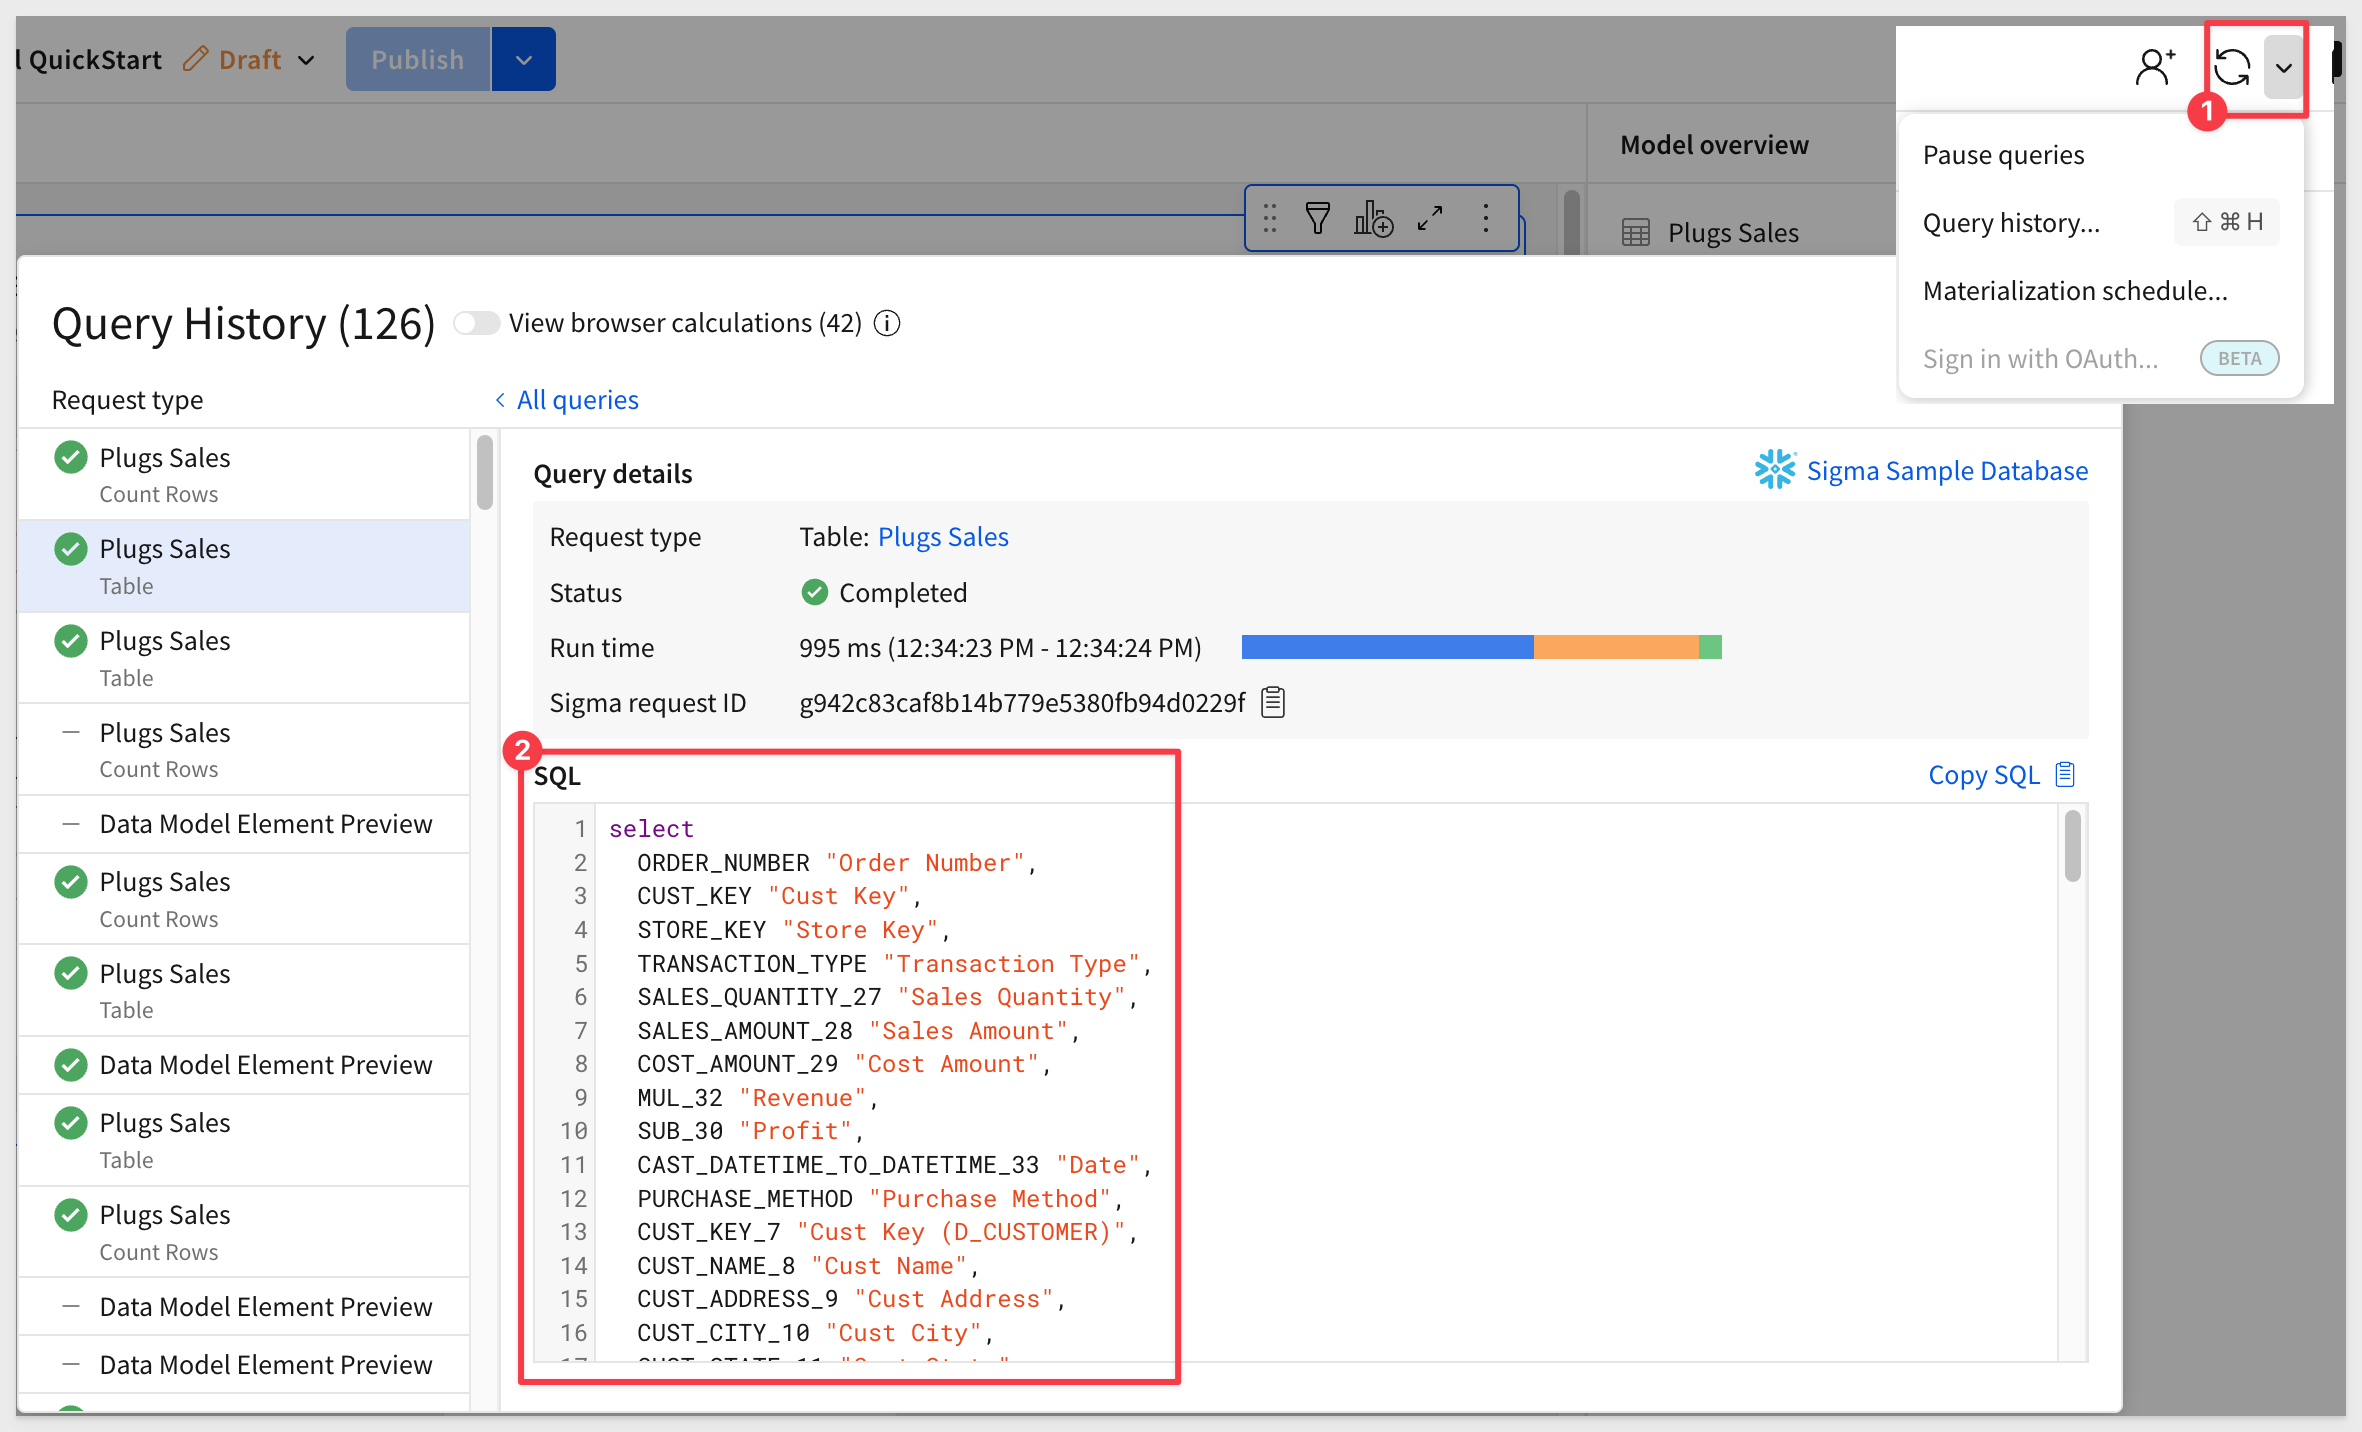
Machine-generated SQL
Every action we take in Sigma produces machine generated ANSI compliant SQL that is pushed down to Snowflake ensuring the data is secure and up to date at all times. Sigma never extracts from, or modifies data in, the cloud data source.
You can see the queries we are generating by clicking the dropdown next to the refresh button on the top right and selecting Query History:
For more information, see Query history reference
There is also a QuickStart on Sigma's Query Engine
Click Publish.
Corporate policy
In our use case, marketing is not allowed to see customer names and addresses. We need to make sure that is enforced.
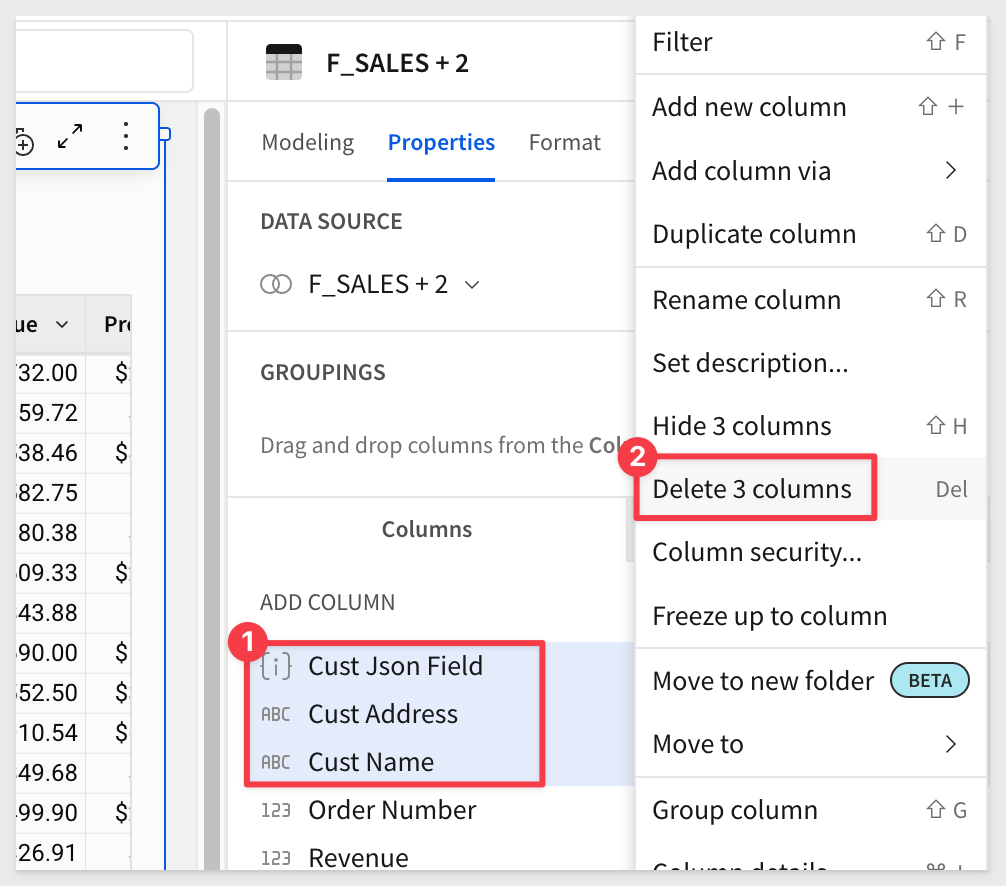
It is simple to just delete the Cust Name and Cust Address from the base table and we are done.
However, closer inspection shows that the Cust Json Field column has variant data that includes names and addresses as well.
Since Sigma makes extracting Json data so simple, we need to be sure to delete that column as well.
For more information on extracting Json data in Sigma, see the QuickStart Parsing JSON Data in Seconds
Go ahead and delete these columns:
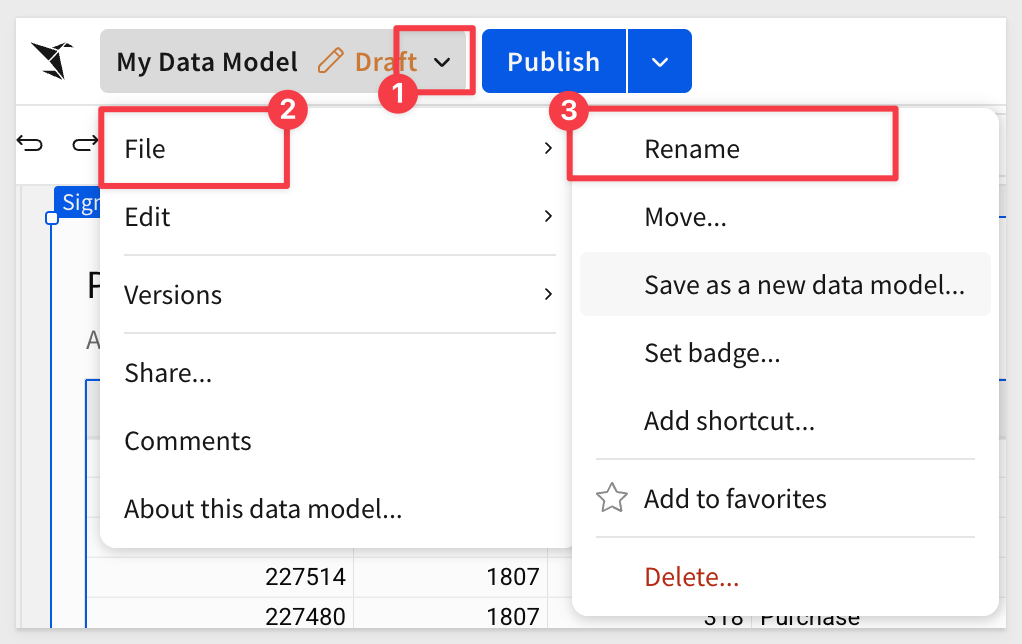
Save the data model as Data Model QuickStart:
Click Publish.
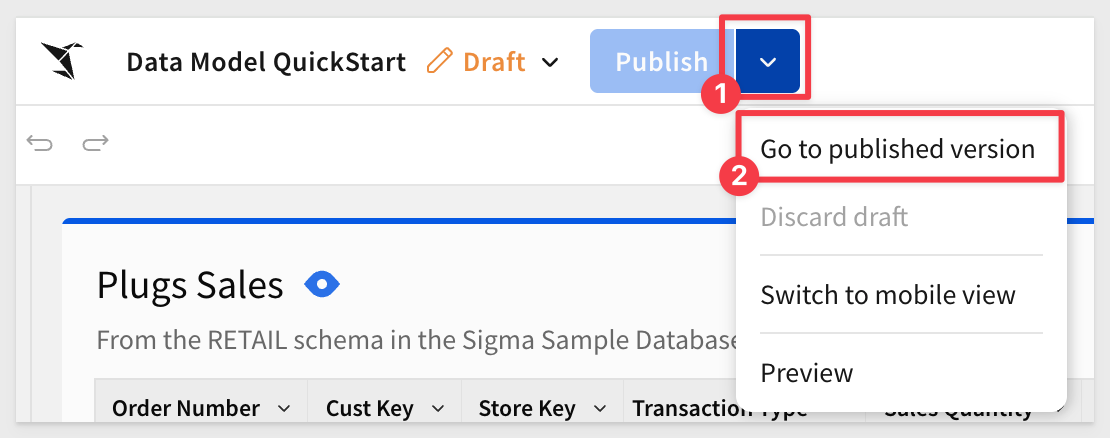
We can see the data model as users with permission will see it by clicking Go to published version:
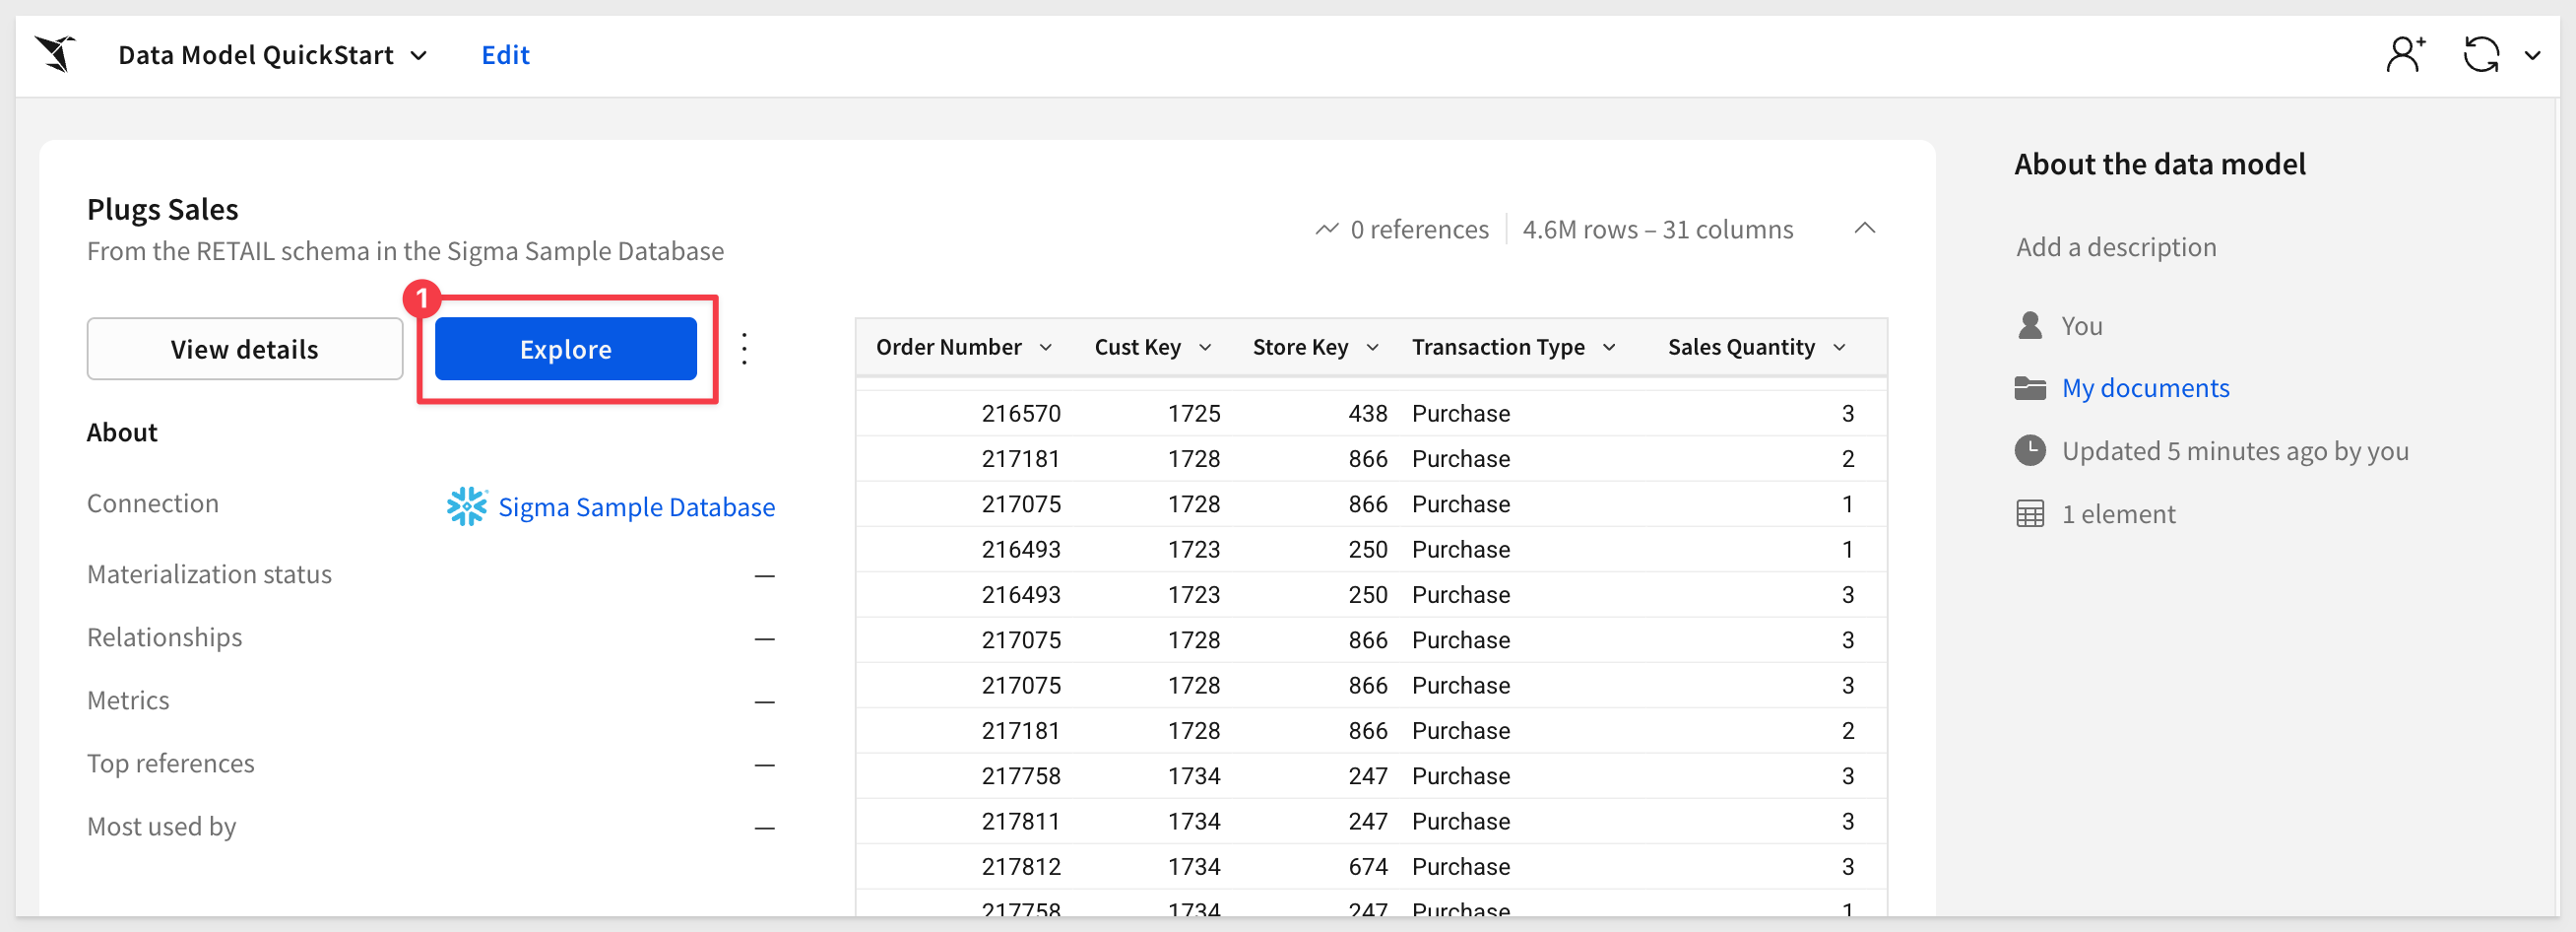
Here we see the very basic information about the data model:
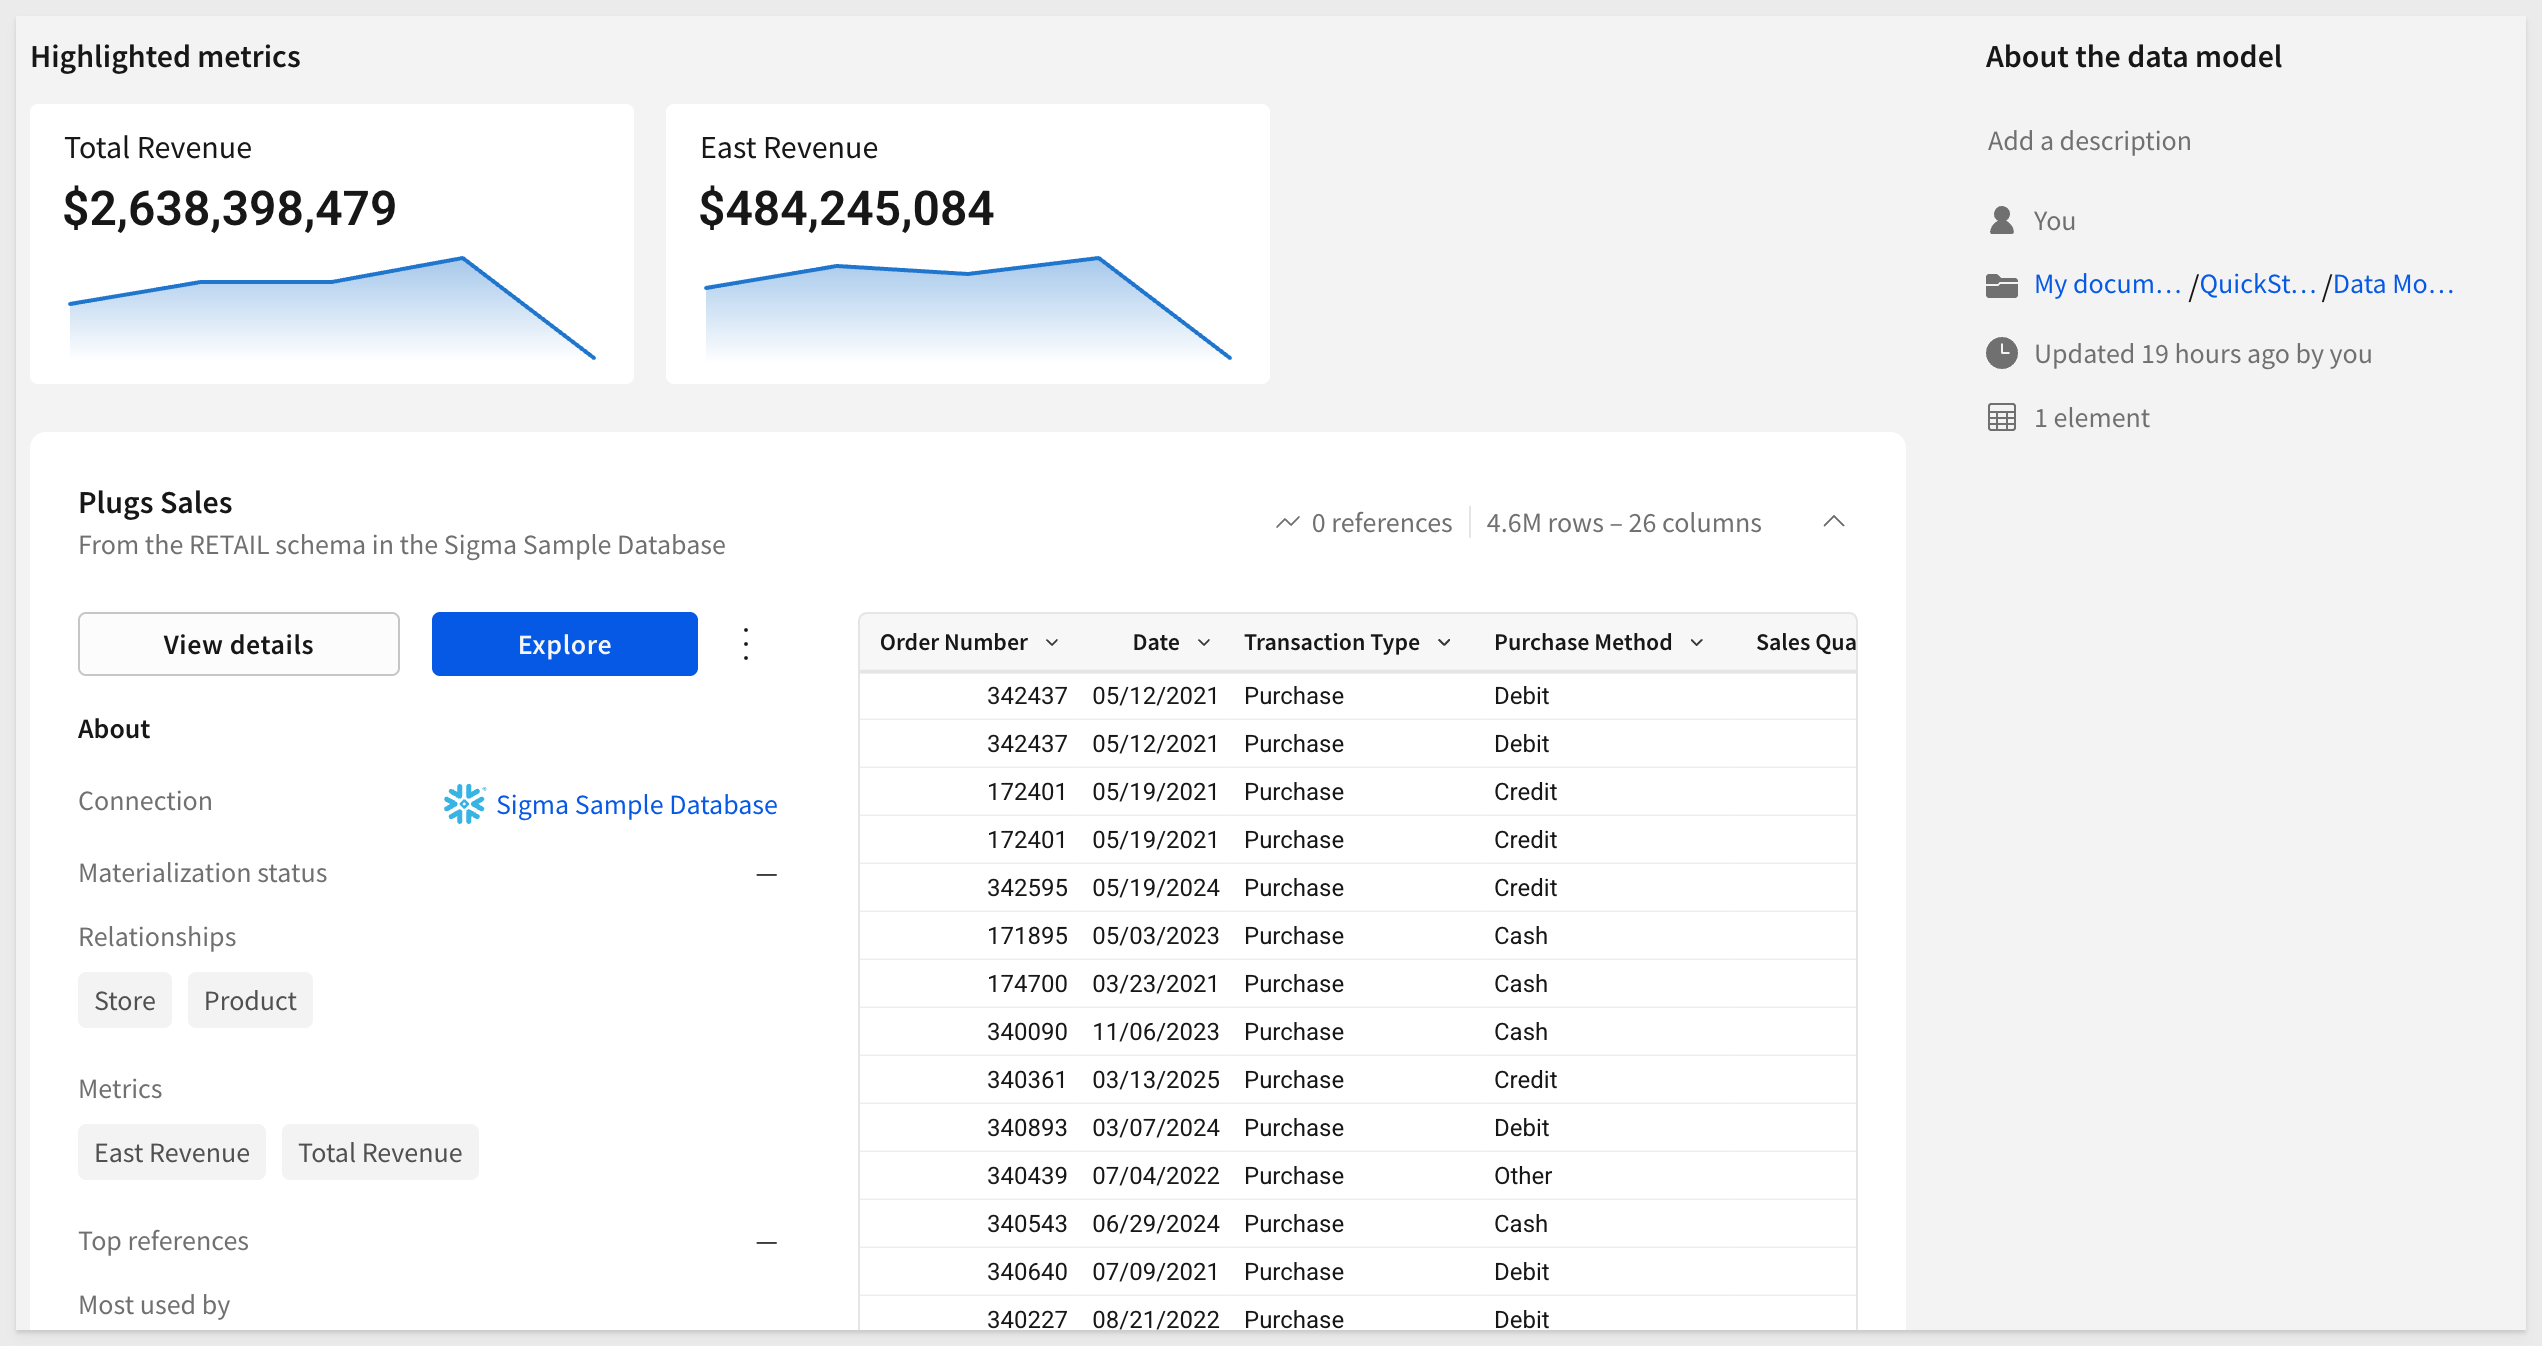
When a data model is fully built out, they can provide a ton of useful information to workbook builders. For example:
For more information, see Get started with data modeling
Click Explore and we are launched into a workbook with the Plugs Sales table loaded for us. Since this data comes from a model, we know that it meets corporate guidelines and the data is trusted.
Create Visualizations
It is often easier to spot trends, outliers, or insights which lead to further questions when viewing data in a visualization. Sigma makes it easy to create visualizations of your data while also enabling you to dig into the data that makes up that visualization.
Start the creation of a visualization by selecting the Plugs Sales table and then click the Create child element icon on its top right corner and select Chart to start creating a new chart.
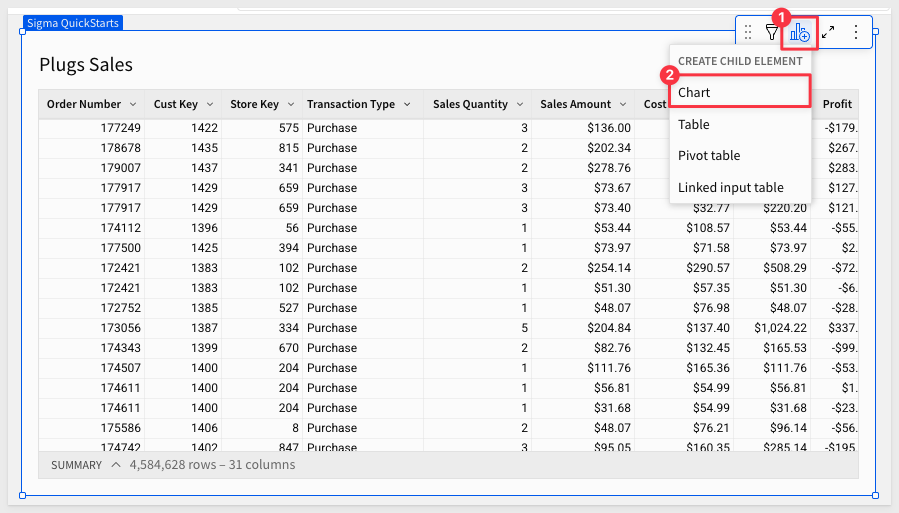
This will add a chart below our table.
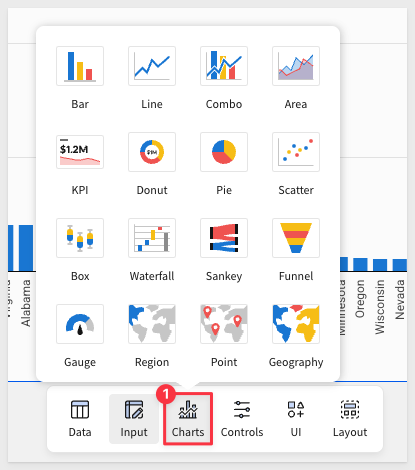
In the right-hand Element panel you will see a dropdown that lists all of the supported chart types:
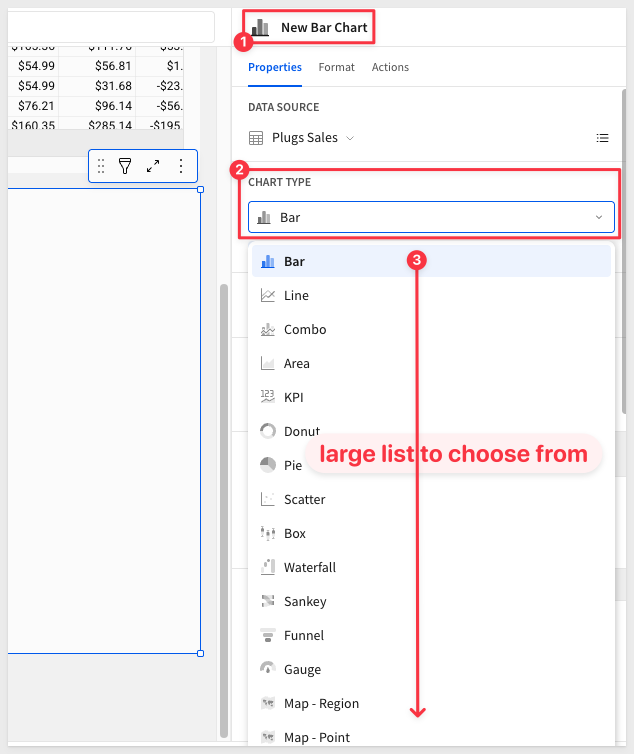
For more information, see Chart Types
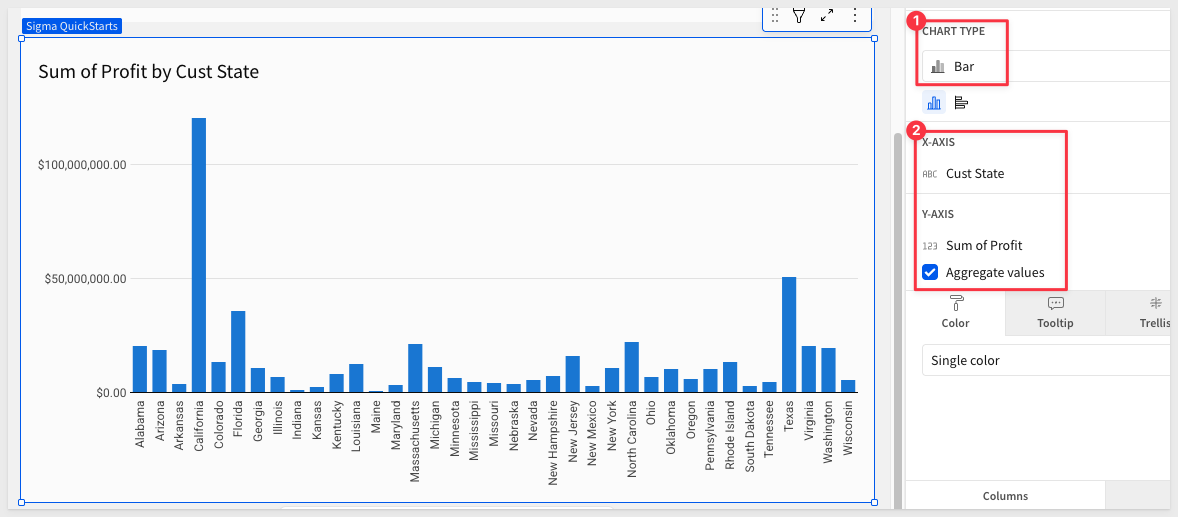
Select the bar chart. On the X-Axis click the plus button and add our Cust State column.
We can also drag values onto the Axes instead of using the add button.
If we look at our columns on the bottom, find the Profit column and drag it under the Y-Axis.
The value will automatically aggregate and become Sum of Profit:
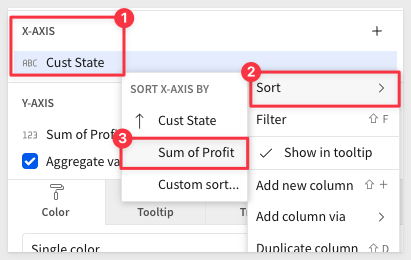
Under the X-Axis header, click the dropdown next to Cust State and go to Sort then Sum of Profit. This will put the x-axis in ascending order.
Now let's look at our sales over time to get an understanding of how we are trending. Another way to create a new chart is by using the Element bar and selecting the chart type we want:
Select a Line chart. Sigma prompts for a source. We can reuse the Plugs Sales table, or the other chart or something from some other data source too.
Select Plugs Sales.
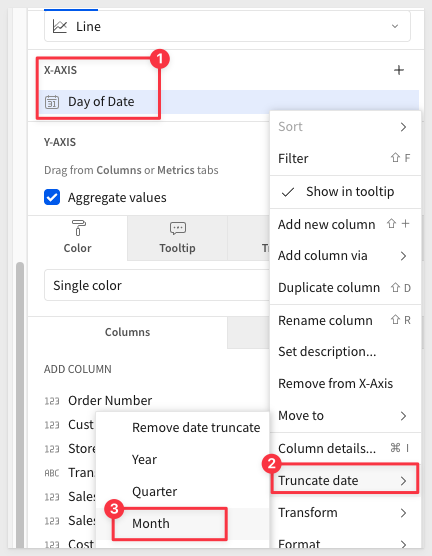
Next, drag the Date column into the X-Axis.
Notice that Sigma has defaulted to change the aggregation to Day as the title now reads Day of Date.
We can change this aggregation at any time using the dropdown next to the field name, and selecting a new aggregation level under the Truncate date submenu. Let's change the aggregation level to be Month:
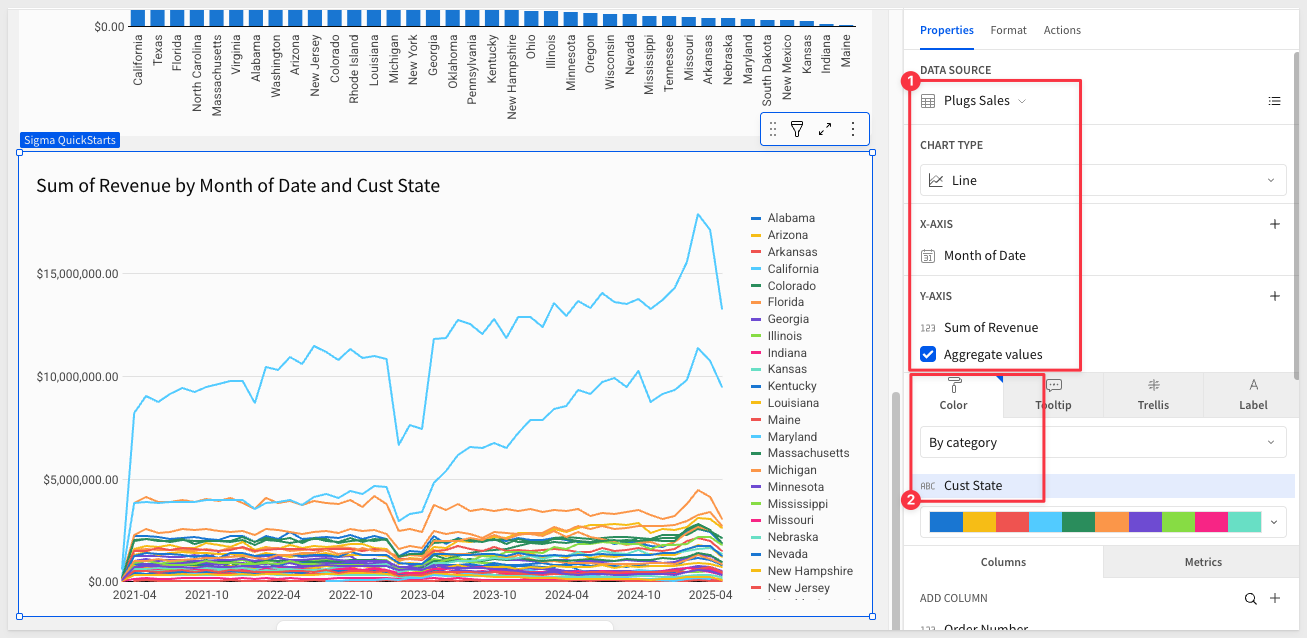
Next we can place our Revenue column on the Y-Axis to see our revenue over time. Again, Sigma has automatically summed the revenue to the monthly level:
Pivot Table
By now the general workflow is pretty clear so adding a pivot table is not much different. Add one from the Element bar and configure it as shown:
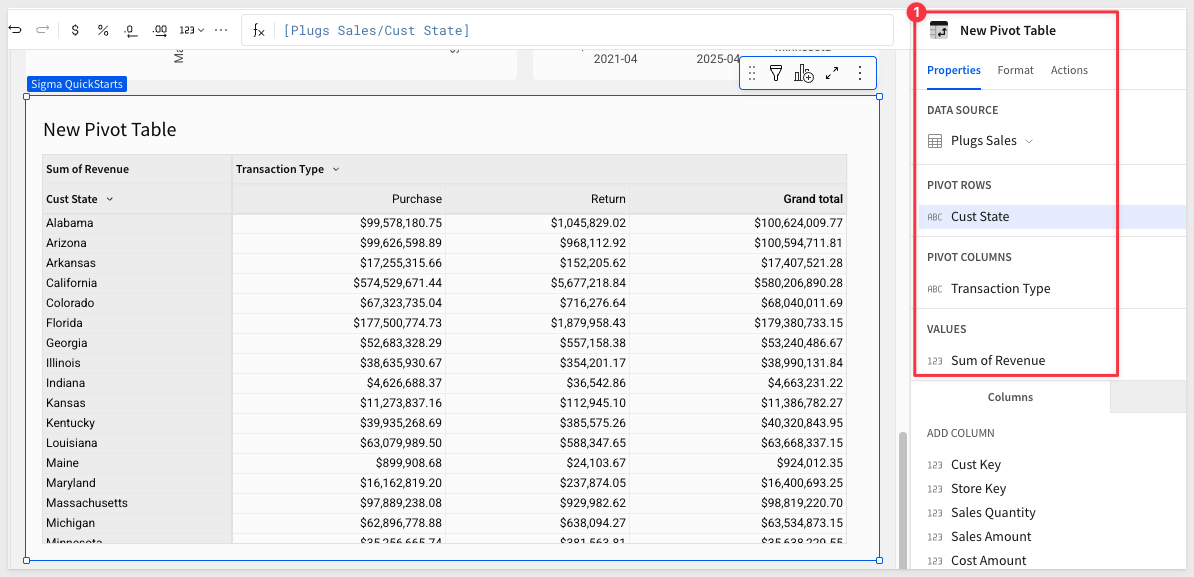
There are many more things we can do with pivot tables in Sigma. For more information, see Working with pivot tables
Click Publish.
Filtering in Sigma is simple and powerful too. We can add a variety of filters using the Element bar but let's use a different workflow.
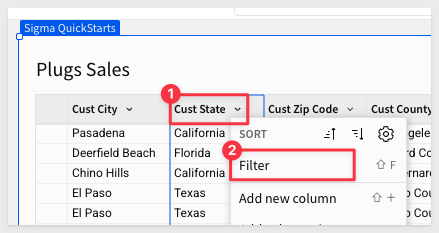
From the Plugs Sales table, open the column menu for Cust State and select Filter:
Normally, this method can be used to manually filter any page element but instead, let's convert it to page control:
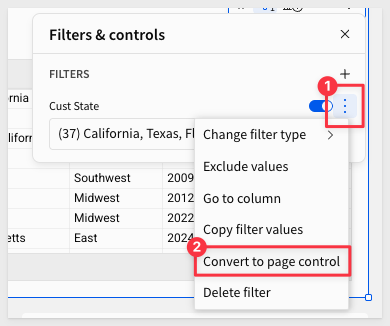
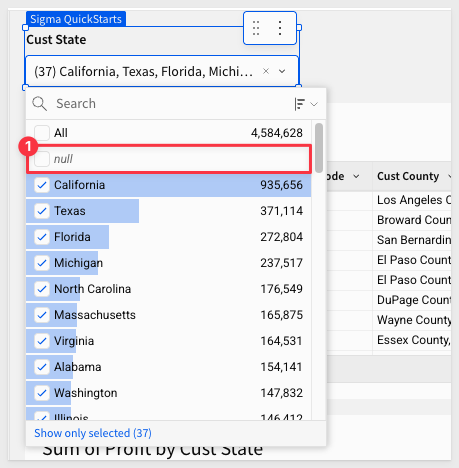
This places a new list control on the page for us:
We can further configure various options of the control using the Element panel:
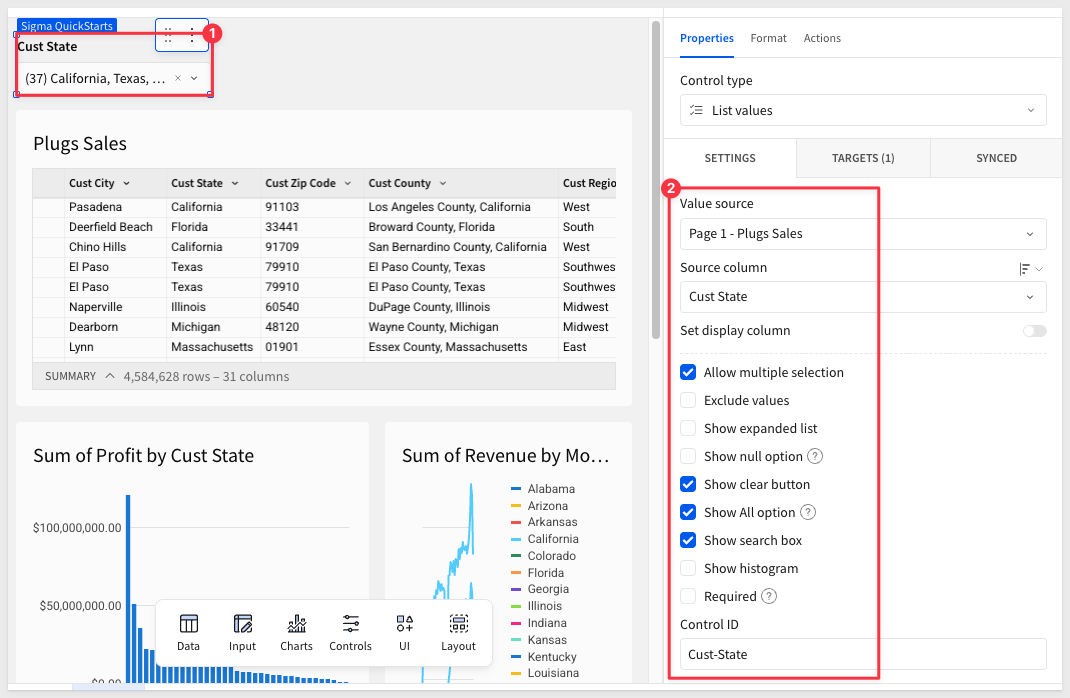
The last thing we need to do is to configure the control to "target" other page elements:
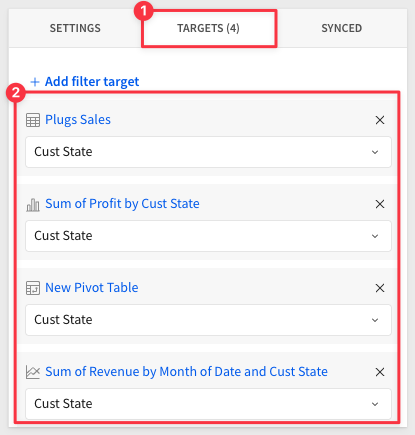
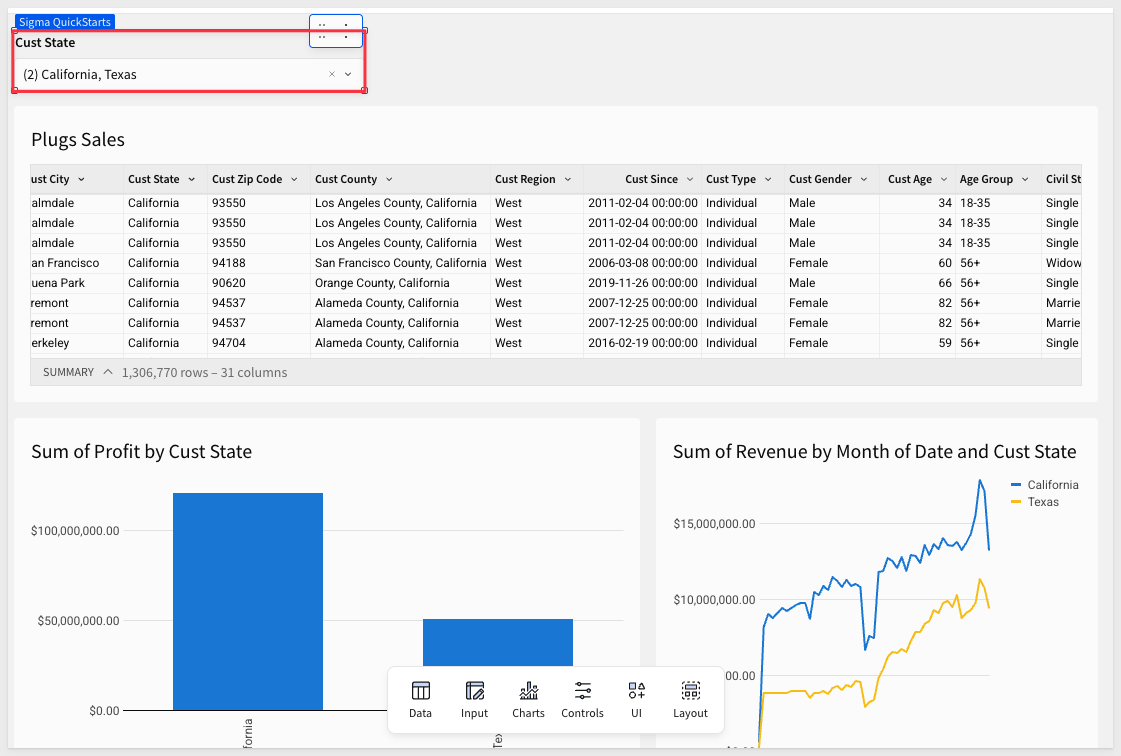
Selecting just a few states from the filter will now filter all the elements on the target list:
Lastly, click Save As and give your workbook a name.
In this QuickStart we went through the process of setting up a Snowflake free trial, and a Sigma free trial through Snowflake partner connect. We did some light modeling, and an analysis resulting in a Sigma workbook.
The seamless transition from Snowflake to Sigma enables data professionals to iterate quickly and with ease. This sets Sigma up uniquely to not only provide a robust client facing tool but also a great sand box for data engineers to profile and experiment with freshly landed data in Snowflake.
We really only skimmed the surface of Sigma. Be sure to check out the other resources below to get more information.
Another great resource for learning Sigma are the Fundamentals QuickStart series
Helpful Resources
Be sure to check out all the latest developments at Sigma's First Friday Feature page!
- Help Center including Documentation: https://help.sigmacomputing.com
- Sigma Blog: https://www.sigmacomputing.com/blog/
- Resources and Case Studies: https://www.sigmacomputing.com/resources/