Sigma is a cloud-native analytics platform that provides a familiar front-end user interface enabling you to query, profile, visualize, and explore massive datasets stored and shared in leading data platforms like Databricks. Sigma directly connects to Databricks and a proprietary SQL-generation engine that translates user interactions on a familiar spreadsheet interface into machine-optimized SQL.
Sigma unlocks the power of the Databricks Lakehouse Platform by providing speed, scalability and security with the flexibility to pivot billions of rows of data.
### Getting Started
This is an entry-level lab that will show you how to create a Sigma account through Databricks' Partner Connect. This lab is specifically designed for those users who already have a Databricks' account and would like to create a trial of Sigma to test and understand its functionality.
Prerequisites
1: A computer with a current browser. It does not matter which browser you want to use.
2: Access to a Databricks workspace
3: Ability to create tokens within your Databricks workspace
4: Access to data within your Databricks workspace to visualize within Sigma
5: The Sigma instance will be provided via Databricks Partner Connect. No need to create an Independent Sigma trial account.
For more information on Sigma's product release strategy, see Sigma product releases.
What You'll Learn
The steps in this lab will guide you through the following:

Getting started is simple. First navigate to your Databricks workspace through your preferred web browsing client.
The URLs look like this, depending on your cloud provider:
Once, you have navigated to your instance of Databricks and follow these steps.
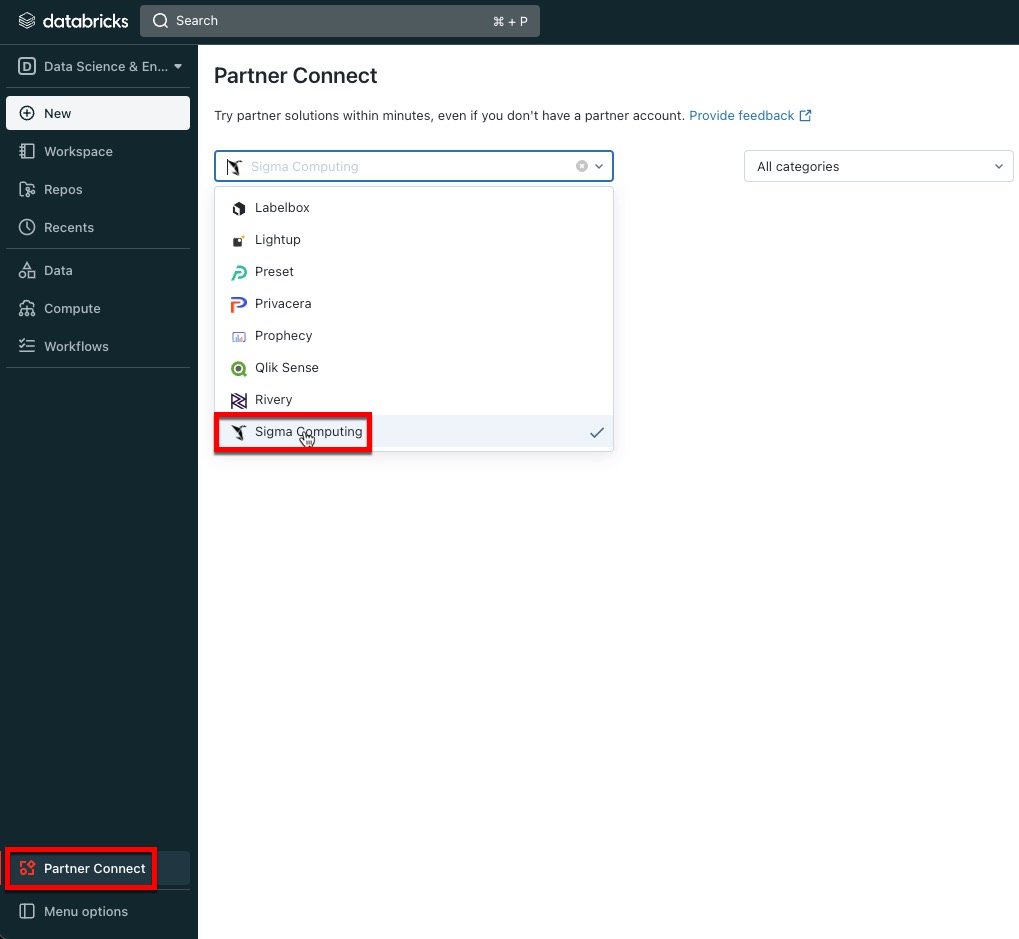
Select Partner Connect within the menu bar.
Search for Sigma Computing in the search bar:

Creating the Connection between Sigma and Databricks
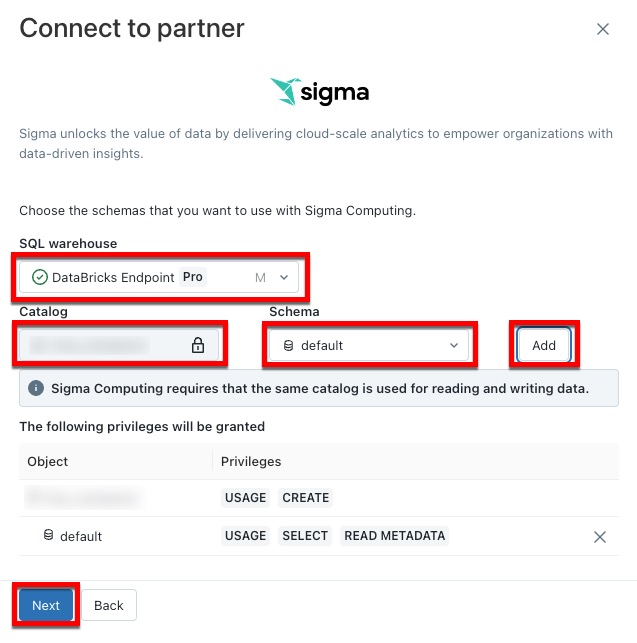
Navigate through the Partner Connect UI.
Navigate to the sub-window and Add which SQL Warehouse, catalog, schema and tables Sigma will have access to then click Next:
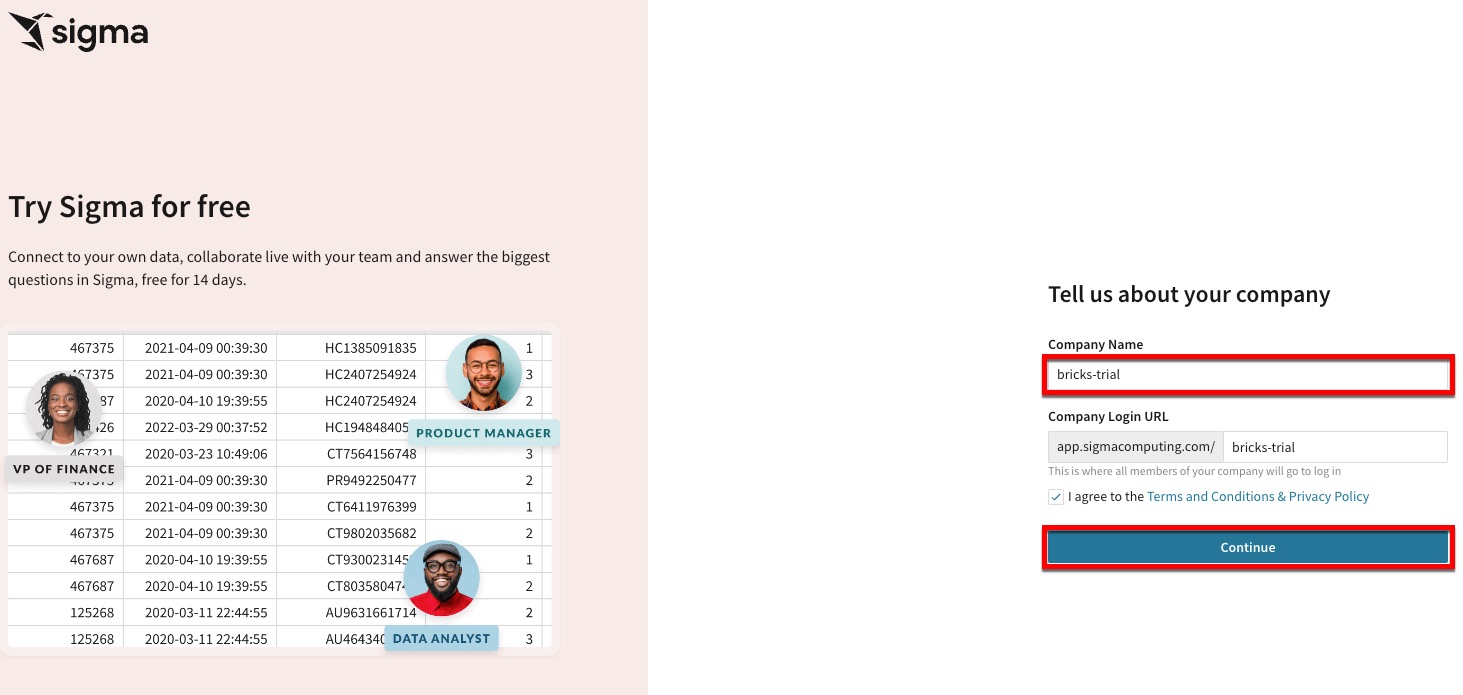
Creating your Sigma trial instance
This takes you to a screen showing the name of the user, privileges and the autogenerated personal access token.
After reviewing these items, click Next and Connect to Sigma Computing.
From here, you create your Sigma trial instance connected to your Databricks account:
Accessing Sigma, Creating a Connection and Assigning Permissions
Now that we have your Databricks workspace connected and Sigma trial instance created, the first step is getting oriented in the Sigma UI.
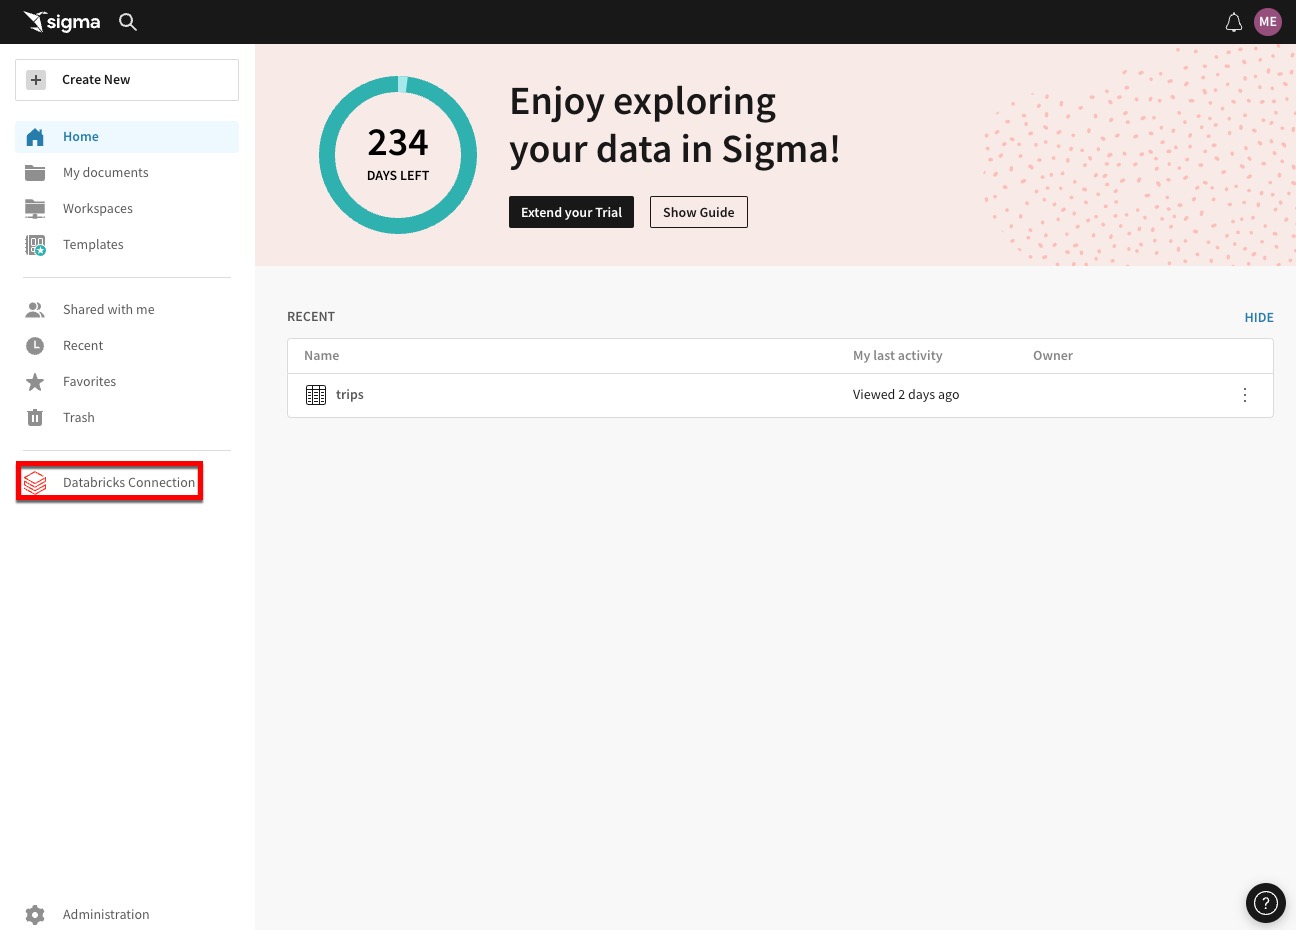
Within your browser, you should see the Sigma home page.
In the navigation panel on the left, you will see the newly created Databricks Connection.
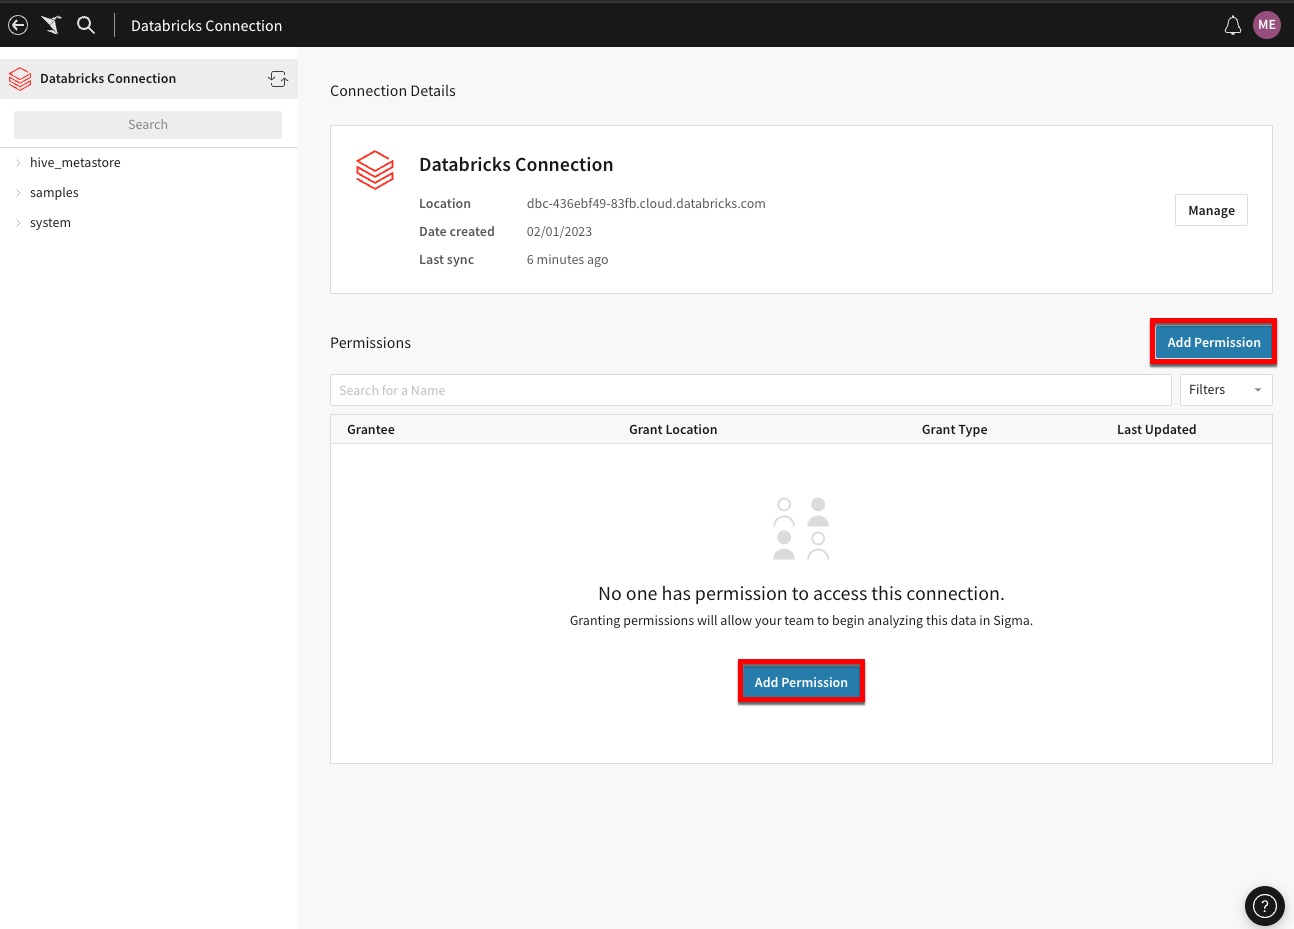
Click on the connection:
On the resulting page, click one of the two blue Add Permission buttons:
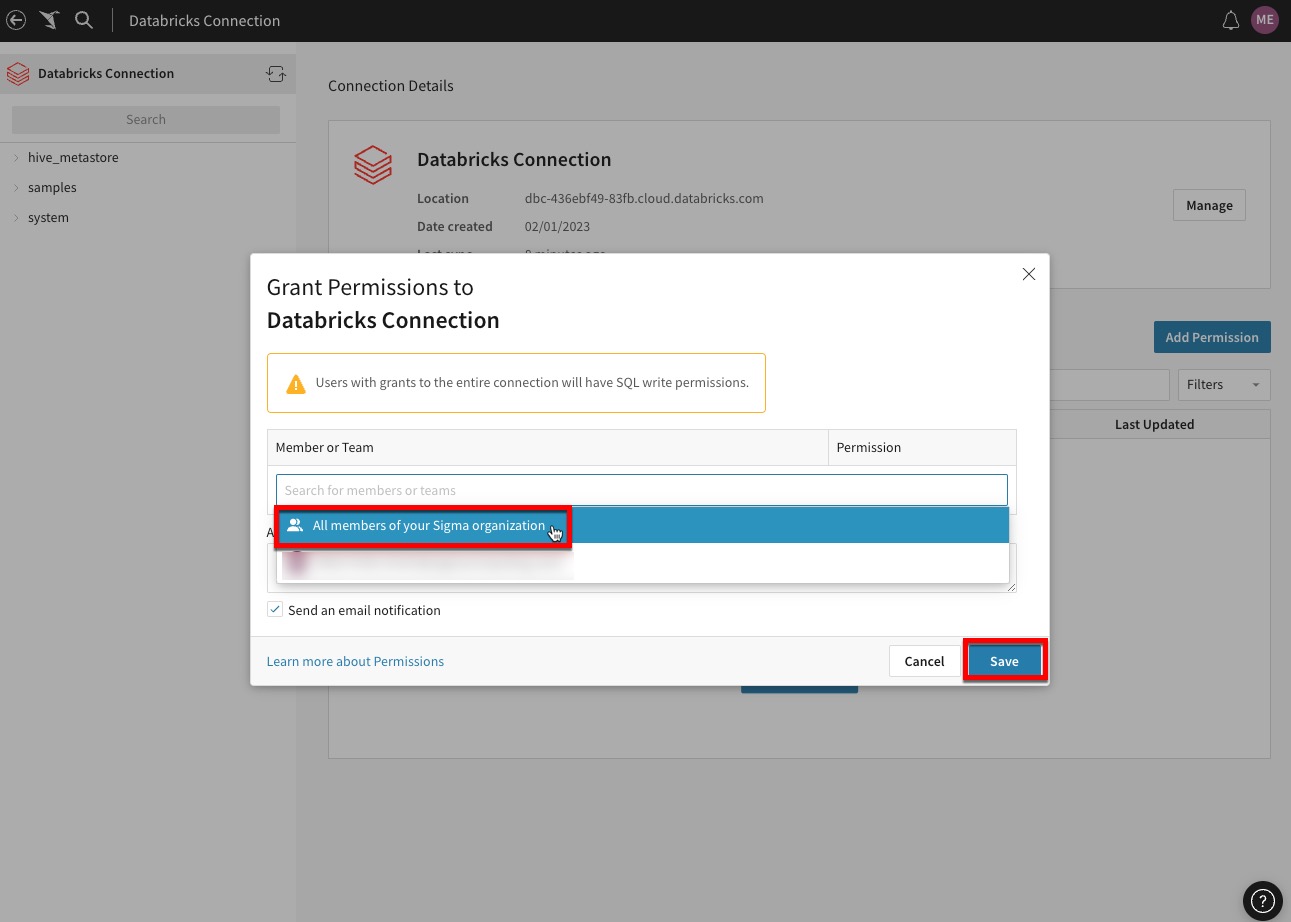
Click into the bar that says Search for members or teams and a drop down appears.
Select All Members (Team) so all users of Sigma have write access to this database.
Click the blue Save button:
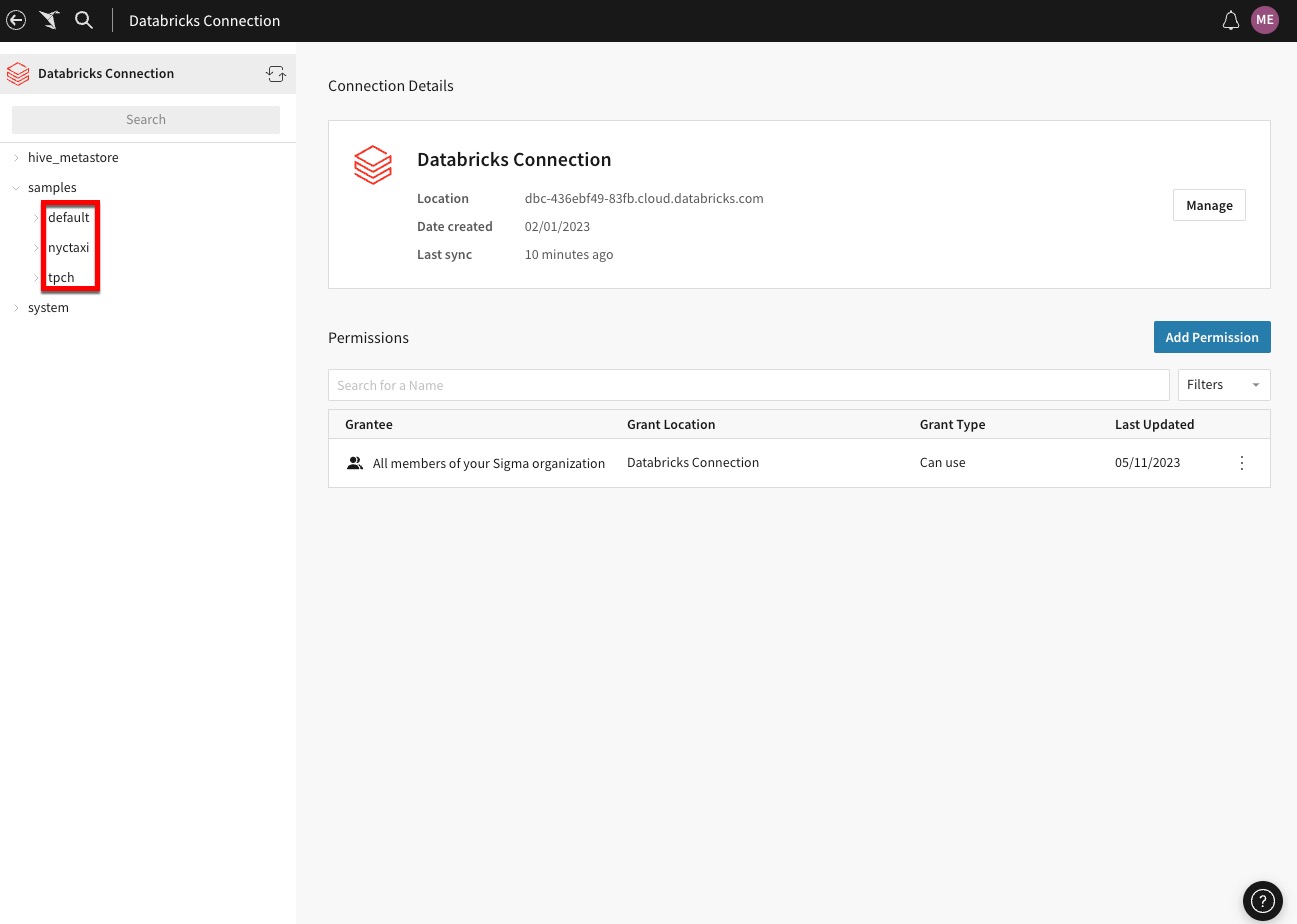
If you expand the samples database you will be able to see the sample data preloaded from Databricks:
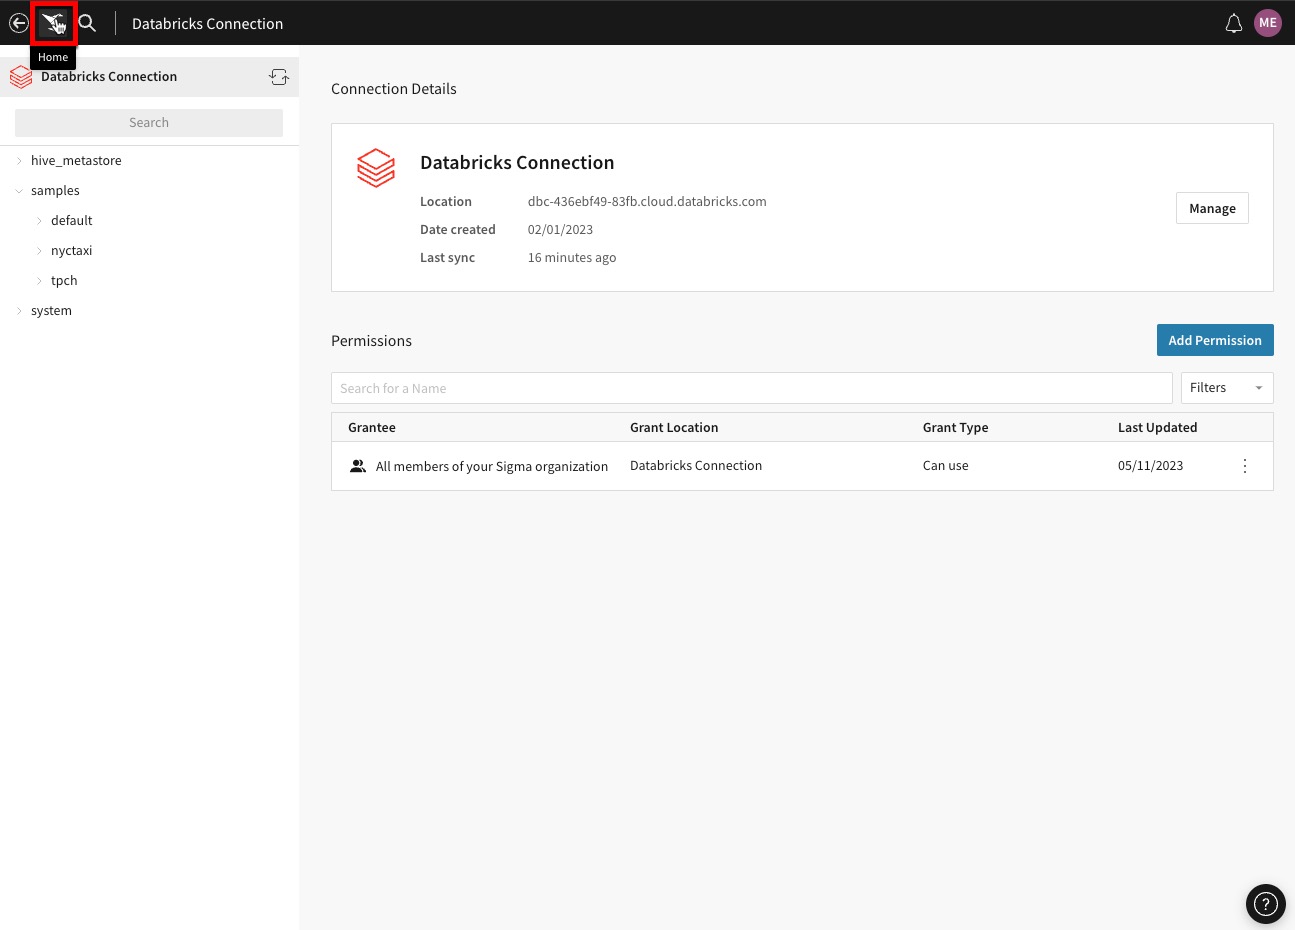
After configuring the permissions and looking at the available sample data from Databricks, we are going to create a Workbook.
Navigate back to the Home page by clicking the crane logo located near the top left corner of the webpage:
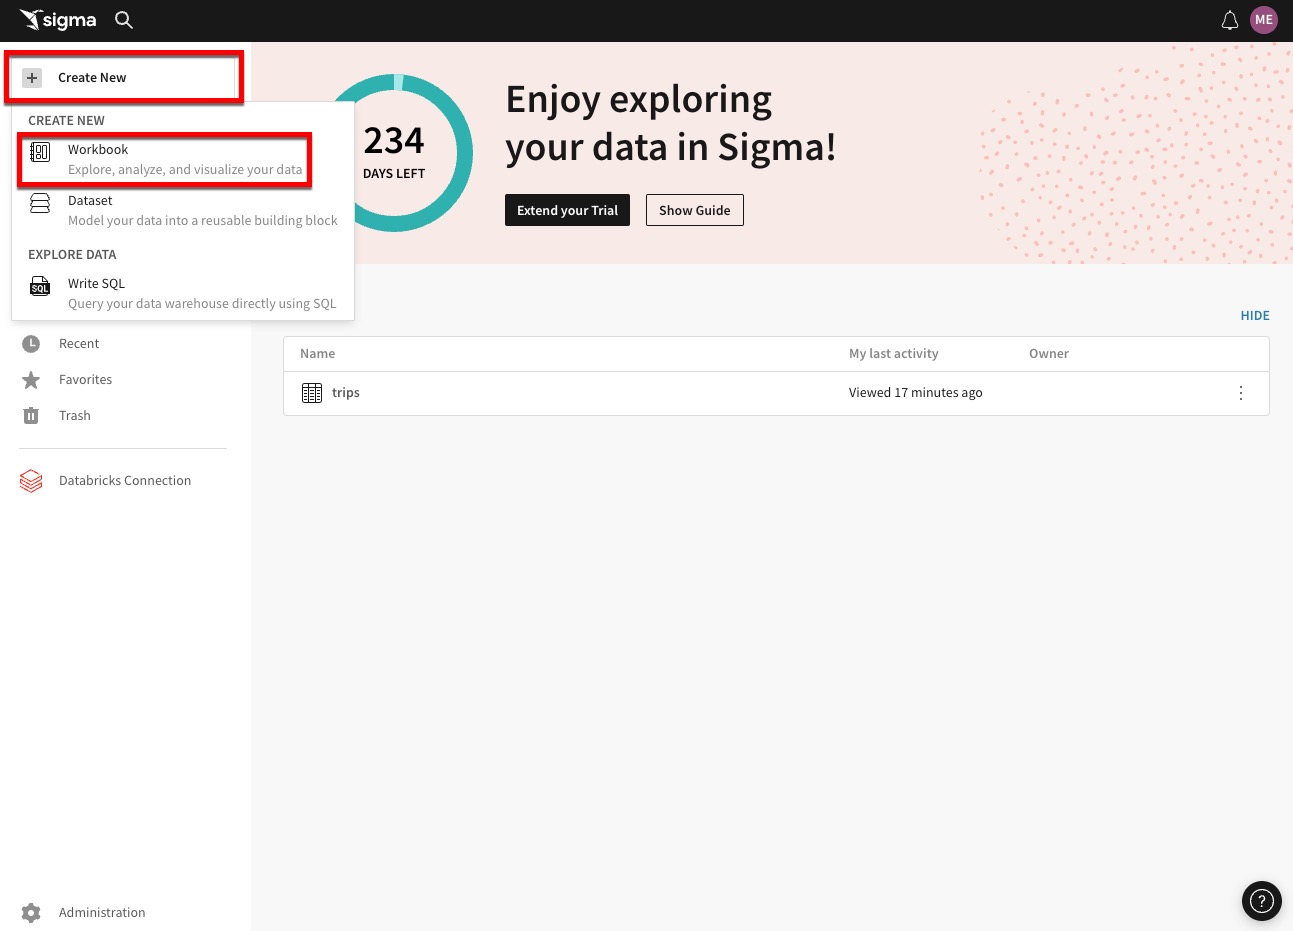
Now that we are back at the Home page, we are going to create a new Workbook.
Click Create New at the near the top left of the page then select Workbook:
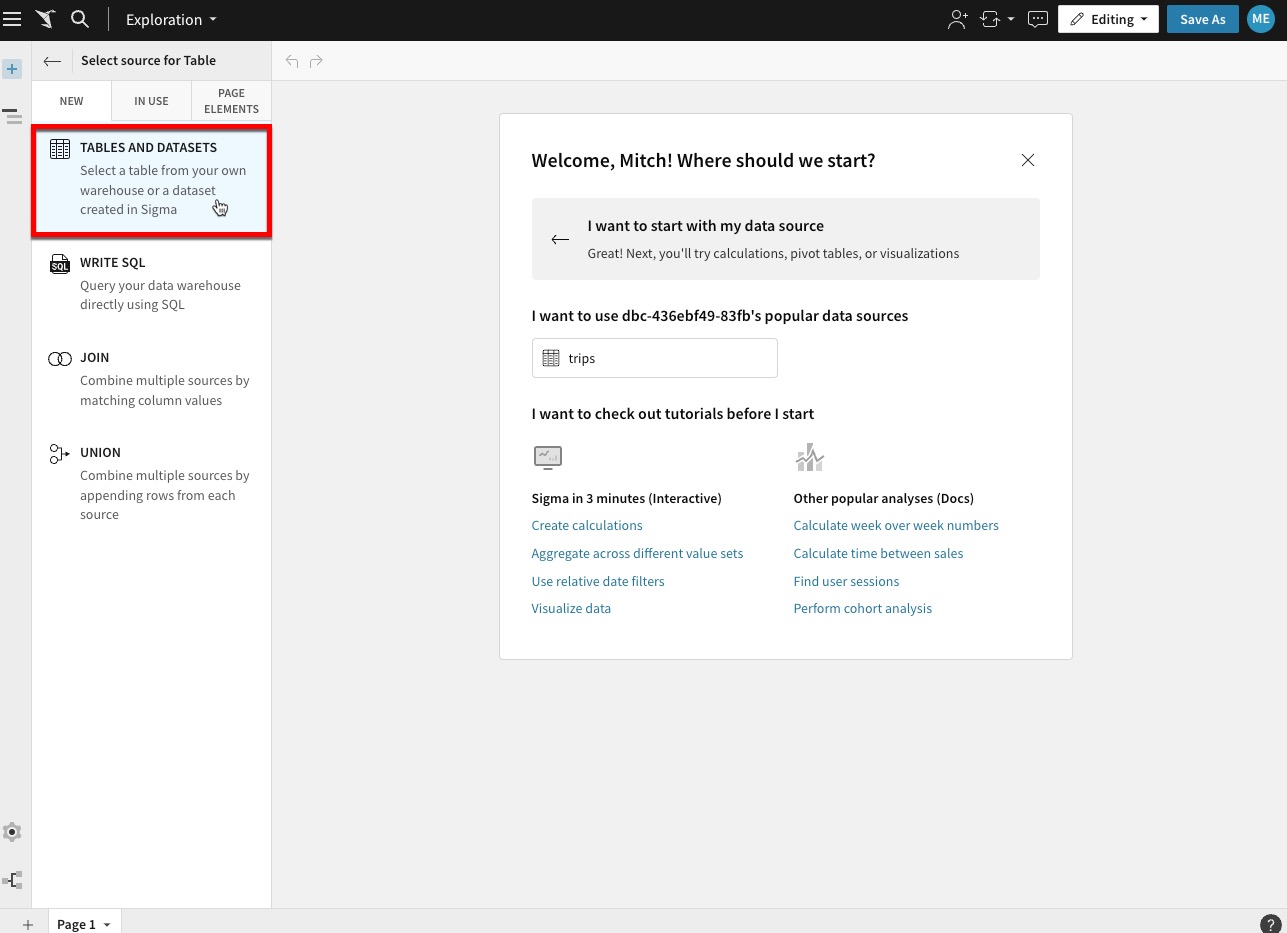
Once the new Workbook is opened, we will need to select a data source for our new workbook.
On the left hand side first select the Table option, then select Tables and Datasets:
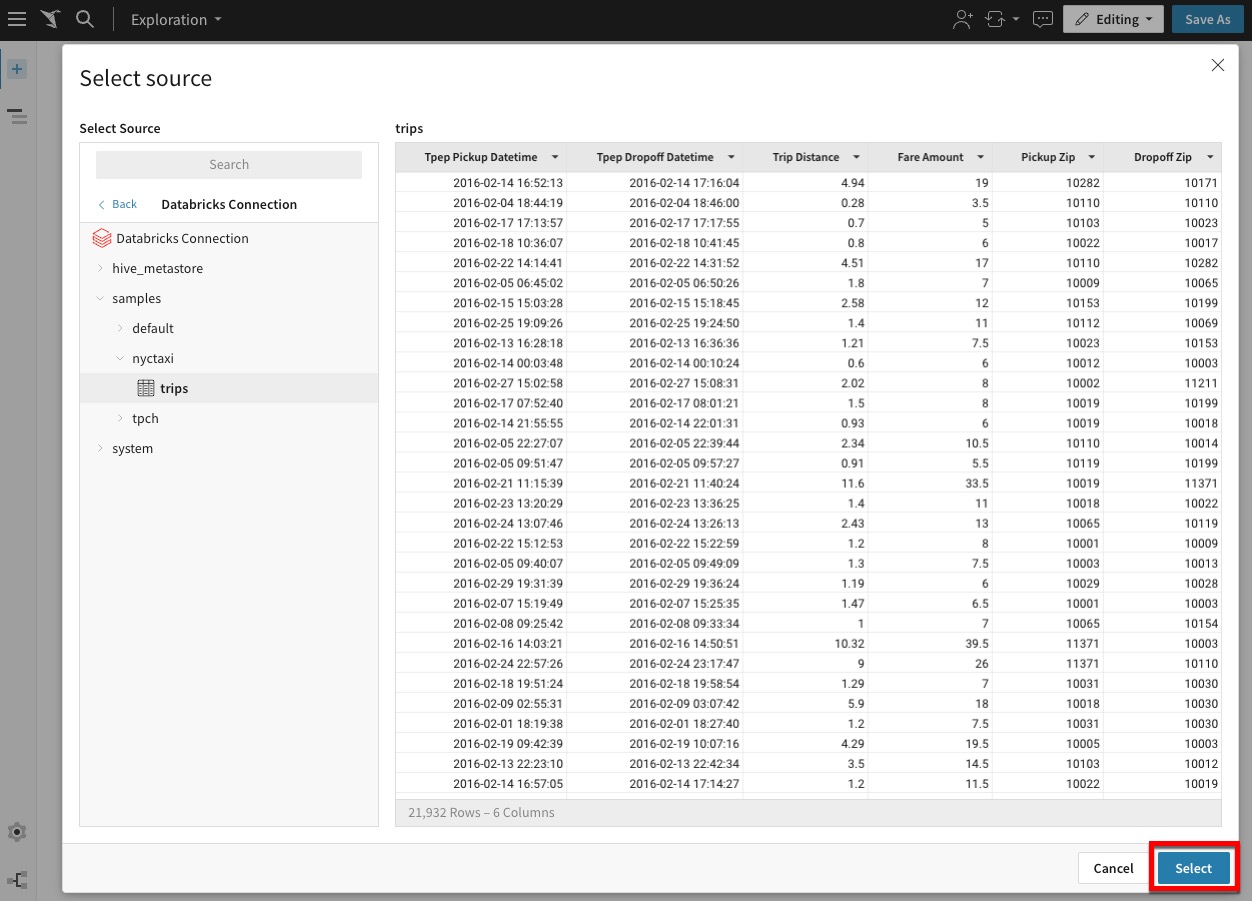
On the resulting page select Connections then click the Databricks Connection.
On the next page, select the Samples database to show the underlying schemas.
Now click, the nyctaxi schema.
Select the trips table.
This will create a preview of the data.
Next click Select in the bottom right corner of the page:
The trips data is now displayed in a familiar spreadsheet UI. This allows business users to begin to explore the data and do ad-hoc analysis:
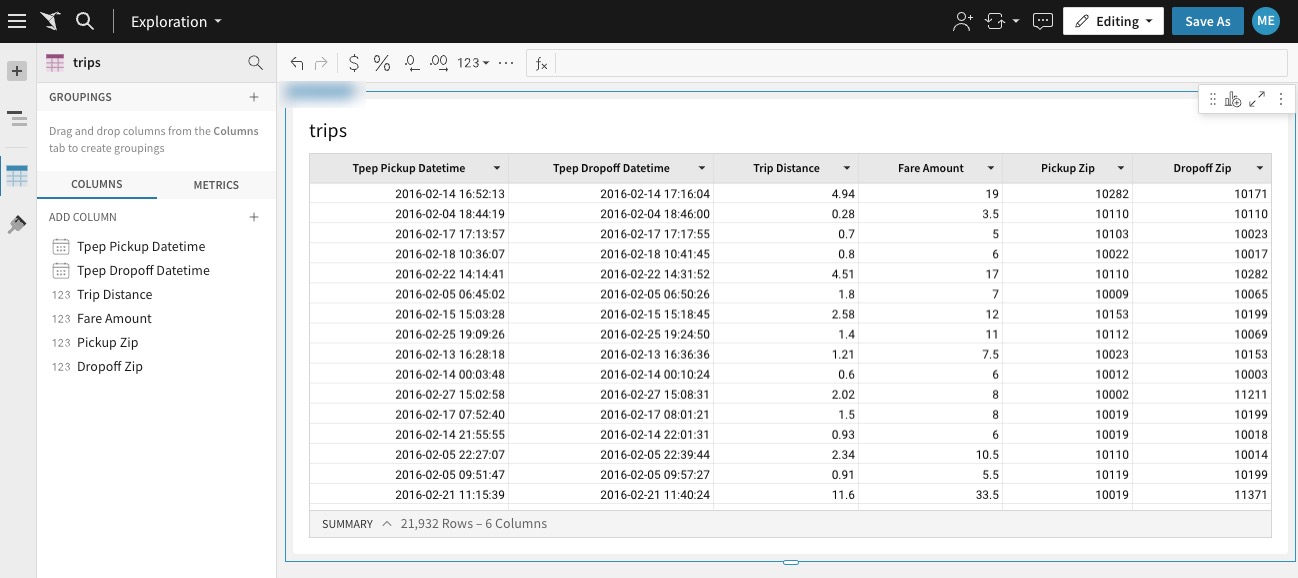
Now that we have our dataset, we are ready to build our first visualization.
Start the creation of a visualization by selecting the table that we just built, then click the Create child element icon on its top right corner and select Visualization to start creating a new chart:
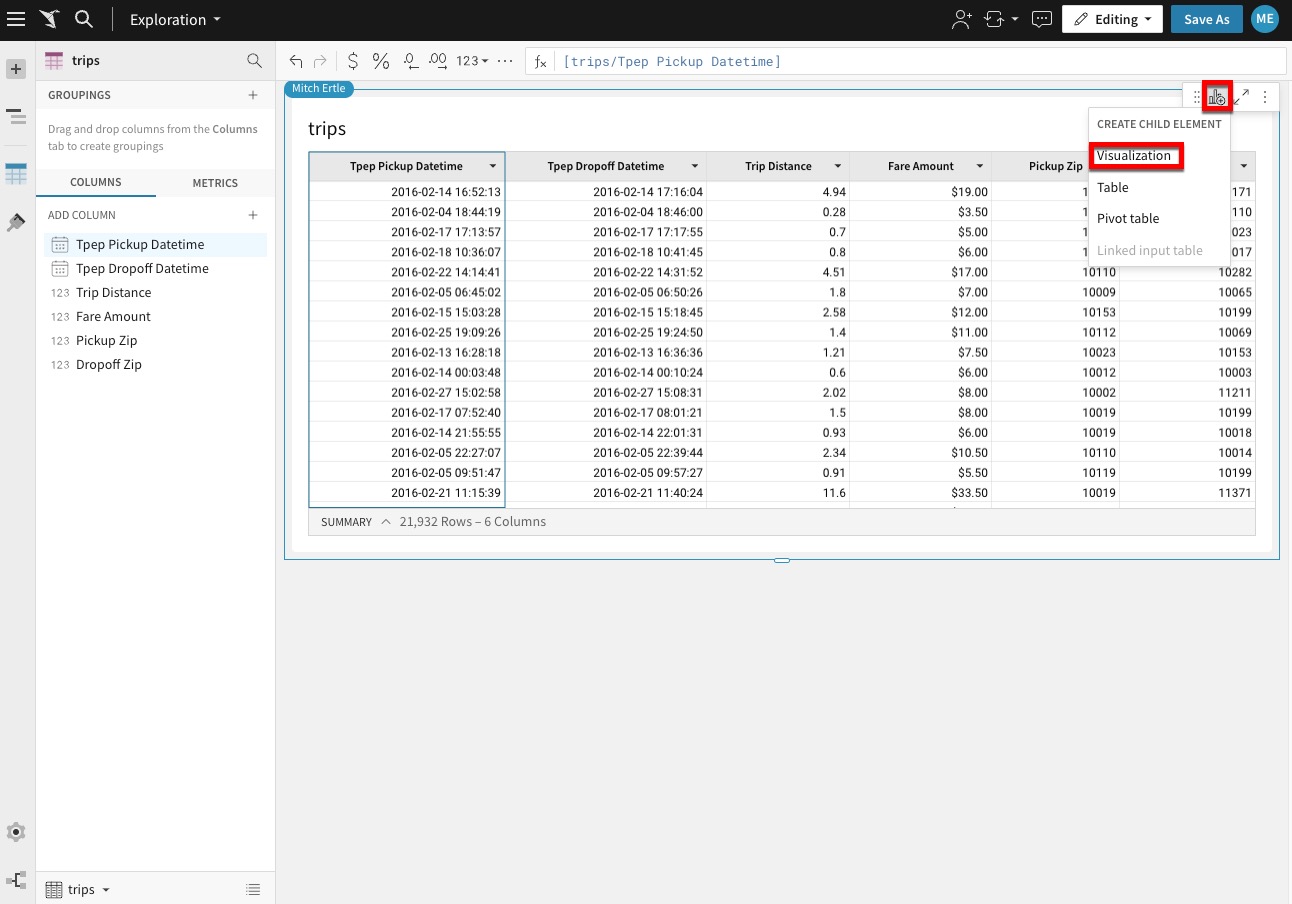
This will add a Visualization below our table.
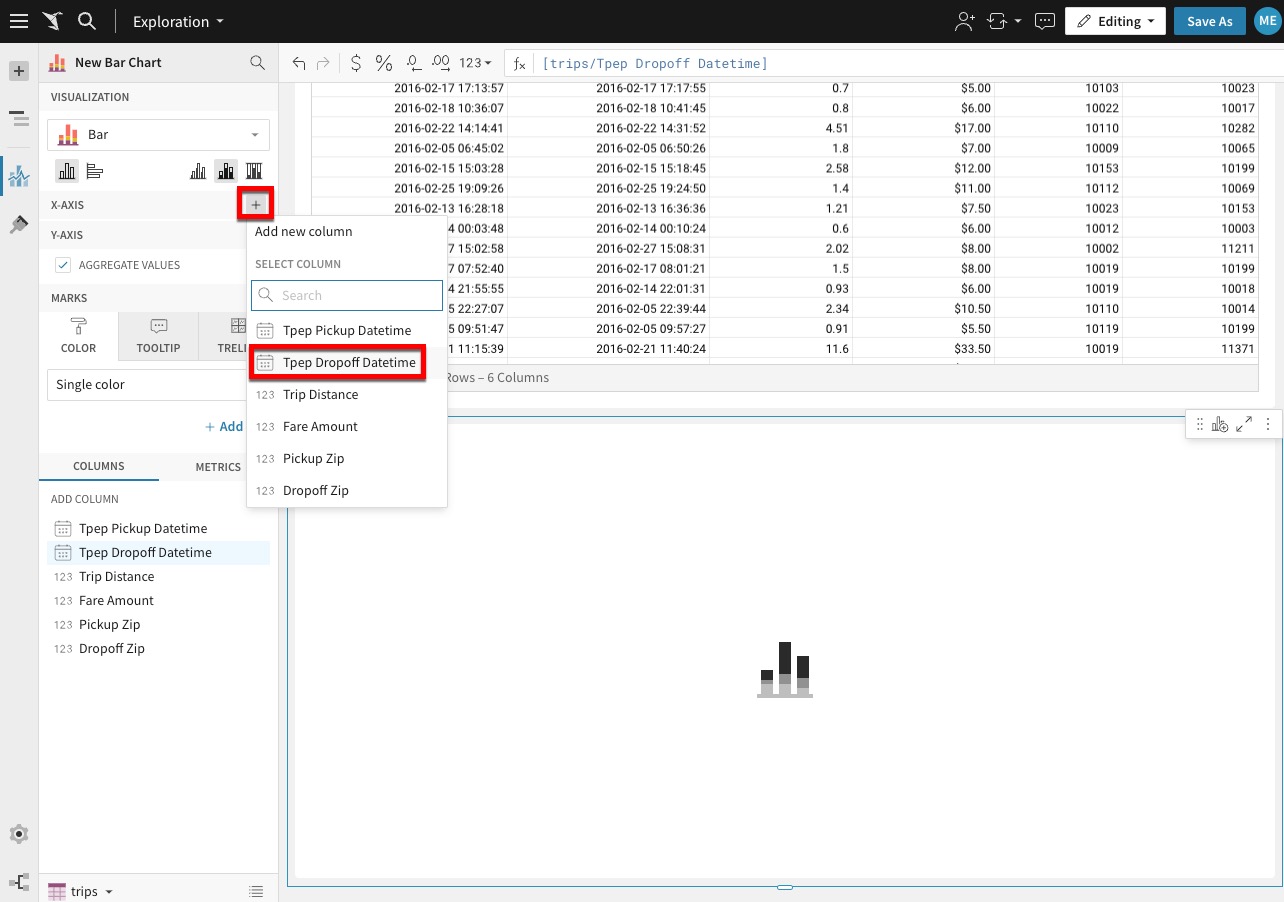
On the X-Axis click the plus button to add the Tpep Dropoff Datetime column:
If we look at our columns on the bottom, find the Fare Amount column and drag it under the Y-Axis.
The value will automatically aggregate and become Sum of Fare Amount:
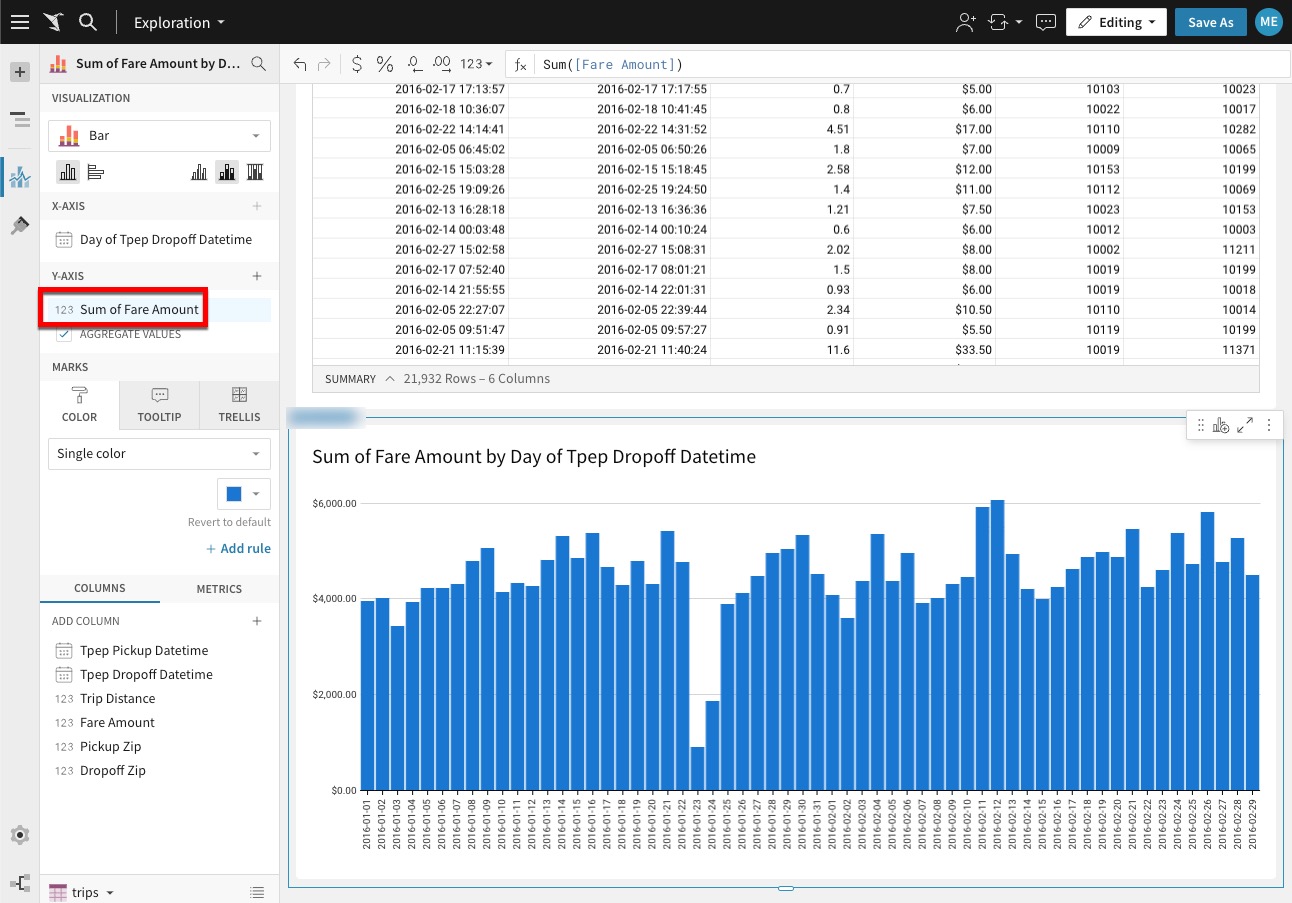
This visualization shows the fare totals for each day from the provided dataset. As a data practitioner, you may want to look at this in a different context. This can be done by changing the X and Y-axis.
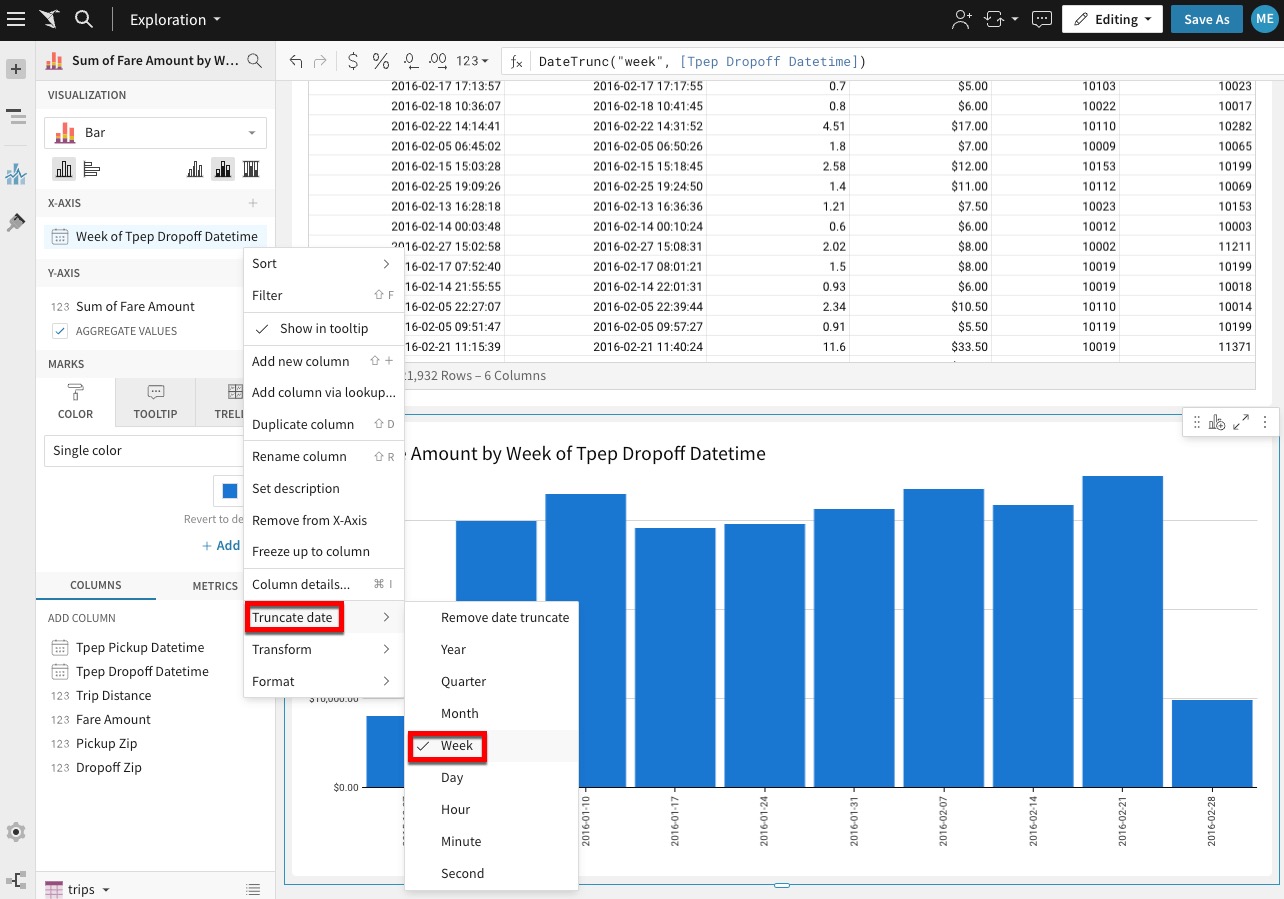
For the X-axis, let's truncate the value by Week.
This is performed by clicking on the drop-down to the right of the Tpep Dropoff Datetime then selecting Truncate date and finally selecting Week:
For the Y-axis, let's update the aggregation to Avg of Fare Amount.
This is performed by clicking on the drop-down to the right of the Sum of Fare Amount then selecting Set Aggregate and finally selecting Avg:
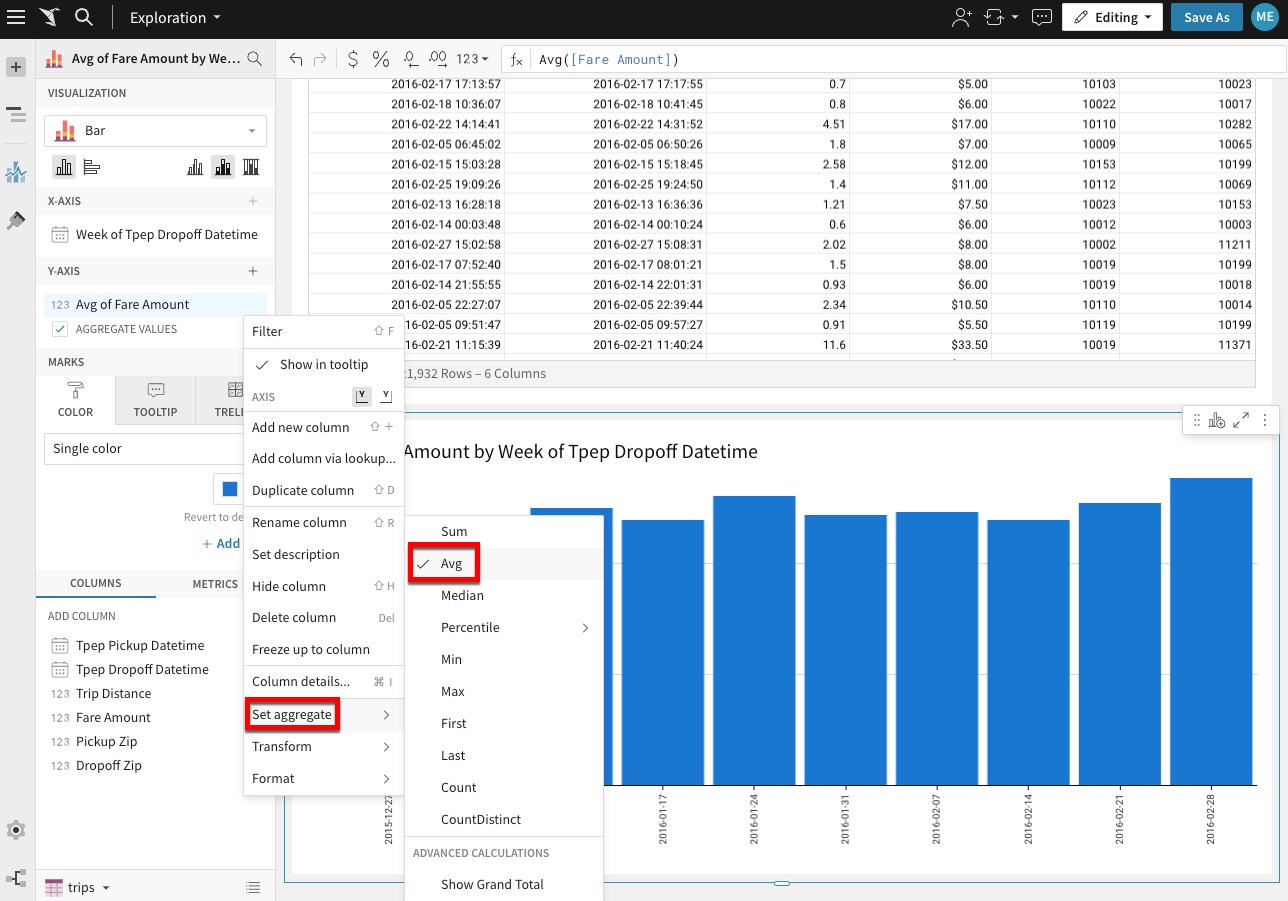
Thus creating a visualization showing the Average Fare by Week for the given dataset.
Once your Databricks Lakehouse is connected, it's time to start exploring & analyzing your data. Here are some of the ways Sigma makes it easy:
In this lab, we guided you through accessing Partner Connect in the Databricks user-interface, establishing a connection between Sigma and Databricks, creating a Sigma trial, accessing your Sigma instance, setting permissions for your Databricks connection and finally importing and analyzing your Databricks data in a Sigma workbook.
In Summary
We're excited to be offering the best of both Sigma and Databricks Lakehouse with this easy to use integration!
Integrating Sigma with Databricks through Partner Connect takes this one step further by providing users with a powerful data analytics workflow. Users leverage Databricks' data engineering and machine learning tools to prepare data and train models for Sigma to visualize and analyze. The ability to have Sigma read directly from the Databricks Lakehouse eliminates the need for manual data extracts, reducing the risk of errors and saving time.
To learn more about Sigma on Databricks, please download the Sigma on Databricks Best Practices Guide or visit our Sigma+Databricks page.
Additional Resource Links
Be sure to check out all the latest developments at Sigma's First Friday Feature page!
Help Center Home
Sigma Community
Sigma Blog