This QuickStart provides instructions on setting up a Sigma trial instance, using Snowflake Partner Connect and an introductory overview of how to use Sigma.
Target Audience
Participants of Snowflake Summit's Hackathon 2024 who are attending the session "DIGNITY FROM DATA — USING SNOWFLAKE TO SOLVE CALIFORNIA'S HOMELESSNESS CRISIS, ACT101"
No SQL or technical data skills are required for using Sigma.
Prerequisites
- A computer with a current browser. It does not matter which browser you want to use.
- Access to your Sigma environment.
- A Snowflake free 30-day trial environment.
For more information on Sigma's product release strategy, see Sigma product releases.

Note:
If you have previously use Snowflake Partner Connect to establish a Sigma instance and you are still using that instance to do additional QuickStarts, you will need to resync the connection to Snowflake in Sigma.
Provisioning Sigma via Snowflake Partner Connect
Snowflake and Sigma have made it really simple to spin up a Sigma trial in just a few minutes, via Snowflake Partner Connect.
Log into your Snowflake trial account.
Partner Connect is an integral part of the Snowflake console.
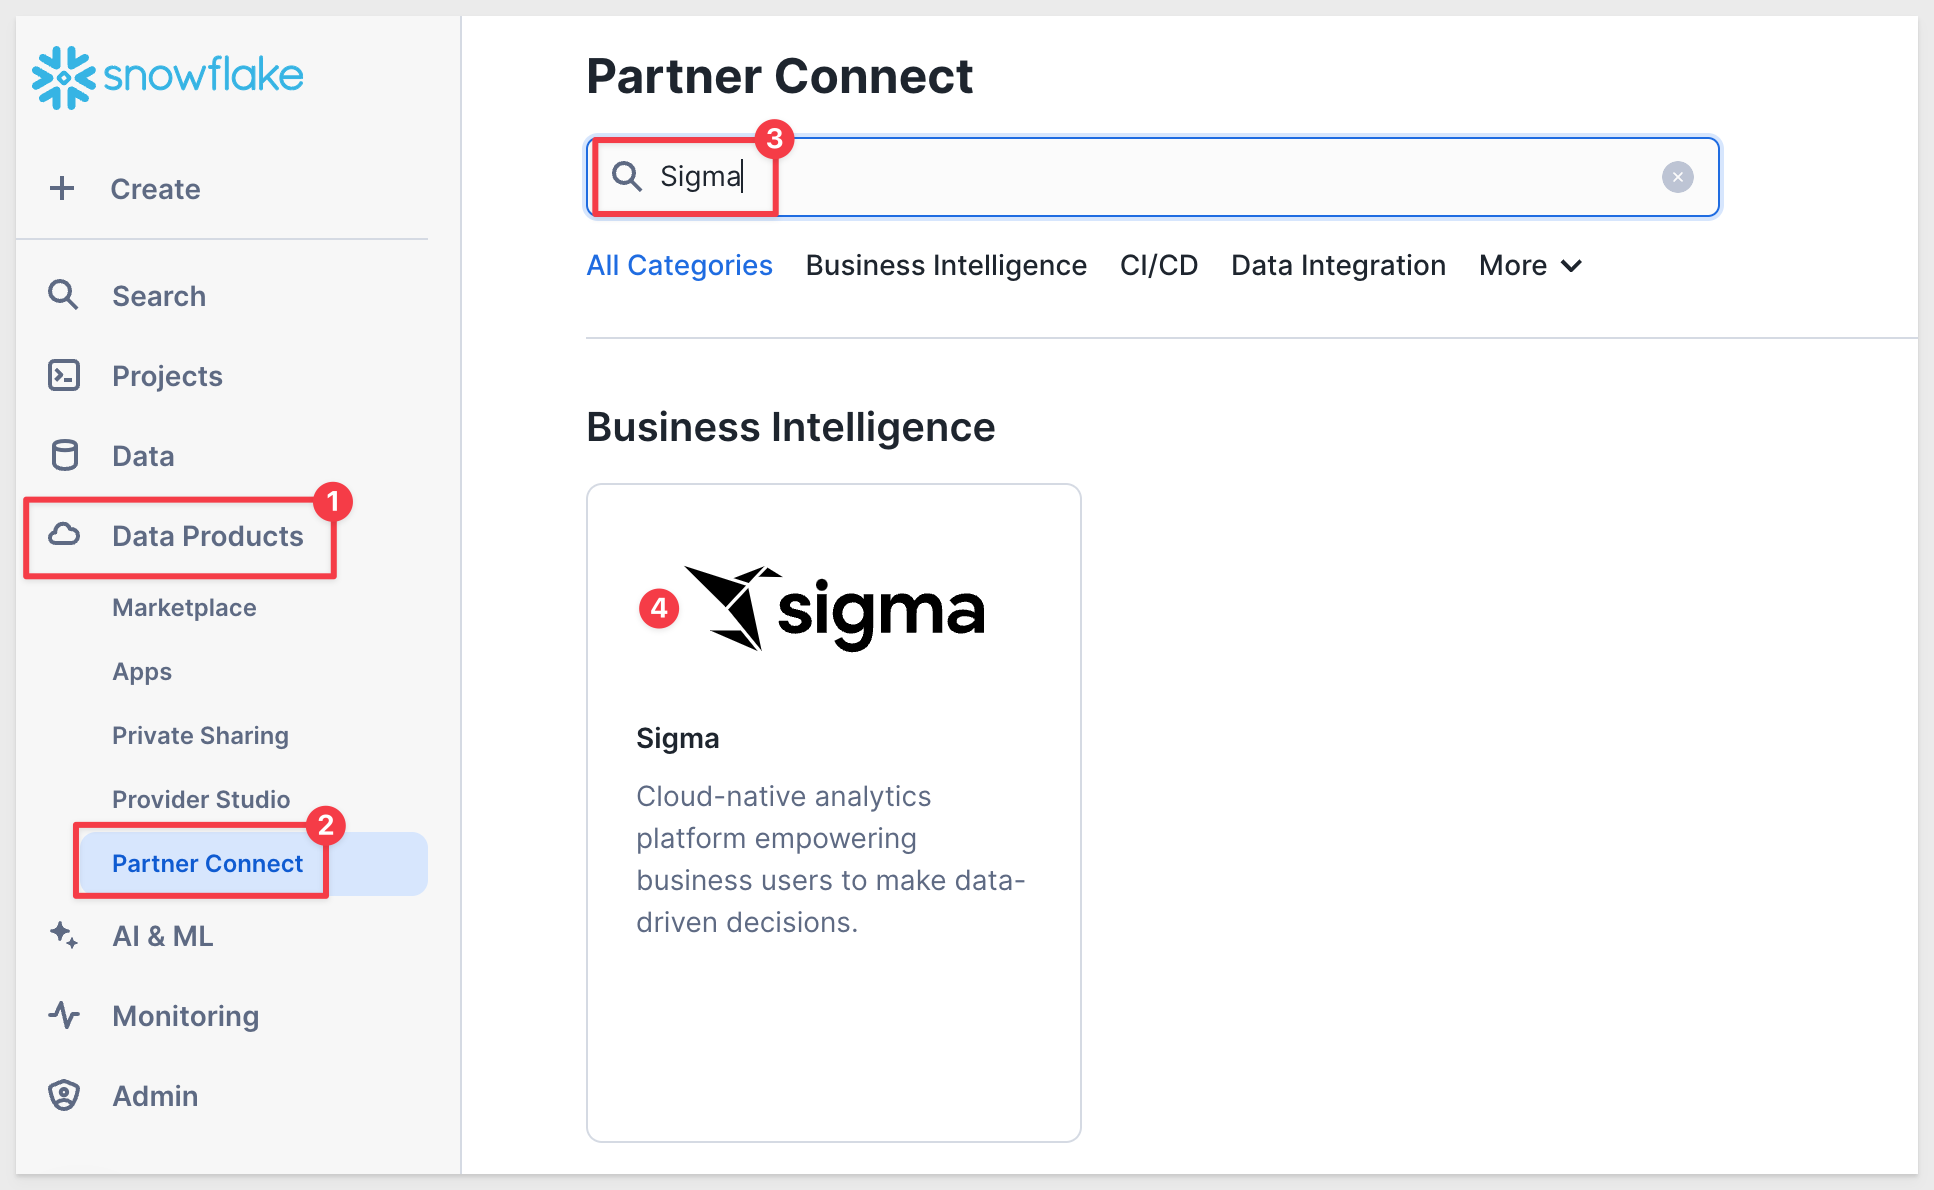
On the left hand side of the Snowflake UI, navigate to Data Products, then select Partner Connect.
Click the icon for Sigma.
You will see a dialog box that will show the objects that will be created in your Snowflake account by Sigma.
We will be using the PC_SIGMA_WH warehouse, PC_SIGMA_DB database, and the PC_SIGMA_ROLE, which are automatically created for you when you click Connect:
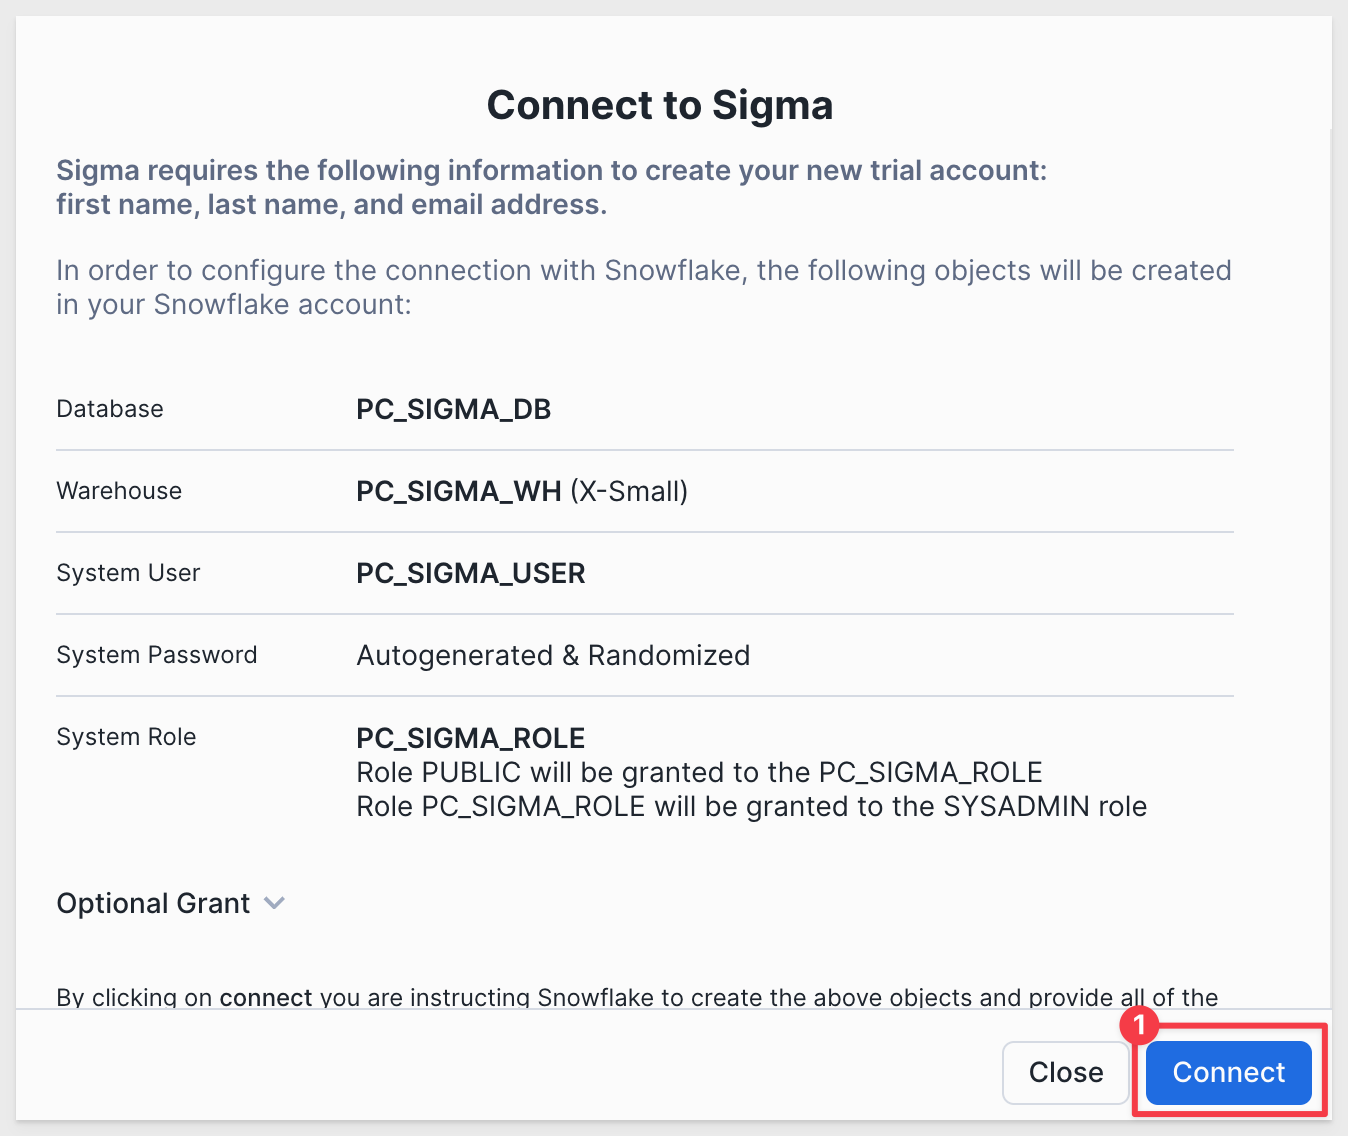
Click Connect then Activate.
A message will appear that indicates "Your partner account has been created":
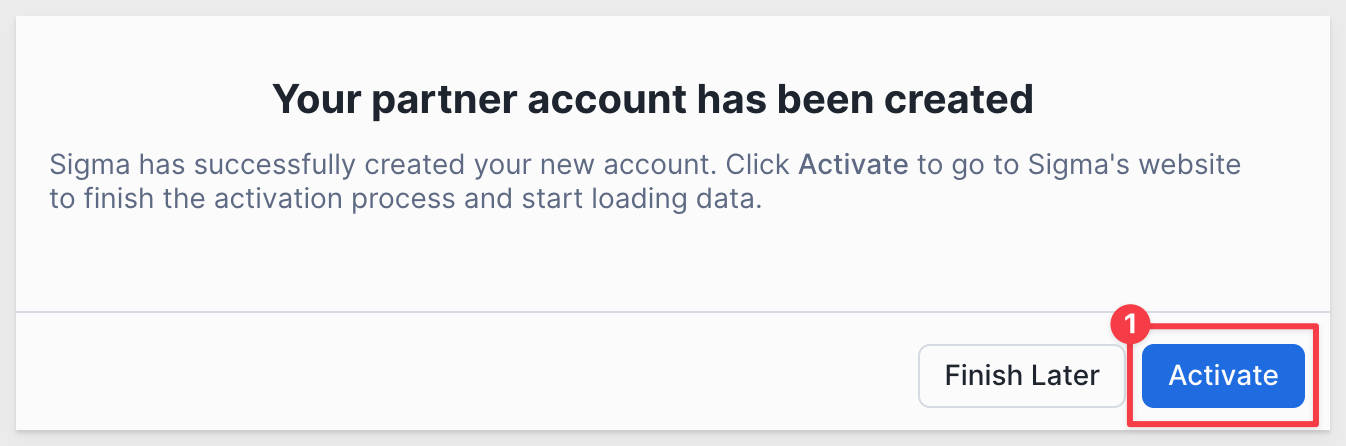
Click Activate.
Sigma will open in a new browser tab and prompt you to choose a name for the new Sigma Organization.
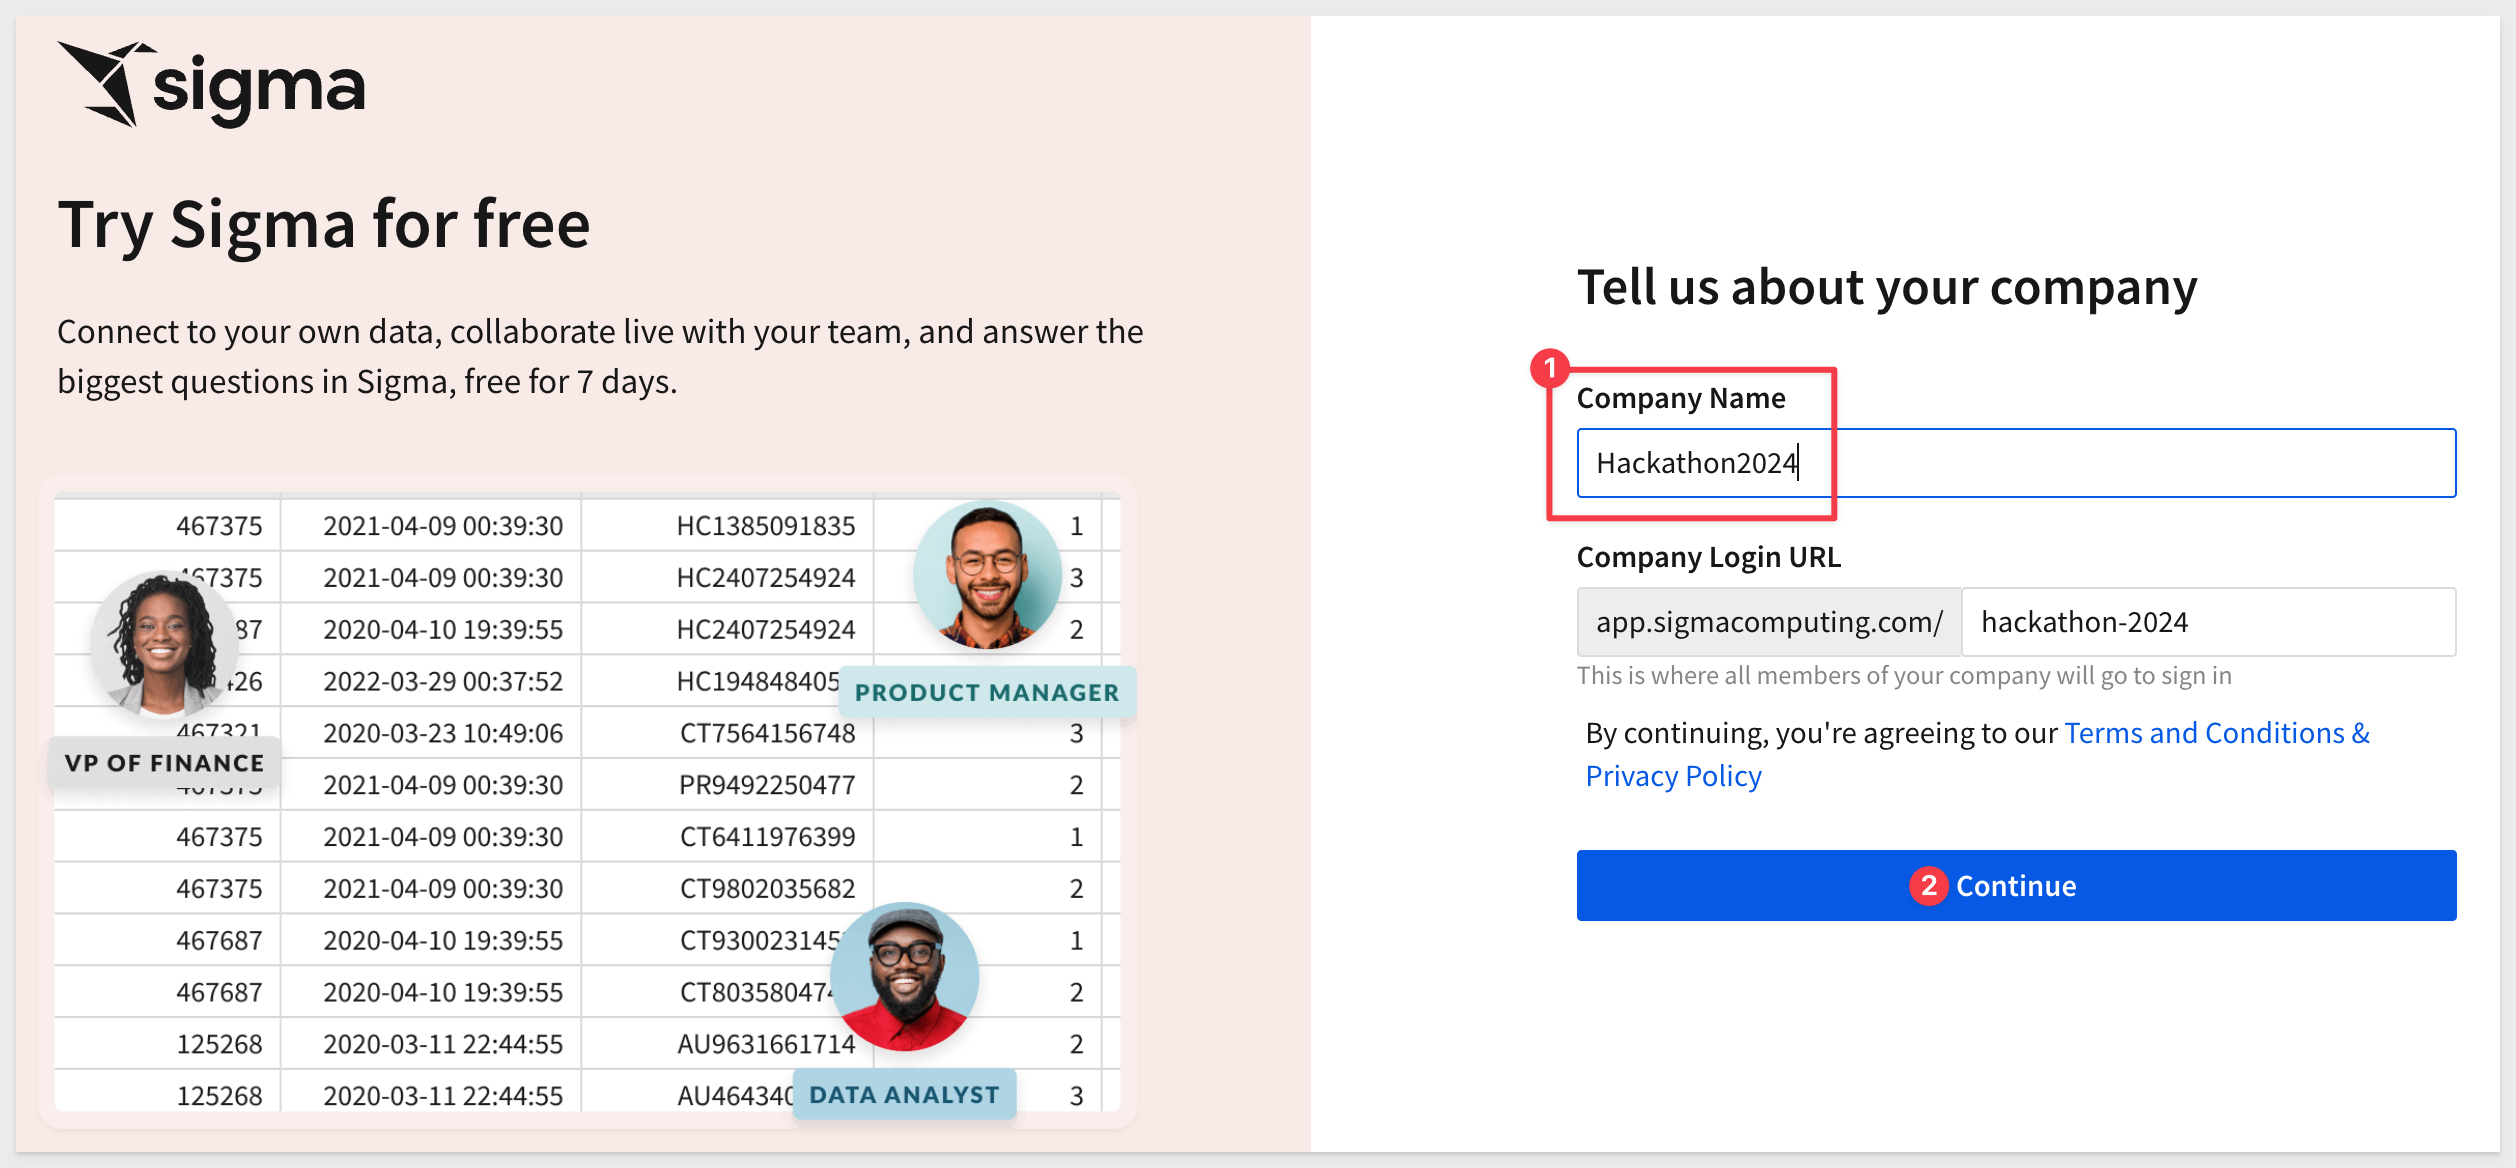
Once you have chosen a name, click Continue.
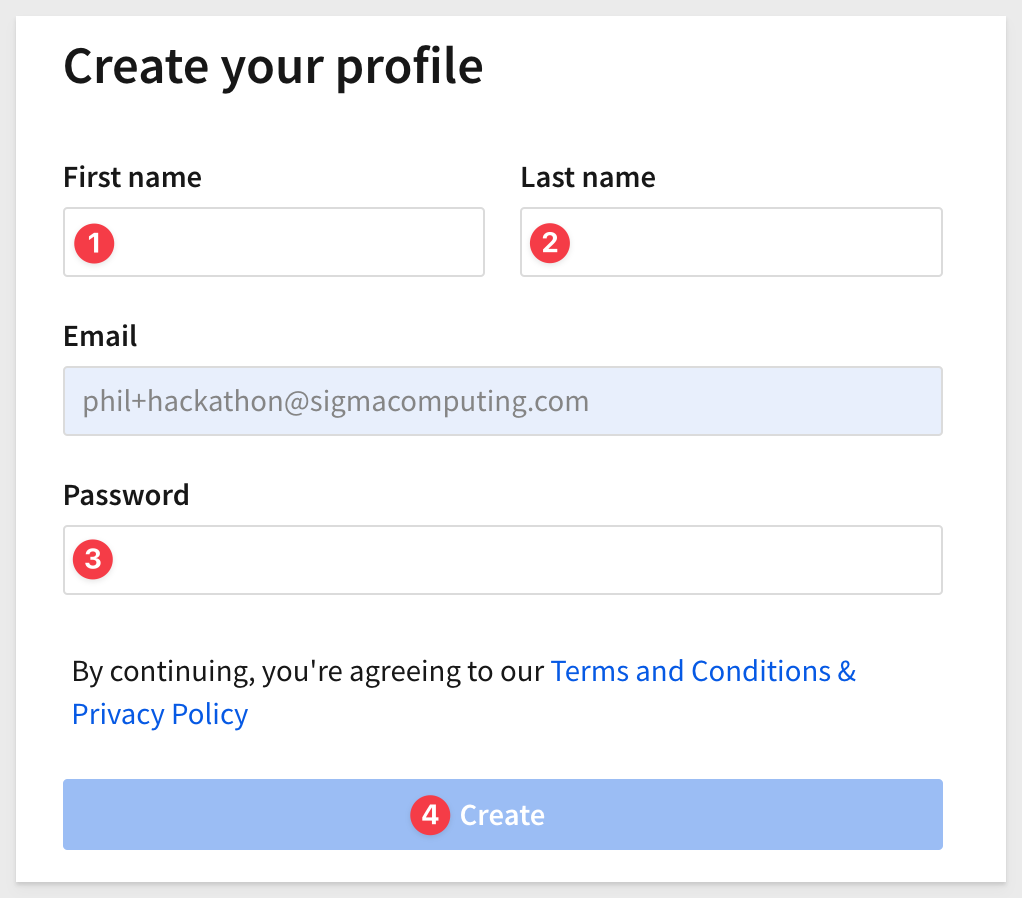
Provide your first name and last name and password and click Create:
You can ignore the IP whitelisting screen; click Get Started Using Sigma.
This will open Sigma in a new tab, and you are ready to start exploring.
Before we provision a new Sigma instance, we need to create a database in Snowflake where we will store data that will be created during the Hackathon session.
Log into your Snowflake trial account.
Using the sidebar, open a new SQL Worksheet and paste the following code into it:
-- Use the appropriate warehouse
USE WAREHOUSE COMPUTE_WH;

-- Switch to using the Sigma database
USE DATABASE PC_SIGMA_DB;

-- Create the WRITE schema within the Sigma database
CREATE SCHEMA WRITE;

-- Grant usage on the database to the ACCOUNTADMIN role
GRANT USAGE ON DATABASE PC_SIGMA_DB TO ROLE ACCOUNTADMIN;

-- Grant various permissions on the WRITE schema to the ACCOUNTADMIN role
GRANT USAGE,
      CREATE TABLE,
      CREATE VIEW,
      CREATE STAGE
ON SCHEMA WRITE
TO ROLE ACCOUNTADMIN;
Highlight the codeblock (item number 3) and click the run arrow:
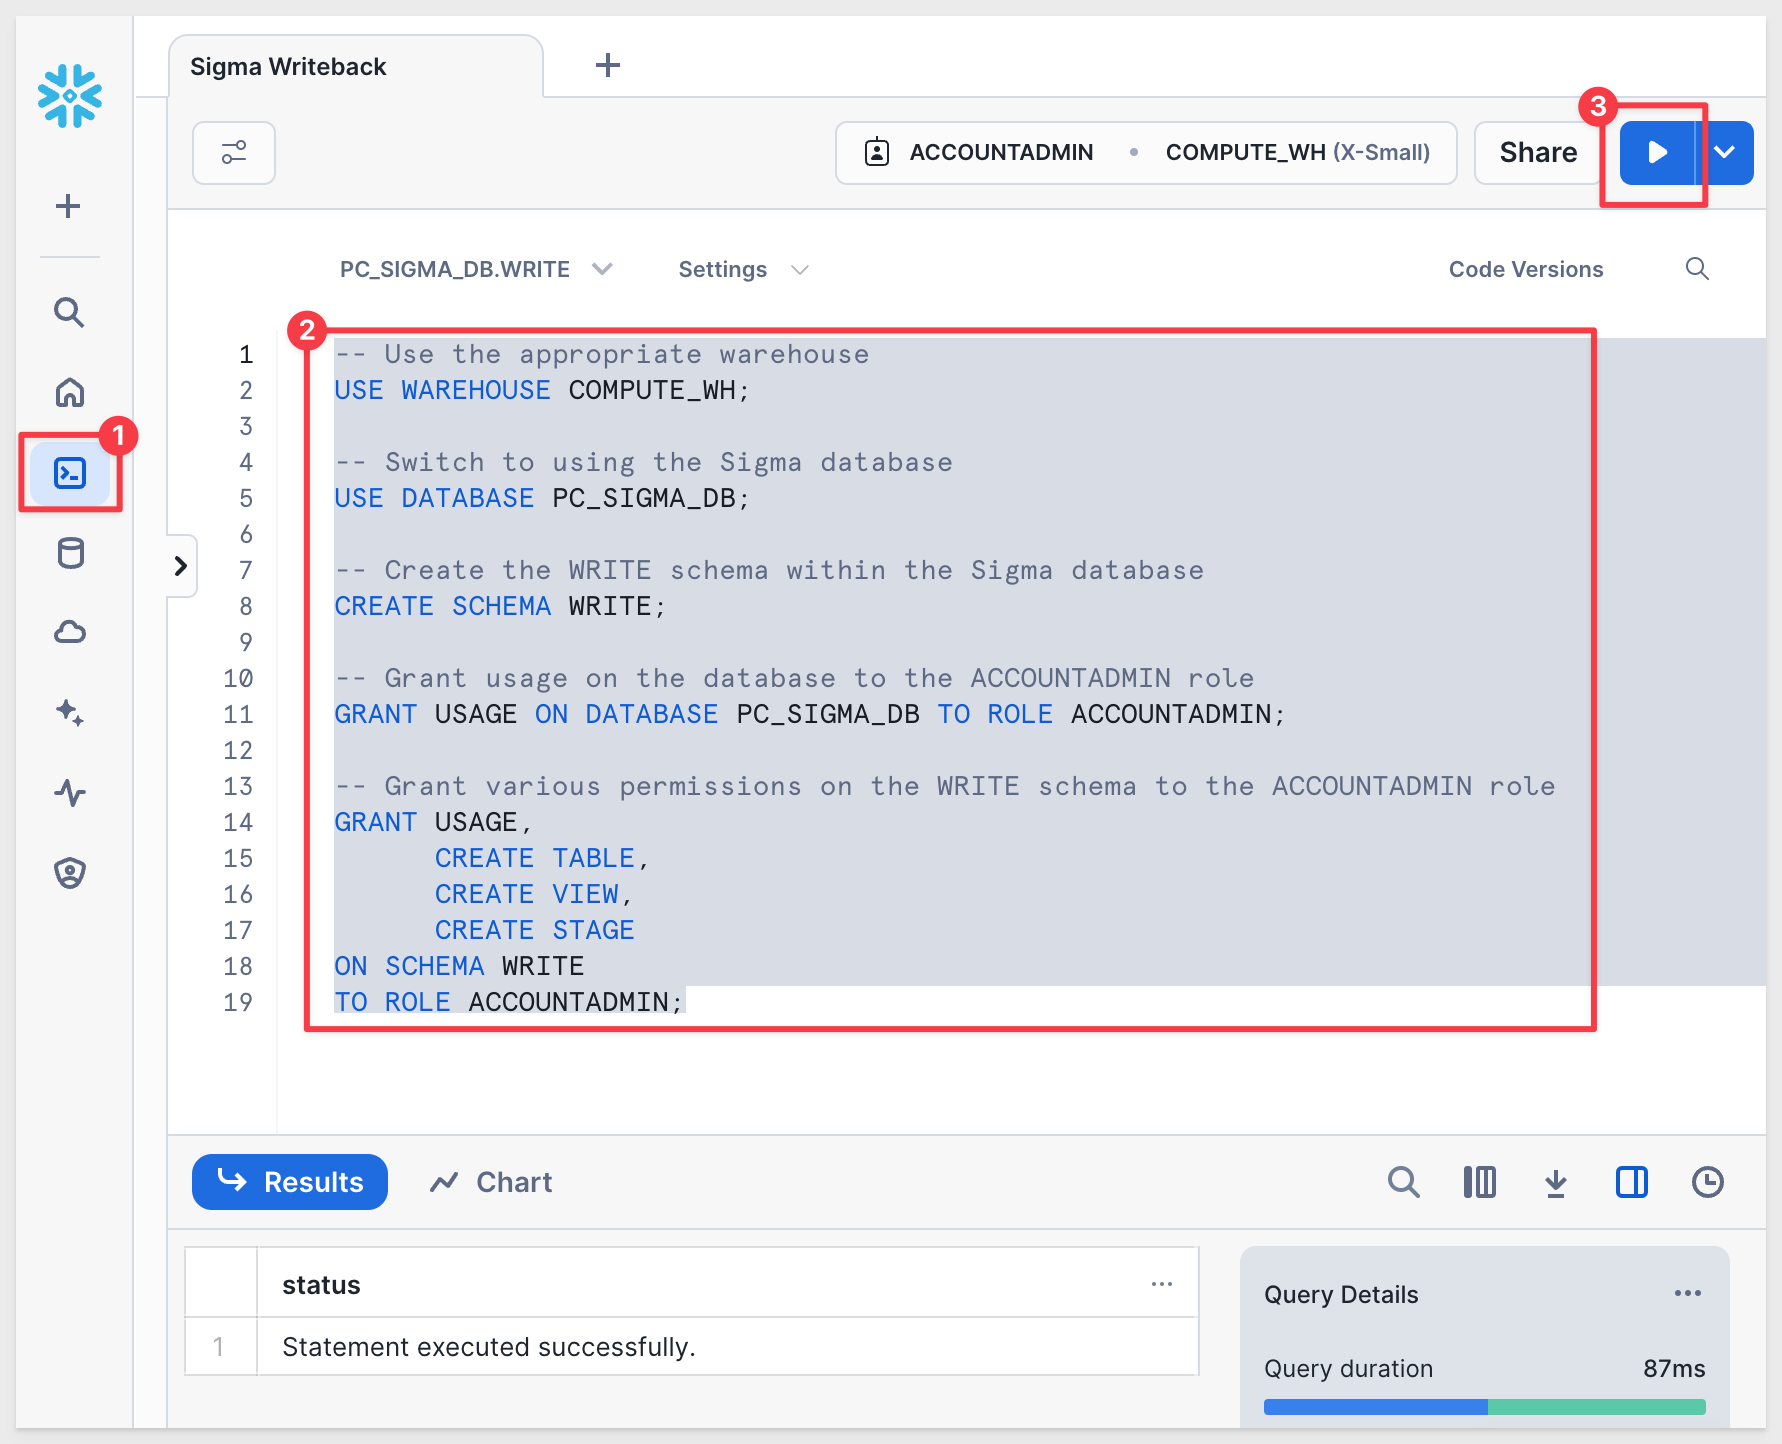
This creates the table, schema and permission required for Sigma to write data back to Snowflake, when required.
We will configure write access in Sigma later on.
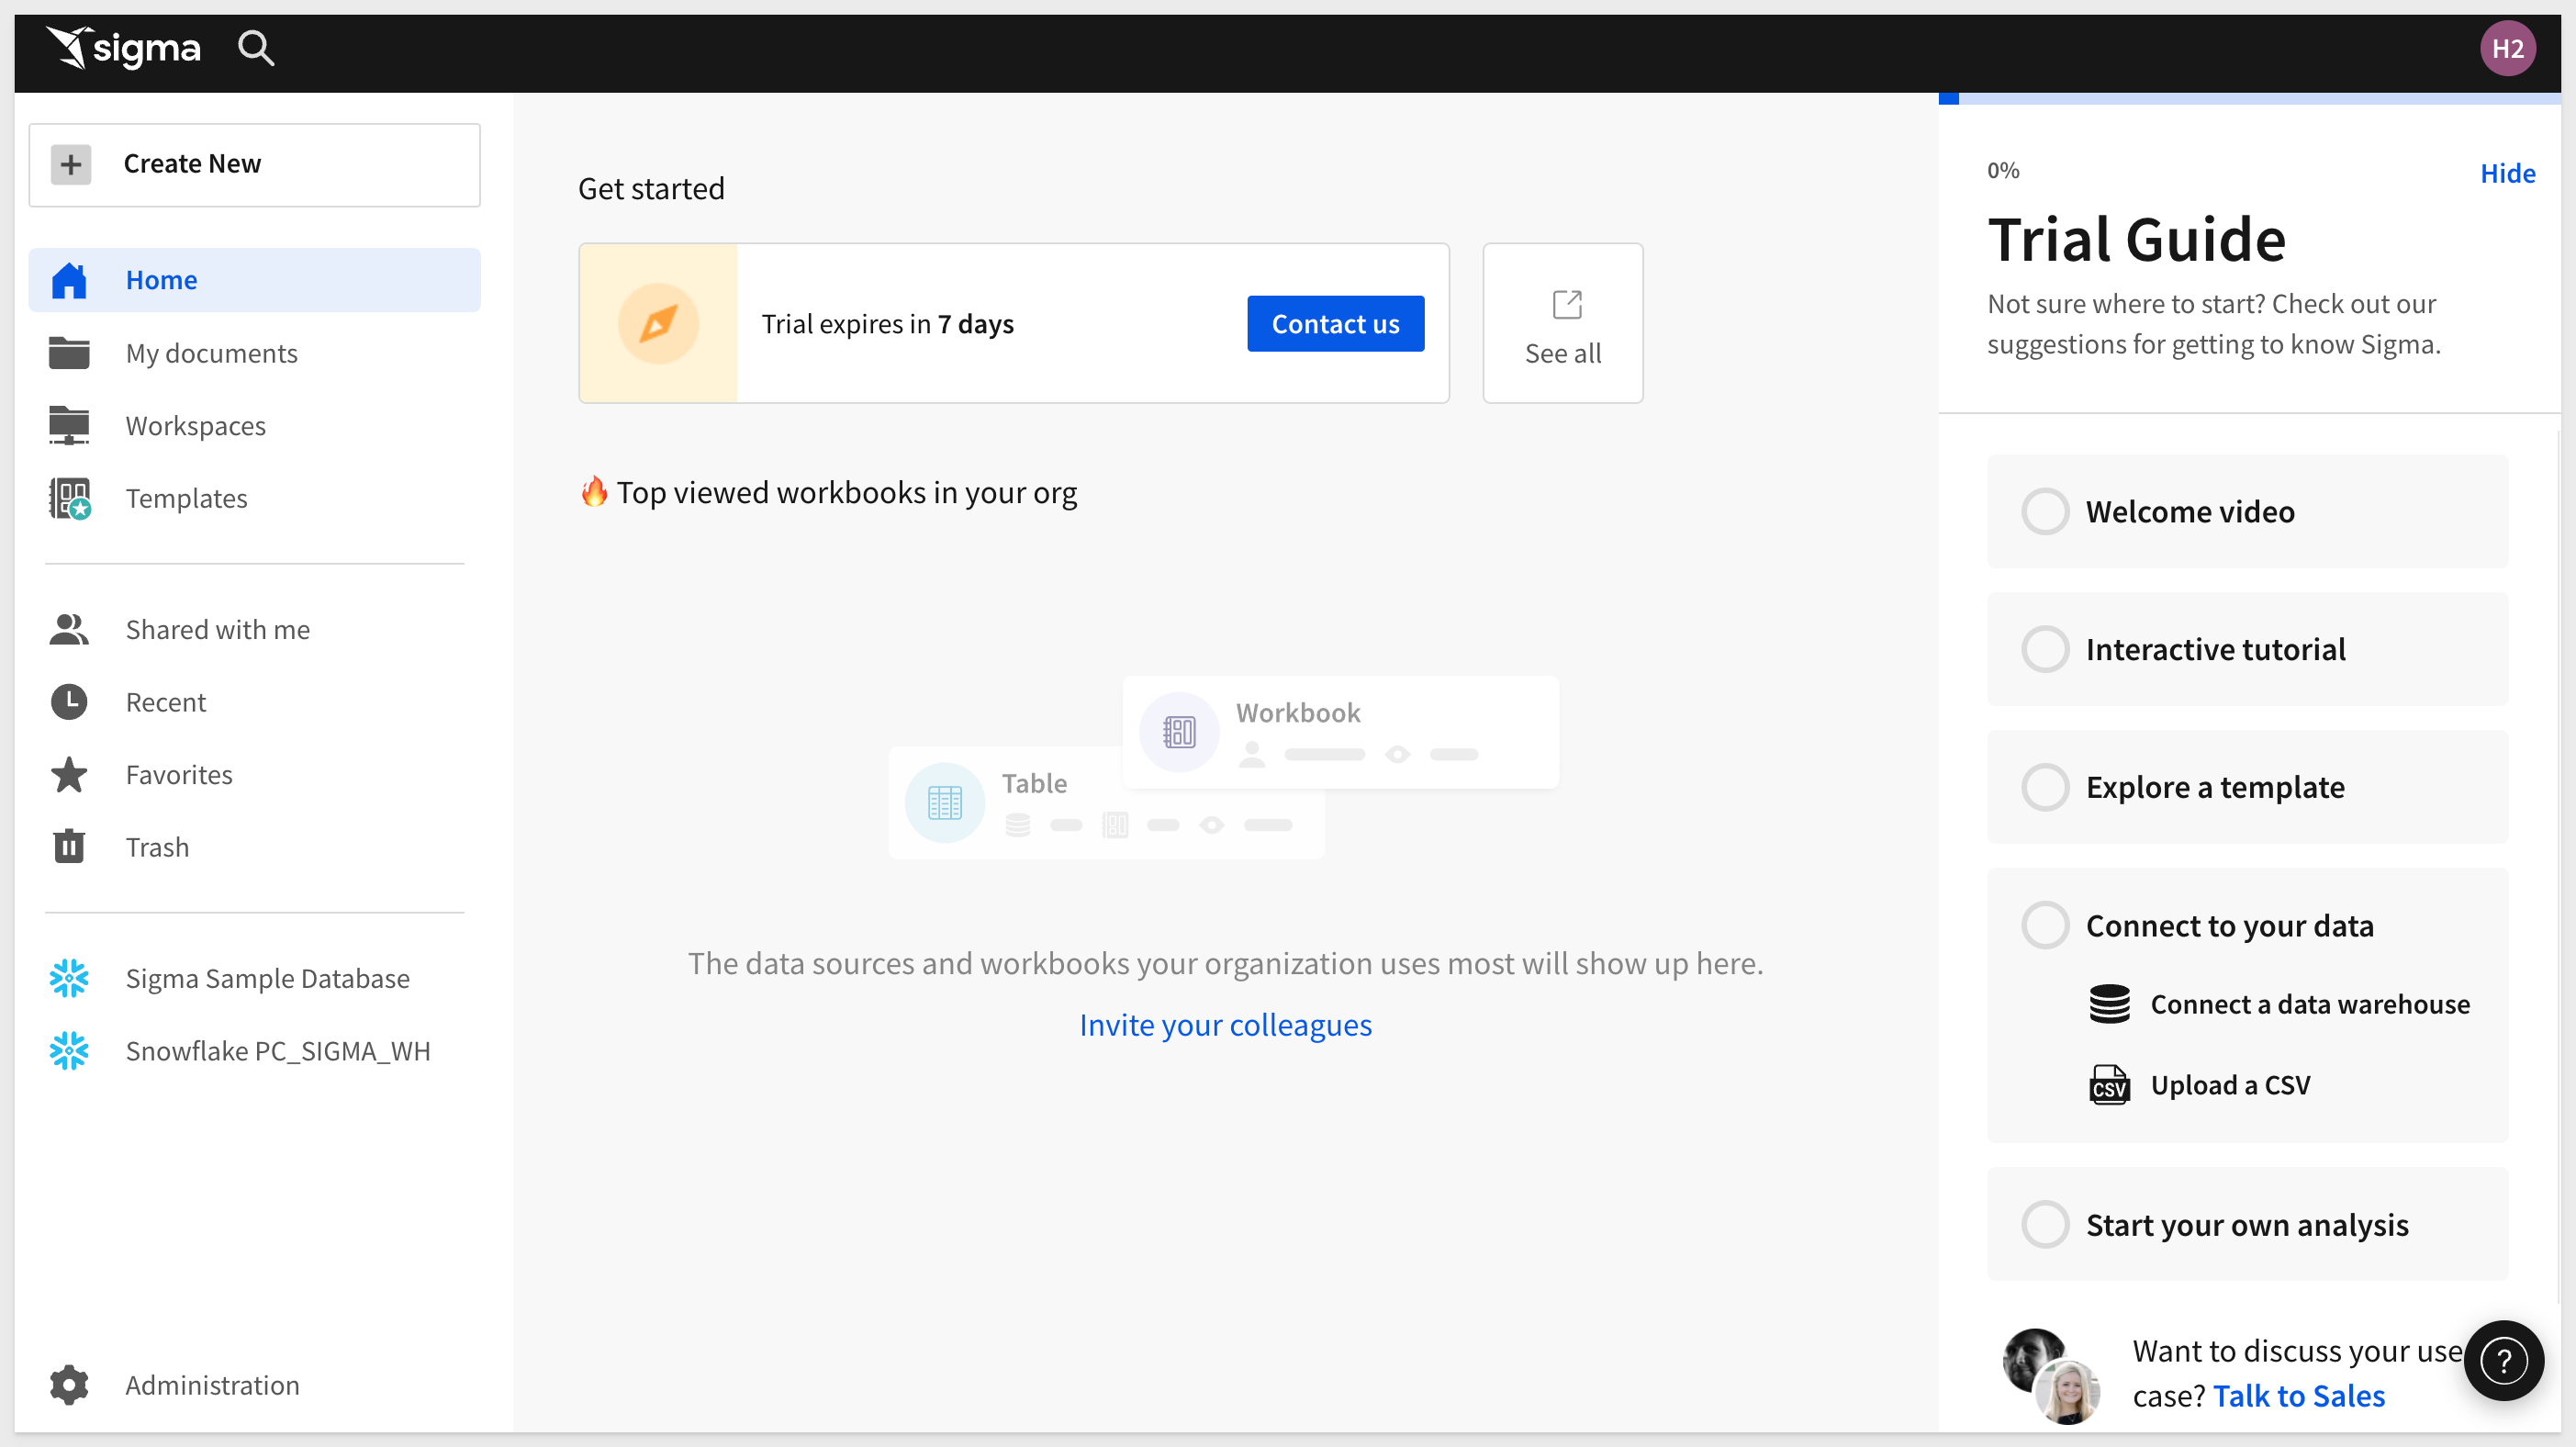
The home page is organized logically to make it easy to get to things quickly. That said, it is also packed full of useful functionality too.
The main functions are numbered and described below:
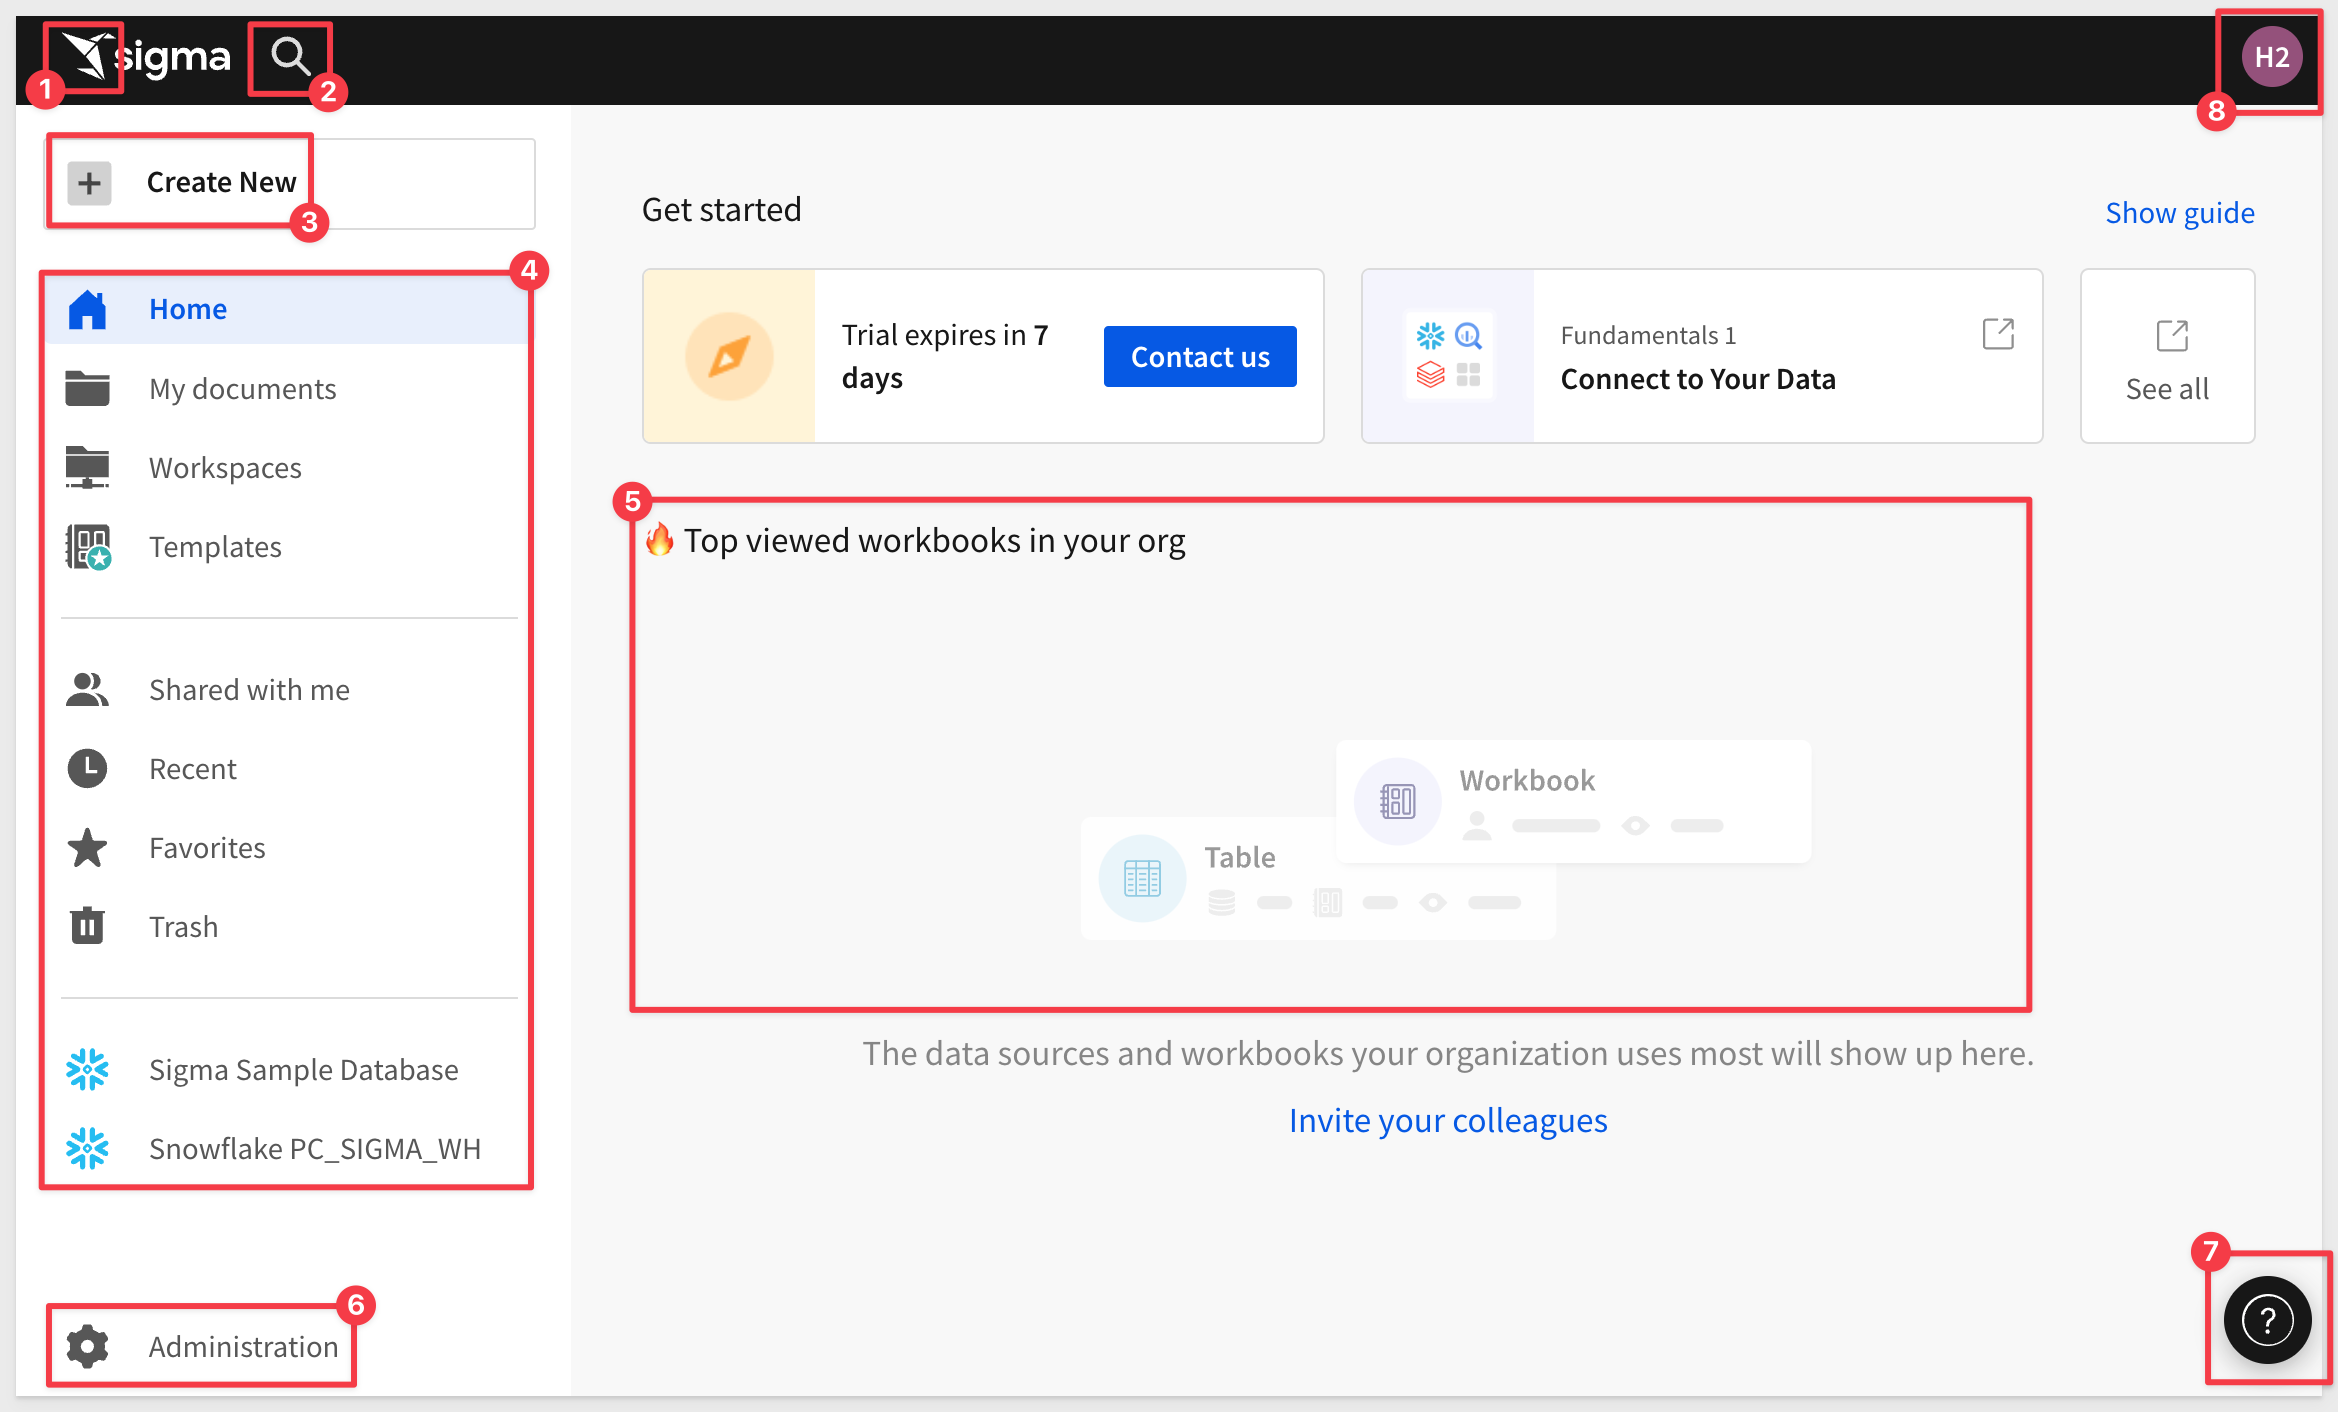
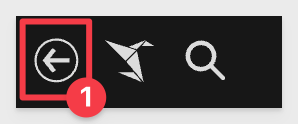
1 - Papercrane: If you want to get back to the home page from anywhere in the portal, just click the Sigma Papercrane logo in the upper left corner.
Once you open a different page, you may notice the back arrow next to the Sigma logo. This allows you to go back one level:
2 - Search: You can click in the search bar at any point to search for content within Sigma.
3 - Create New: Use this anytime you want to create new content.
- Workbook: our spreadsheet UI for analyzing data
- Data Model: enables the curation of data objects to then be shared with others.
- Dataset: provides data modelling.
- Write SQL: allows you to write SQL to run against the data warehouse.
- Upload CSV: allows you to upload a csv to the warehouse in order to perform analysis.
4 - My Content:
- Home: will bring back to home screen.
- My Documents is a personal folder for you to save content you have created.
- Workspaces are a way to organize and share content with specific members or teams within your organization. Items placed in workspaces can be accessed by anyone who has permission to that workspace.
- Templates allow users to standardize and share workbook structures for quick and consistent reuse.
- Shared with Me: will show a list of items others have shared directly with you.
- Recent: will bring up items you have accessed recently.
- Favorites: will show a list of items that you have favorite or quicker access.
- Trash: the typical recycle bin functionality.
- Connections (visible to Administrators and Creators by default): Connections list the data warehouses you have connections to. Clicking on one of them shows the tables in that warehouse you can access. There can be many connections for a single Sigma account, each configured with different levels of access to the warehouse, to be shared with members or teams.
5 - Top viewed: Empty at the start, as teams start to create and use content, the most popular will float to the top of this listing.
6 - Administration: Dedicated area for user management and other common configuration settings. Only shown to users in the Admin role.
7 - Help: has lots of useful information for you to explore later.
8 - User Profile: On the top right corner is a box with your username initial. Clicking on it reveals your profile where you can make changes to your preferences and sign out. Other UI options may or may not be visible to you depending on your permissions.
Let's begin by establishing some basic terminology Sigma uses.
A workbook is akin to an Excel file or Google Sheet.
Each workbook can have many pages, which are akin to Excel worksheets.
Each page can have anything from a simple table to a complete dashboard or data application.
Analysis and presentation are now seamlessly integrated in a spreadsheet-like experience.
This is useful to know because if you want to build something in Sigma (ie: dashboard, report etc...) you need a workbook, at least one page and some data. Data can come from the cloud data warehouse or end user input, but will talk more about that later.
One particular may be new to users of traditional BI products. This feature, called Input Tables allow data to be captured from the user, and stored in the warehouse. In addition, data in an Input Table can be joined (via a lookup) to other warehouse tables. This enables many powerful use cases, a few are covered in this ]QuickStart.](https://quickstarts.sigmacomputing.com/guide/input_tables_use_cases/index.html?index=..%2F..index#0)
The last feature we will mention now (there are SO MANY FEATURES) called Controls.
A Sigma control is typically a drop list that filters the Page data (or individual item). There are many variations of controls, and all are really easy to use.
Of course, this is all baseline terminology, and pretty easy to understand.
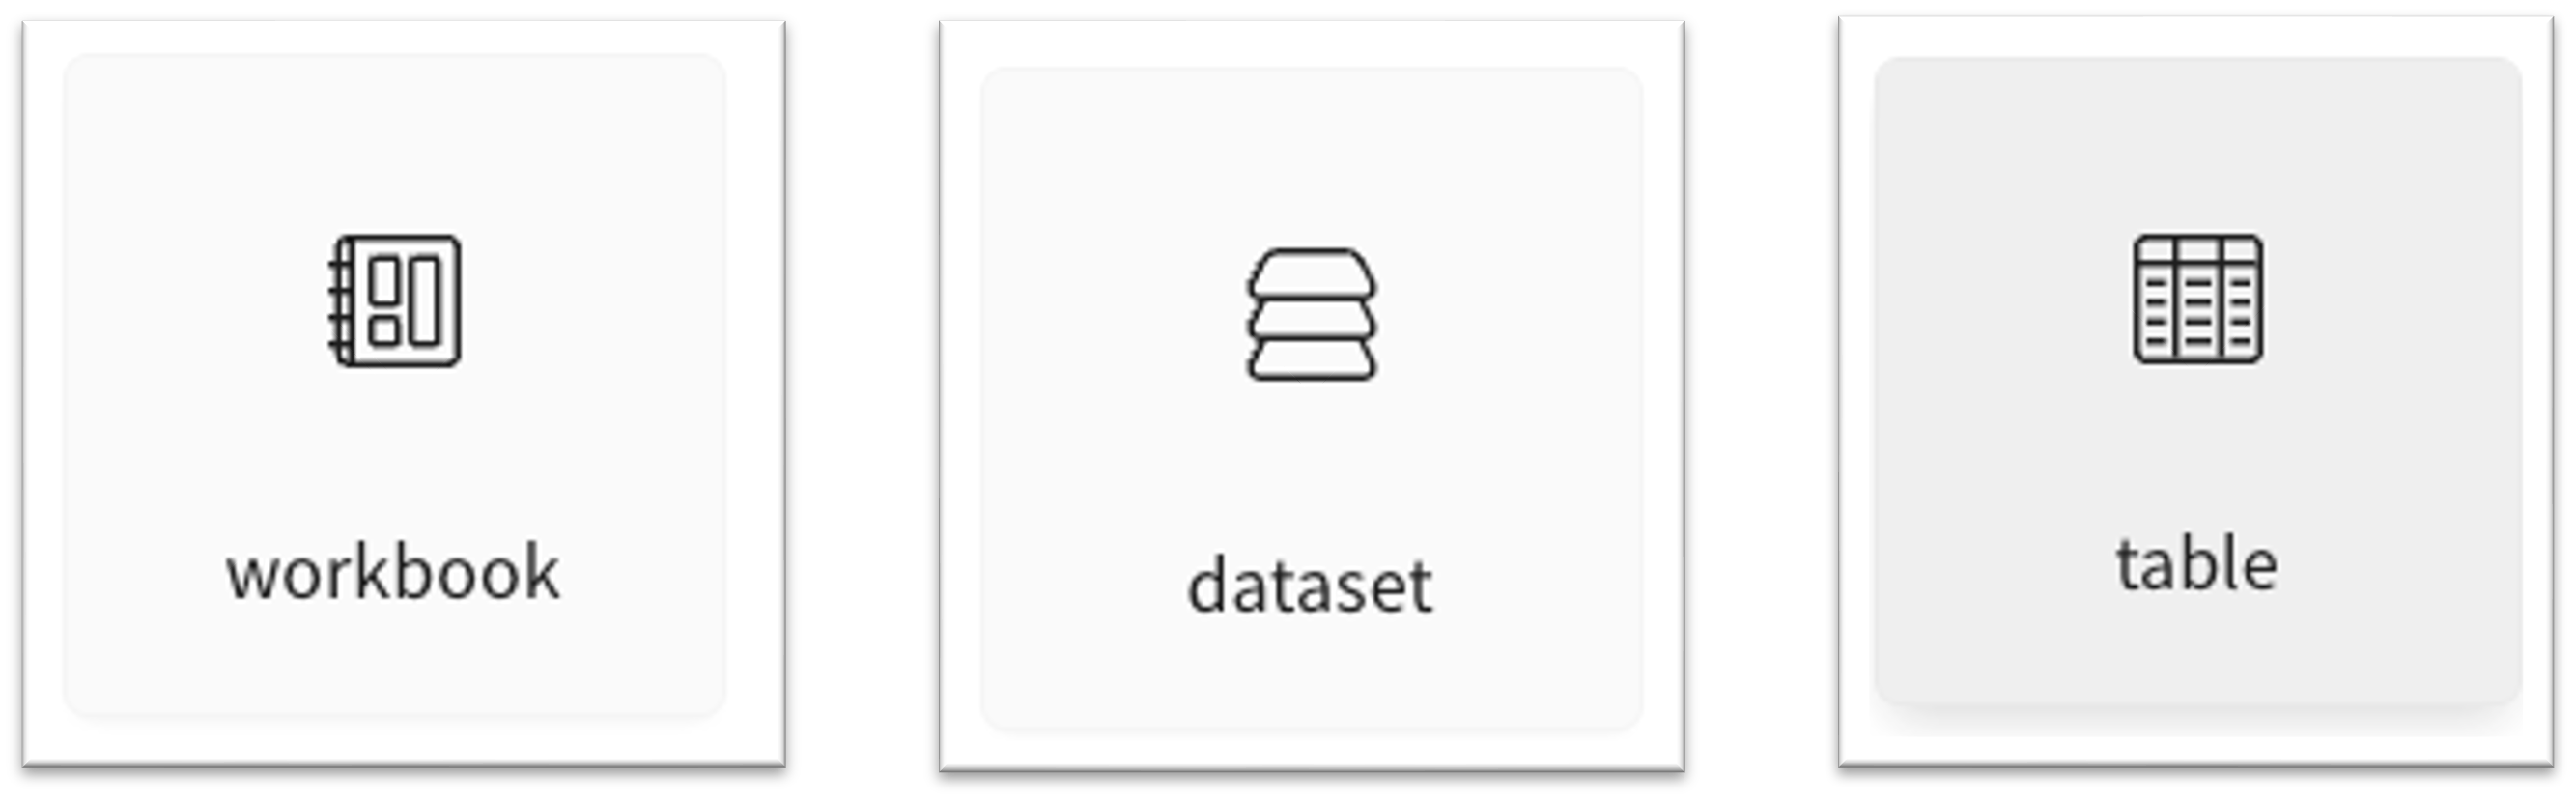
The last point we will make on this topic is that there are different icons for different objects in Sigma.
For example here are the most common ones that you will see:
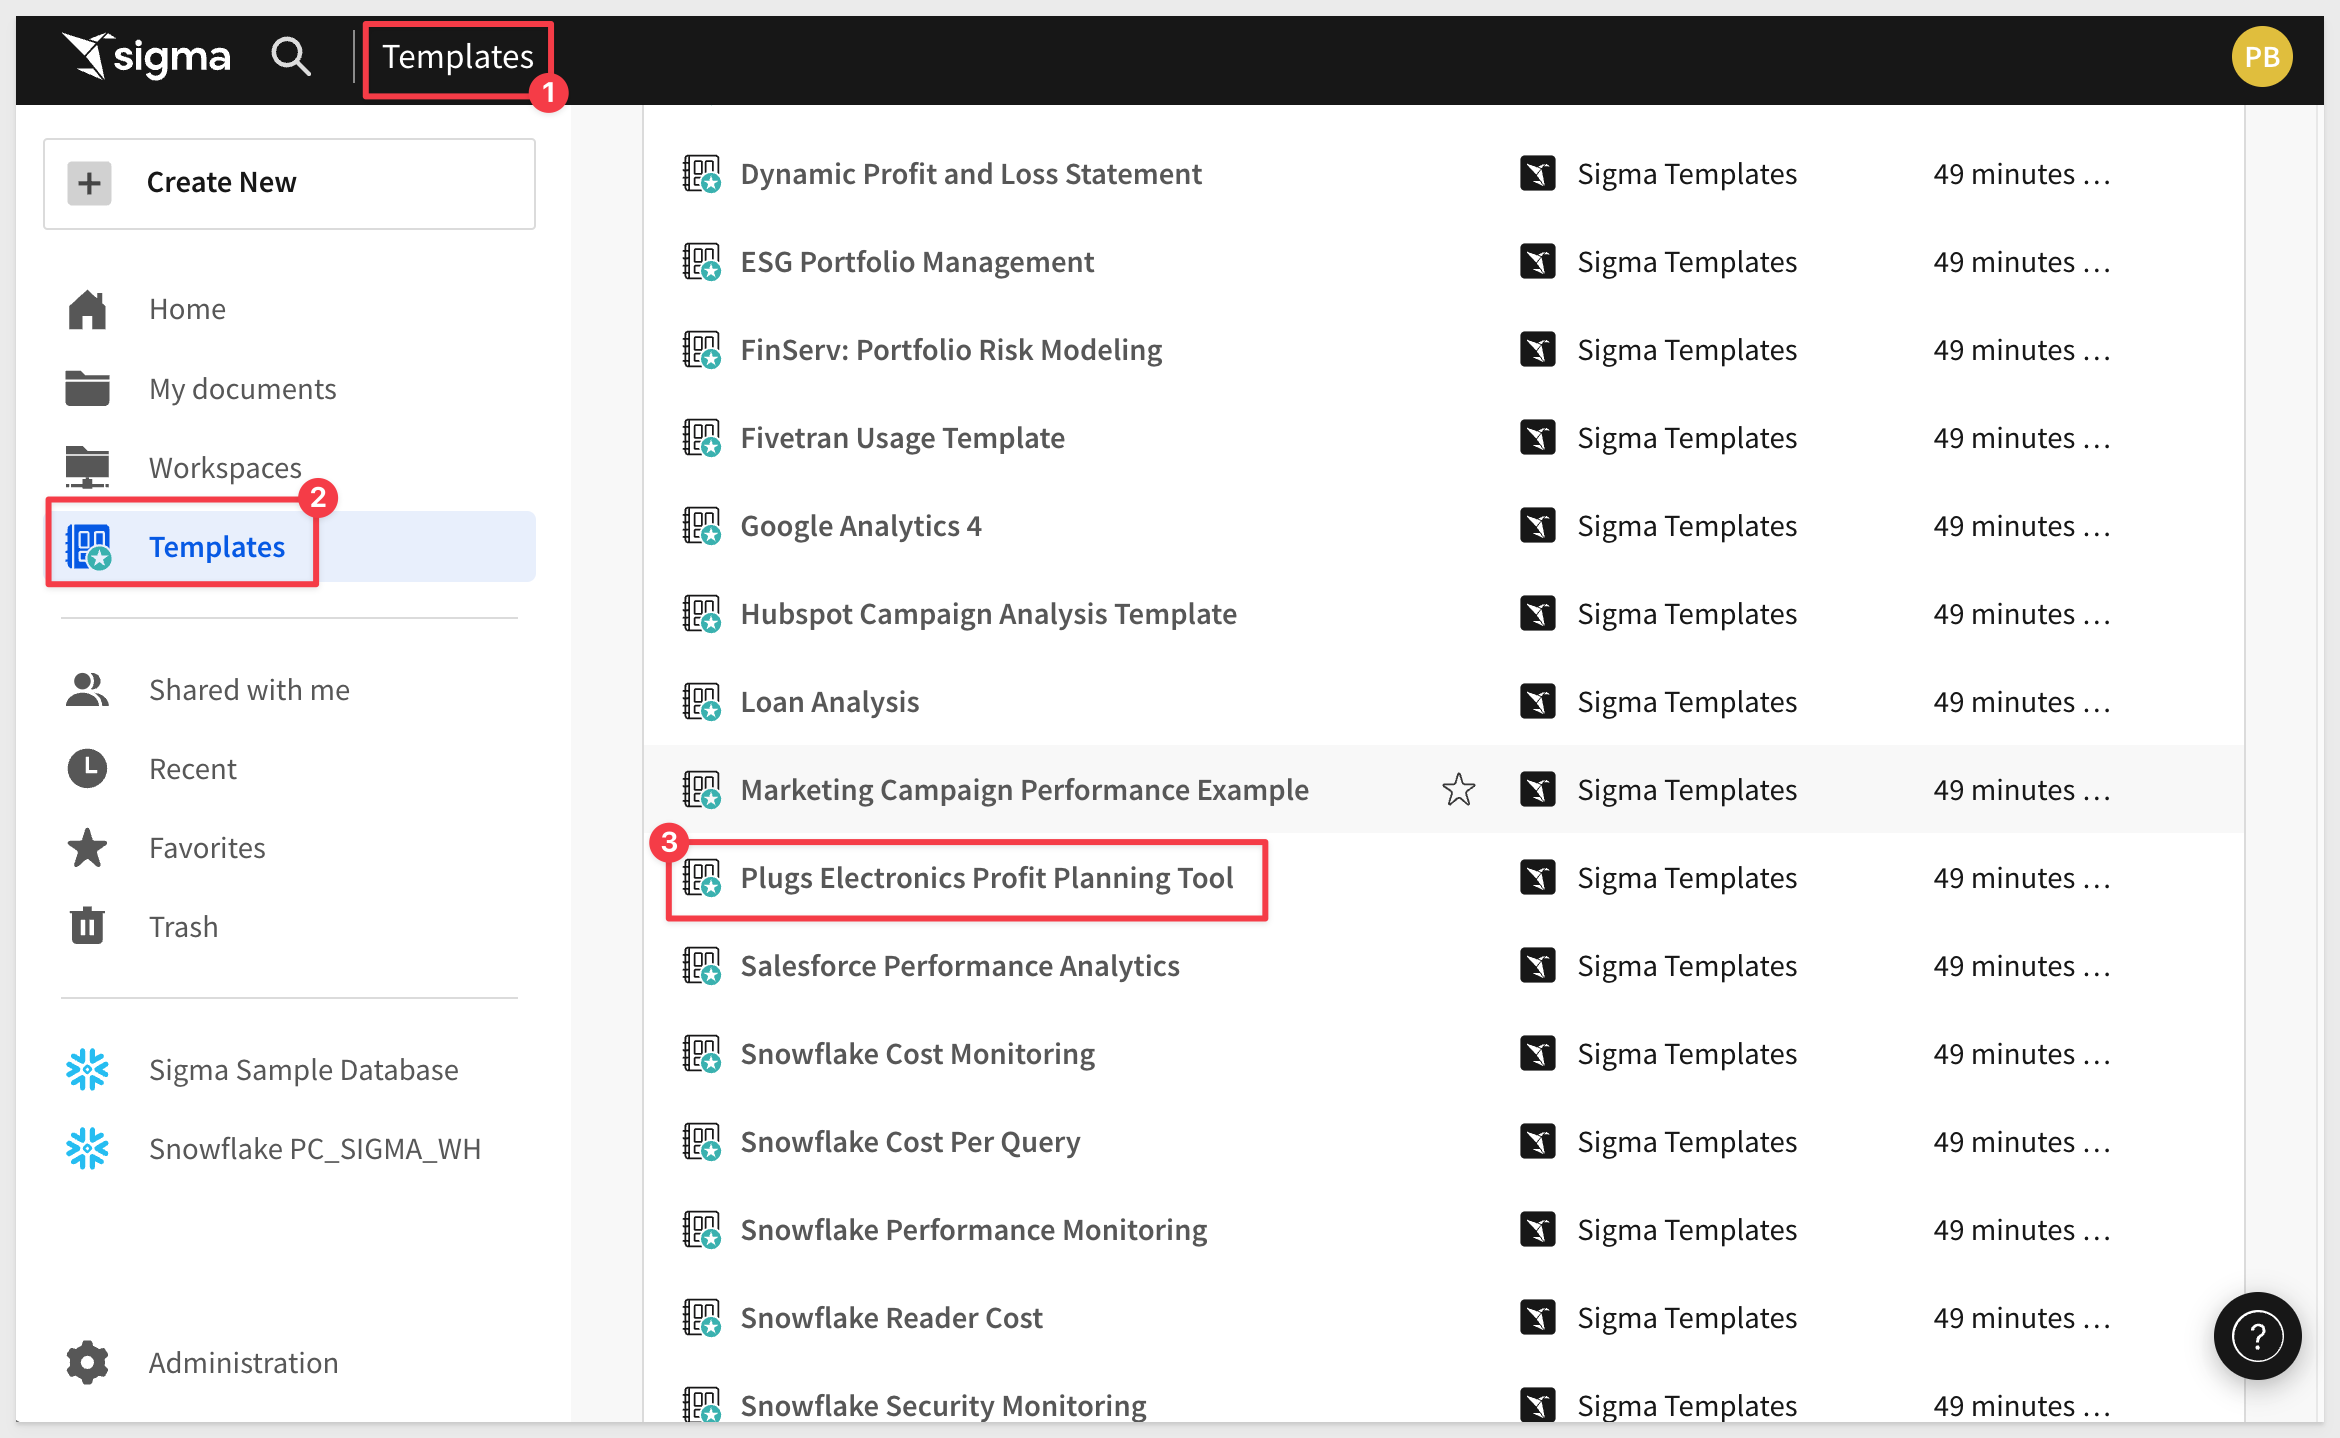
Click on Templates and then click the Plugs Electronics Profit Planning Tool.
Workbook templates allow users to create and share workbook structures for quick and consistent reuse and further customization.
Click Dismiss when asked about swapping to use your data.
The Plugs Profit Planning Tool is a live data application the (fictitious) business uses to collaborate on price modeling and forecasting.
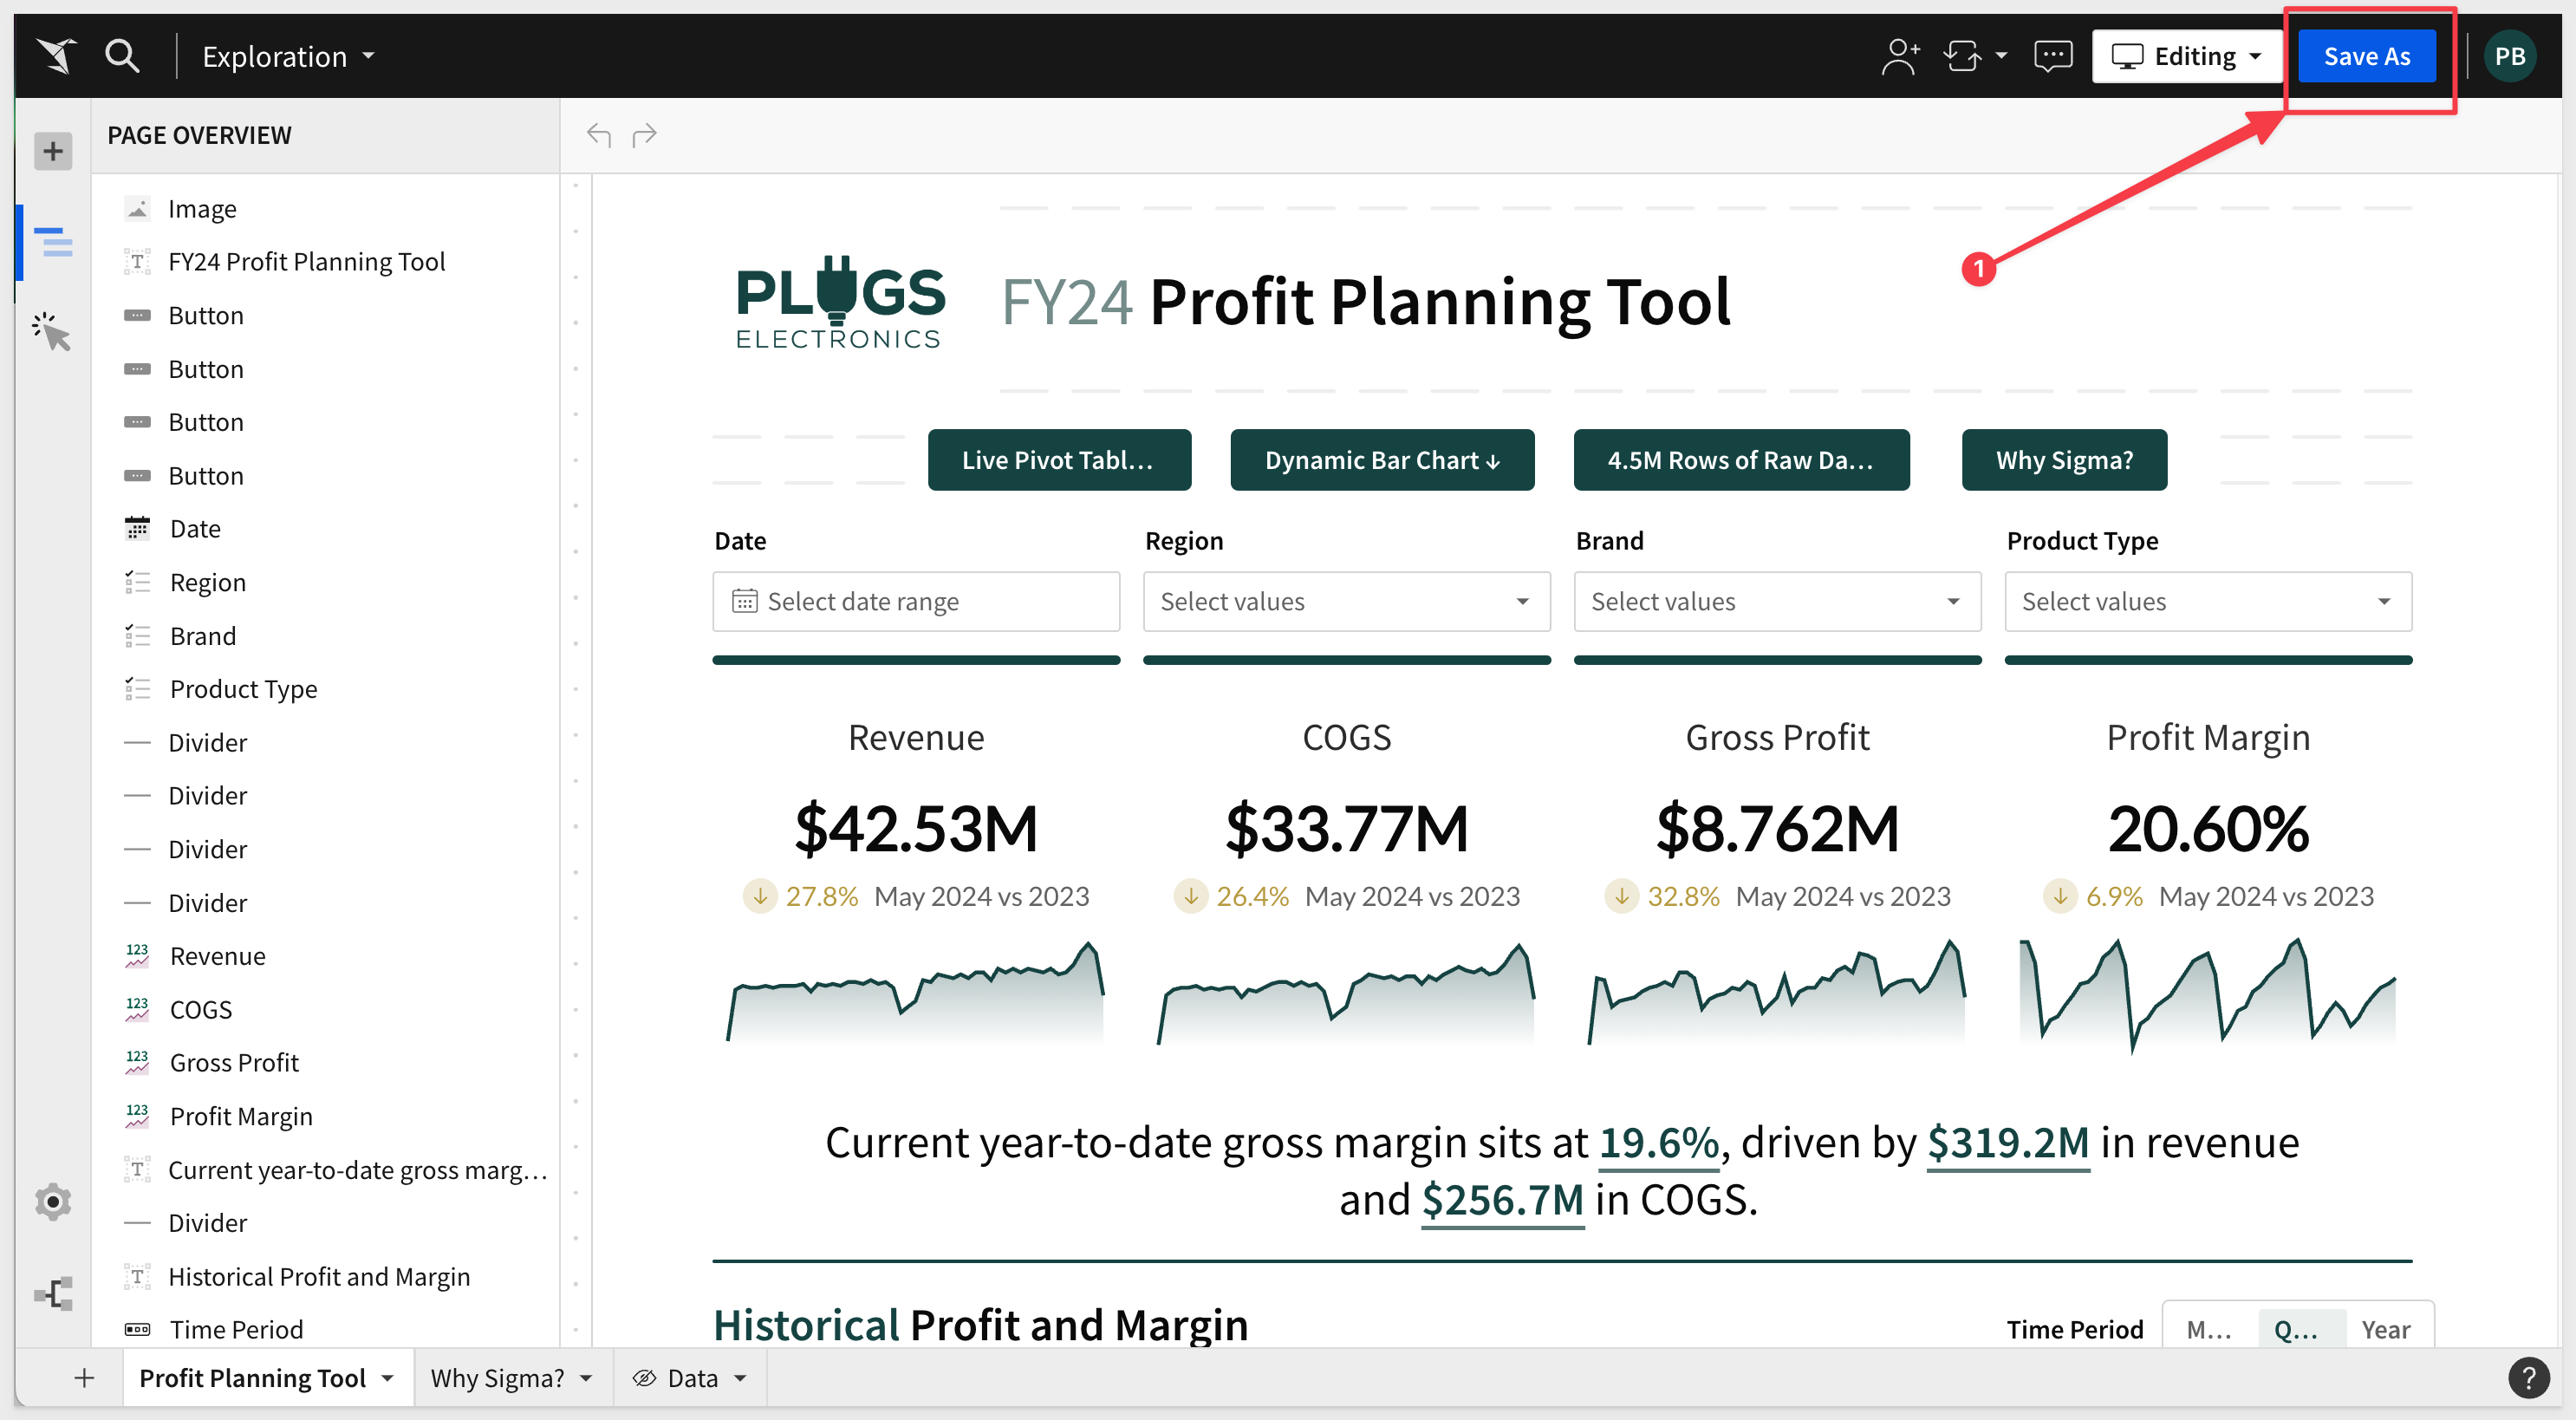
This sample Workbook gives you an idea of what a dashboard could look like in Sigma.
Use Save As to store a copy if this workbook as you see fit.
For example, you may want to have a copy just for yourself stored in My Documents or you may want to have a folder where you store workbooks that you intend to share with others.
Sigma has a full role-based-access system that allows for granular control over who can do and see information.
Would you like more information about Sigma? Navigate to the Why Sigma? workbook page at the bottom of the screen.
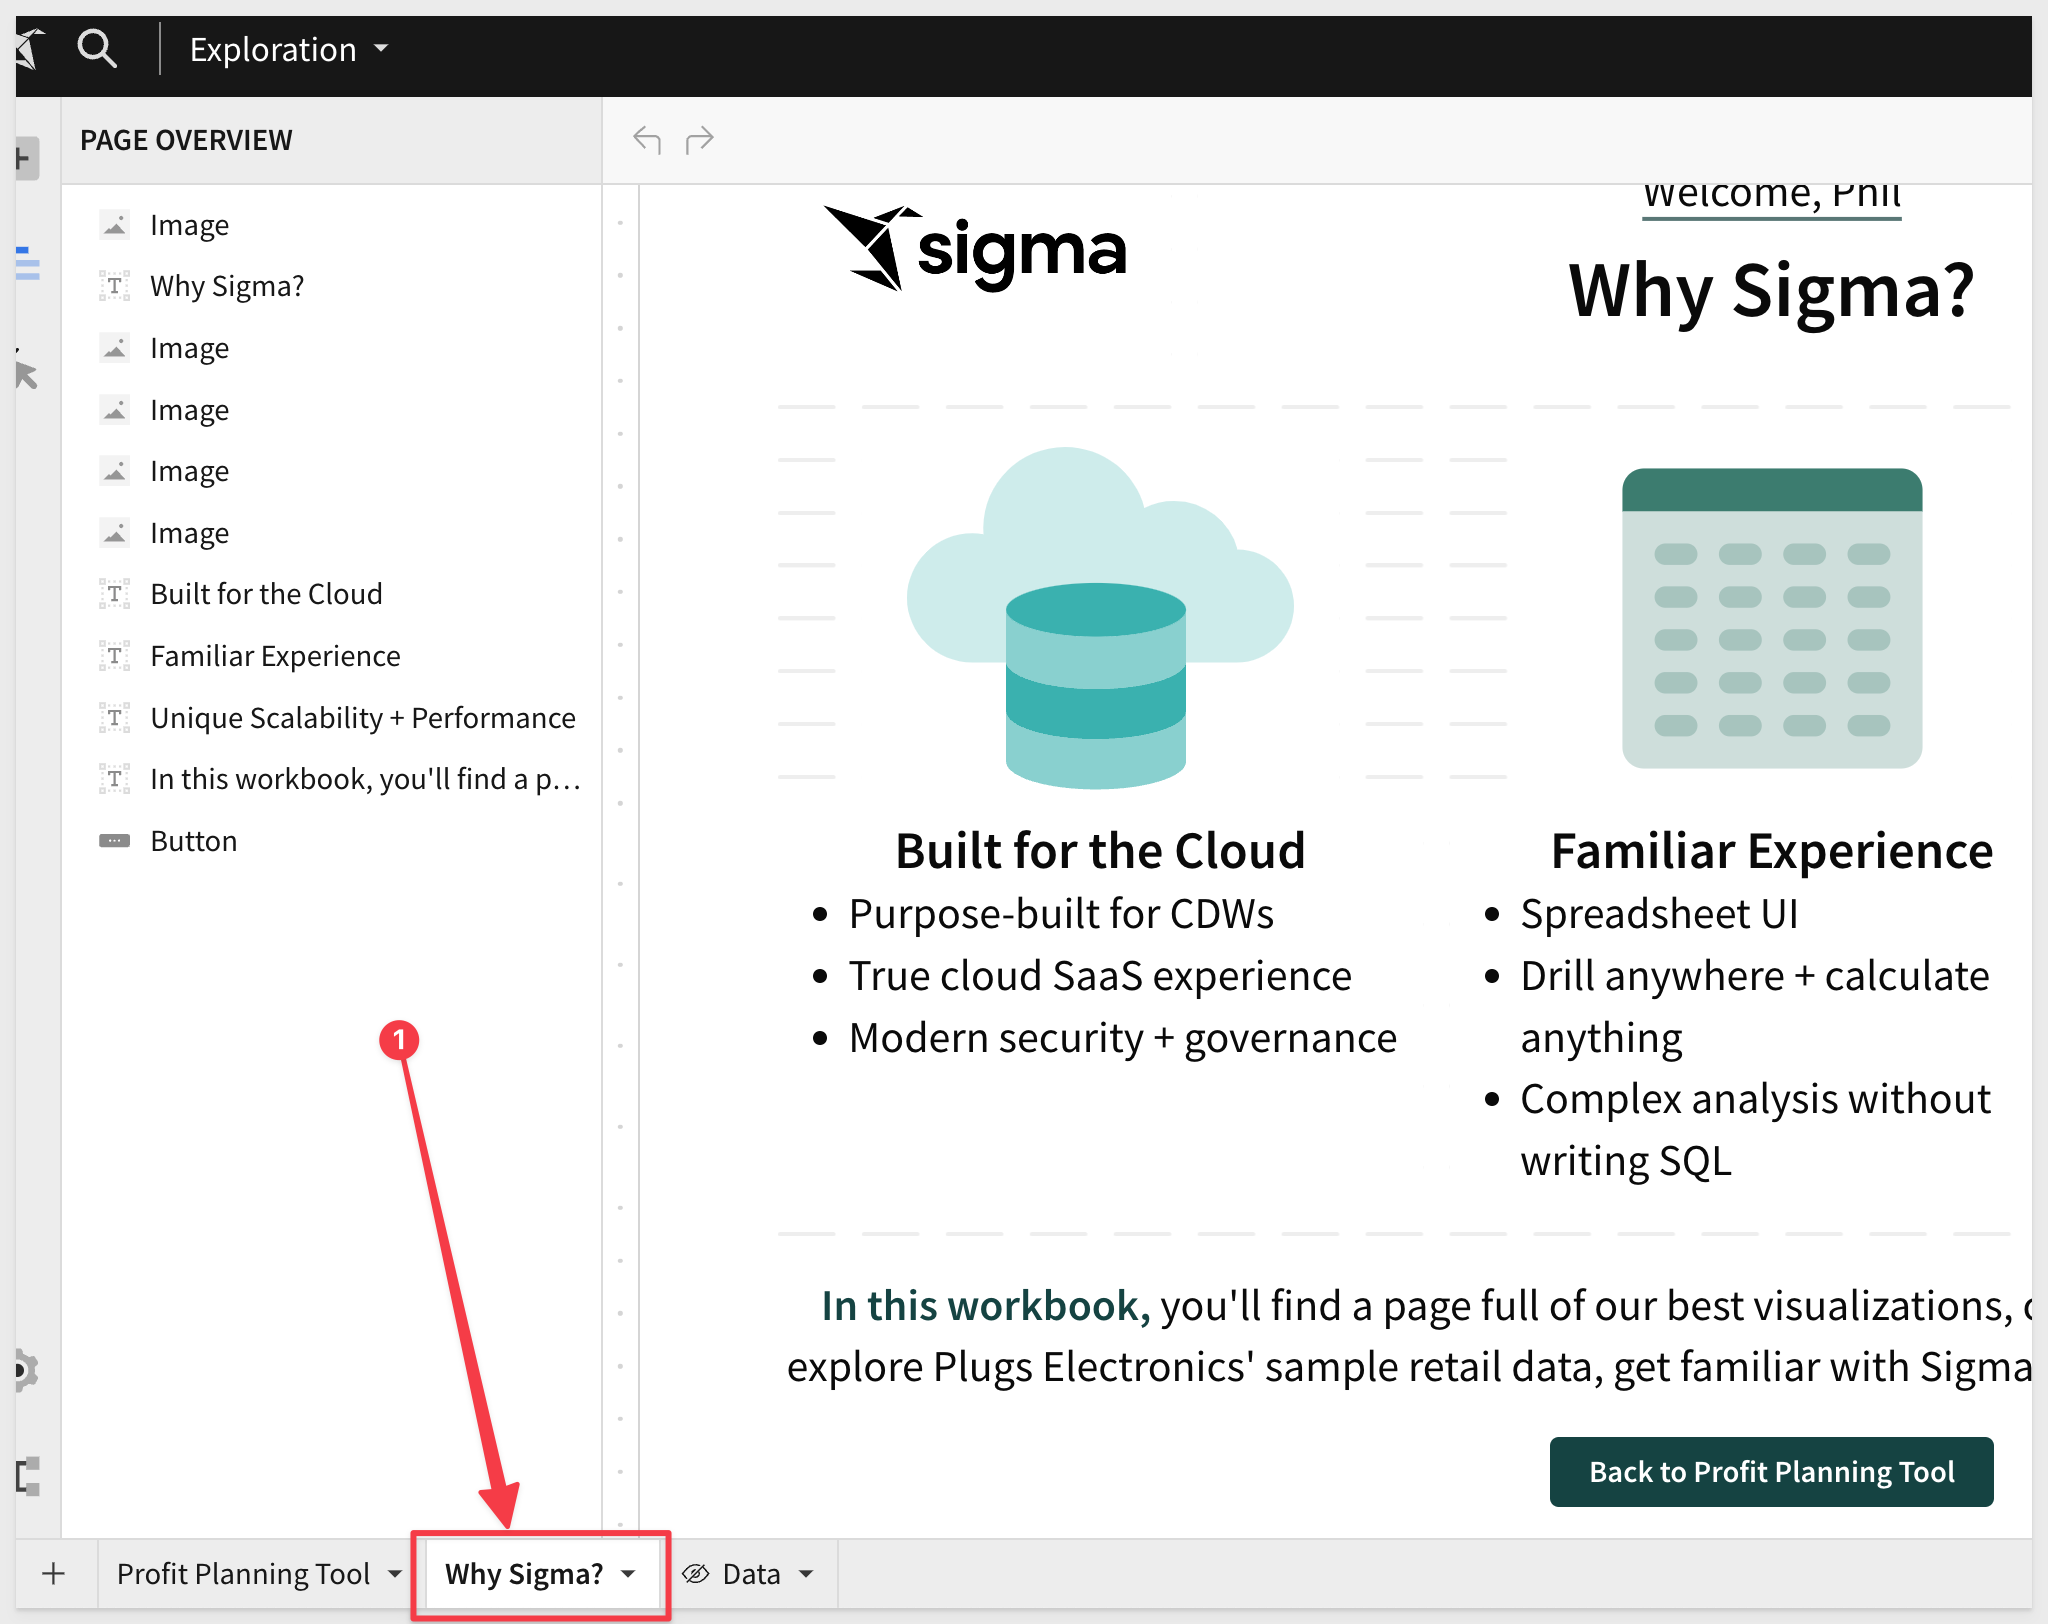
Notice that there another page that has the icon called Data?. This page has data that the main page uses to drive tables, visualization and controls, but will be hidden from users who do not have the elevated permission.
Drill Anywhere
Scroll down to the Historical Profit and Margin chart and right-click on one of the bars.
Sigma lets you filter, drill-down, sort and access the underlying data in a single click:
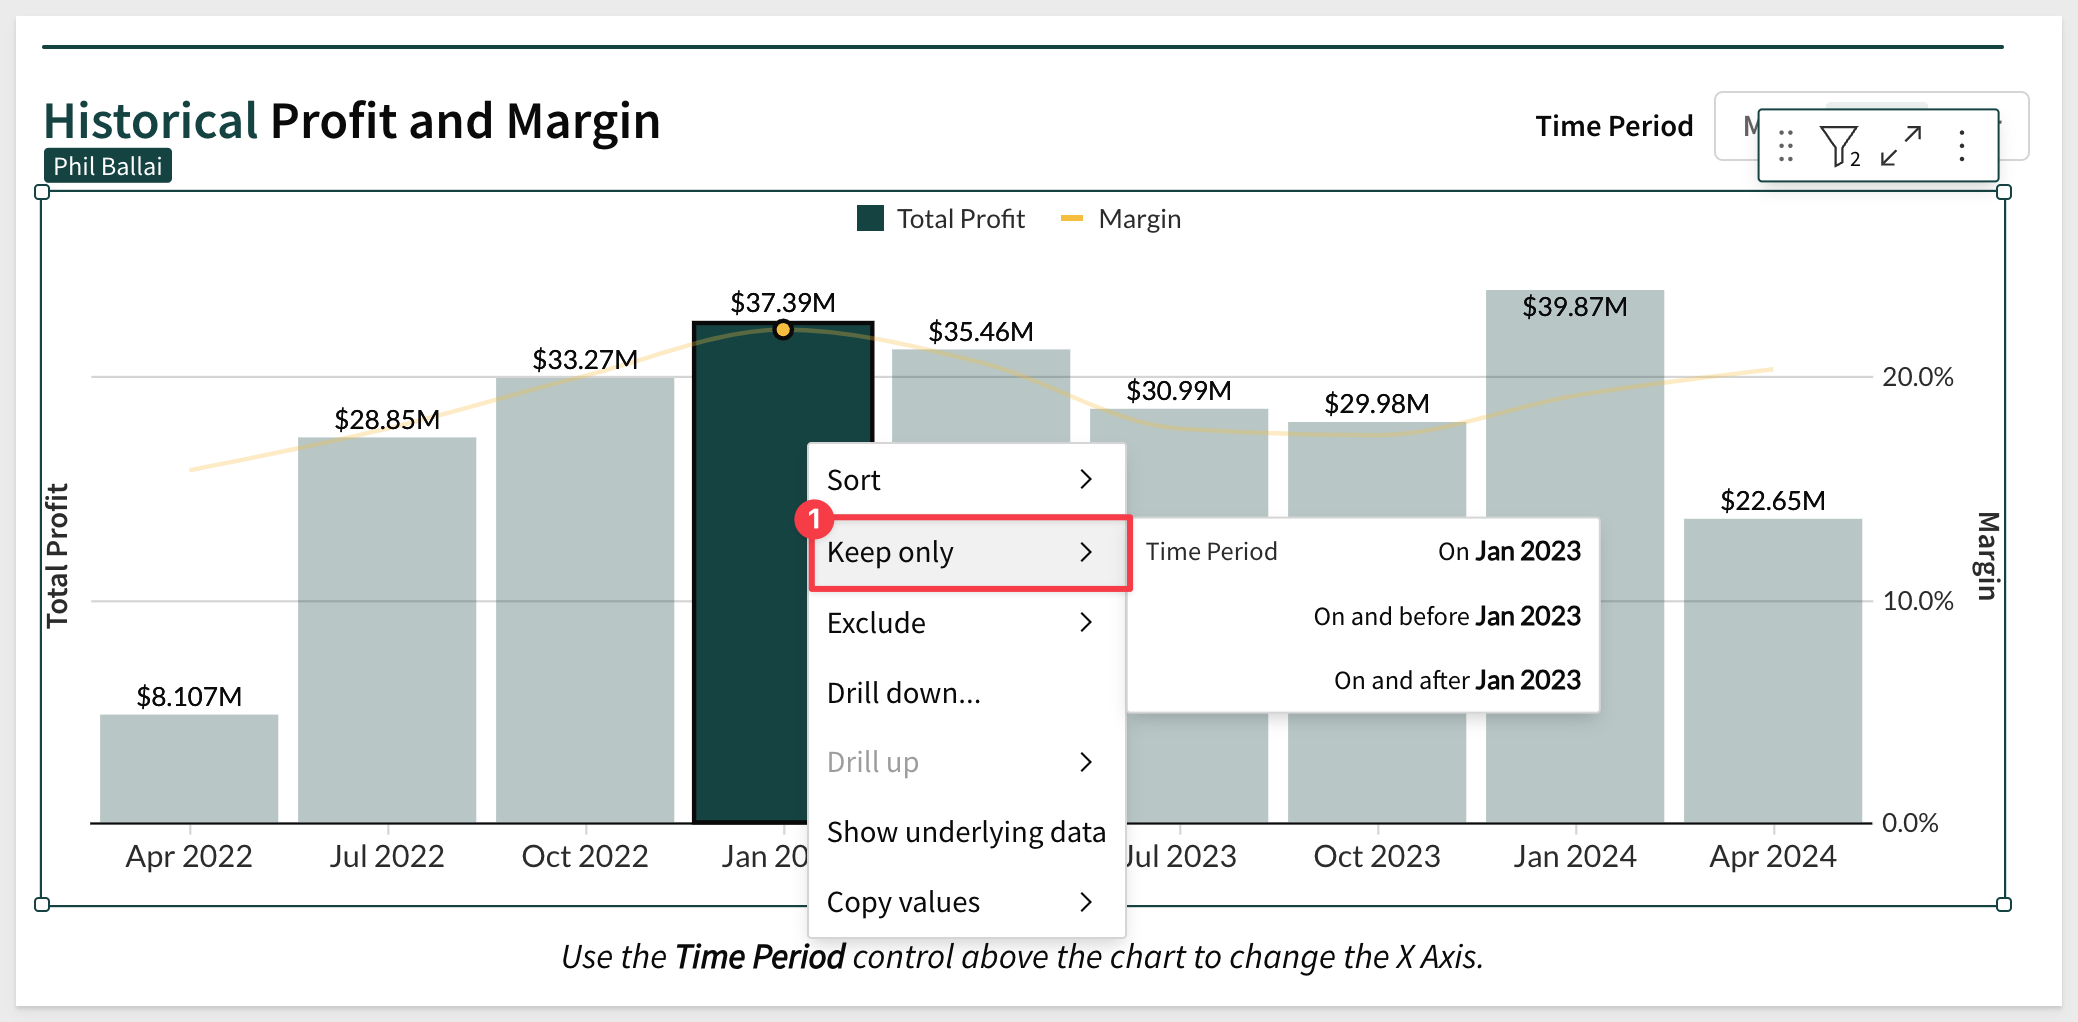
This is built-in and automatic so that you you don't have to waste time configuring things over and over again.
Want to see all the data?, click the expand arrows in the corner of any page element:
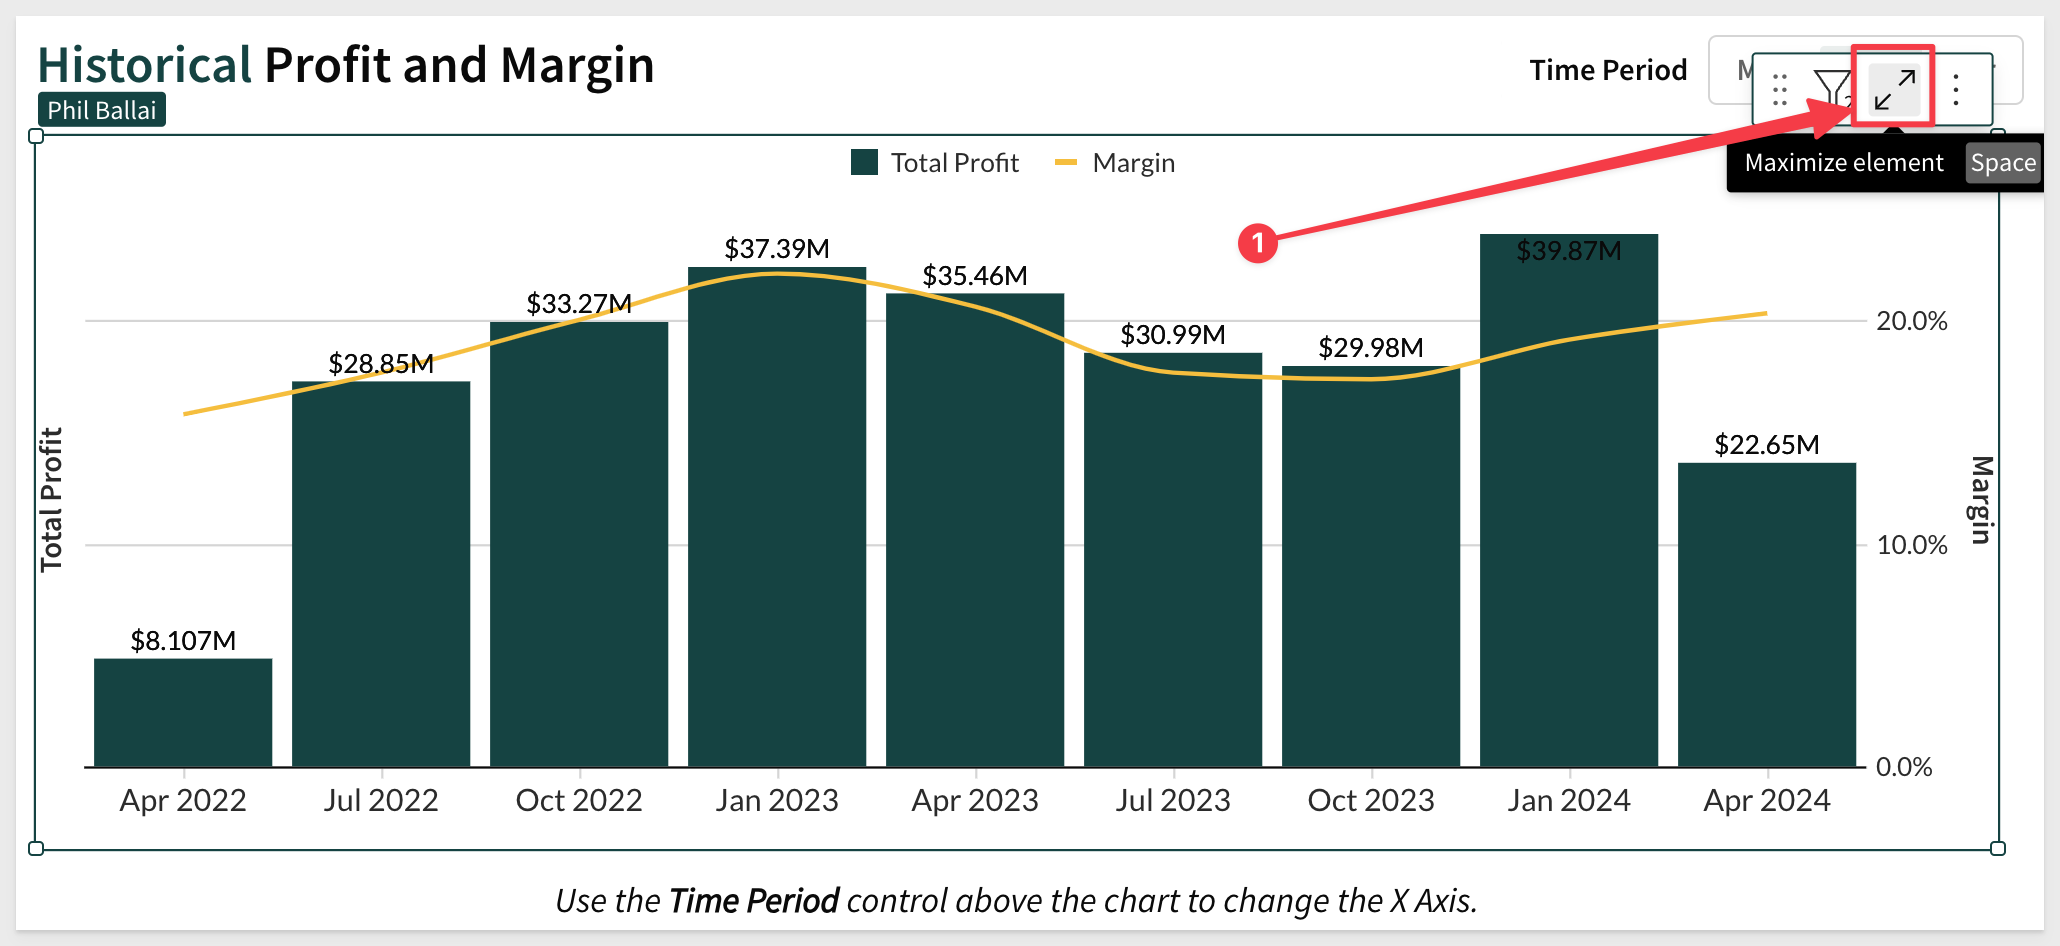
Now we can see all the table data that is driving the chart and manipulate at the lowest level of granularity.
Massive Data Scale
You might also notice that his table is over 2.3 million rows but even with a Snowflake X-small compute tier serving the data, performance is a non-issue.
Sigma has customers that routinely build dashboards against billions of rows of data.
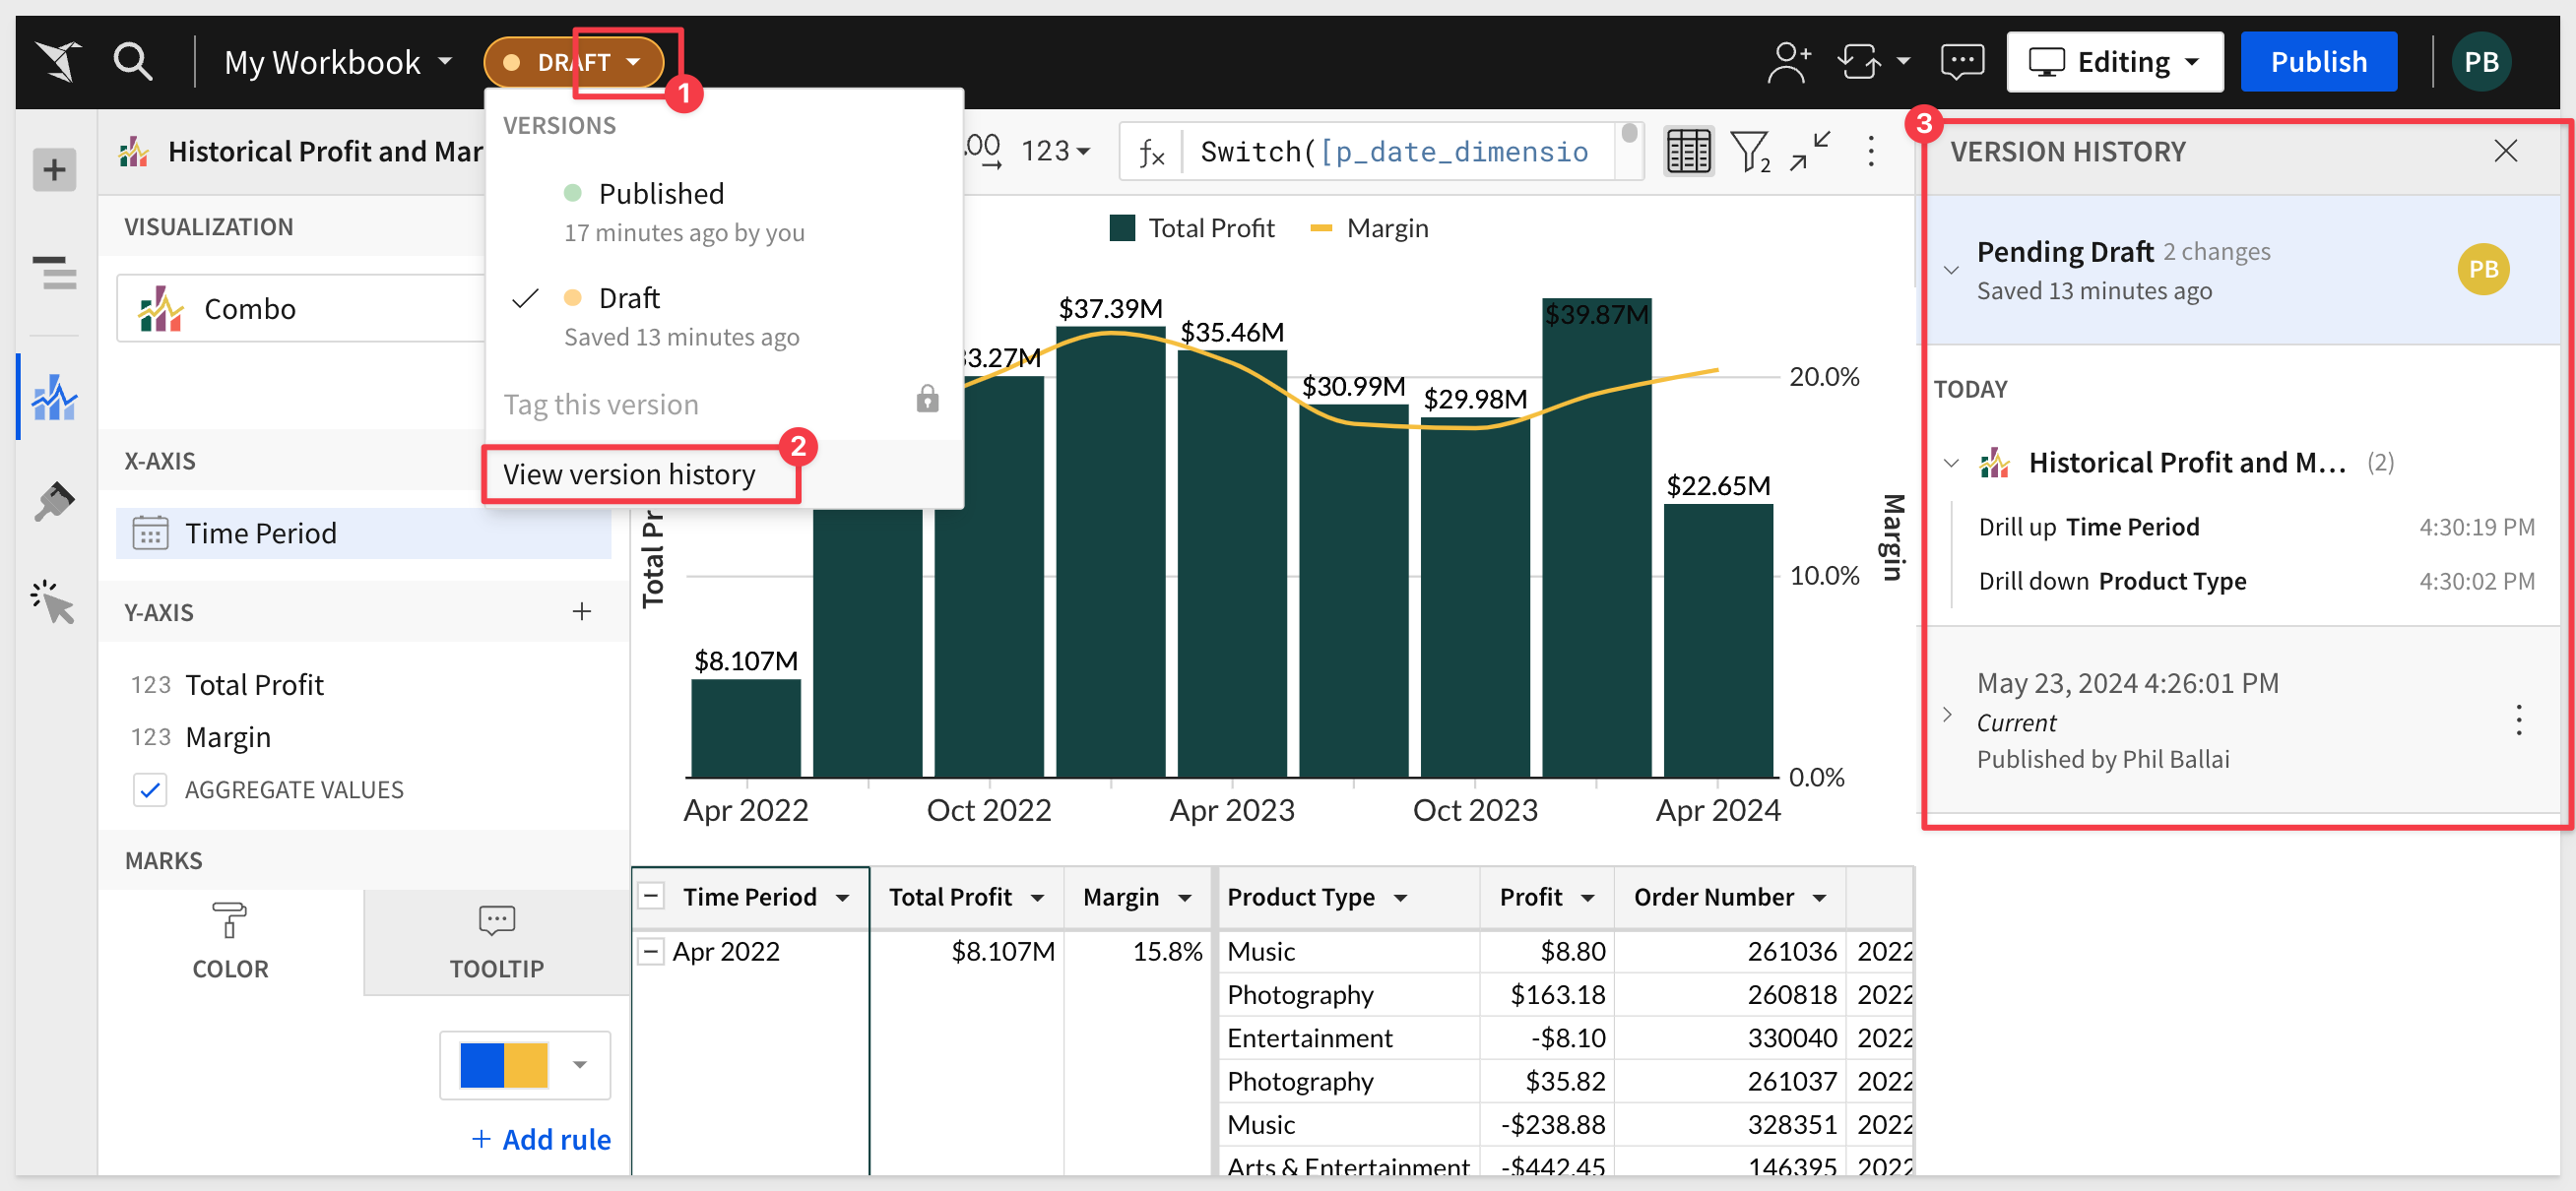
Version History
You may have noticed the Publish button in the upper right corner. Users can edit content and it is not shown to anyone else until it is published.
In addition to that, Sigma maintains a version history of all edits and published workbook versions so that you can easily revert anytime:
That is a VERY small preview of what is possible.
Now click the Sigma papercrane  to return to the homepage where we will create some content of our own.
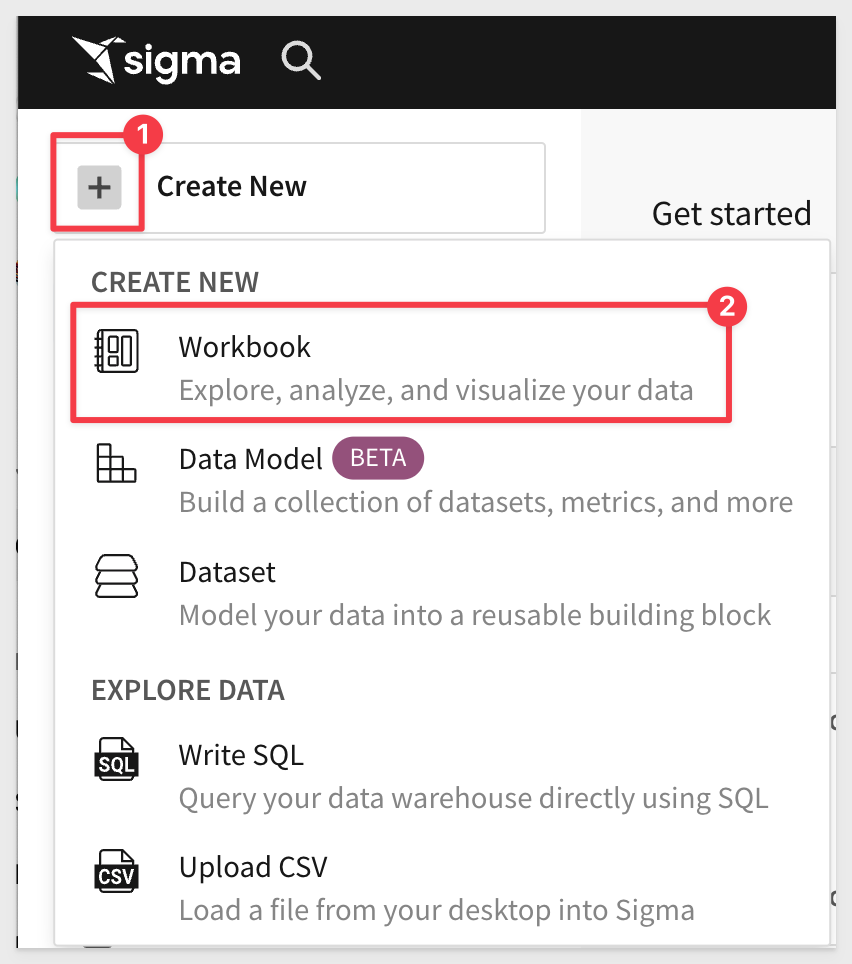
After returning to the homepage, click the + Create New icon and click Workbook:
On the left side we are presented the Element panel. This is where various types of objects can be added to a workbook live. It is also where elements that have been added can be configured, upon selection of any workbook element on a page.
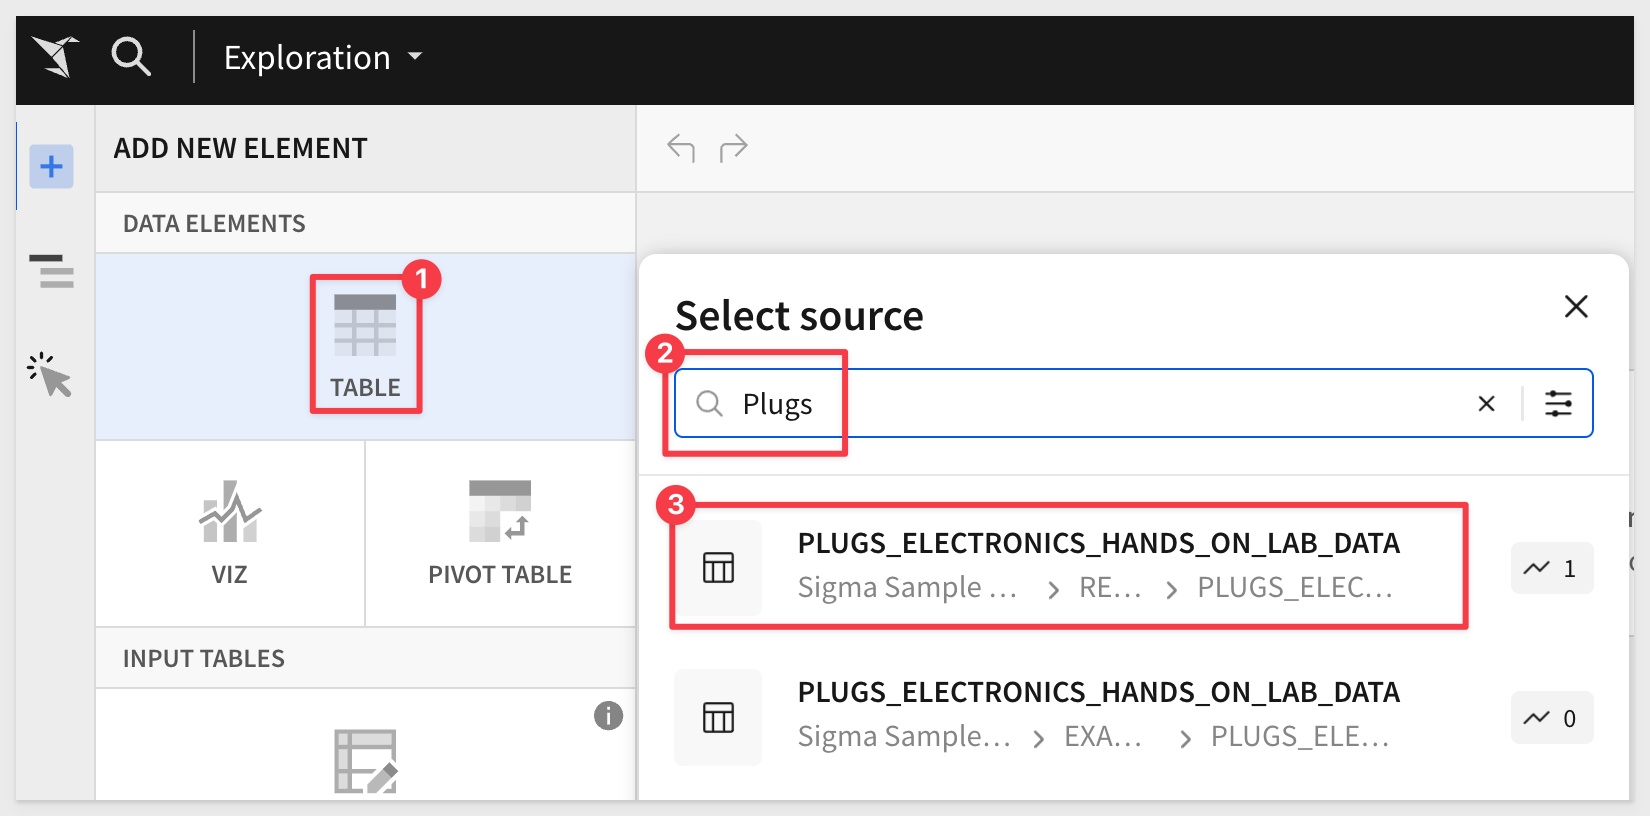
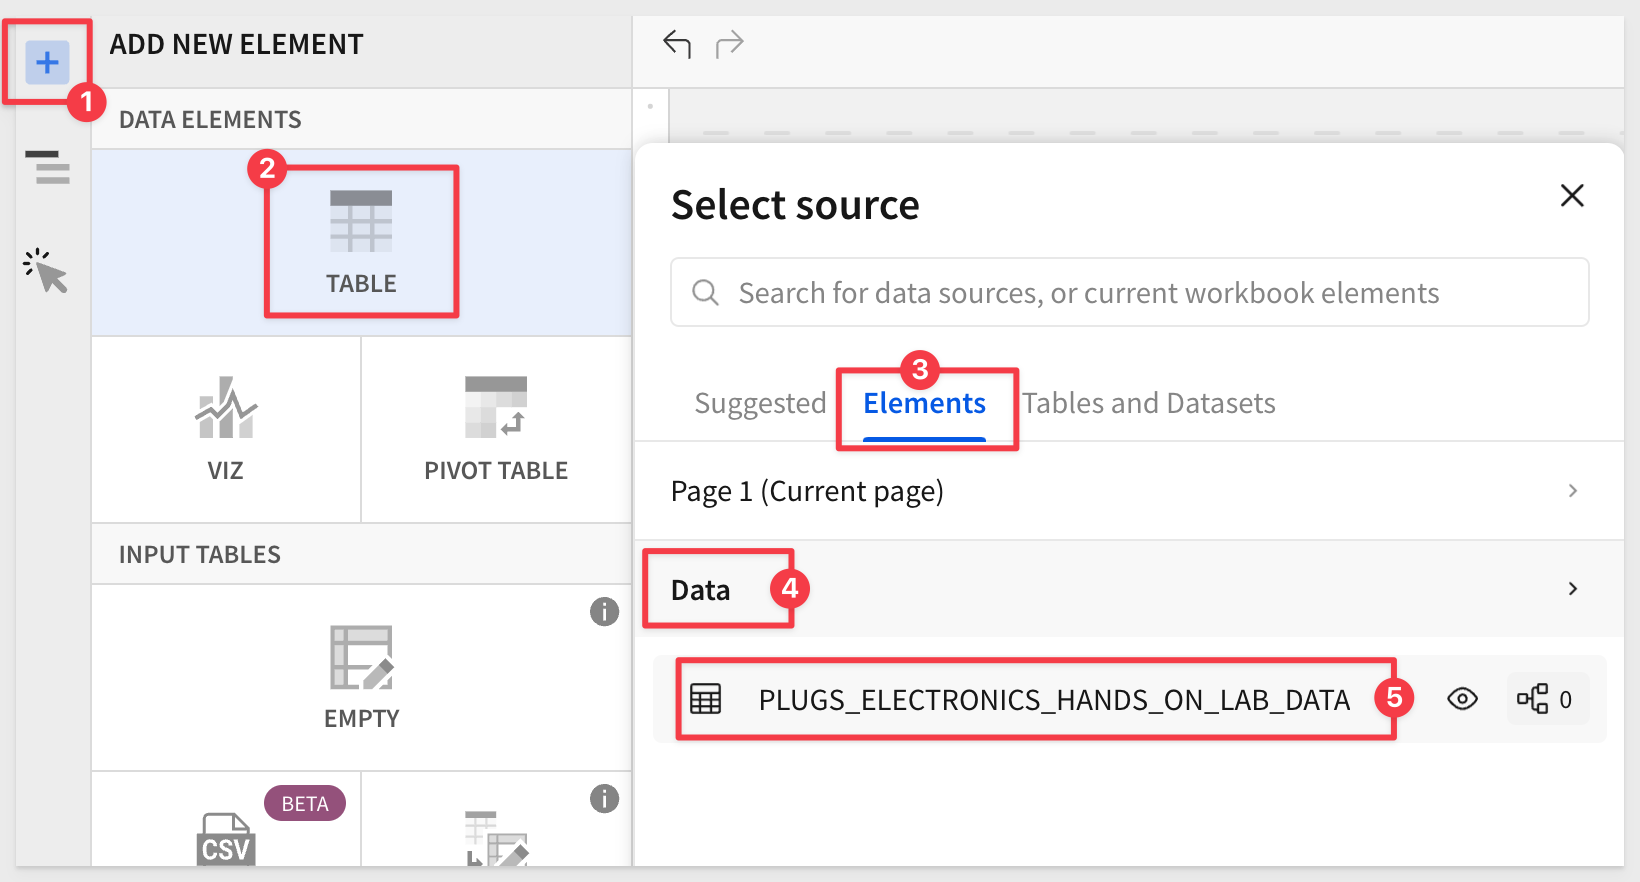
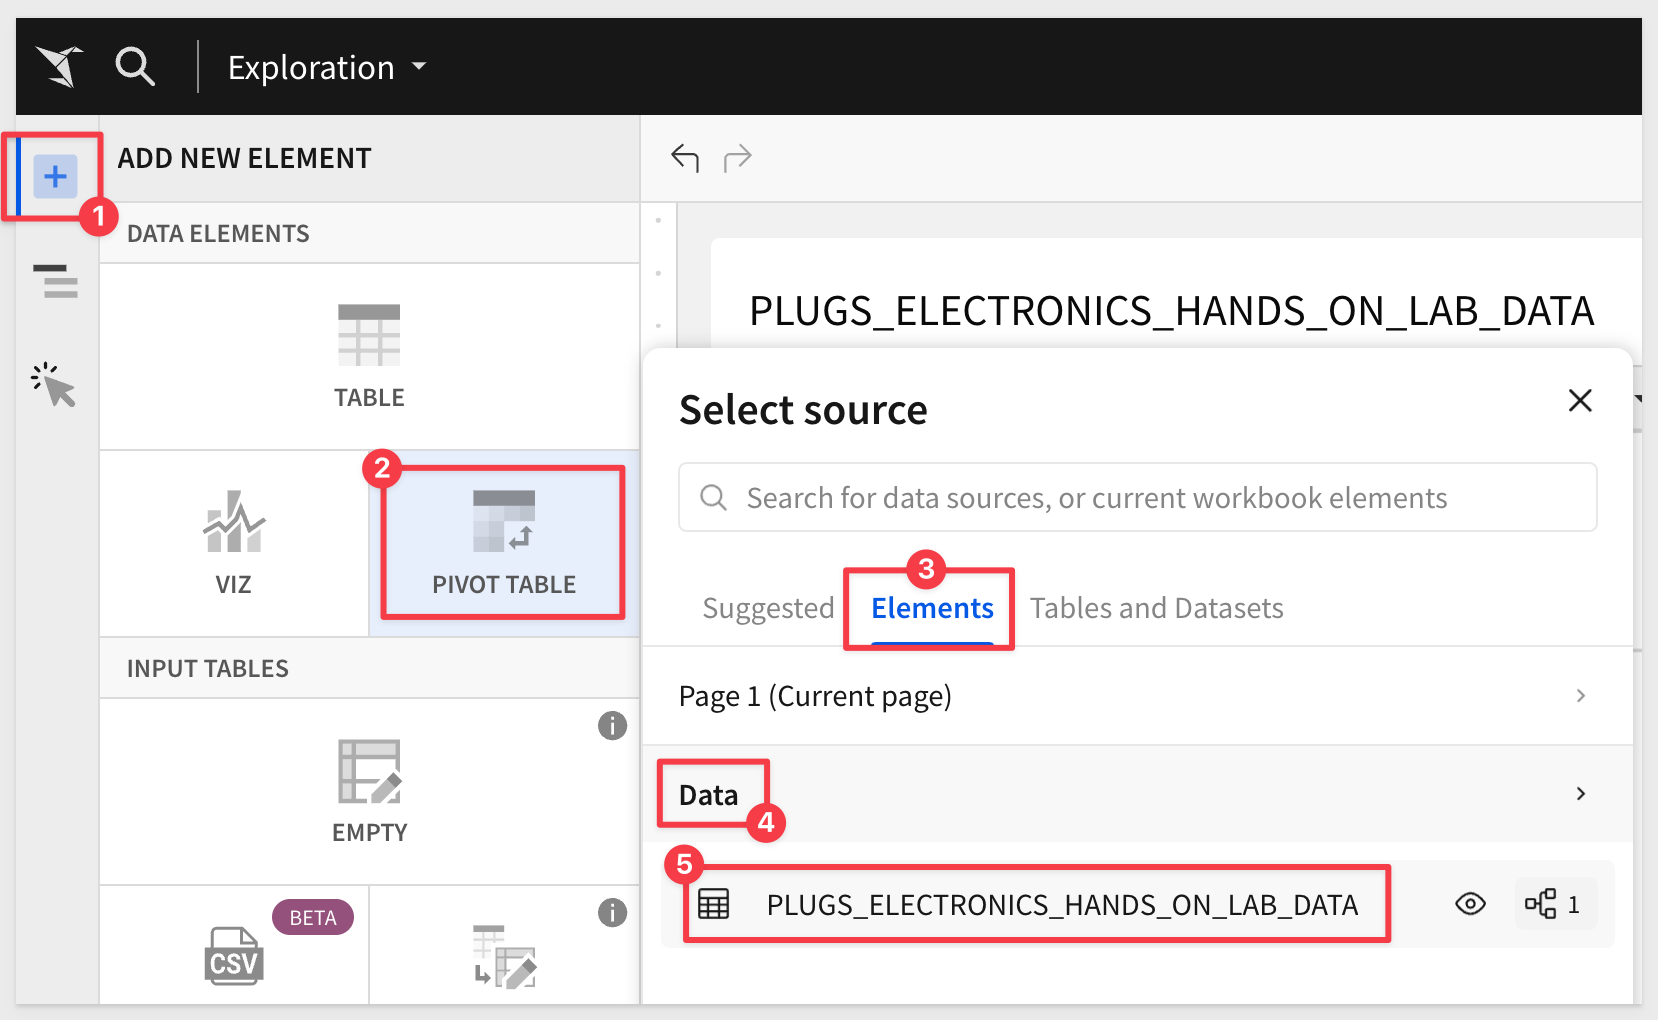
Click Table.
Type Plugs into the Select source search and click the PLUGS_ELECTRONICS_HANDS_ON_LAB_DATA:
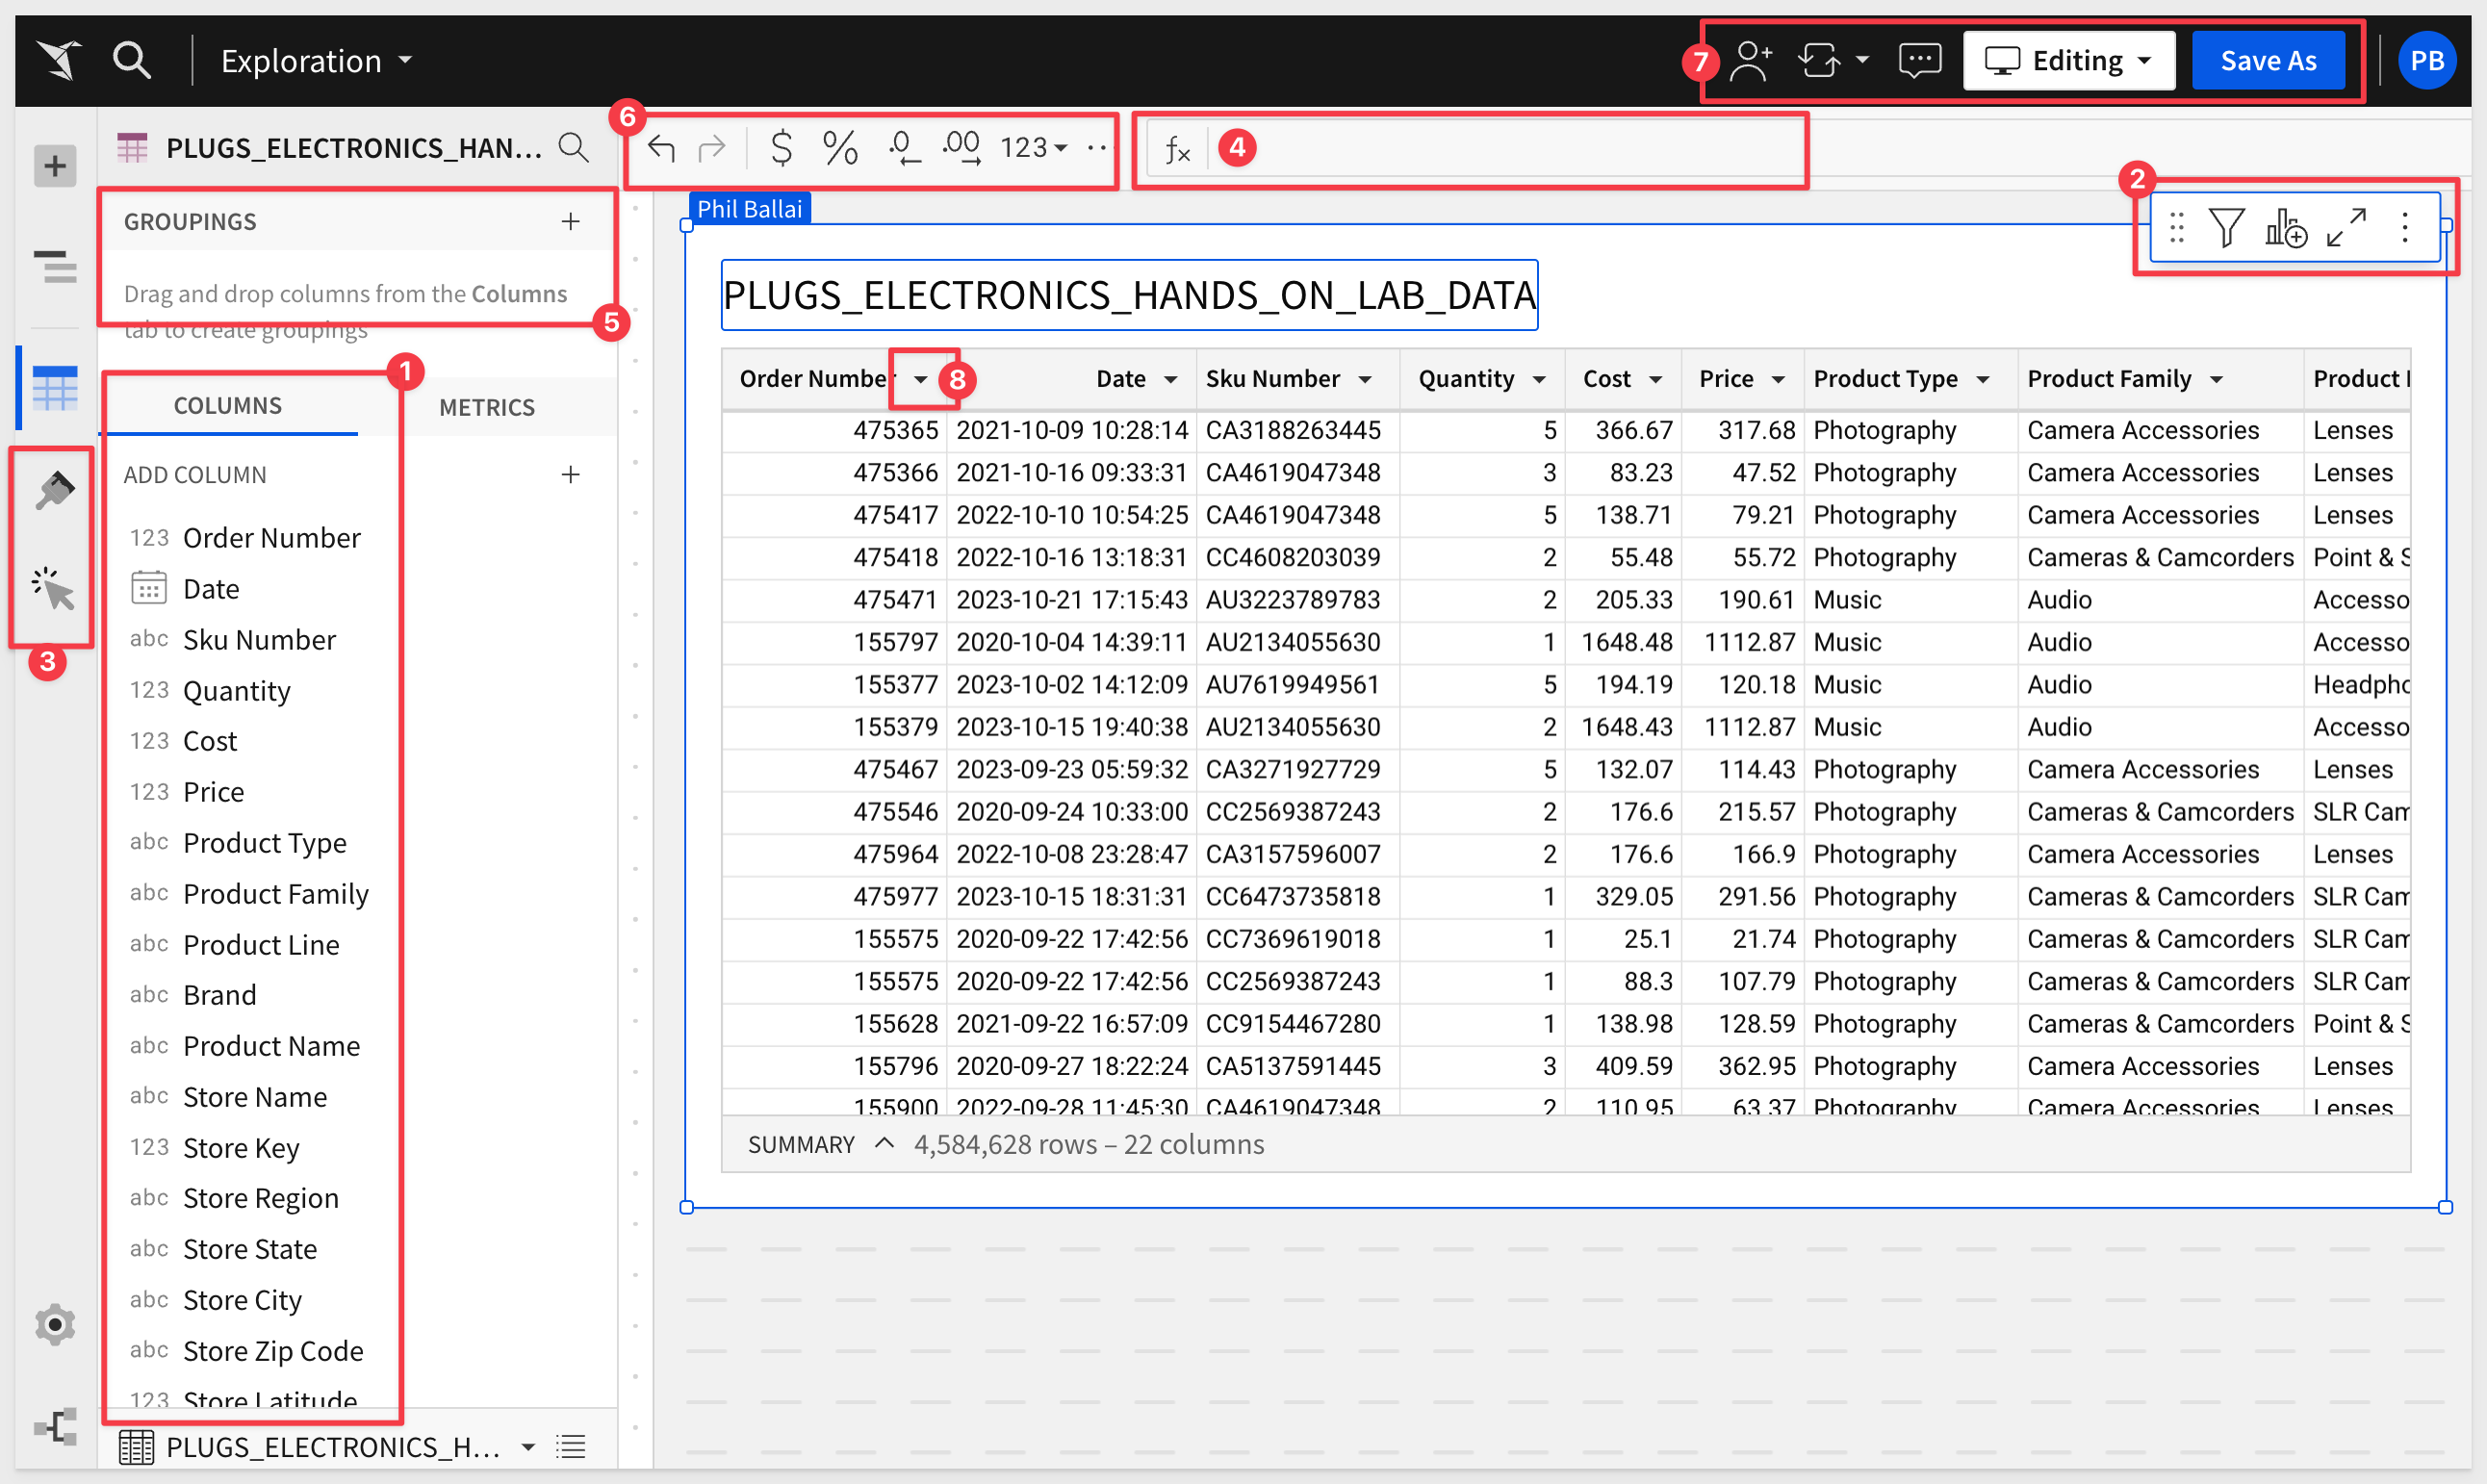
The new workbook opens with the PLUGS_ELECTRONICS_HANDS_ON_LAB_DATA tables added to it.
Notice that the workbook is not yet saved and is open in Edit mode so that we can modify it as needed.
In the image below, we have highlighted areas of functionality that are most often used and frankly, they are pretty self-explanatory.
Click on any of them to discover what they do and additional content menus.
Simple things like drag and dropping columns for reordering can be done on either the table, or the COLUMNS listing in the sidebar.
There is a TON of functionality in this simple interface, and we won't cover much of it now, but definitely explore. If you make some change you don't like, click the back arrow (numbered item 8) to undo the last action(s).
Let's use this table as the basis for other content.
Rename the Page to Data and click the + to add a new page:
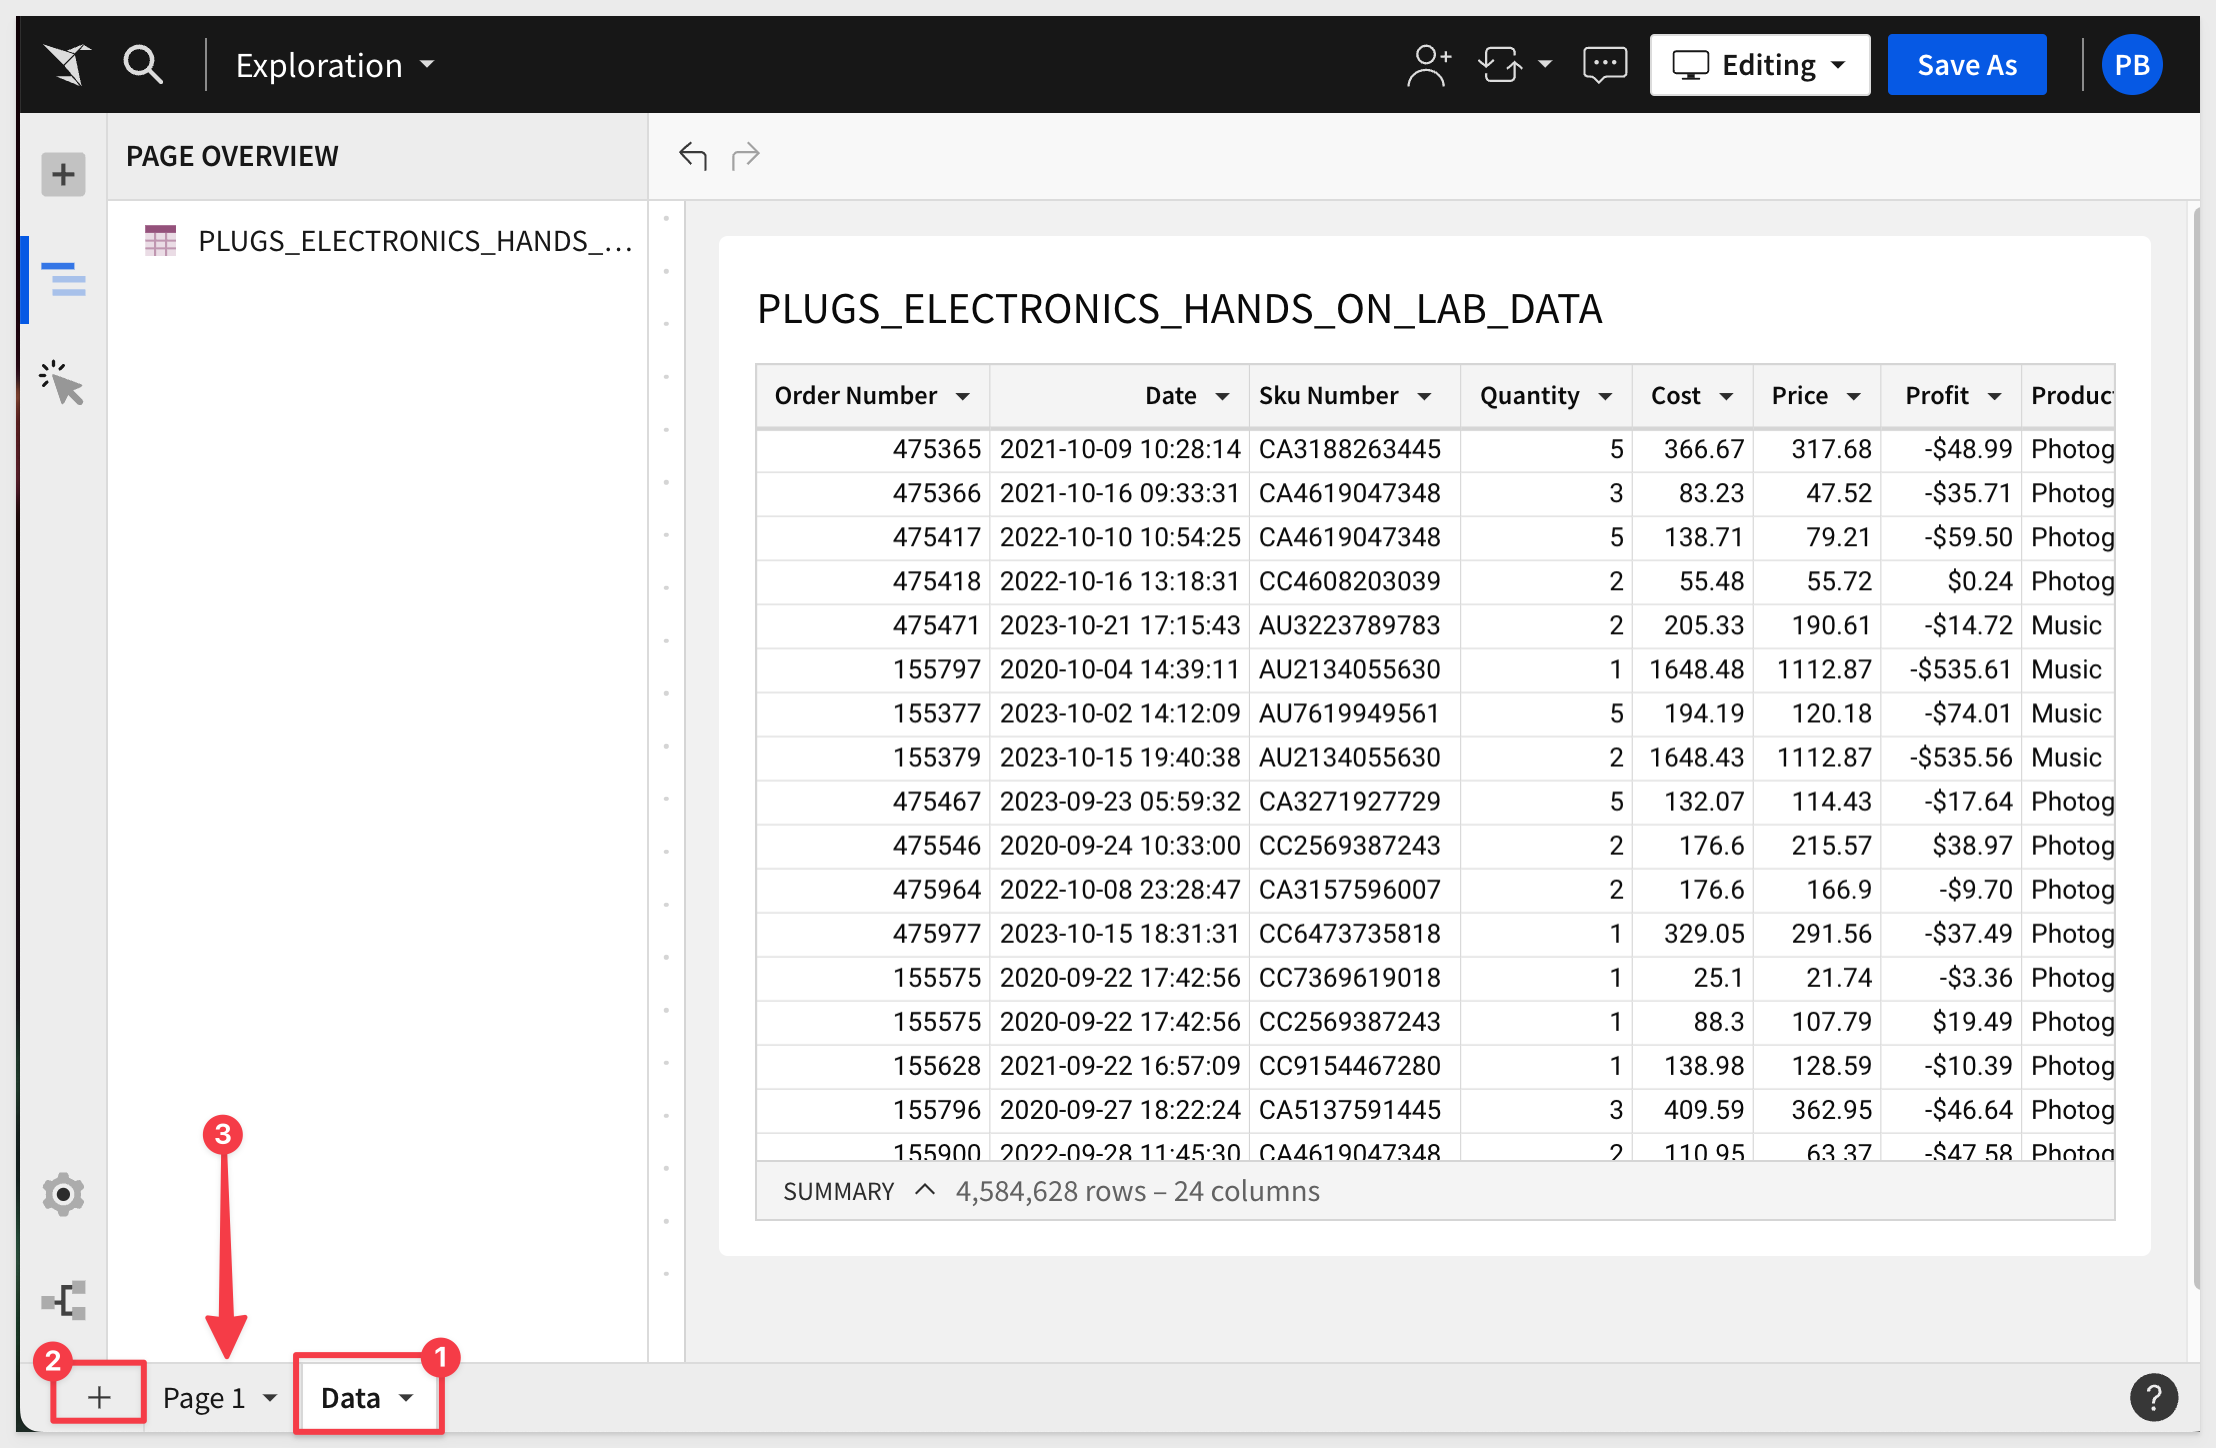
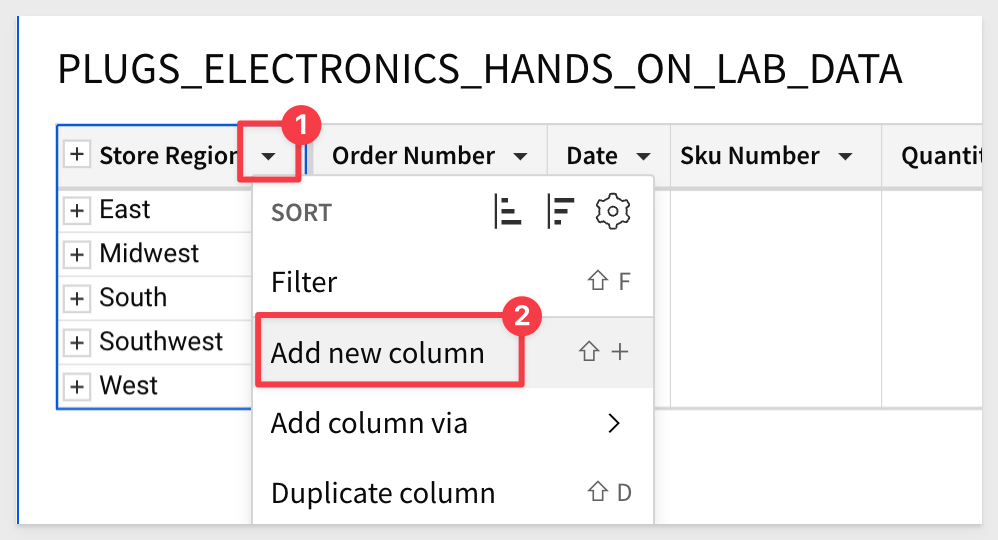
Add a column
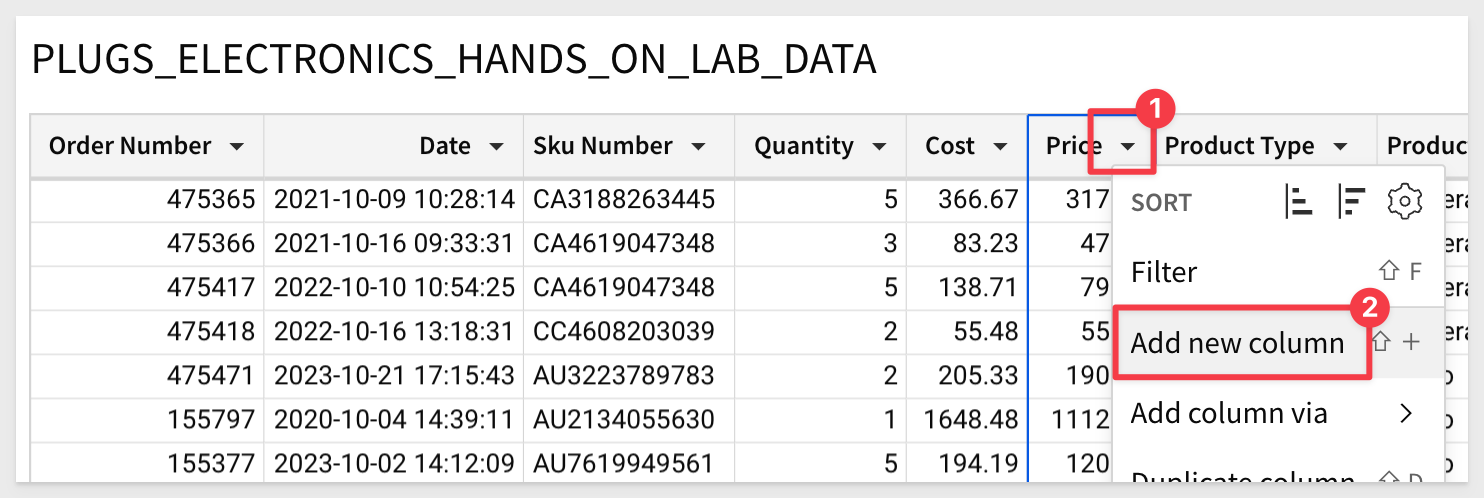
Click the Price column's down-arrow and select Add new column:
In the Function bar, type the formula:
Price-Cost
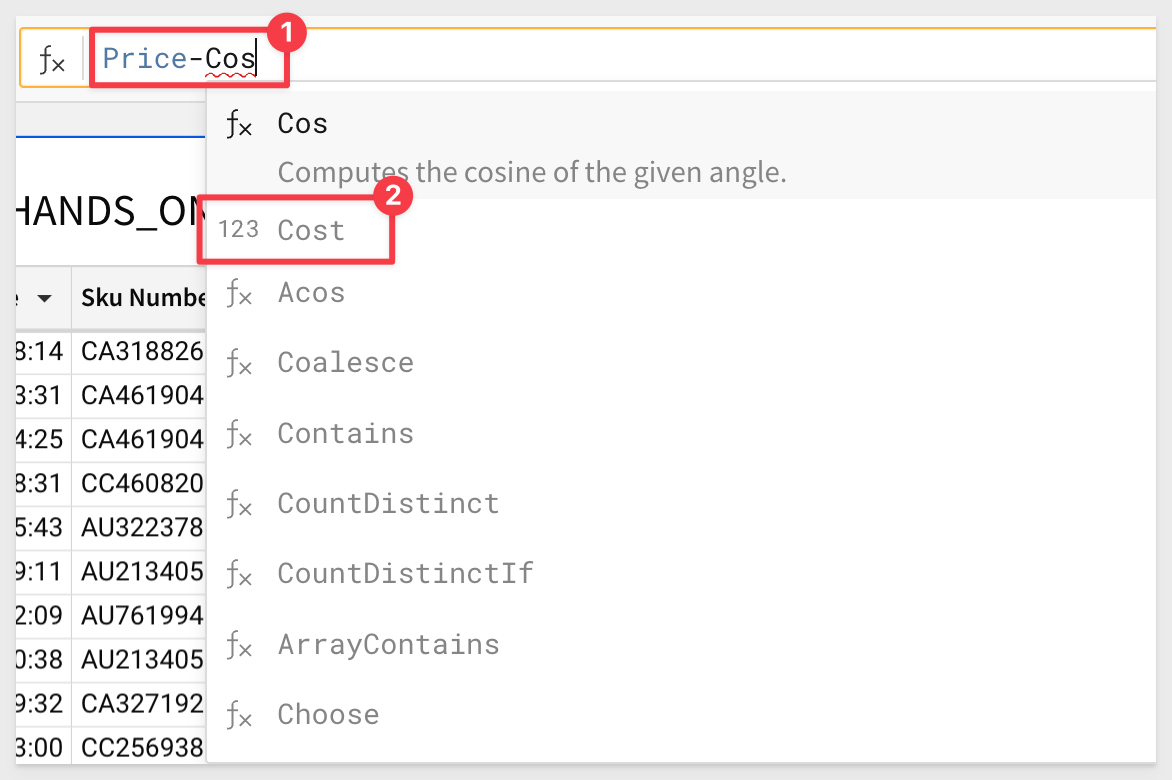
and hit Enter.
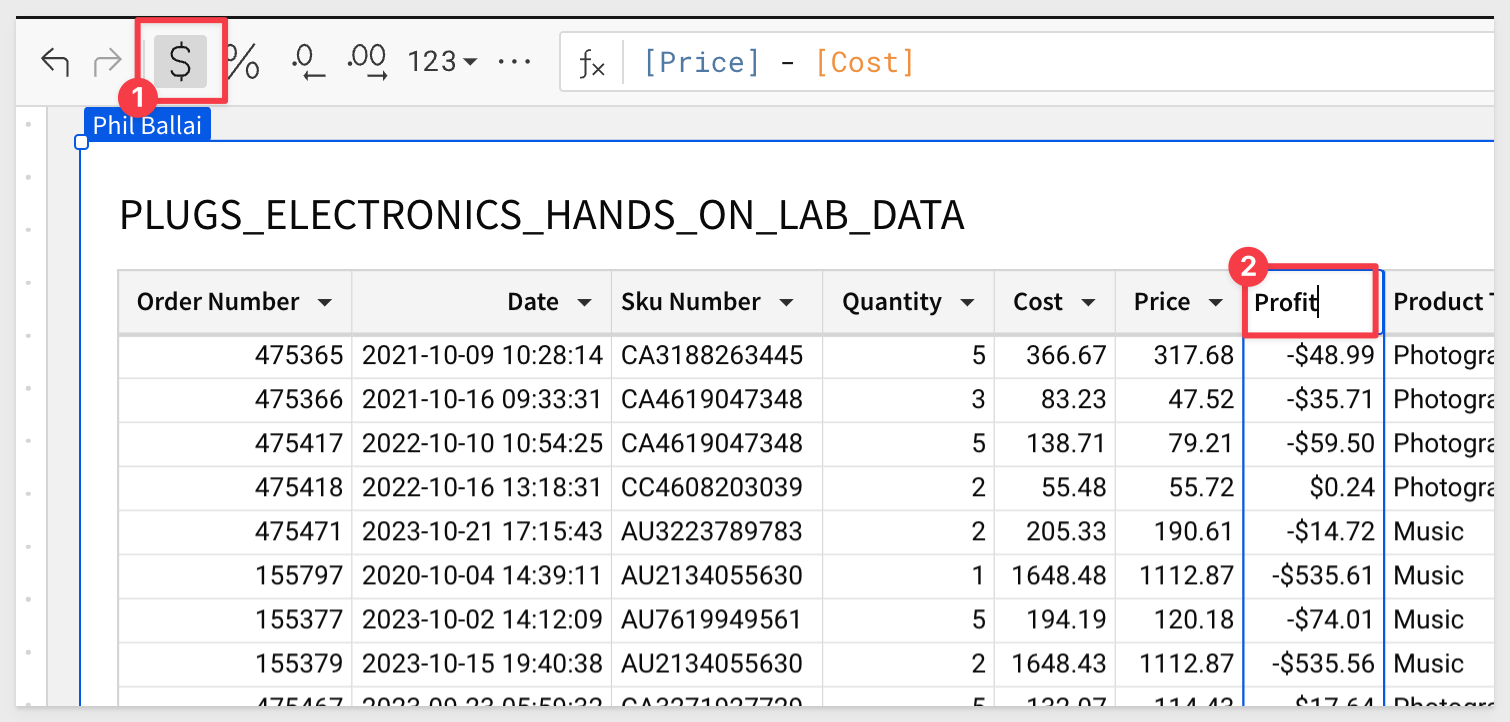
The new column is added, but we need to click to format the data in two decimal and currency:
Renaming columns is just a double-click on the name and type Profit:
Grouping
Click to the new page and create a new table, but this time, we will base it off the table that is on the Data page instead of getting it from the warehouse:
Maybe we want to group the data by Region. Simply drag the Store Region column (in the element panel) to the GROUPINGS section:
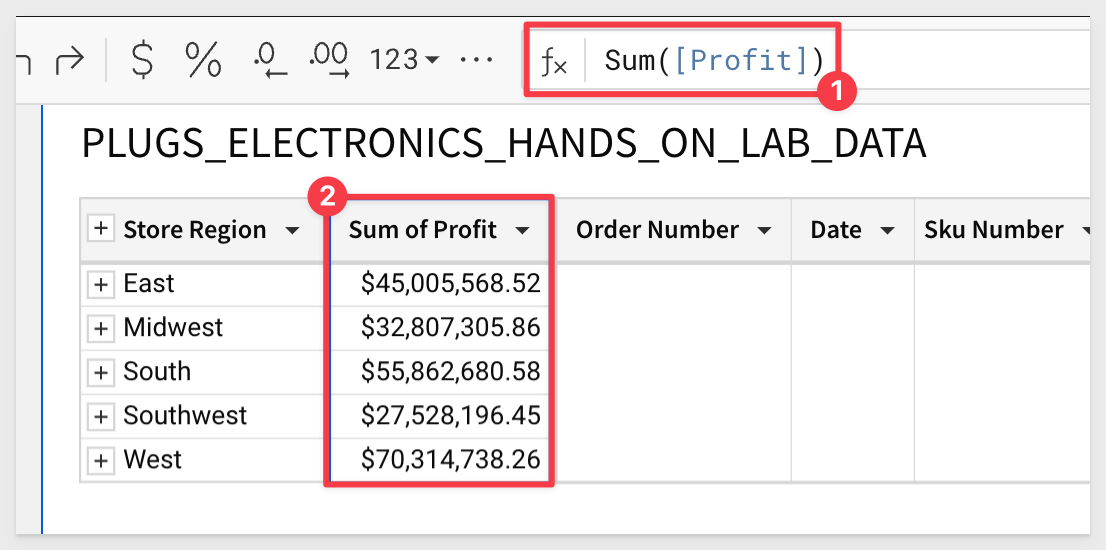
Add a new column as before, but this time, click on the Store Region column and use the formula:
sum(Profit)
Now we have profit for each region:
Visualization
Let's add a bar chart:
Sigma supports all the common chart types and you can read more about that here.
Pivot Table
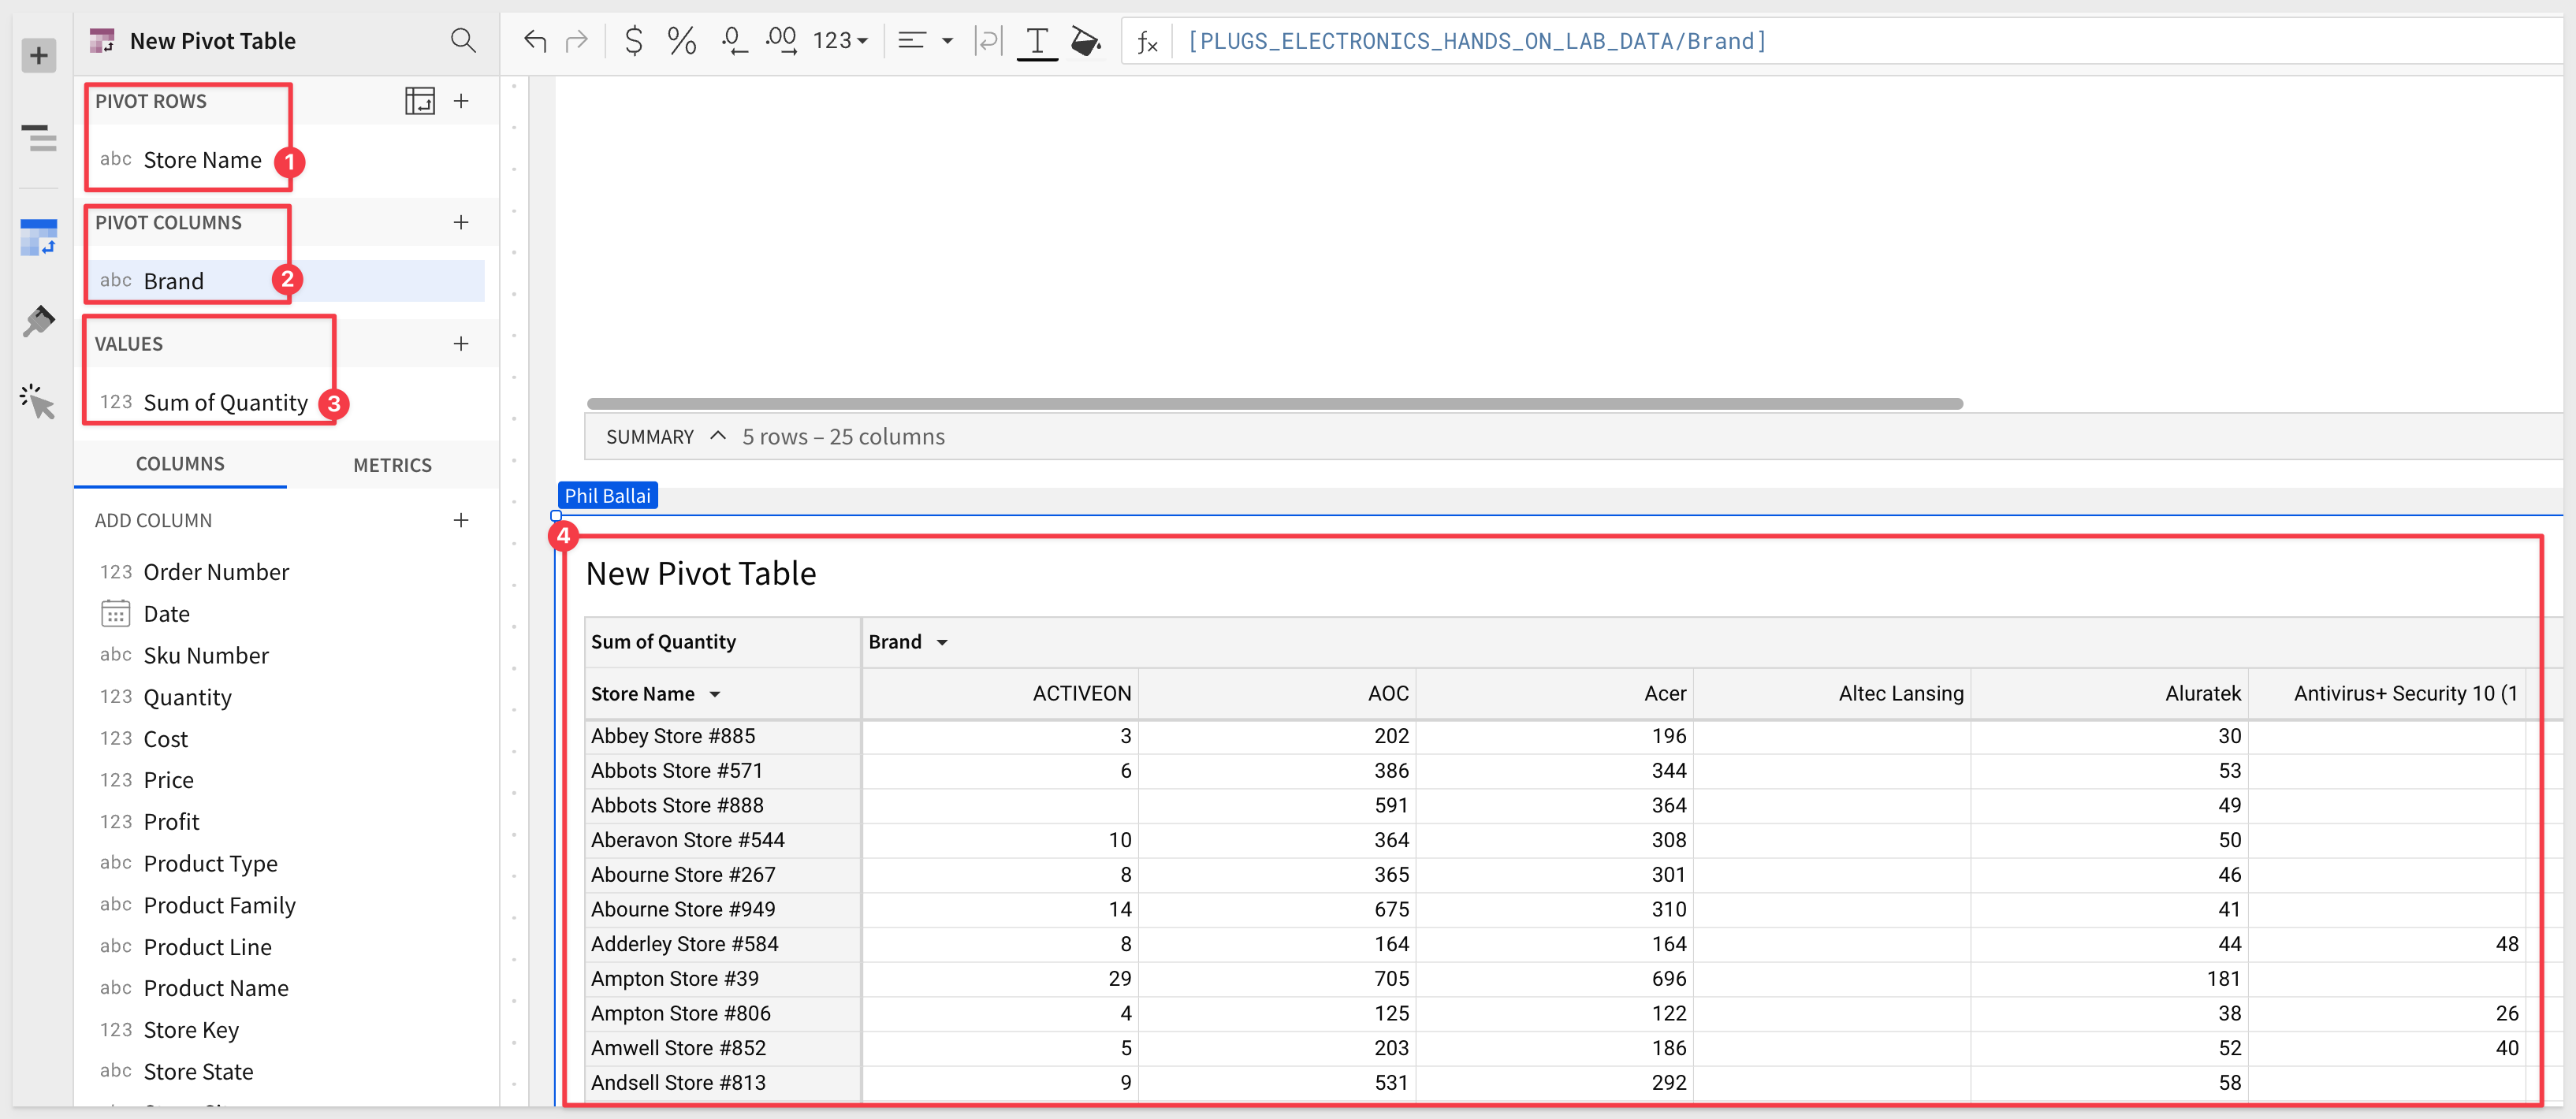
This time, let's add a new Pivot Table and base it off our table in the Data page as before:
Configuring the new pivot is not much different that we have already done with groupings, using drag and drop to select columns.
We can easily get the count of items sold for each brand by using these columns:
Click the Save As button and give your workbook a useful name.
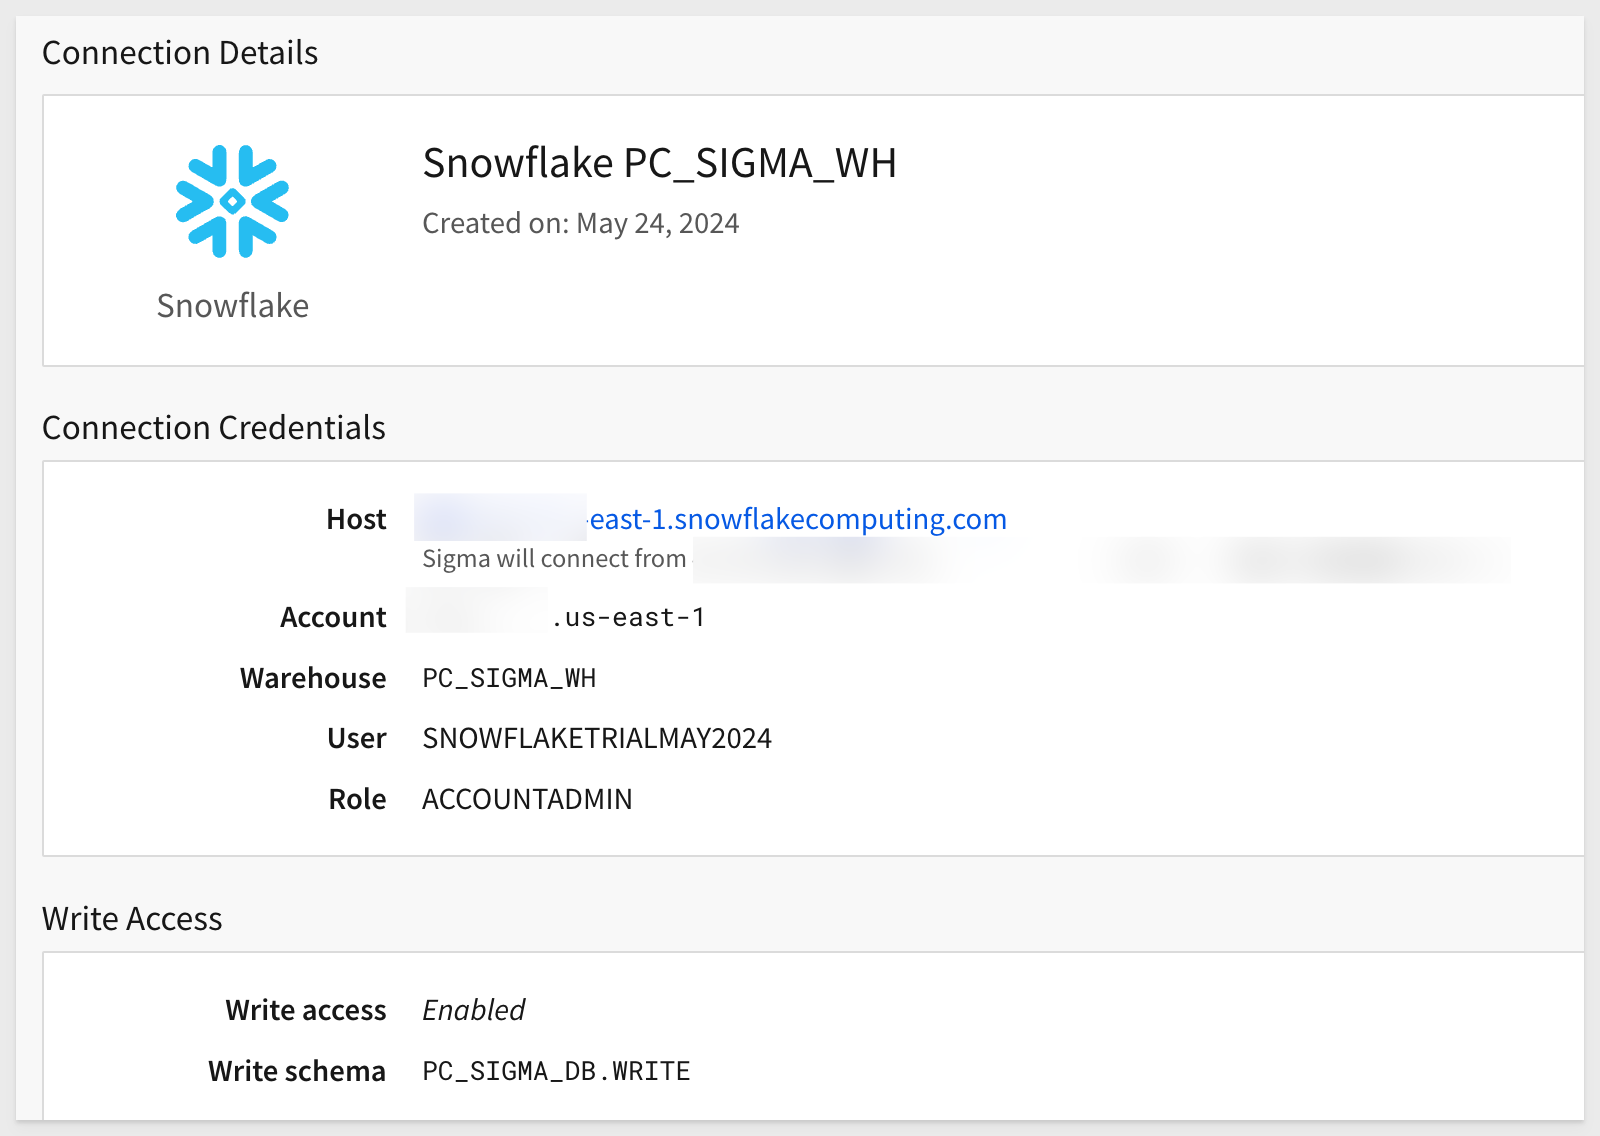
Earlier on in this QuickStart we covered setting up write access to Snowflake.
We now can configure Sigma's connection to Snowflake to use that configuration.
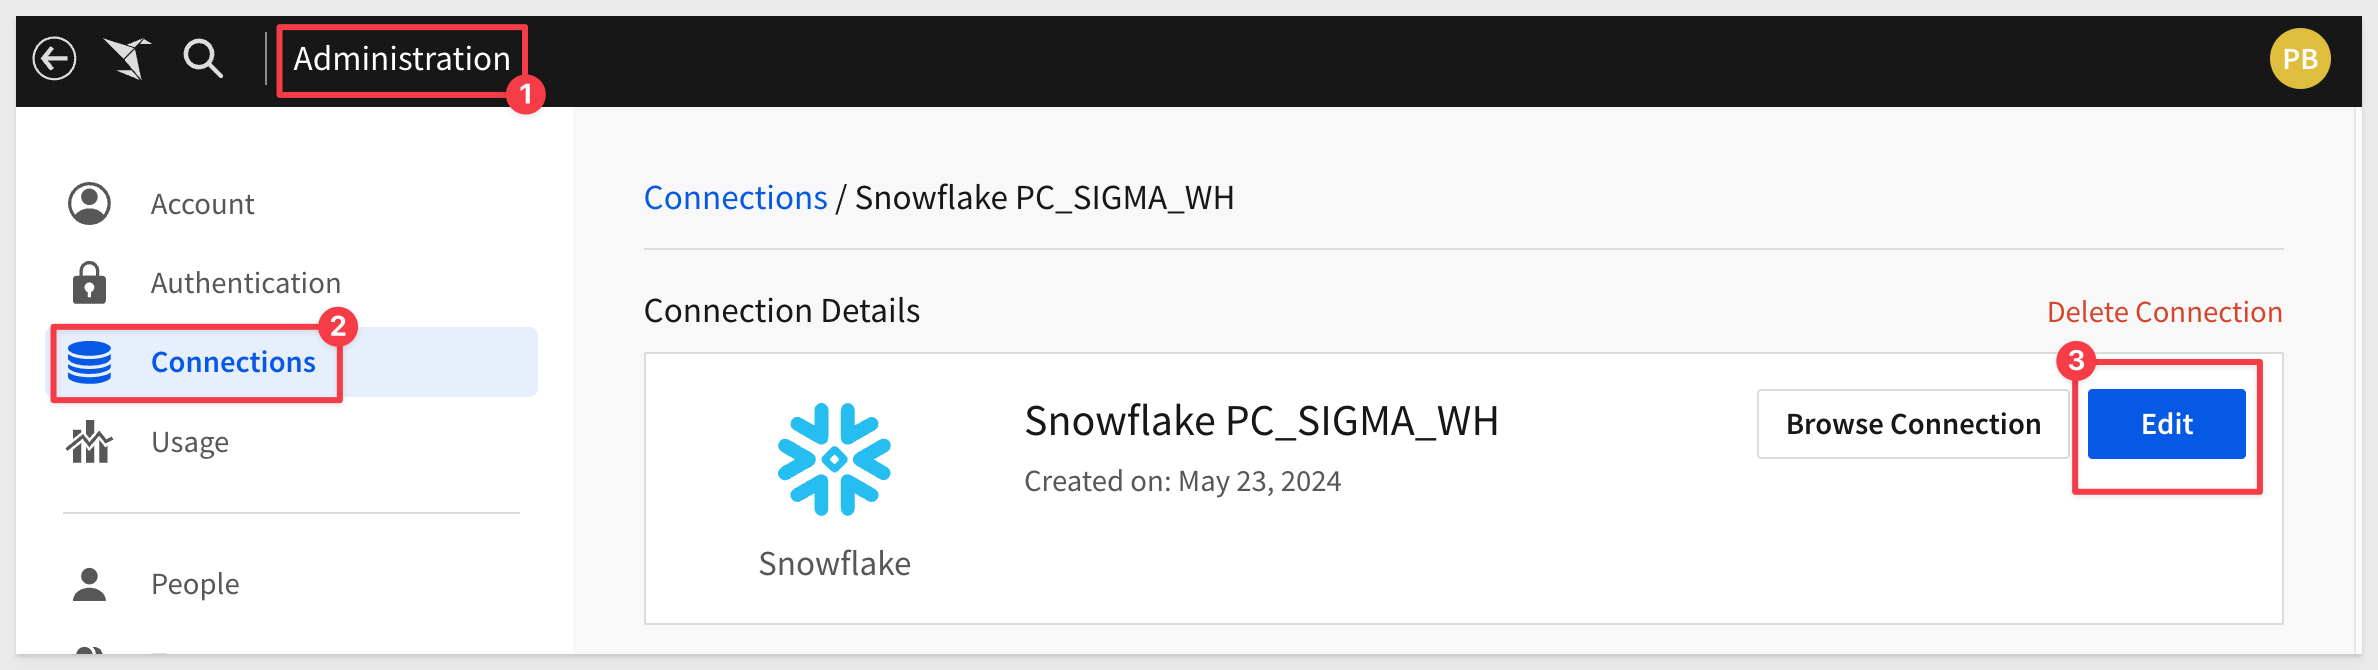
In Sigma, navigate to Administration > Connections and click the Edit button:
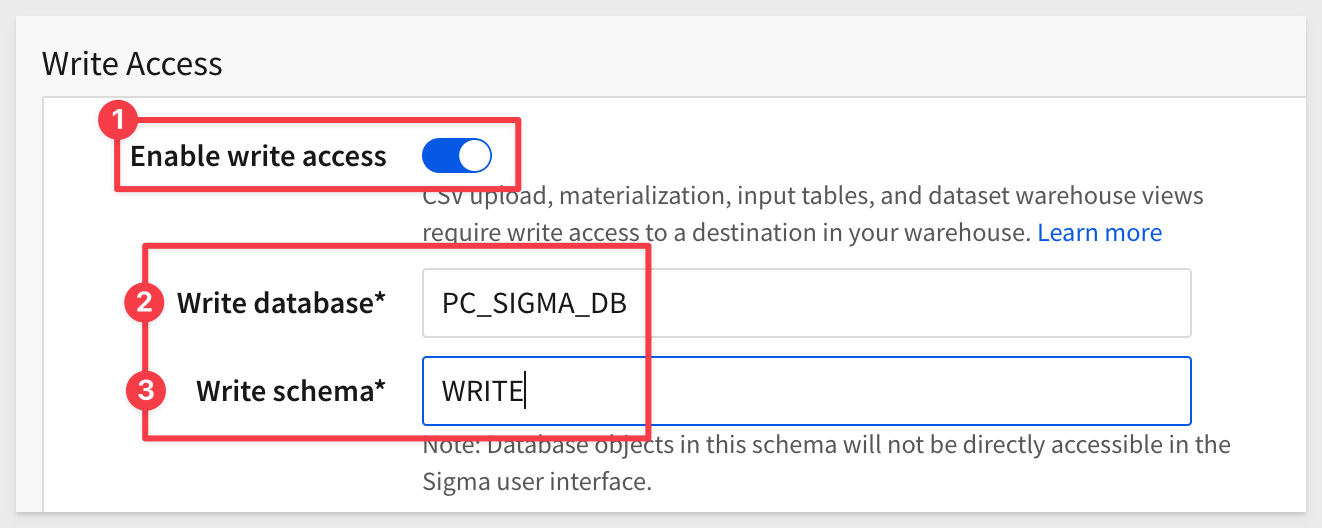
Scroll down to Write Access and enable it.
Add the values for Write database and Write schema as shown:
Enter your password that you use to login into your Snowflake trial account.
Click the Save button in the upper right corner.
If everything is correct, the page will return with no errors and your will see Write access in enabled:
Now that you have had some time wih Sigma, lets press that knowledge forward further while we also learn the power of Input Tables.
Forecast Adjustment
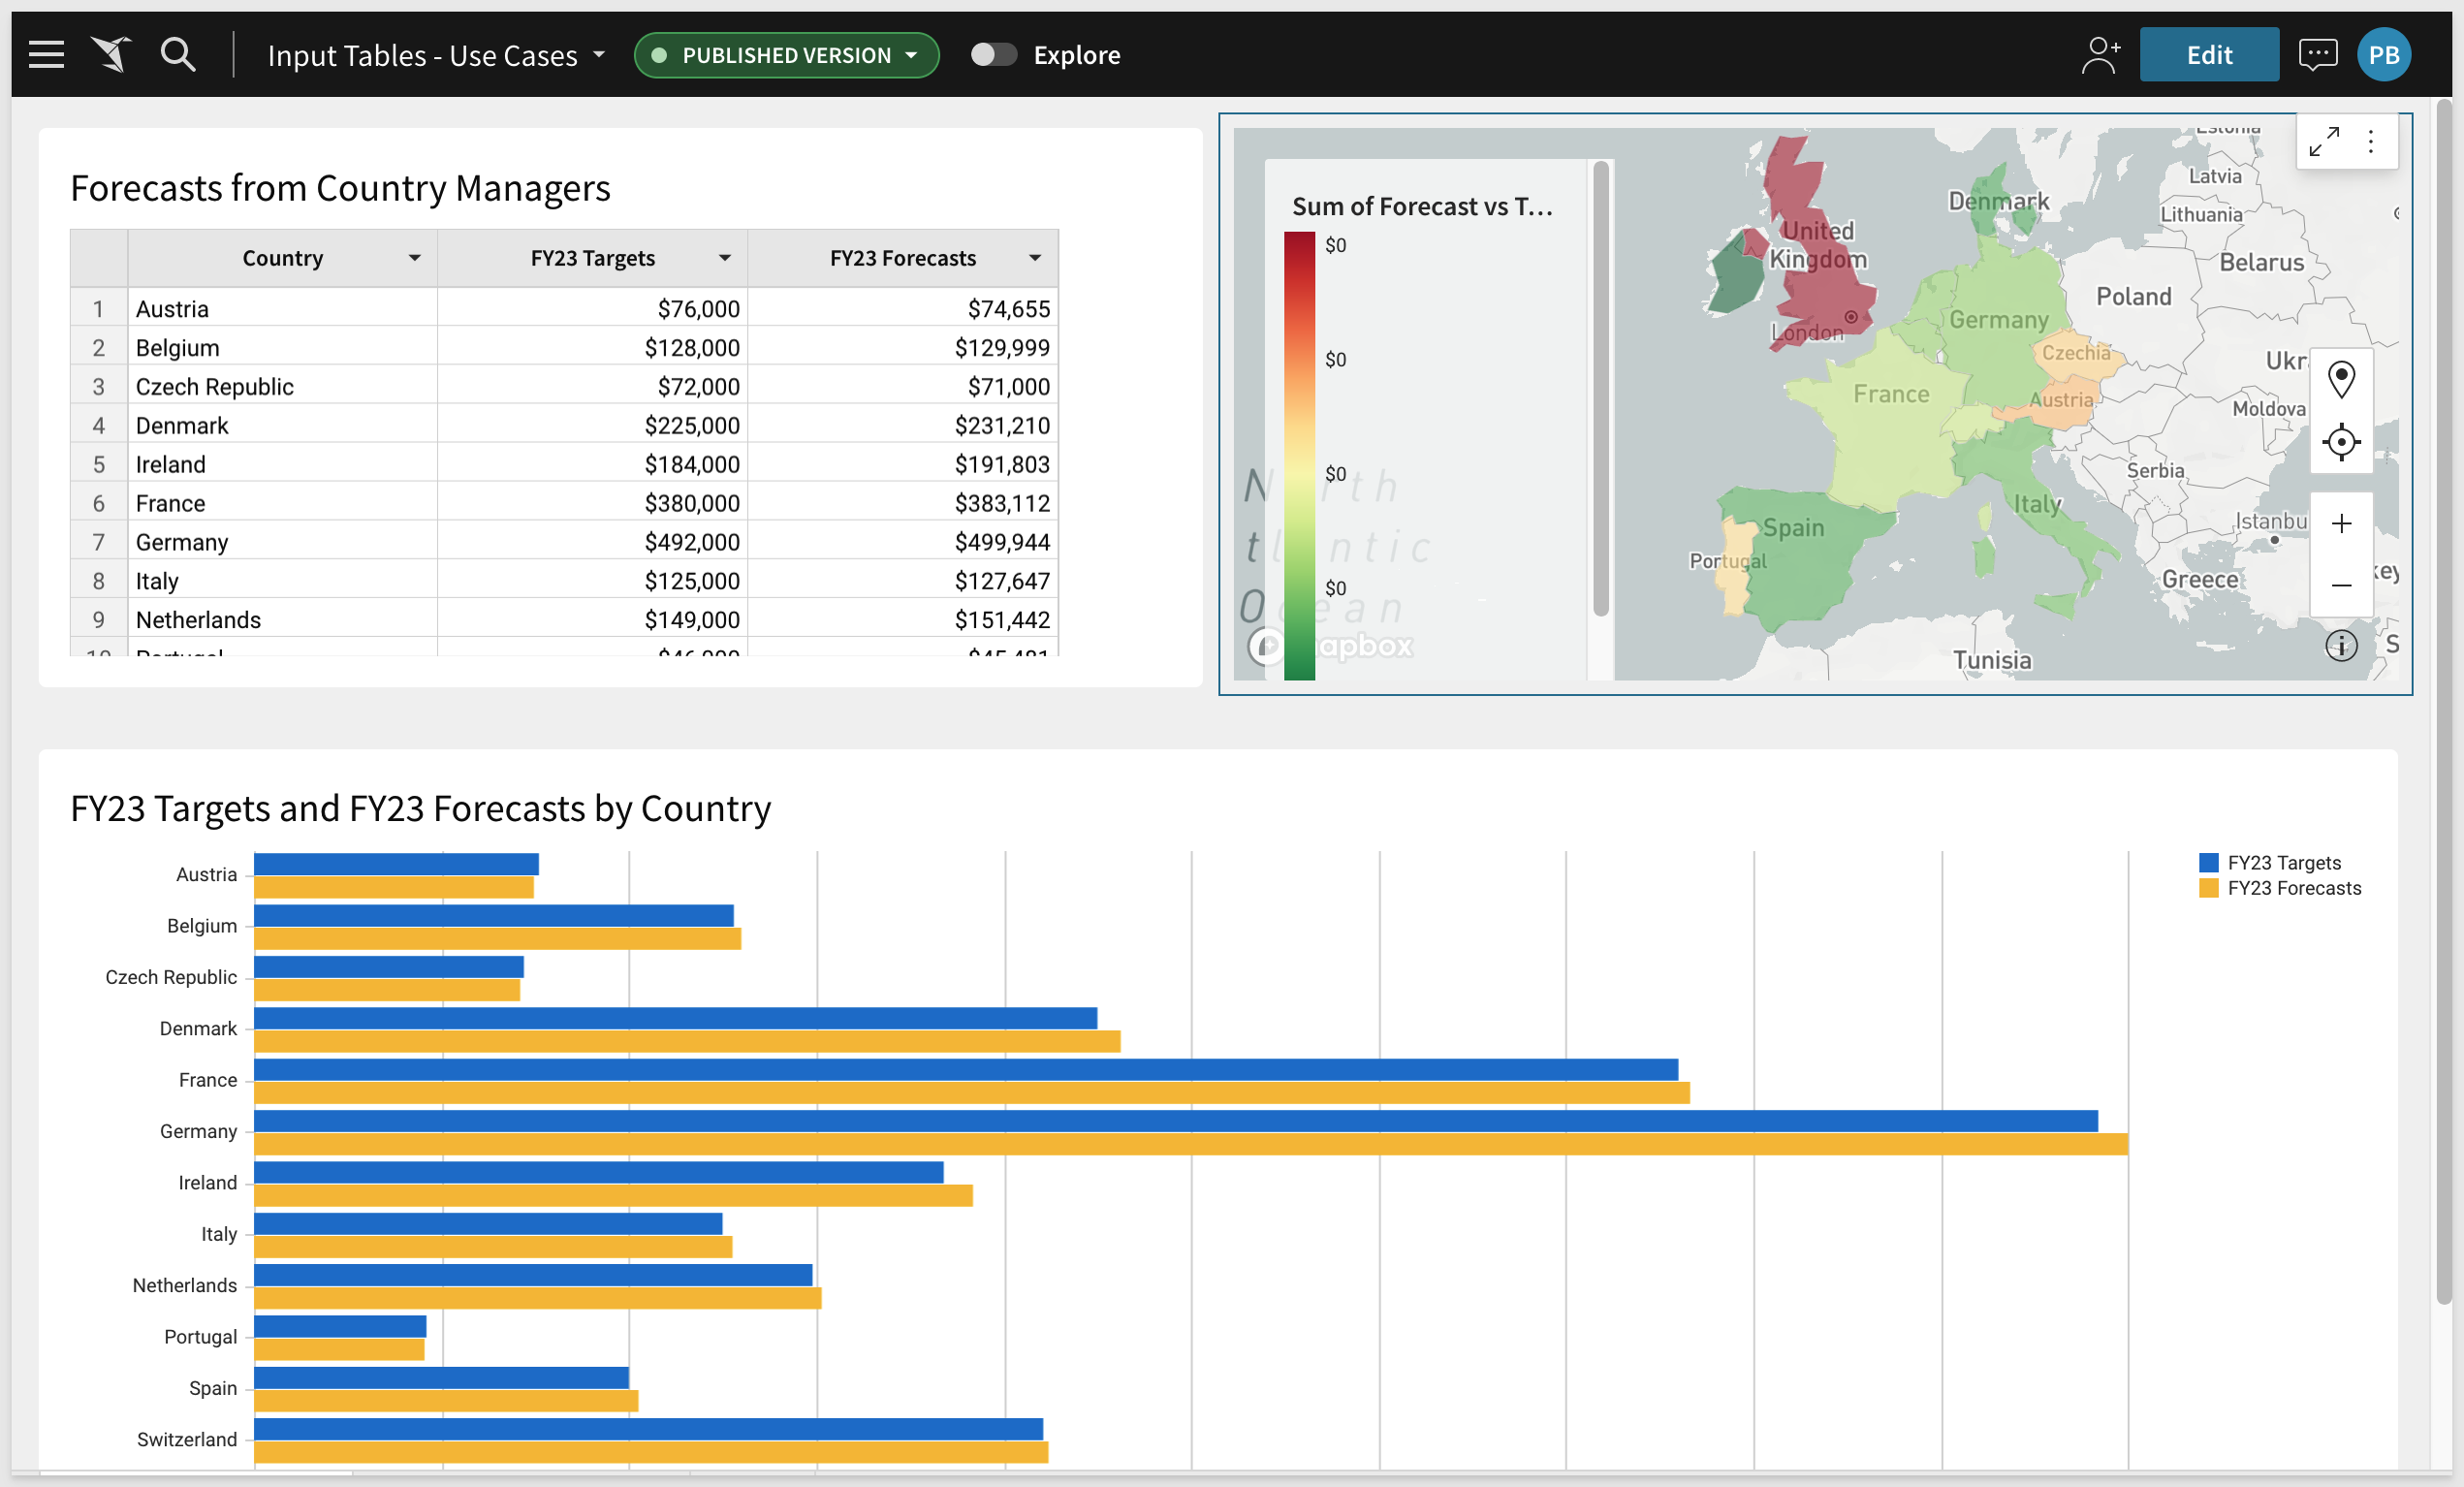
In this use-case, Paula, the VP of EMEA sales, is running her End-of-Year forecast call where her country managers each call out the final numbers for the year.
She enters these into an Input Table which already has the targets for the year.
A map visualizes which countries are way off their targets.
She's also planning out the next year and adds growth numbers for each country.
This gets combined with a parameter that adjusts for inflation to show FY 23 vs 24 on a bar chart.
The final version looks like this:
How to build it:
Open Sigma and create a new Workbook.
Click Save As and name of the Workbook to Input Table Use Cases.
Rename the default Page 1 to Forecast Adjustment.
Open the downloaded file in Excel (or Google Sheets). There should be 3 columns and 13 rows.
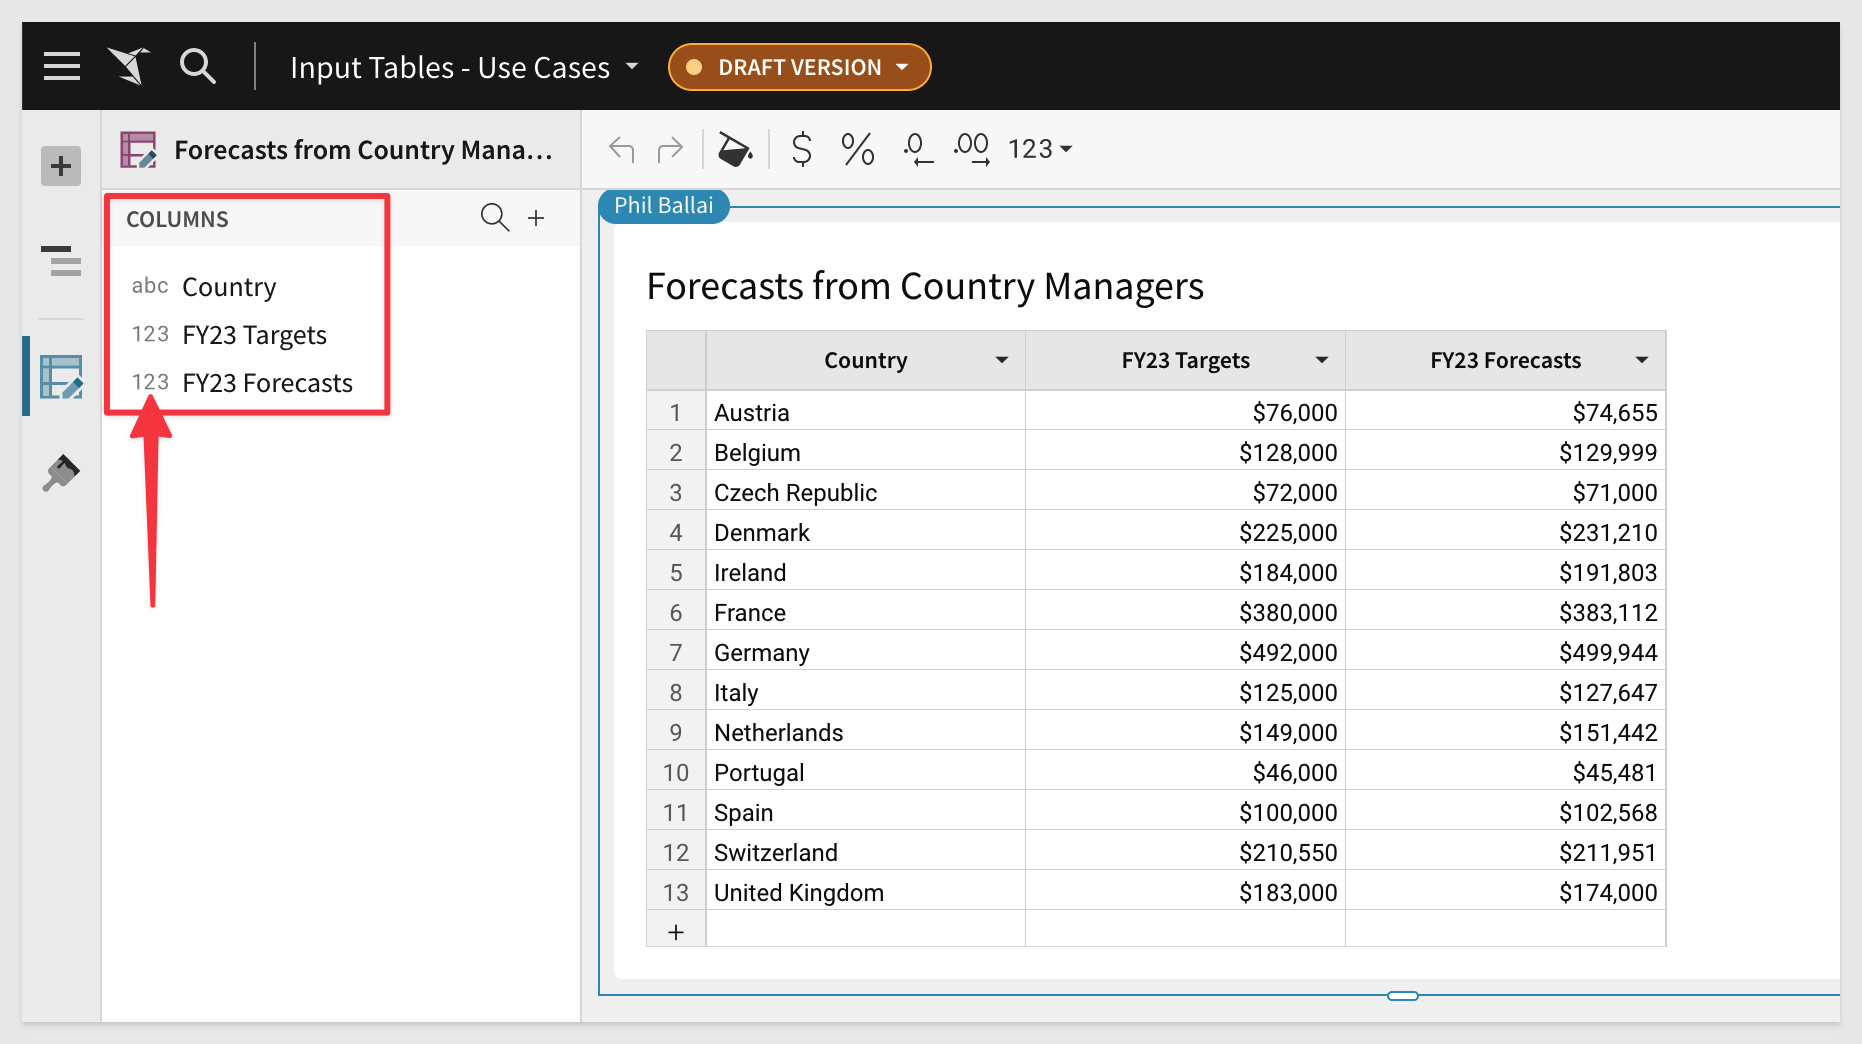
Click the + and Input Table > EMPTY to the Page and rename it Forecasts from Country Managers.
Copy all rows and columns from the downloaded Excel file and paste them into the new Input Table.
Notice that Sigma automatically identified the data types for you, saving time.
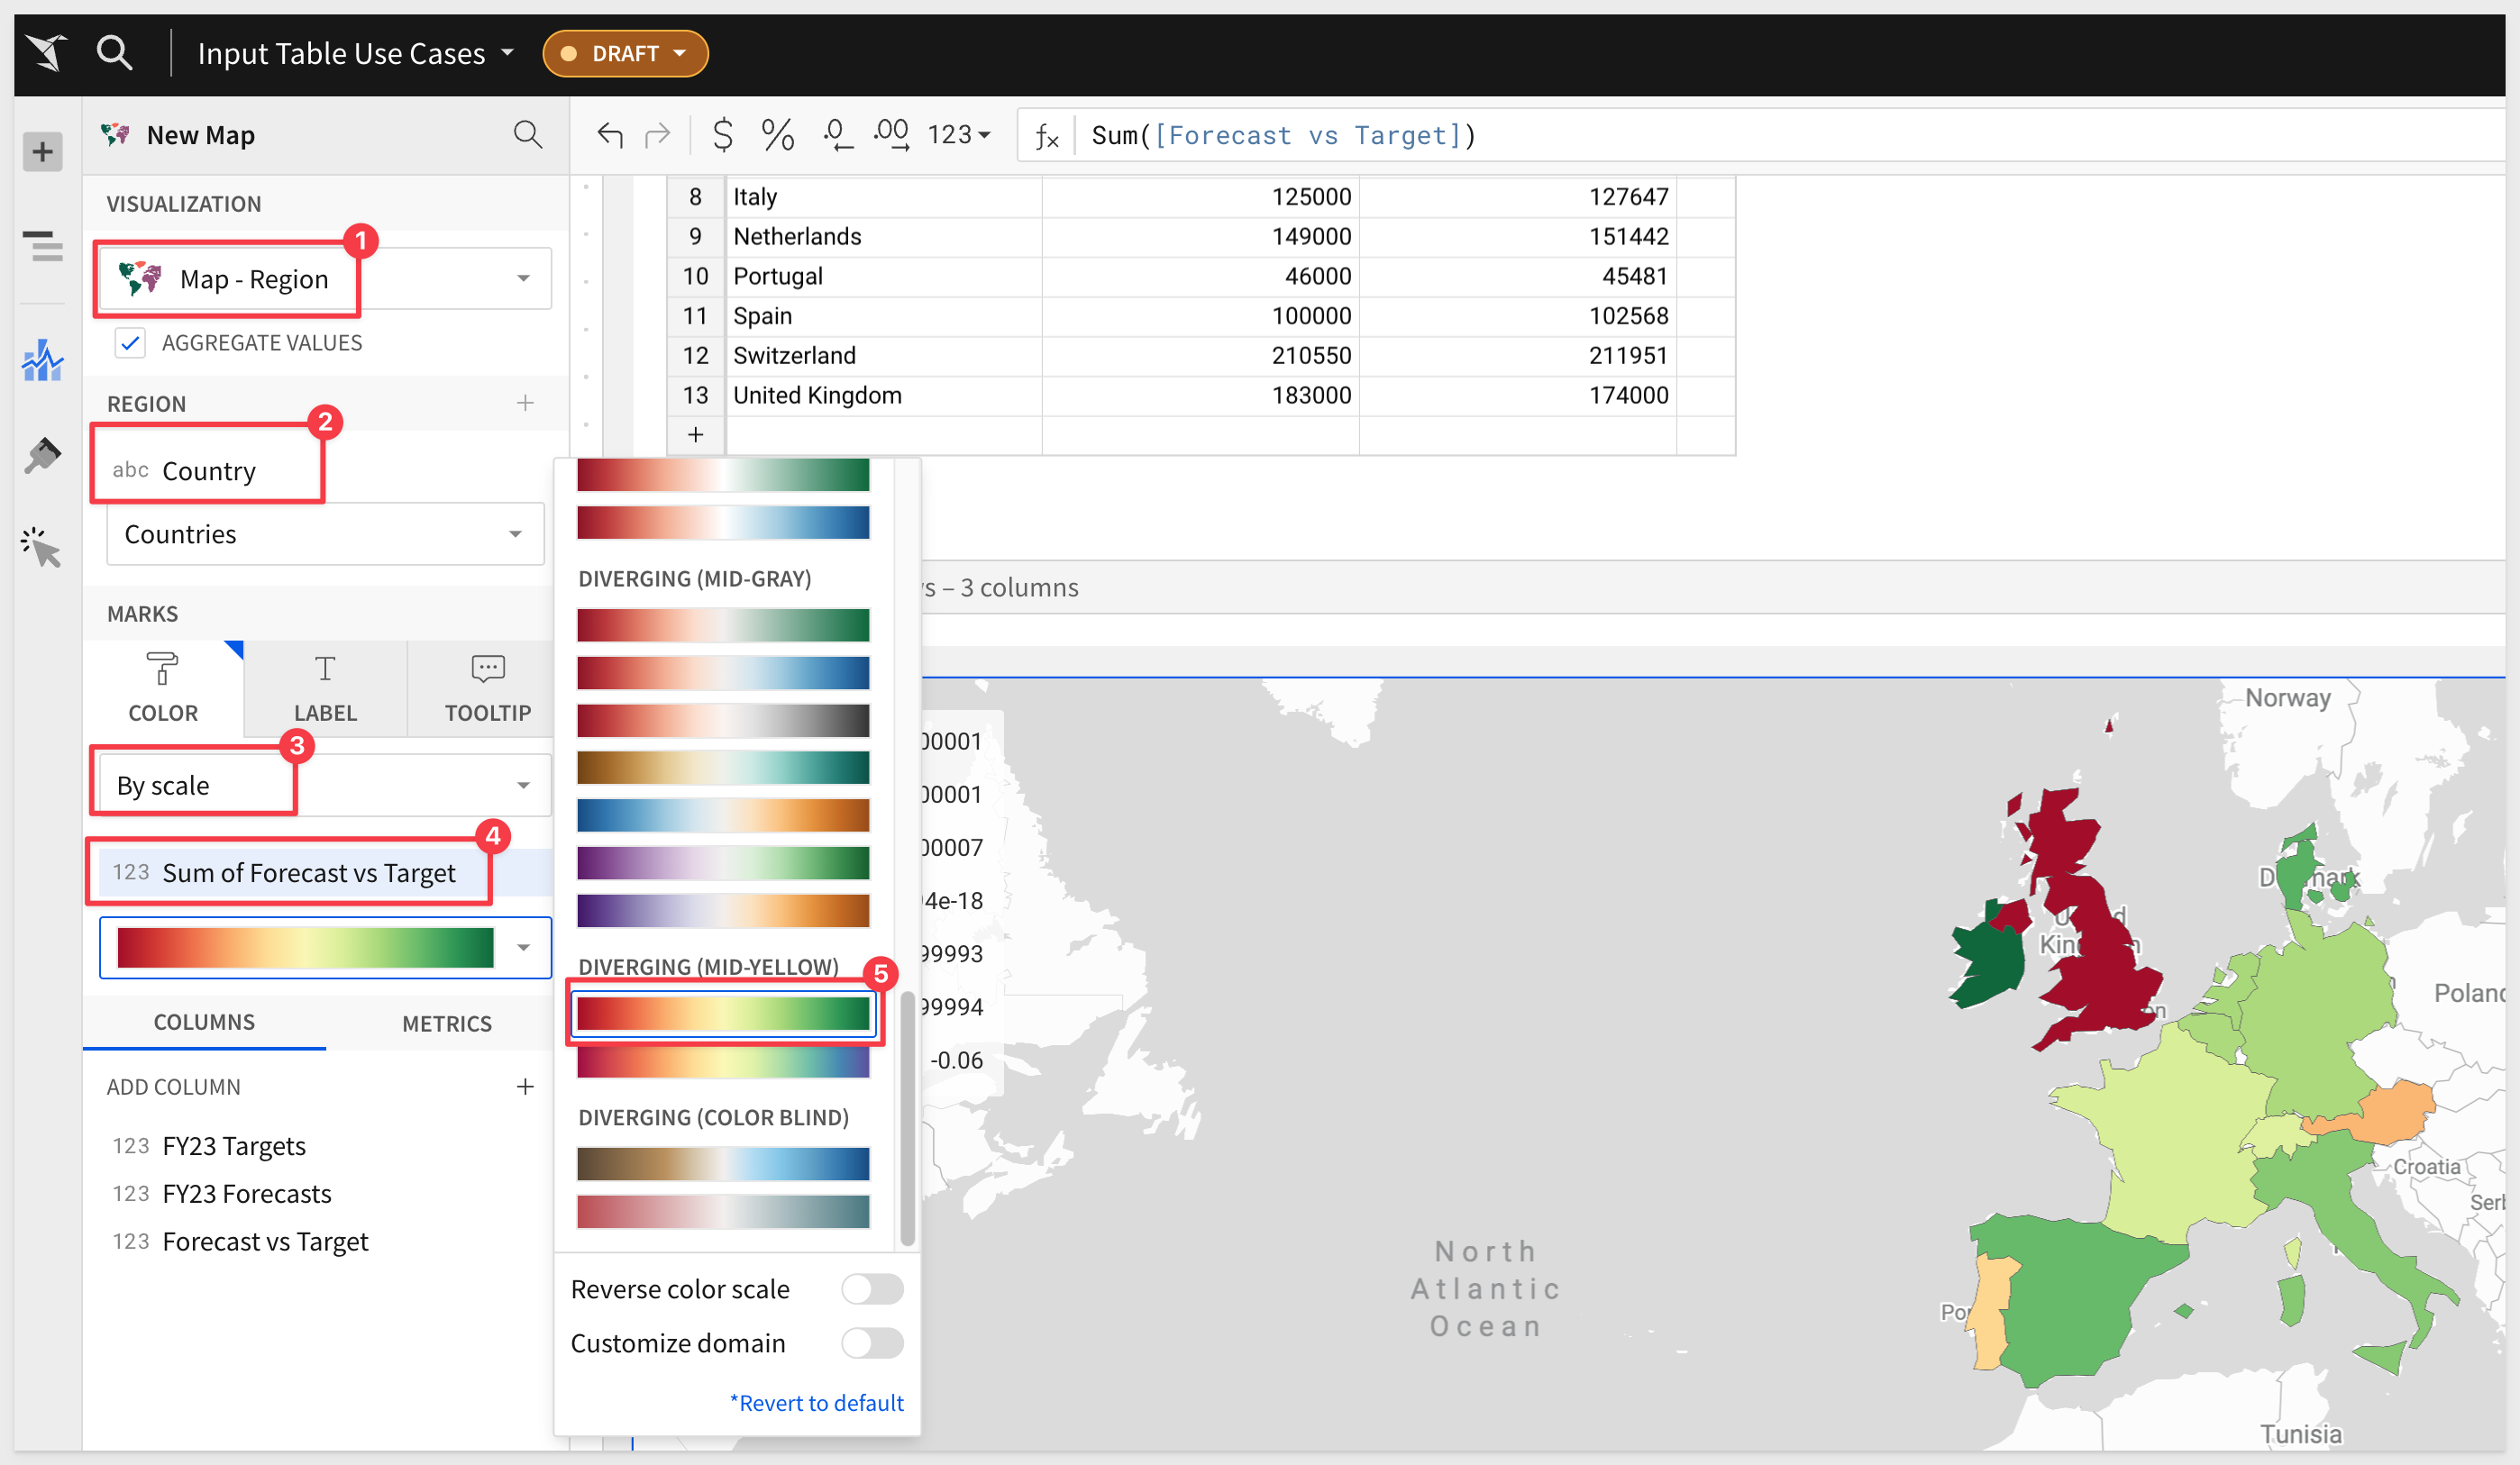
Add a new Visualization to the Page, use the Input Table as it data source, set it to Map - Region and drag the Country column up the Regions.
We want this Map to show different colors for FY23 Targets vs FY23 Forecasts so we need to add a new Column to the data that represents this calculated value.
In the Element Panel / Columns click the + icon and select new column.
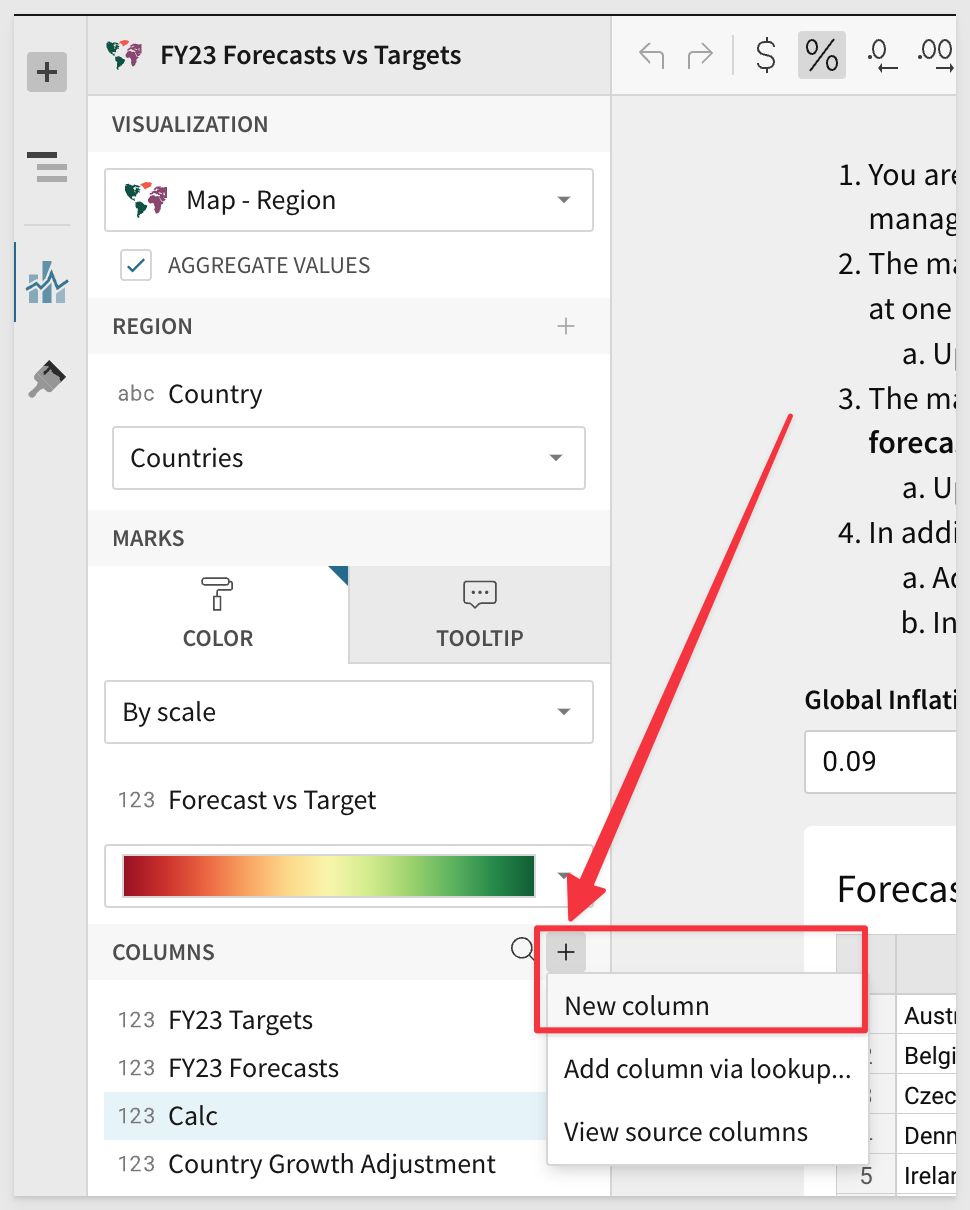
Set the formula for this column to:
([FY23 Forecasts] - [FY23 Targets]) / [FY23 Targets]
Rename the new column to Forecast vs Target.
Your map configuration should look like this now:
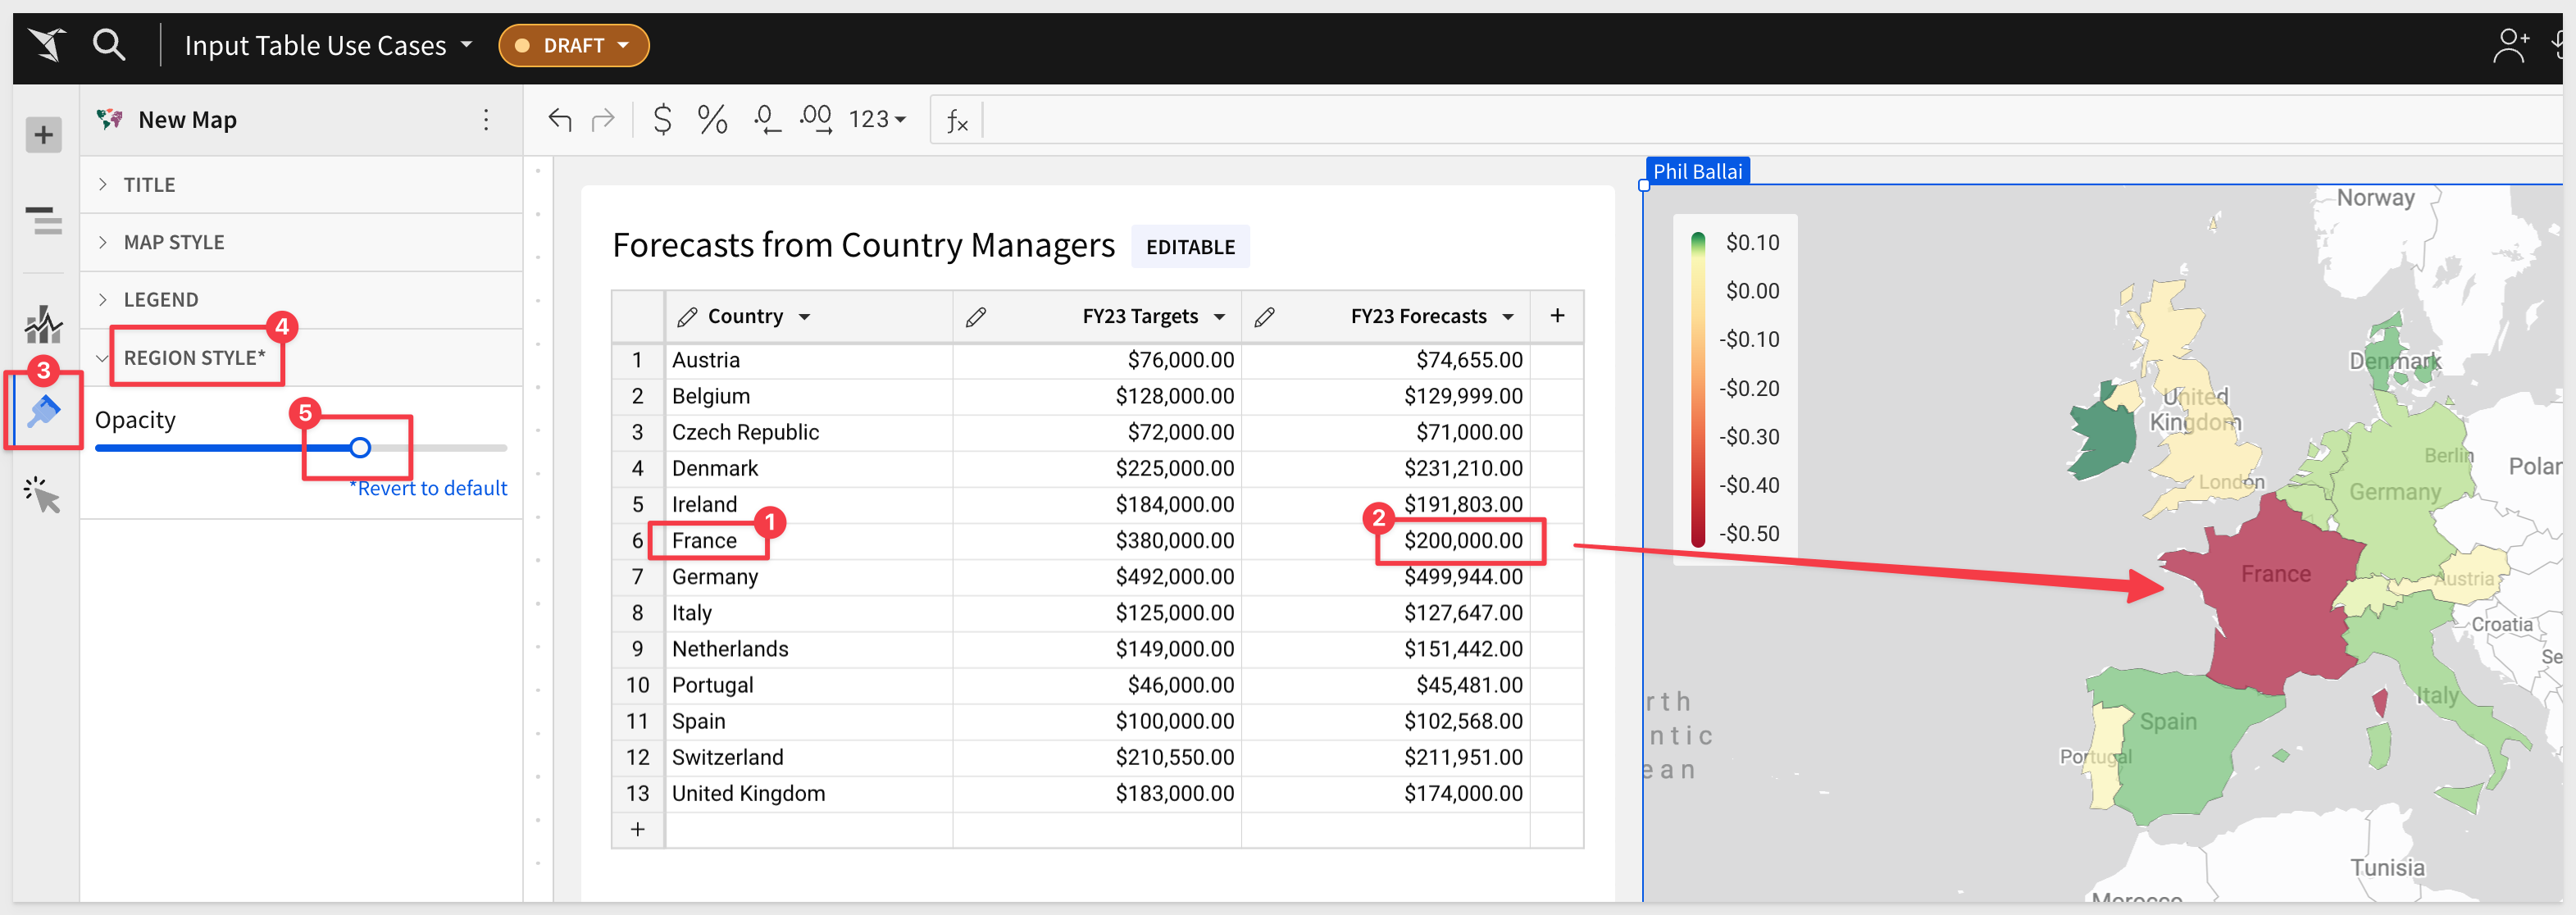
The manager in France tells you she's cutting her forecast down to $200k because there was a strike at one of the factories.
Update the input table and see the map change. Wait, we are not able to enter new values into the Input Table?
Edit the Workbook.
Now change the FY23 Forecast value for France down to $200K and hit Enter.
The Map changes automatically to reflect this revision.
Lower the map opacity as shown in the image below to reveal the country names:
This is just a simple example of what is possible with Sigma Input Tables.
If you are interested in seeing other user cases, see this QuickStart.
To learn more about Input Tables, see the documentation.
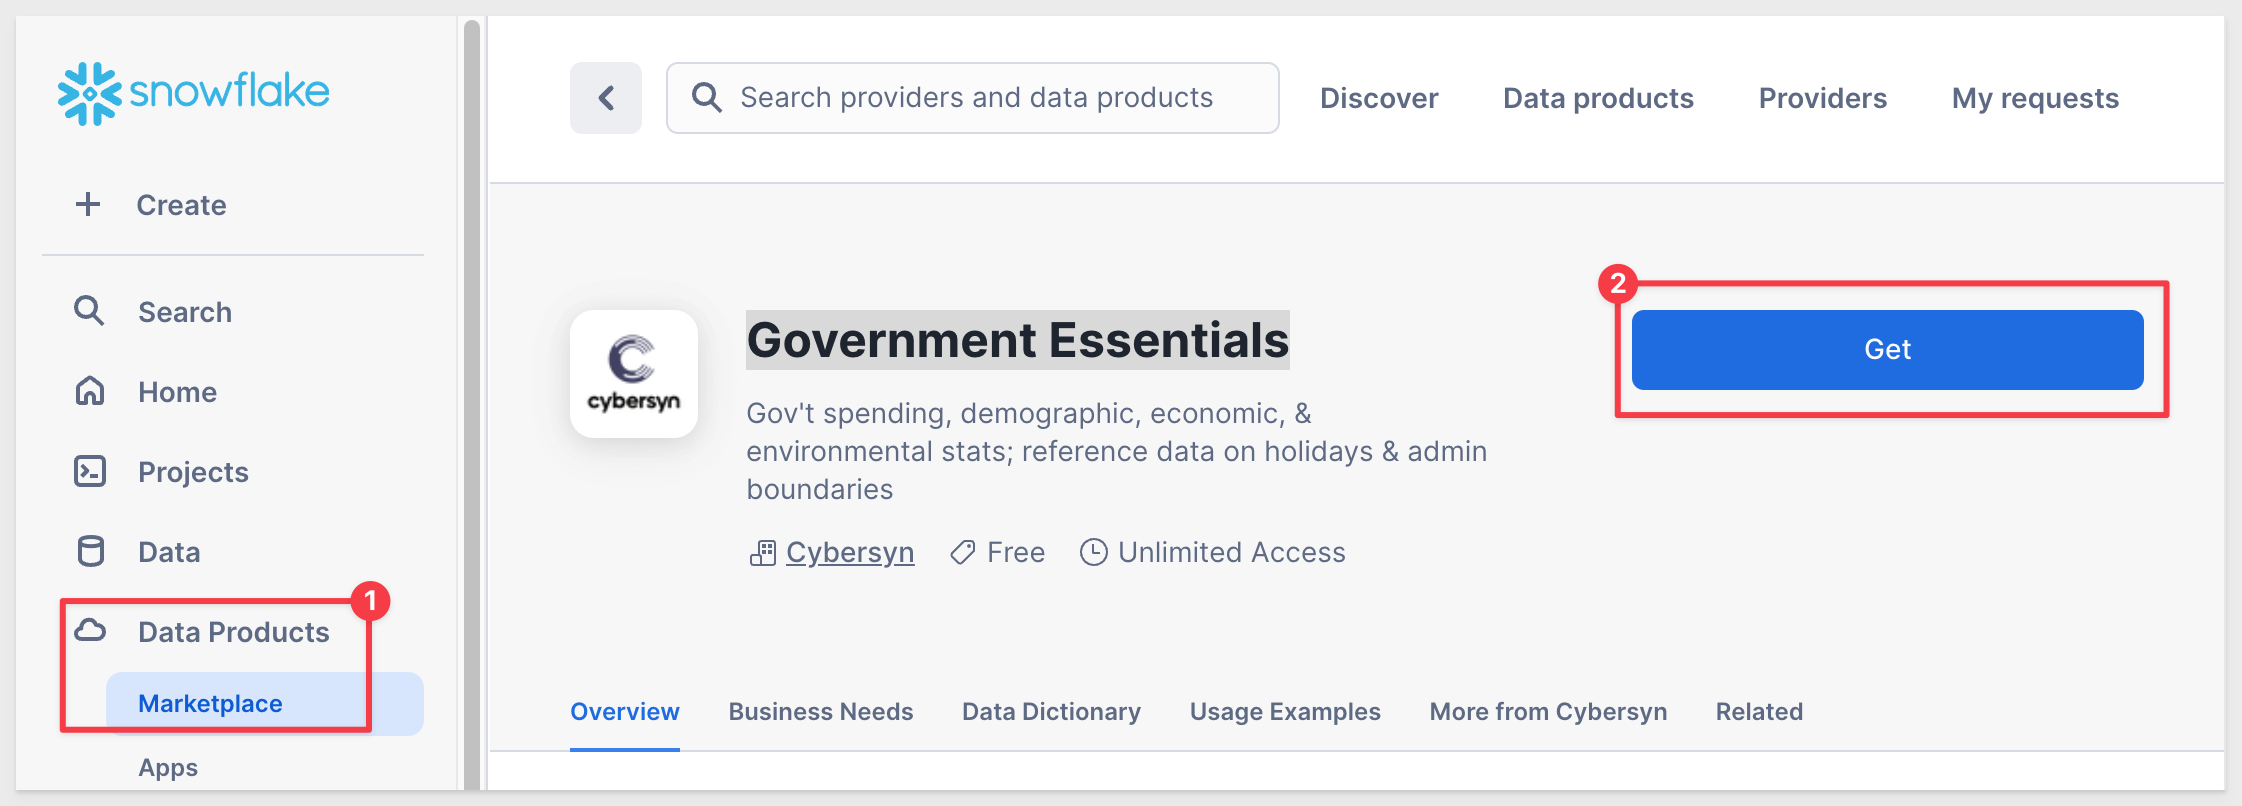
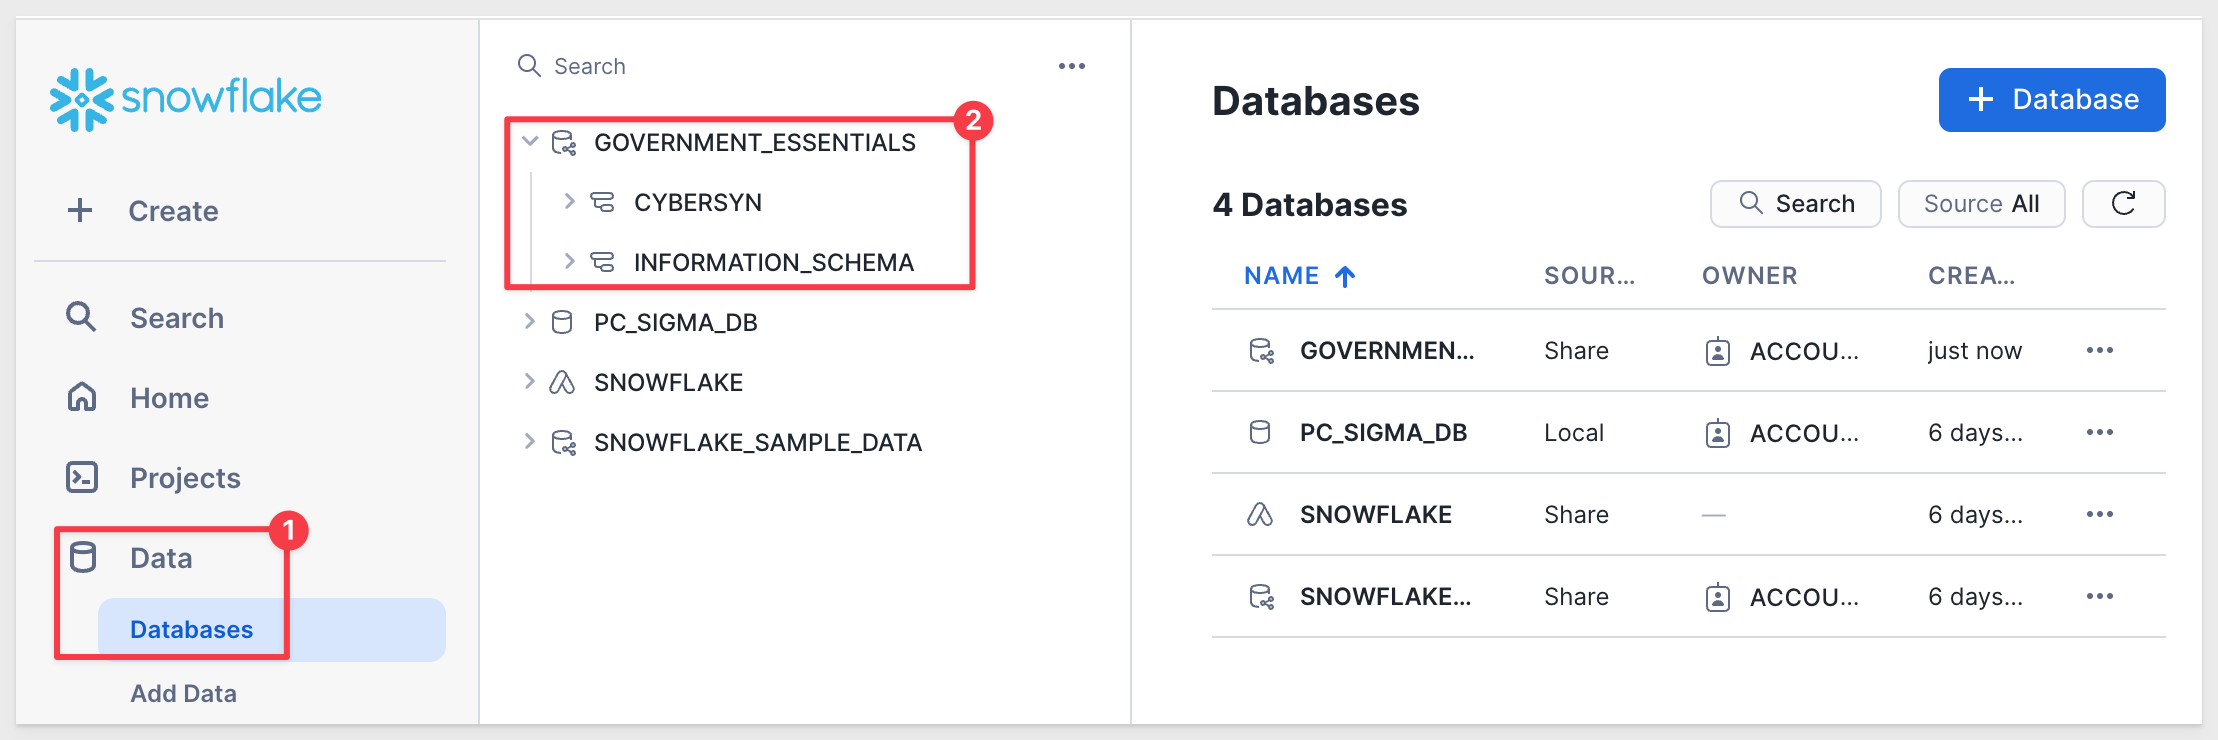
If you have not already added the Cybersyn datasets to your Snowflake account, add them from the Snowflake Marketplace.
There are two datasets we want to add:
Financial & Economic Essentials
Click each link above and then click the Get button:
Select the Government_Essentials database and PC_SIGMA_ROLE and click Get:
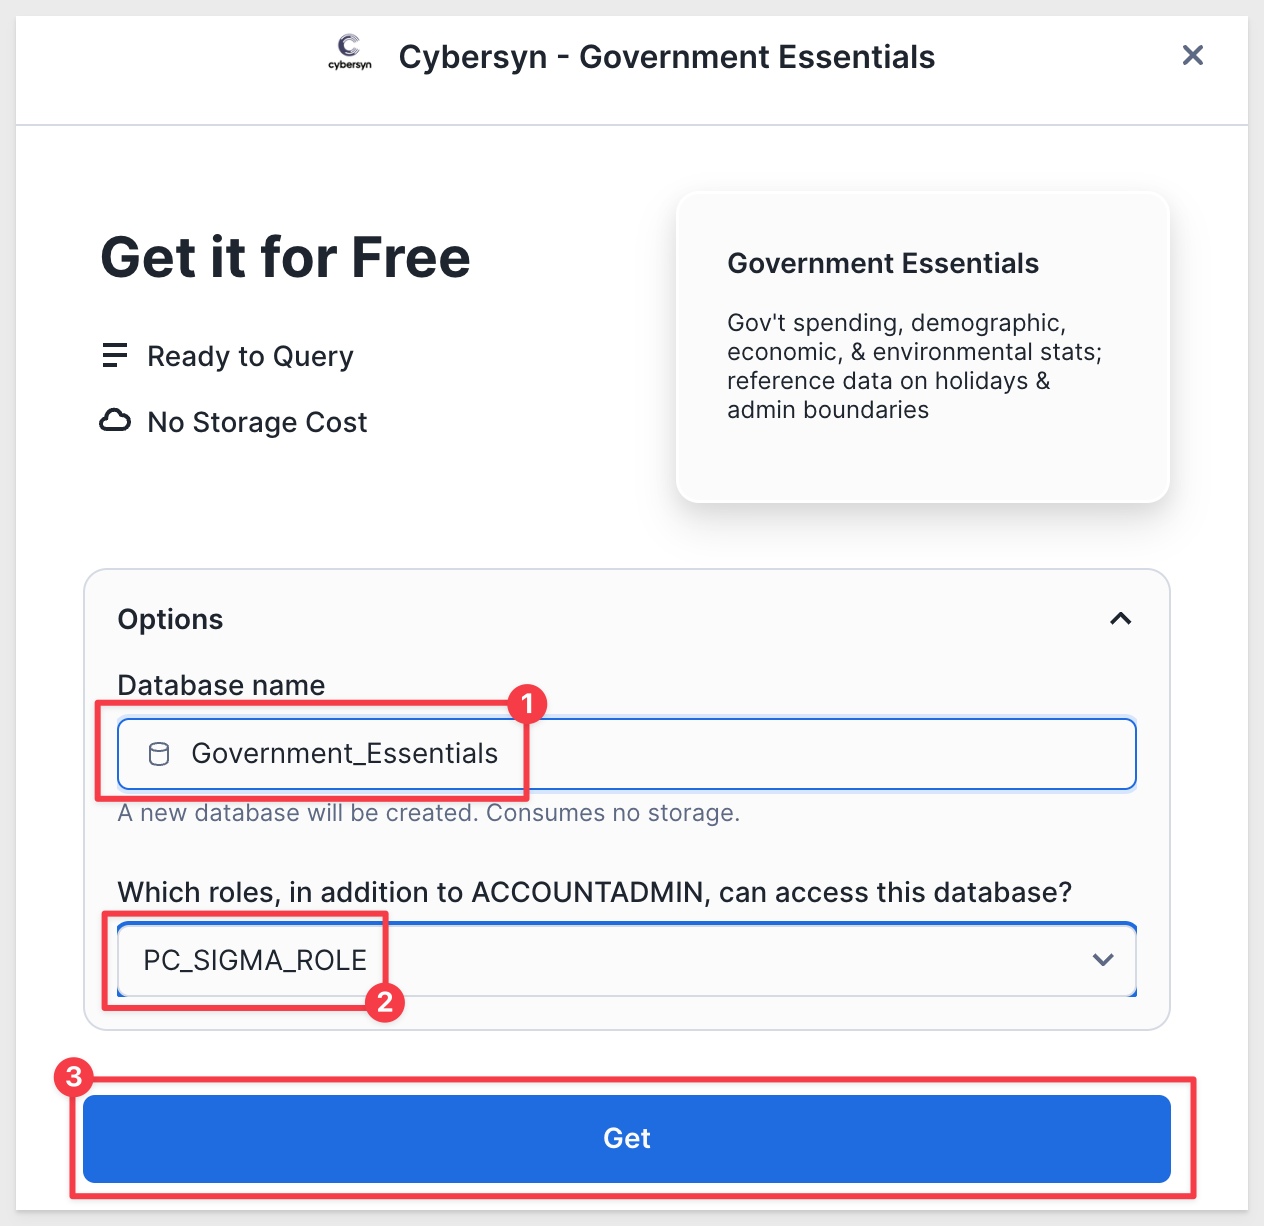
The data will be added to your Snowflake account:
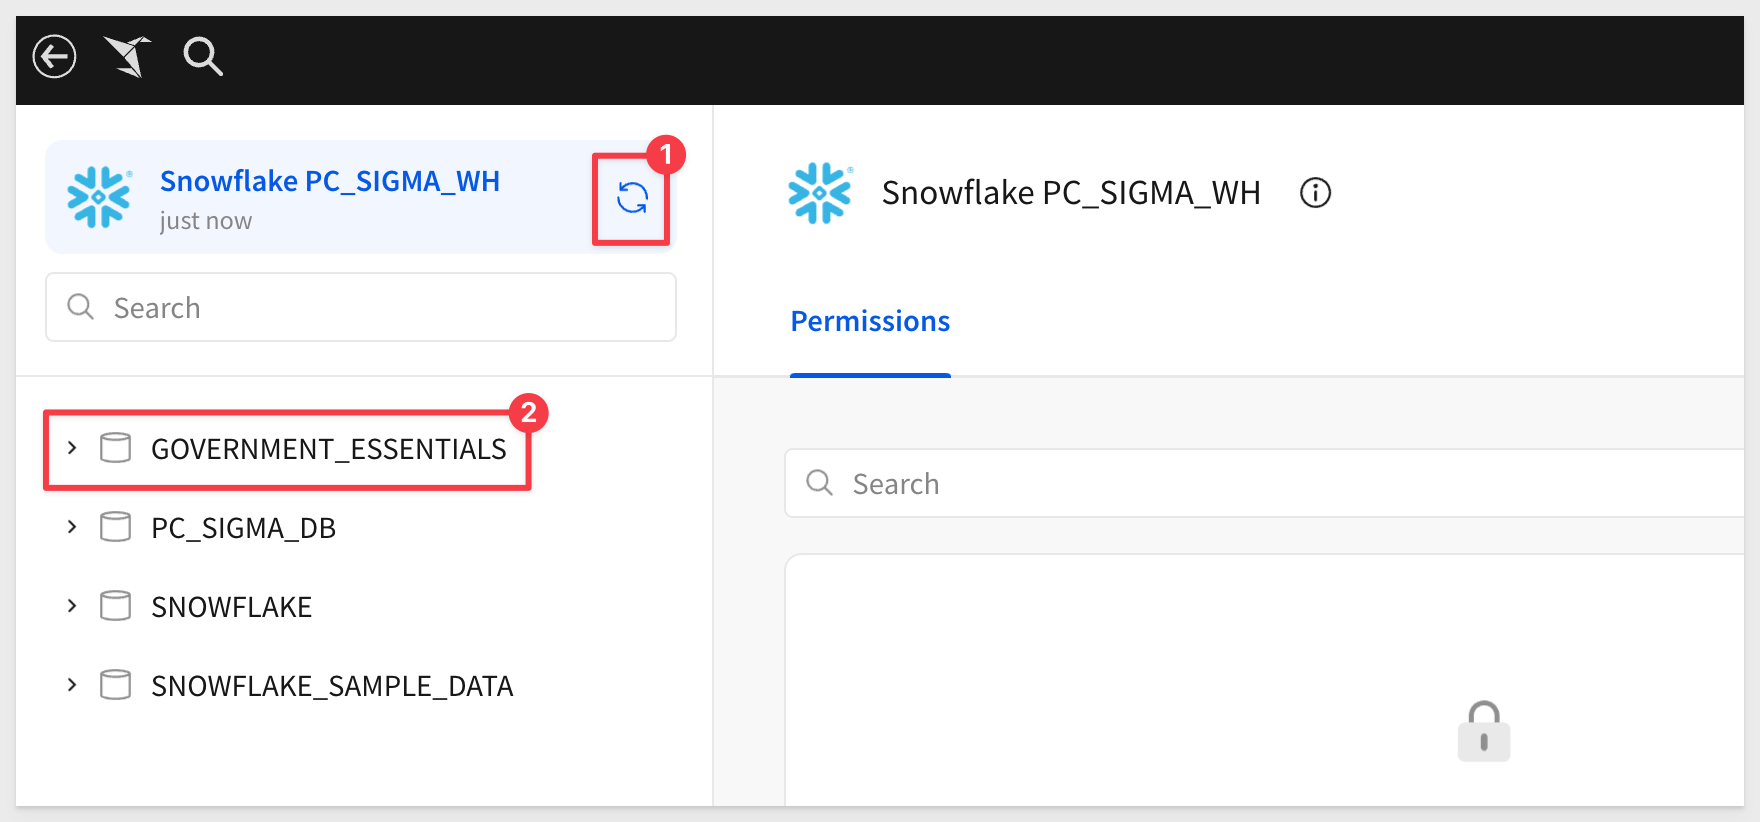
The data will appear in Sigma once you refresh the Snowflake connection:
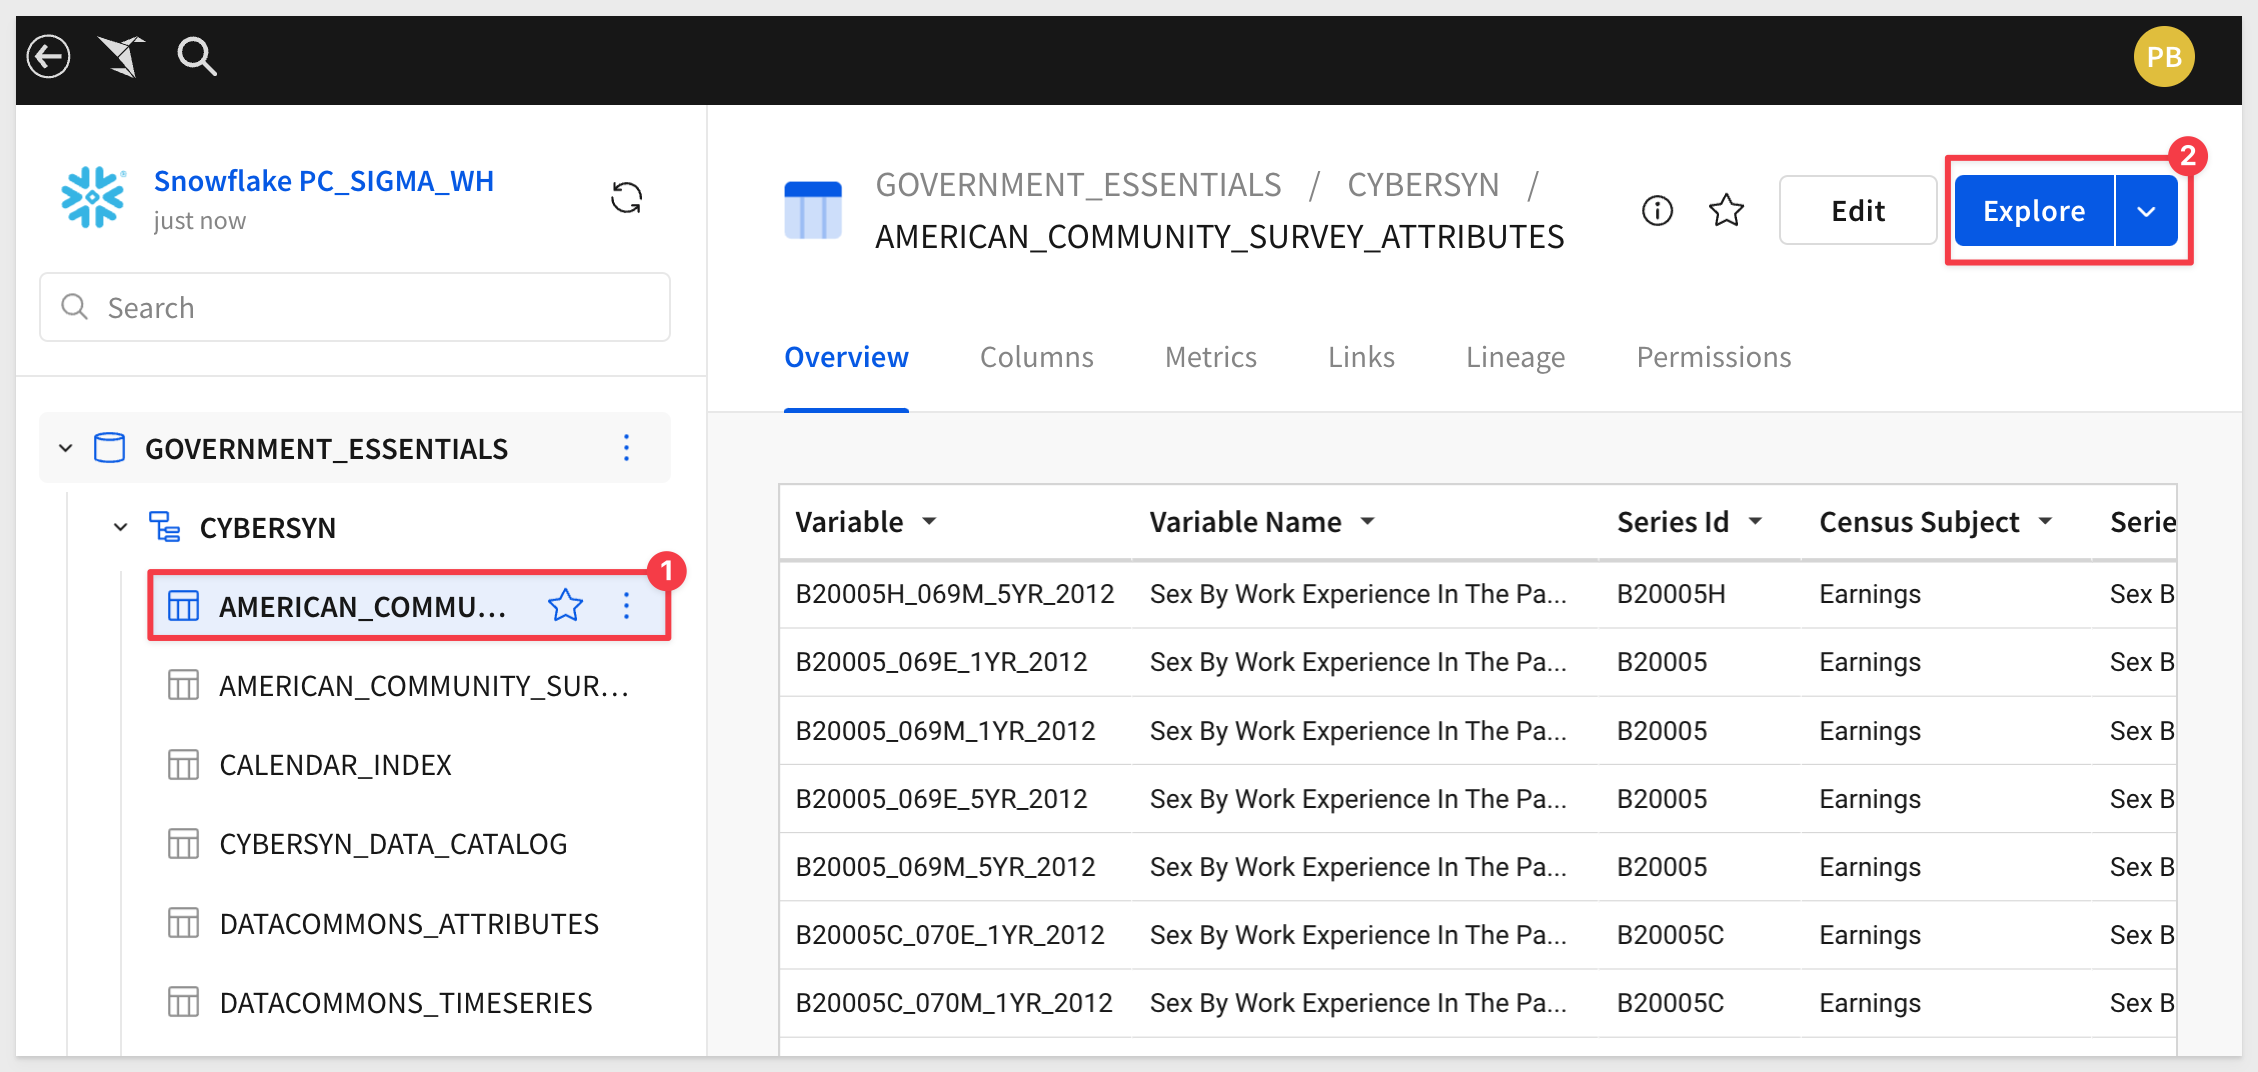
Select a table and click Explore. Now your off to the races:
In this QuickStart we have learned about the power of Sigma and Snowflake and just how easy it is anyone with basic spreadsheet skills to accomplish more in less time and at any scale.
Additional Resource Links
Other Snowflake Summit sessions.
Sigma Resources:
Blog
Community
Help Center
QuickStarts
Be sure to check out all the latest developments at Sigma's First Friday Feature page!