In this hands-on lab, you will act as a newly hired Retail Security SME at Big Buys, a retailer struggling with a spike in internal employee theft. Your current security tools rely on outdated static rules that fail to catch sophisticated fraud. Your mission is to build a defensible security platform that moves beyond simple reporting to advanced behavioral analysis.
What You Will Build
You will modernize the Big Buys security stack by integrating Sigma, Snowflake, and Python to create a comprehensive "Shrink App V2.0". Specifically, you will:
- Use a Cortex Agent through Ask Sigma to investigate shrink trends and uncover "false positives" in your data
- Implement an Anomaly Detection Engine using Python to flag complex "Inter-Scan Latency" fraud patterns
- Build an AI Investigator using a Sigma Custom Agent (powered by a Cortex Agent) that translates complex model outputs into plain English for store managers
Target Audience
Participants of Snowflake Sales Kickoff 2027 who are interested in getting hands-on with Sigma and Snowflake. No SQL or technical data skills are required for this hands-on lab.
Prerequisites
- A computer with a current browser (any browser will work)

This section covers the initial setup required for the hands-on lab.
The setup includes:
- Access to a pre-configured Sigma environment
- Connection to a Snowflake instance with sample retail POS data
- Required permissions for Python execution and Cortex AI
Once setup is complete, you should have access to:
- Template Workbook: Snowflake SKO FY27 - Loss Prevention App Template
- Sample Data: Big Buys POS transaction data with pre-calculated flags
- Snowflake Connection: Configured for Python and Cortex AI
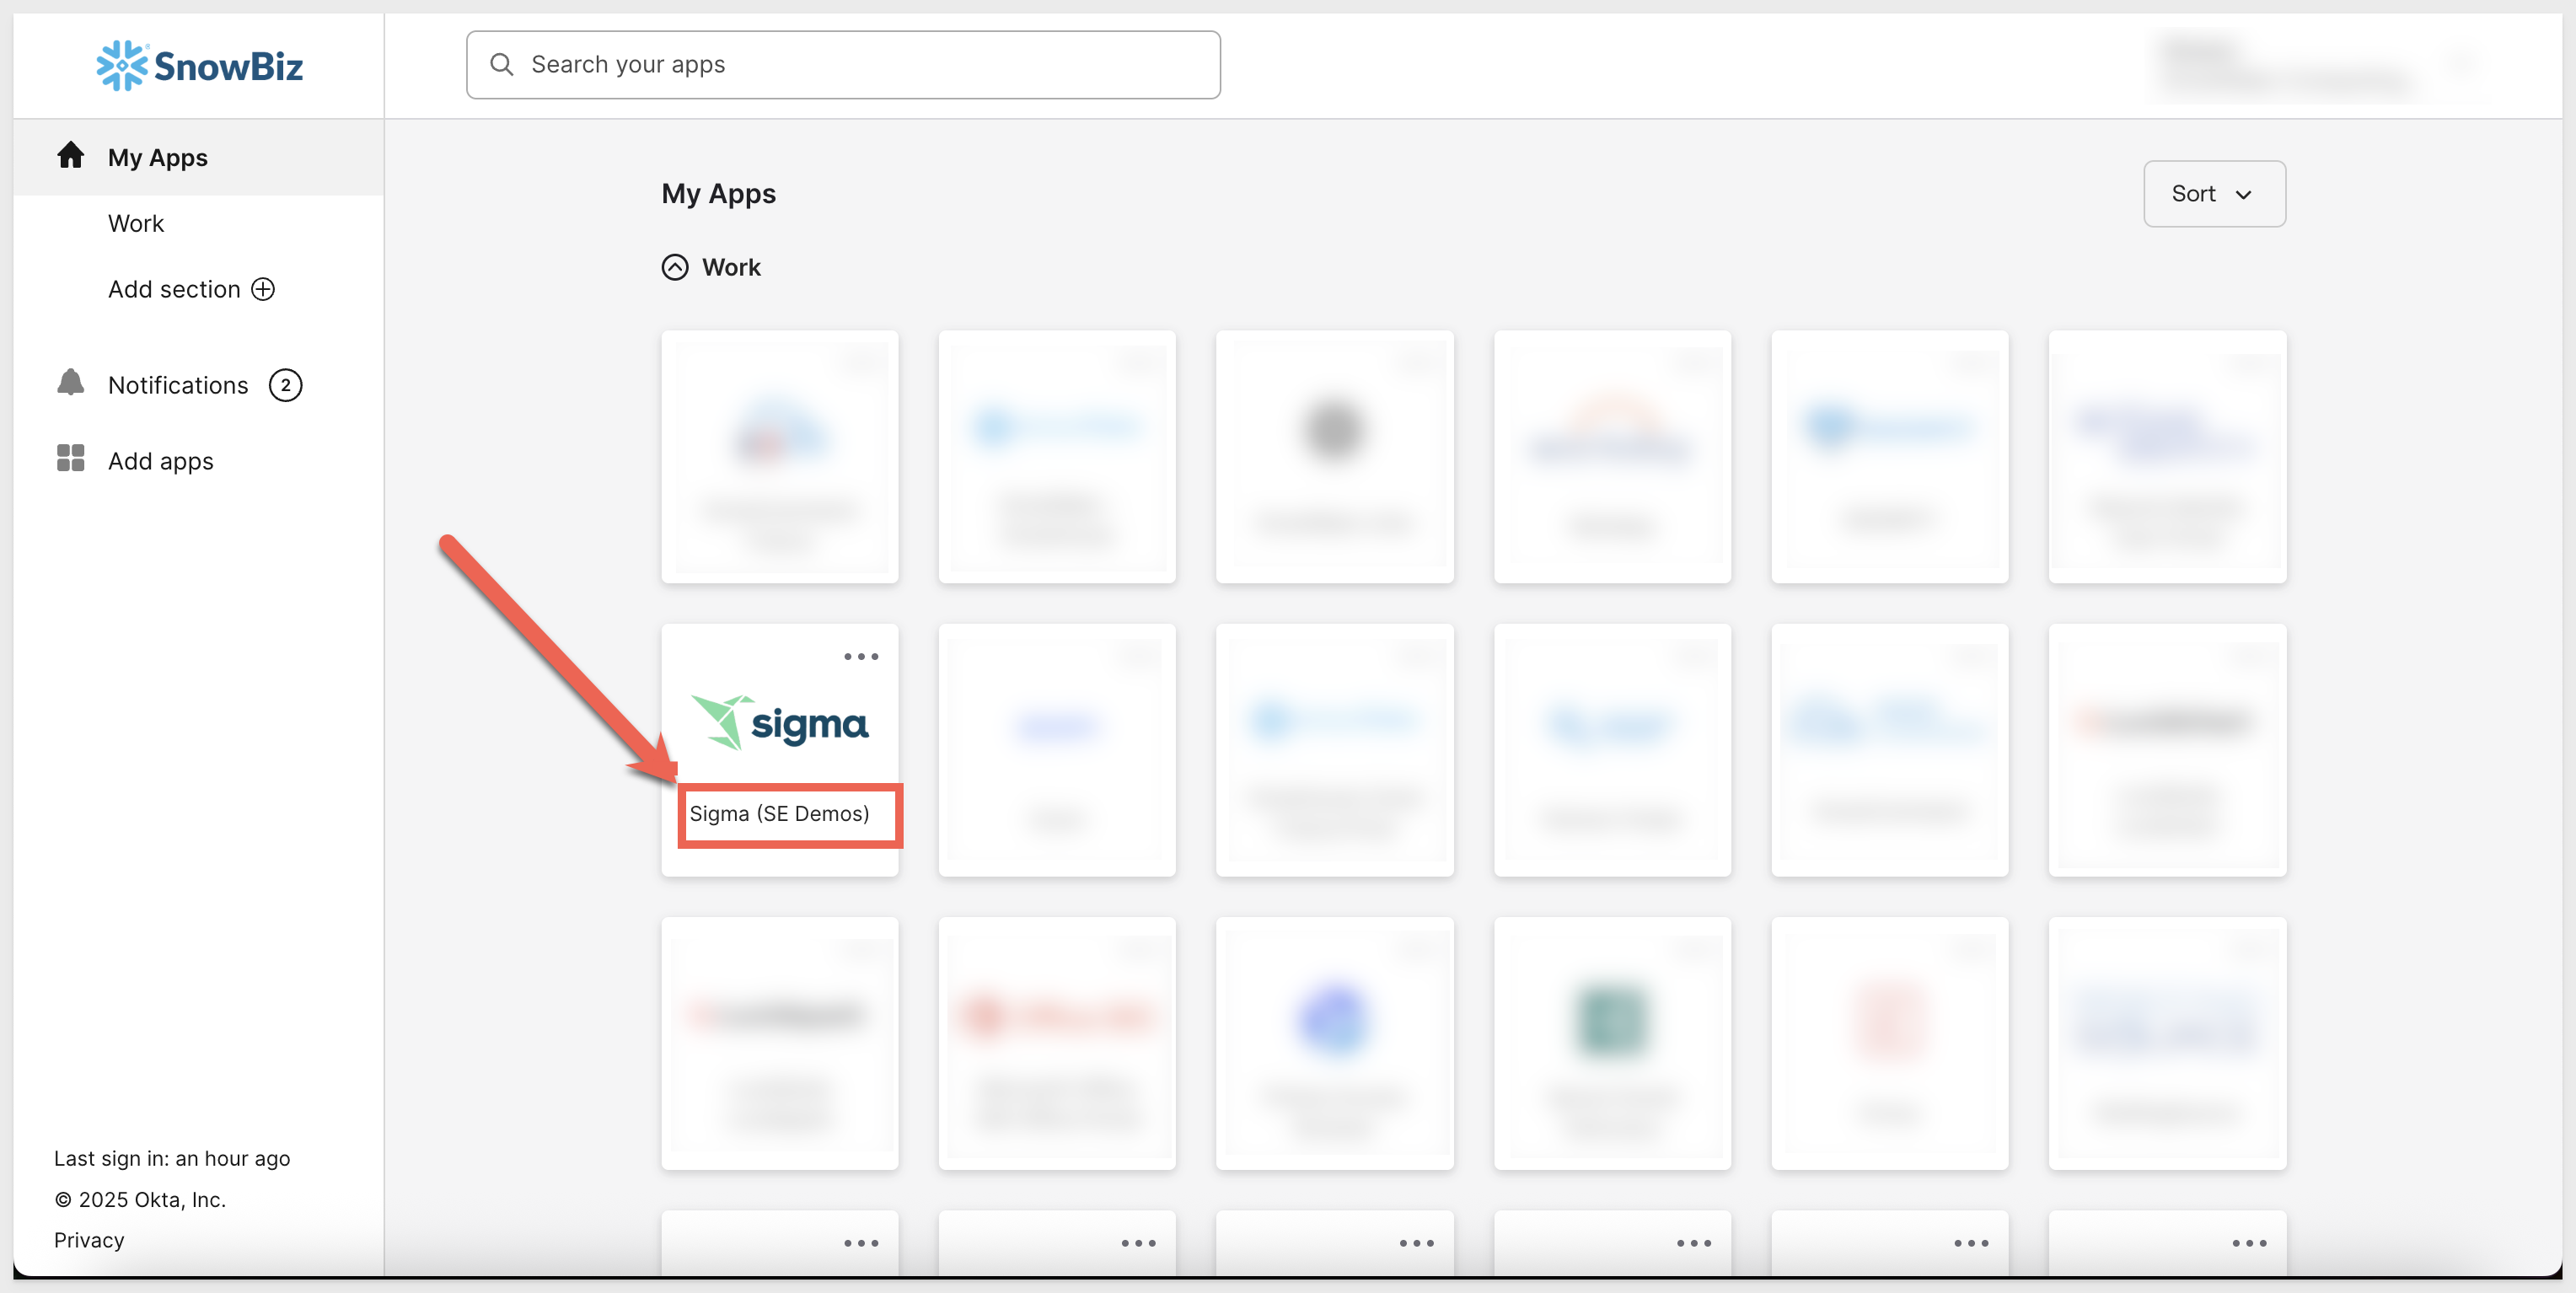
Navigate to the OKTA home page, and click on the Sigma SE Demos tile. This will open up the Sigma account that has been set up as a demo sandbox for Snowflake SEs:
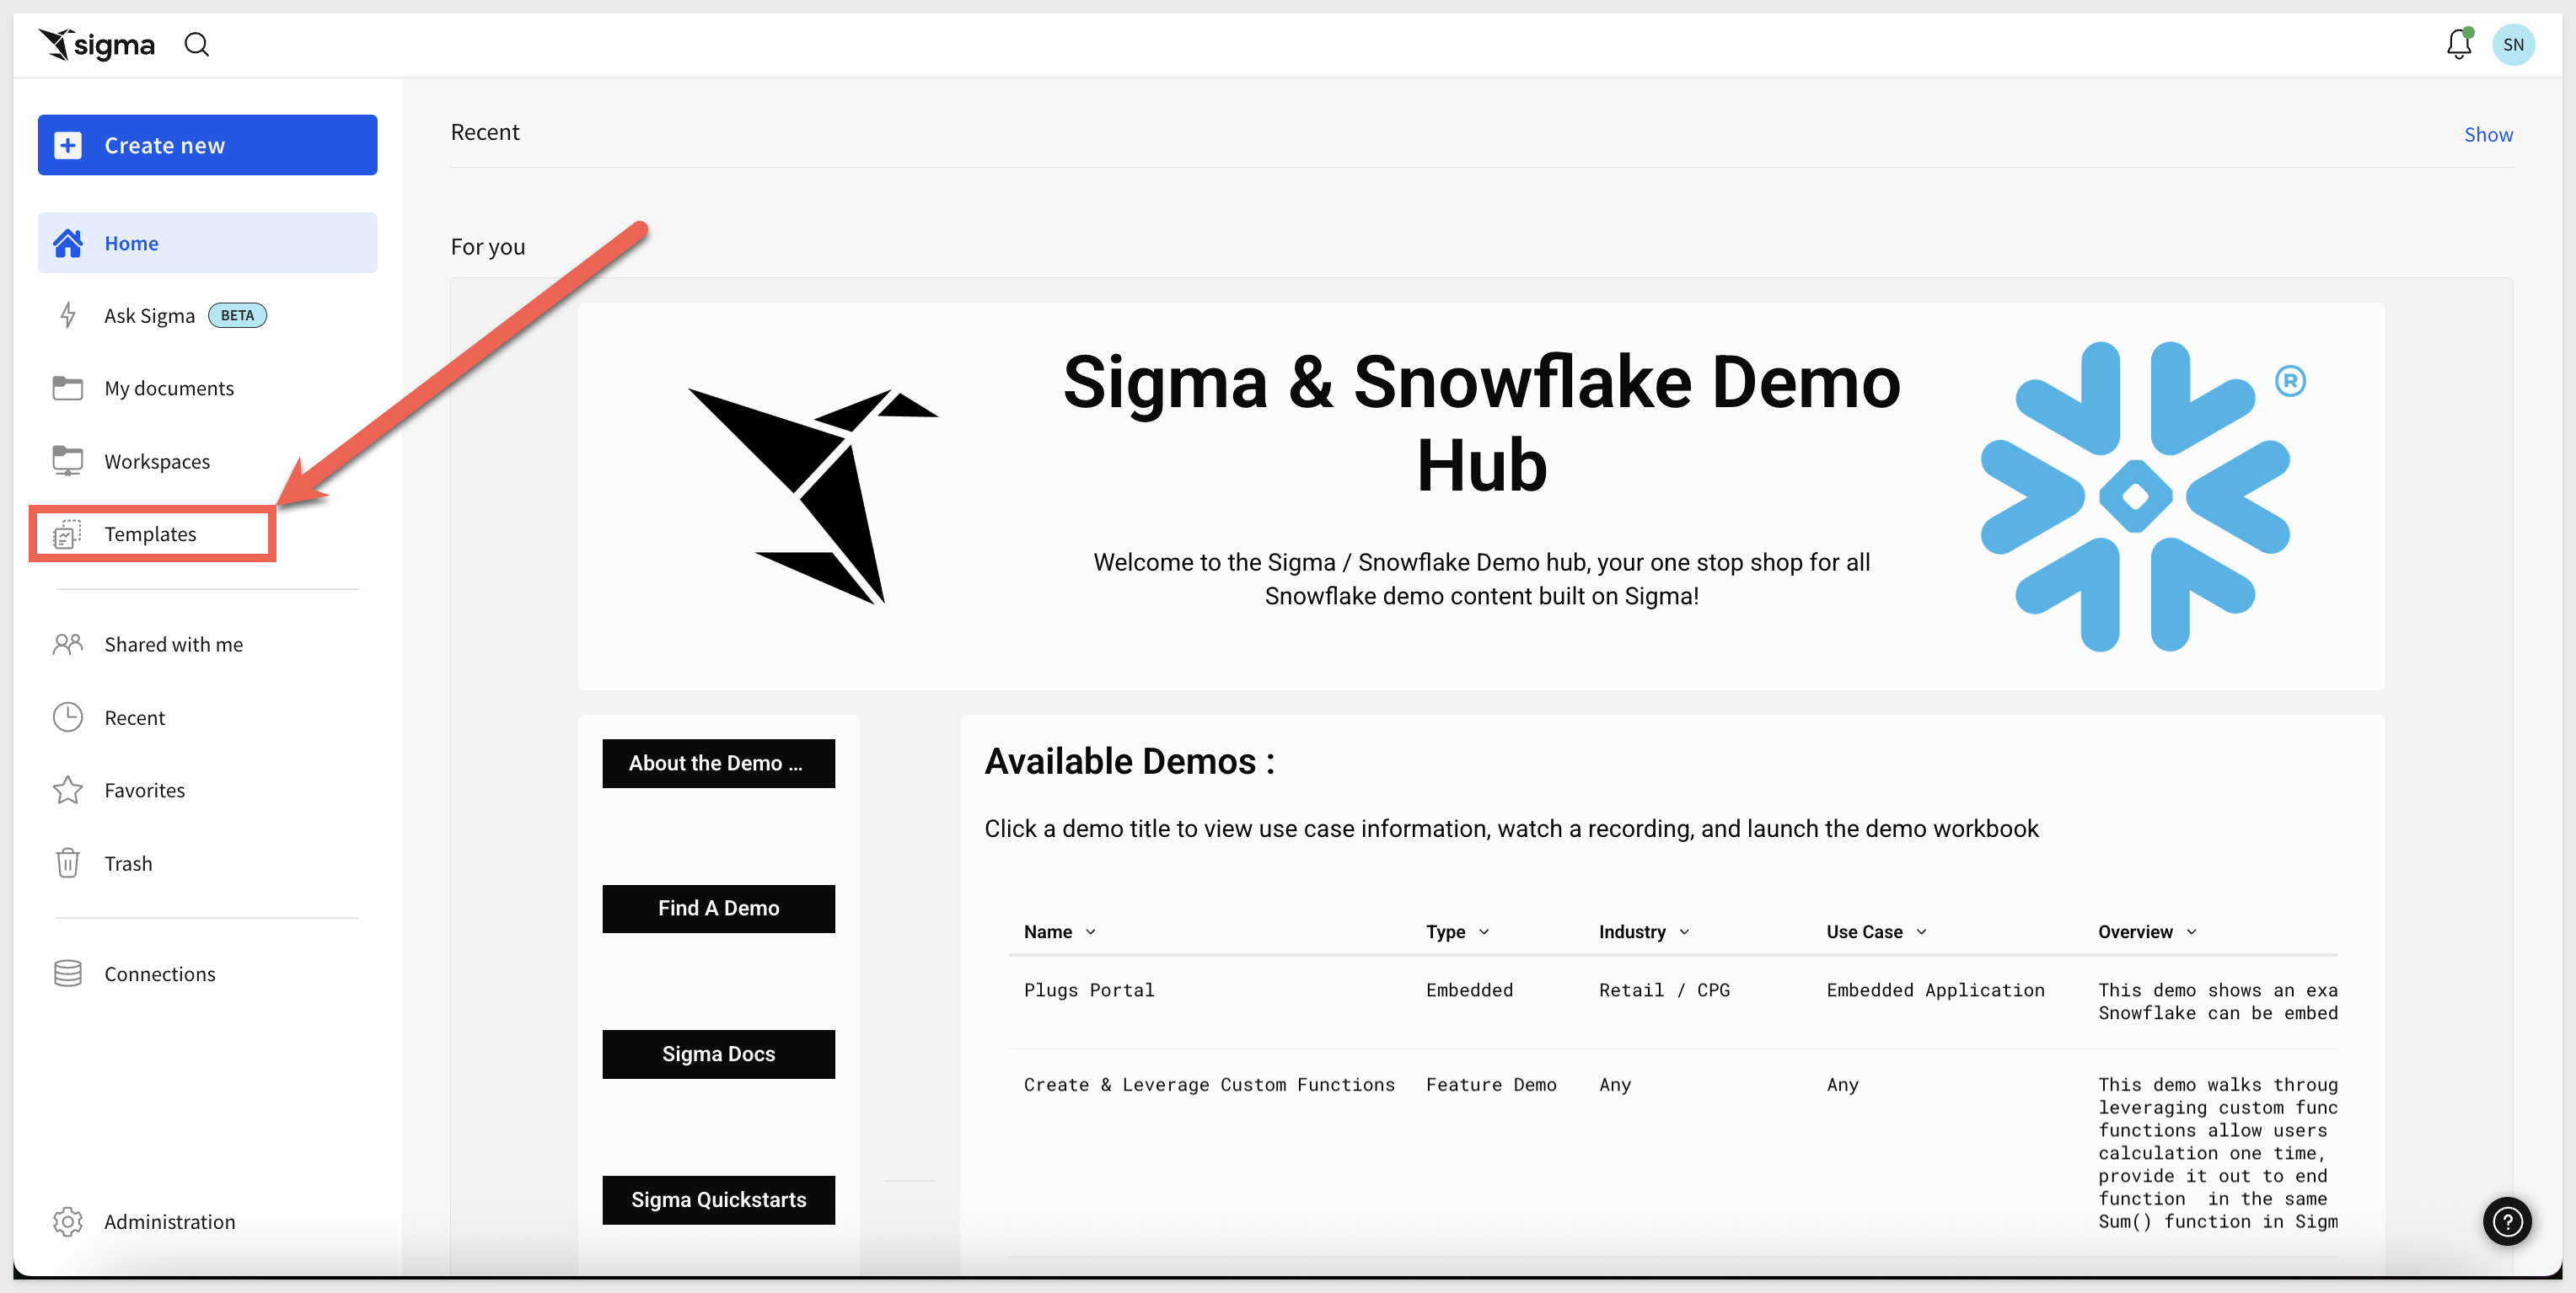
From the Sigma home page, navigate to the templates section:
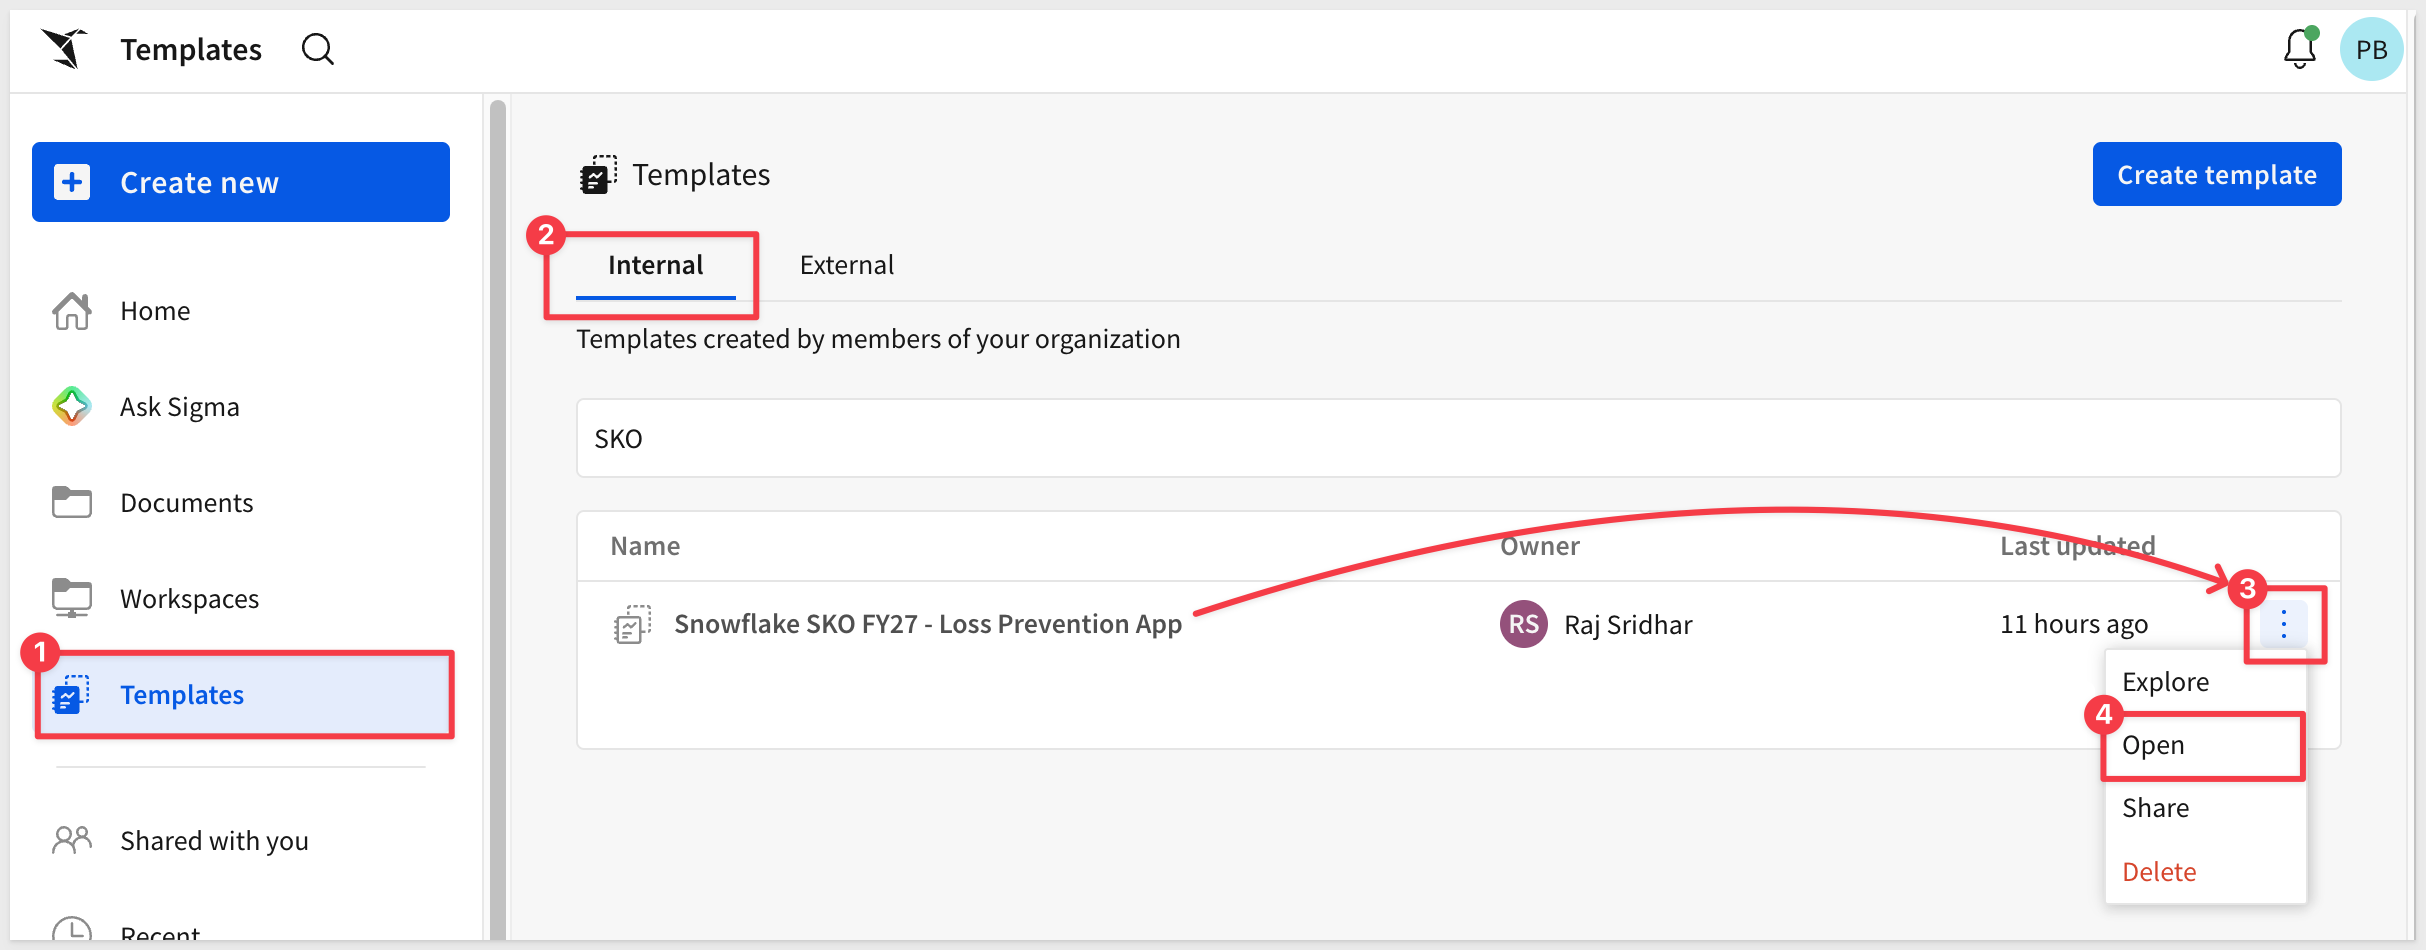
Under internal templates select Snowflake SKO FY27 - Loss Prevention App Template.
Welcome to the team! As a newly hired Shrink Expert, your first week is focused on getting "the lay of the land." Big Buys has been overwhelmed with security alerts, and you have been brought in to build a superior detection system from the ground up.
Before rolling out new solutions, we must evaluate the legacy tools.
Currently, the company relies on an Exception Based Reporting (EBR) dashboard, a system of rigid, hard-coded rules designed to catch theft. While functional, it is creating excessive "noise" leading to a loss of credibility with store managers.
Goal: Pressure-test the existing infrastructure using the Loss Prevention App v1.0 to determine if flagged transactions are legitimate or if these legacy rules are simply burying managers in unnecessary paperwork.
Understanding Exception Based Reporting (EBR)
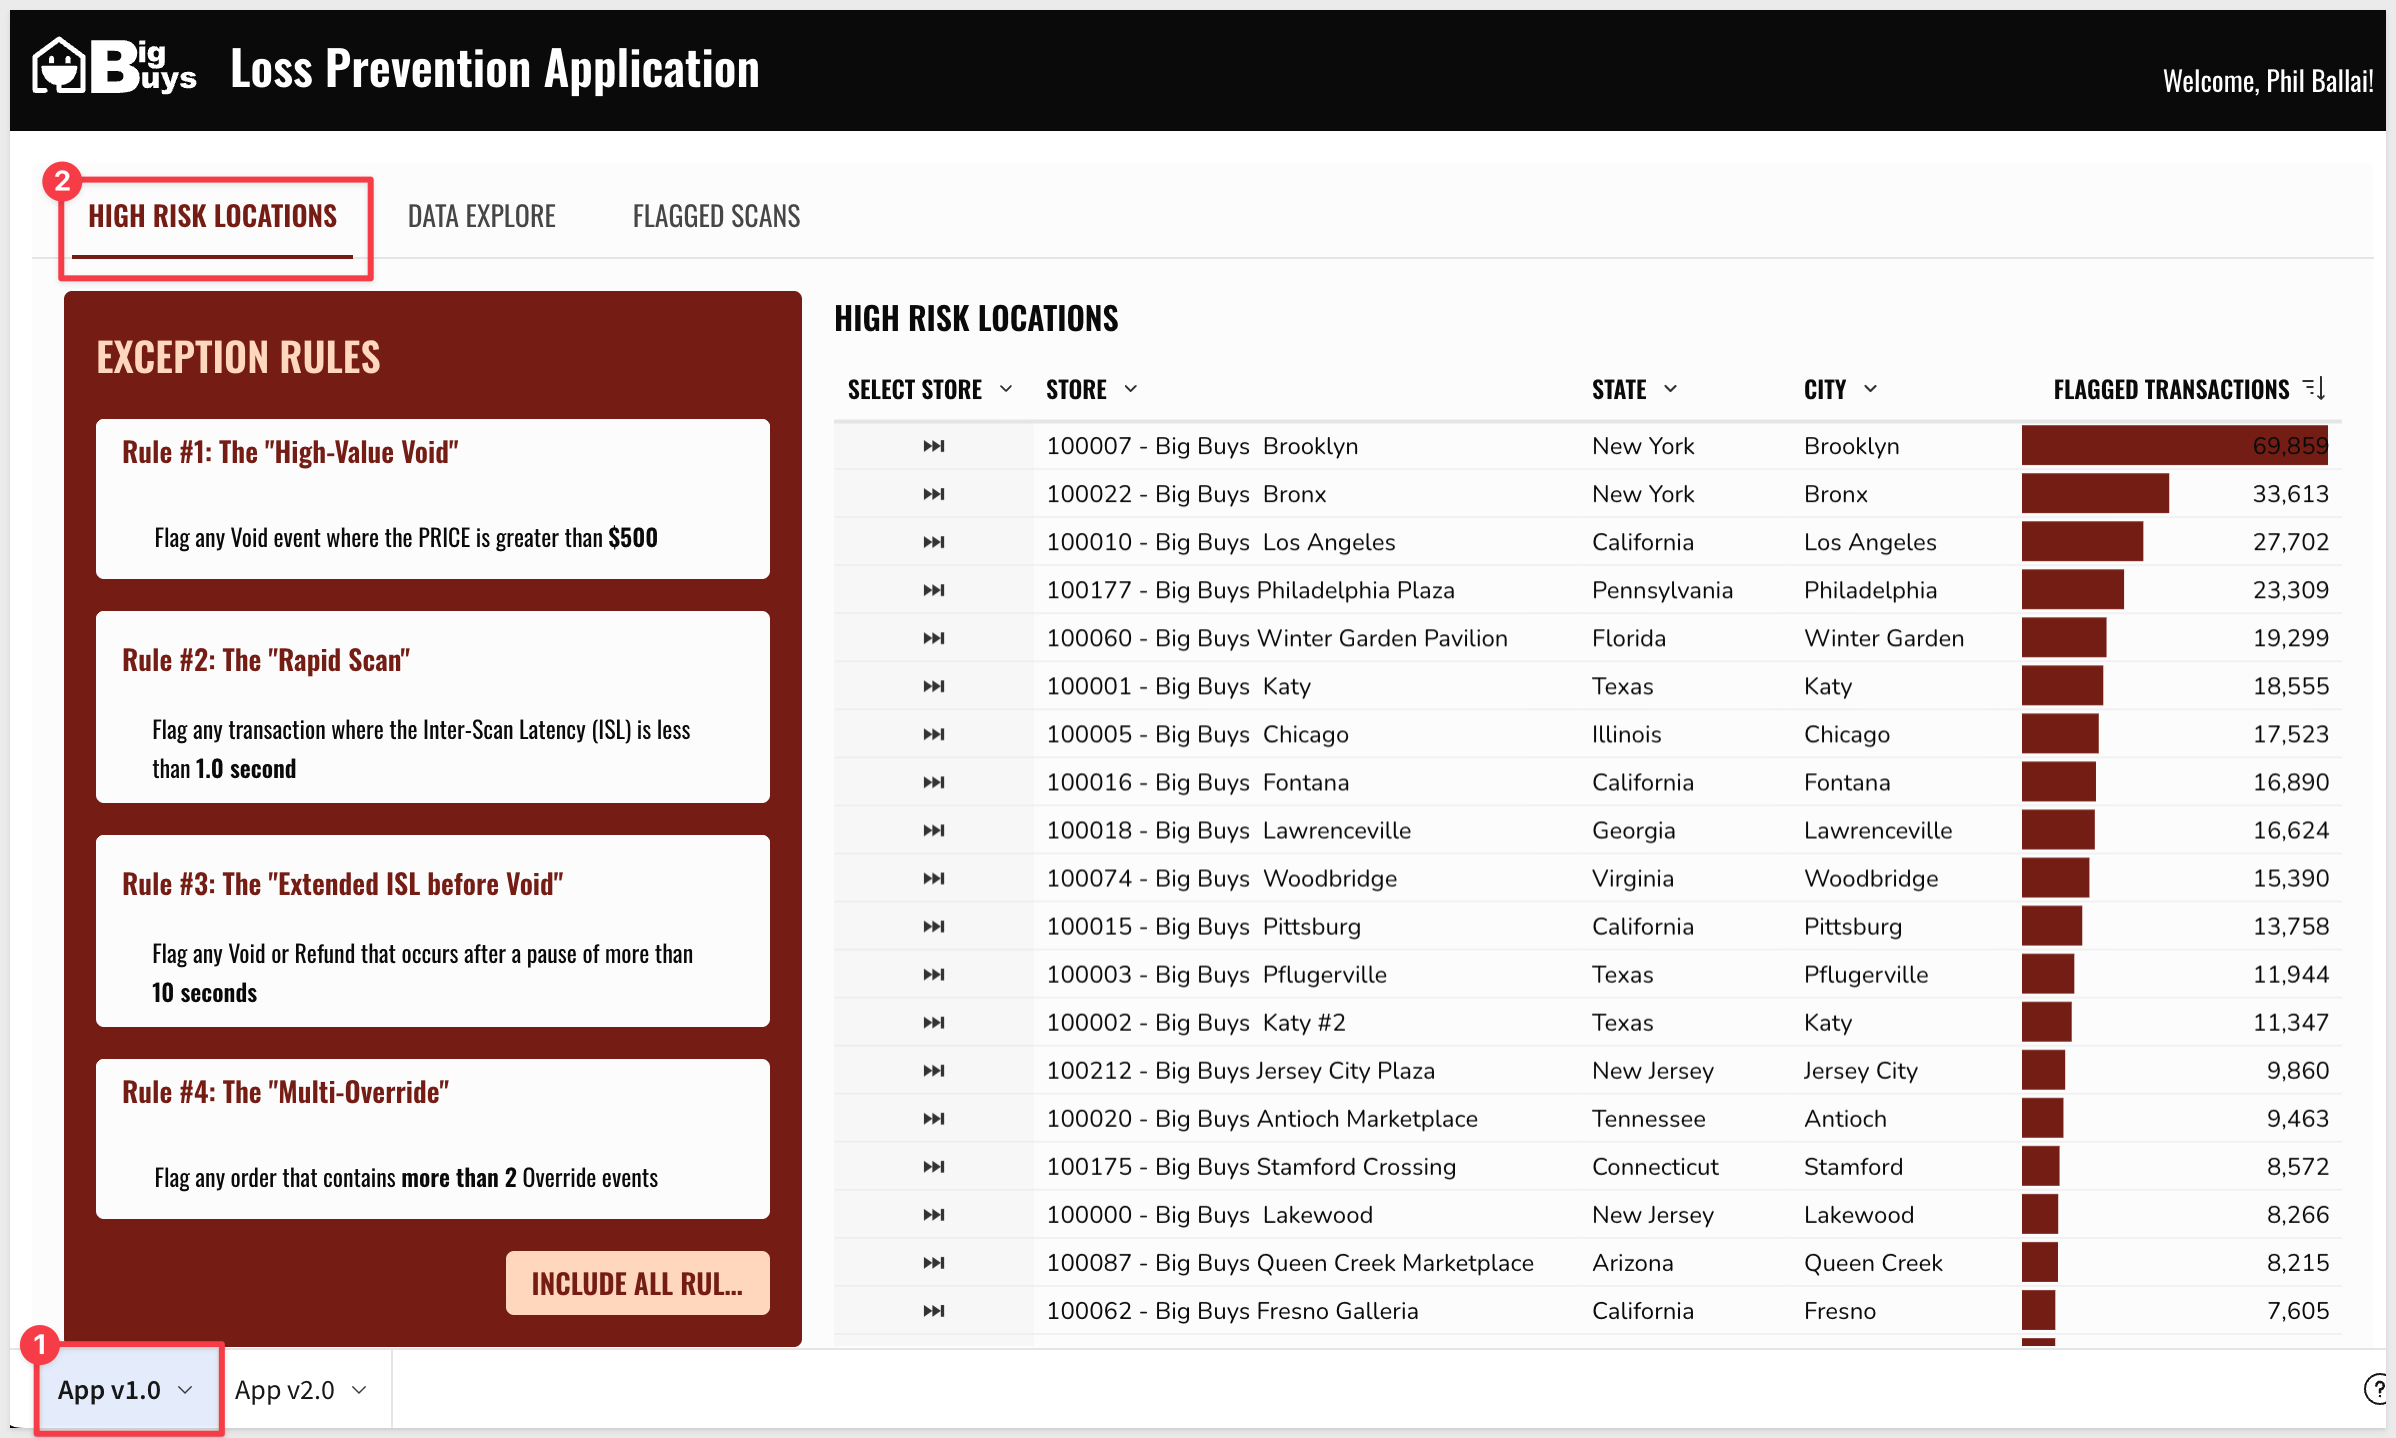
Big Buys currently utilizes four static, threshold-based rules:
- Rule #1: The "High-Value Void" - Flags any Void event where the
PRICE is > $500 - Rule #2: The "Rapid Scan" - Flags any transaction where the Inter-Scan Latency (ISL) is
< 1.0 second - Rule #3: The "Extended ISL before Void" - Flags any Void/Refund occurring after a pause of
> 10 seconds - Rule #4: The "Multi-Override" - Flags any order containing
more than 2 Override events
While these catch obvious errors, they lack the nuance required for modern retail.
Investigate a High-Risk Location
Step 1: Open the Snowflake SKO FY27 - Loss Prevention App Template. Ensure that you are on the page named App v1.0:
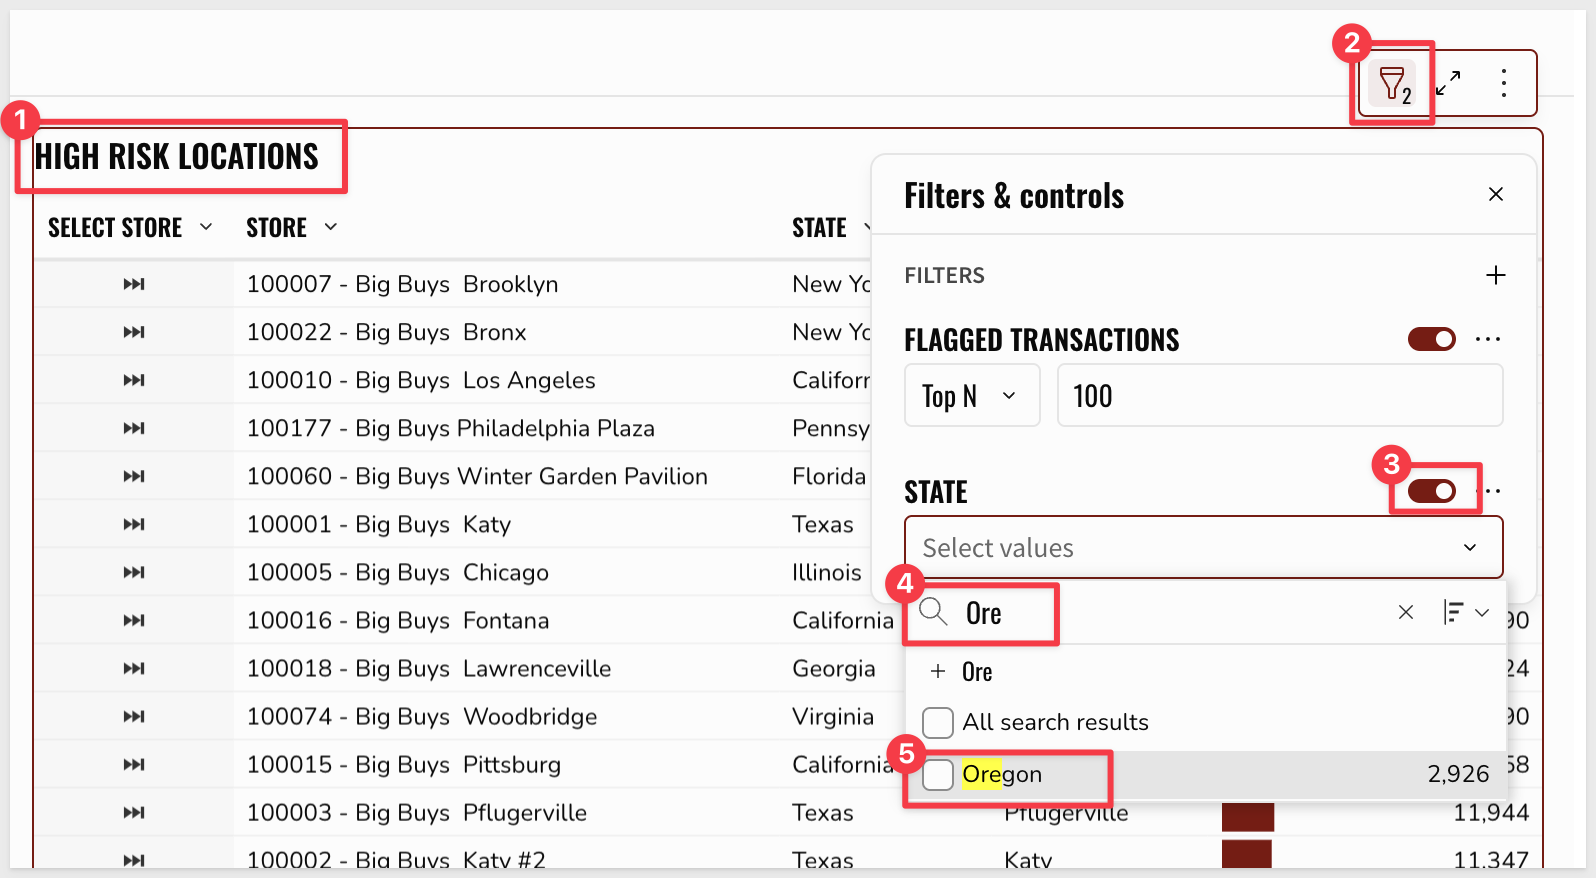
Step 2: Locate the High Risk Locations table on the main dashboard:
Use the State filter to drill down specifically to Oregon:
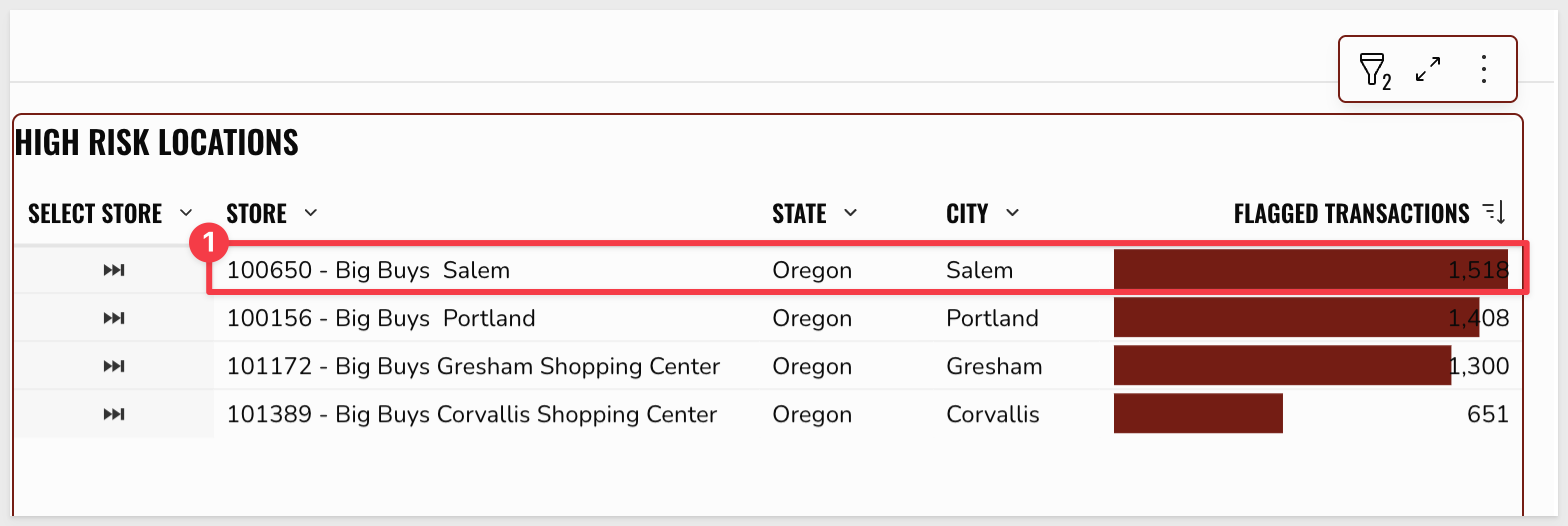
Step 3: Observe that Store 100650 - Big Buys Salem is flagged as the highest risk location in Oregon, containing the highest volume of flagged transactions:
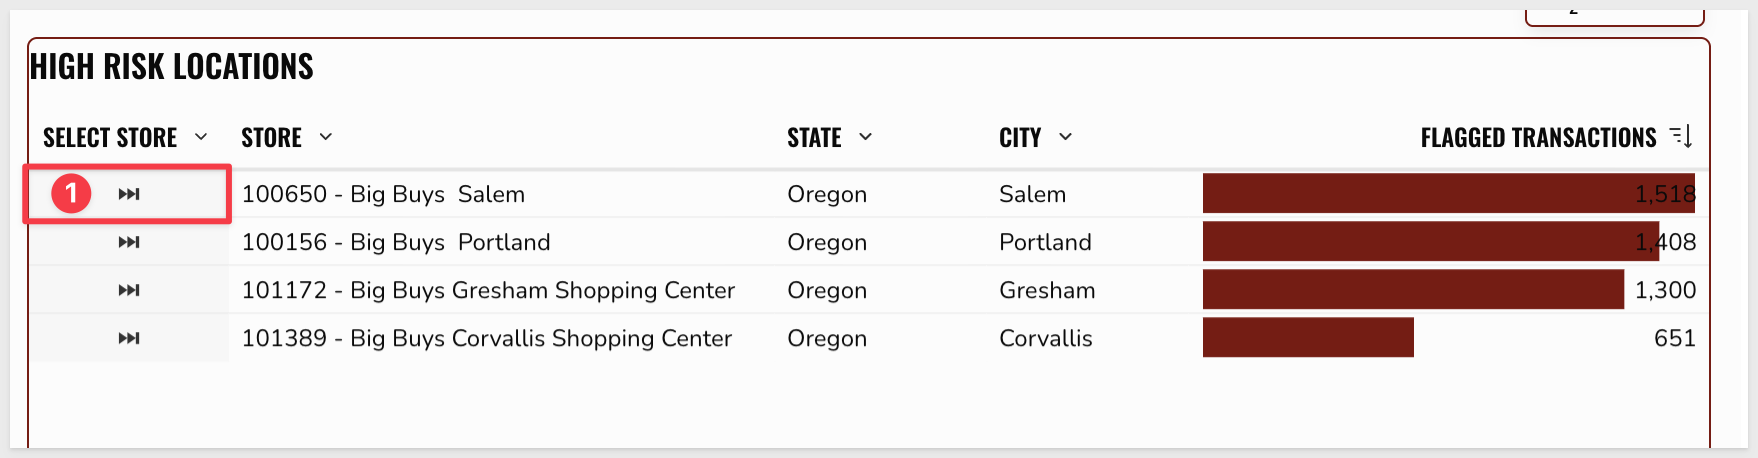
Step 4: Click on the Select Store column next to 100650 - Big Buys Salem to filter the entire dashboard to this specific location:
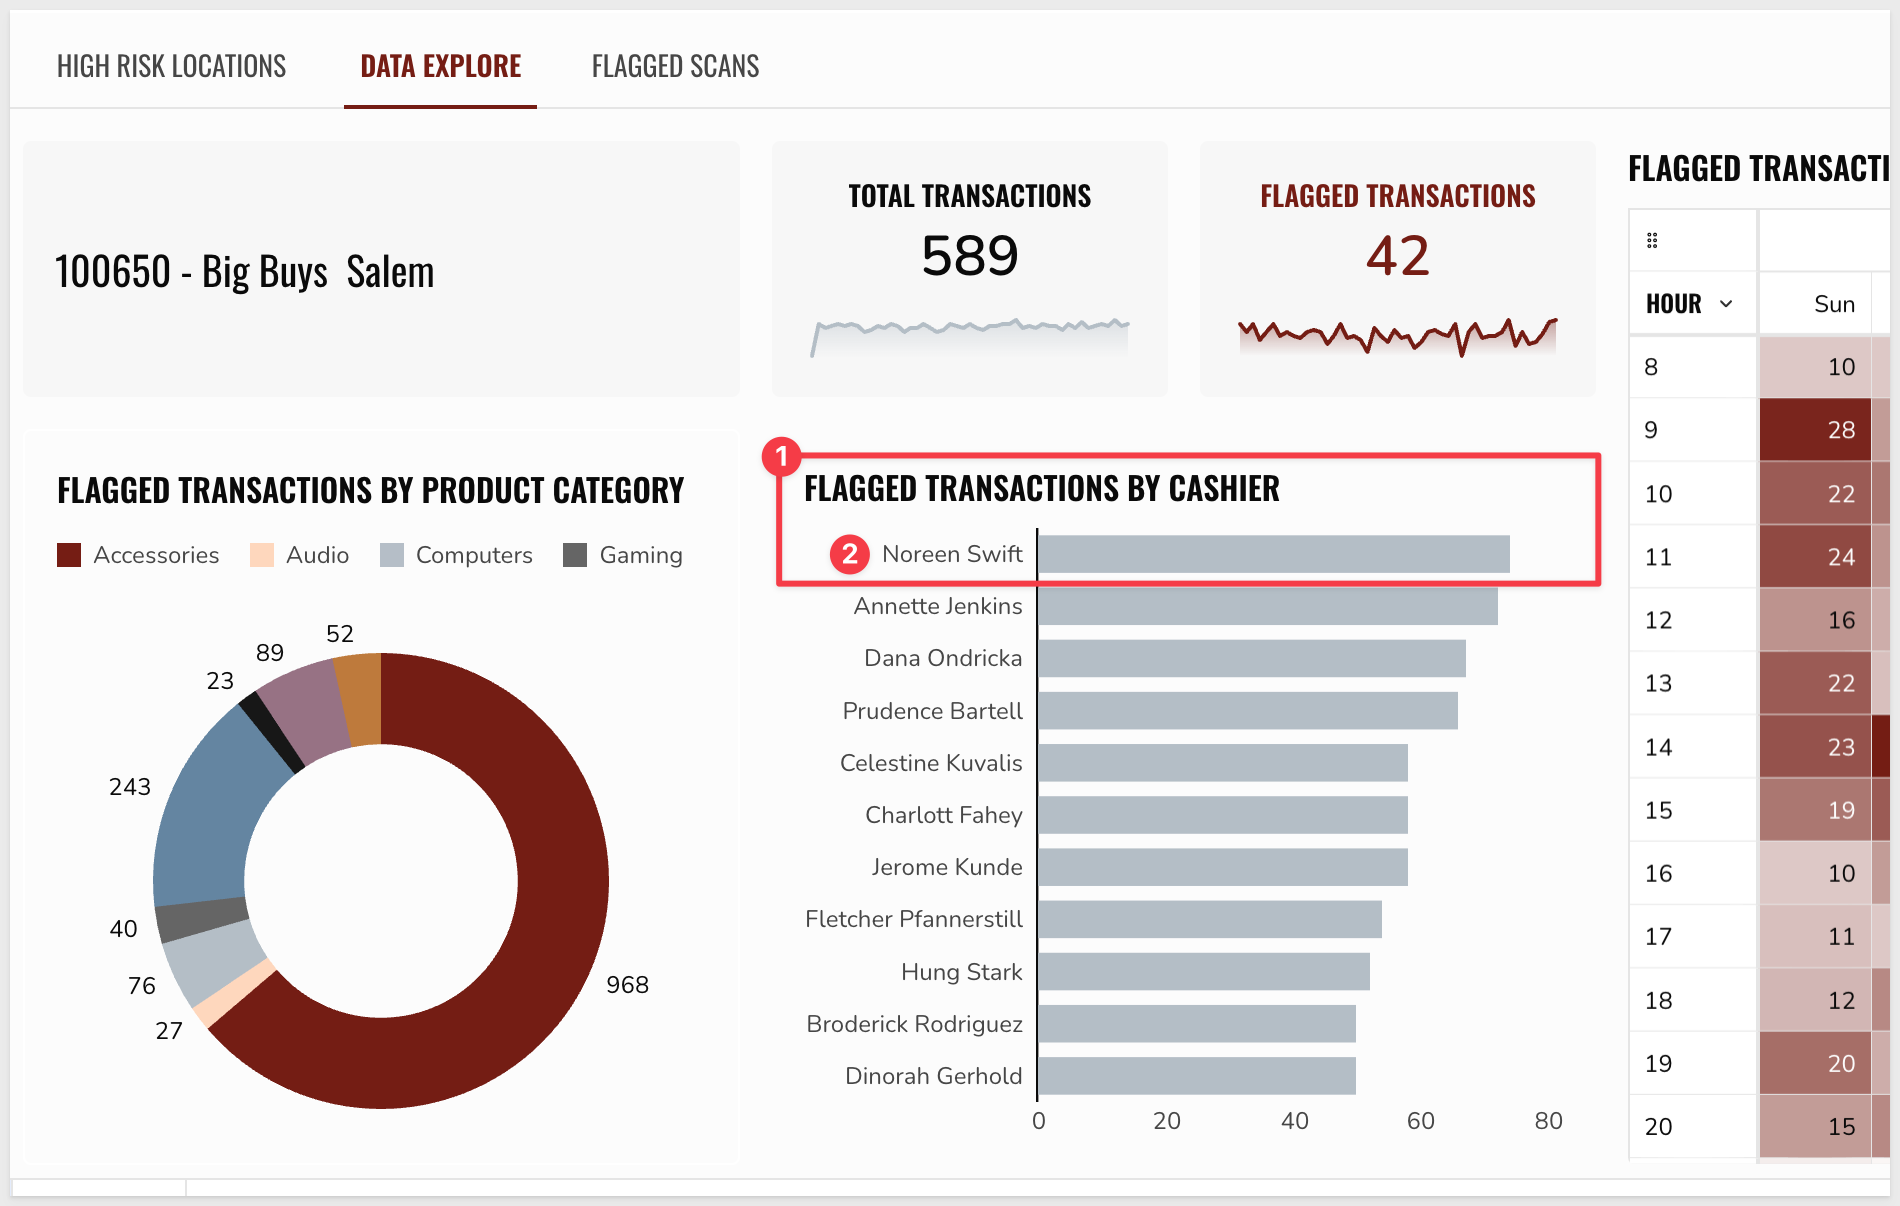
Step 5: Review the Flagged Transactions by Cashier chart. Noreen Swift stands out as the cashier with the highest volume of suspicious activity:
We will use Ask Sigma to investigate Noreen Swift's performance, starting with broad metrics and narrowing our focus.
Remember we are using the existing version of the Loss Prevention App v1.0 to see the results that store managers currently rely on.
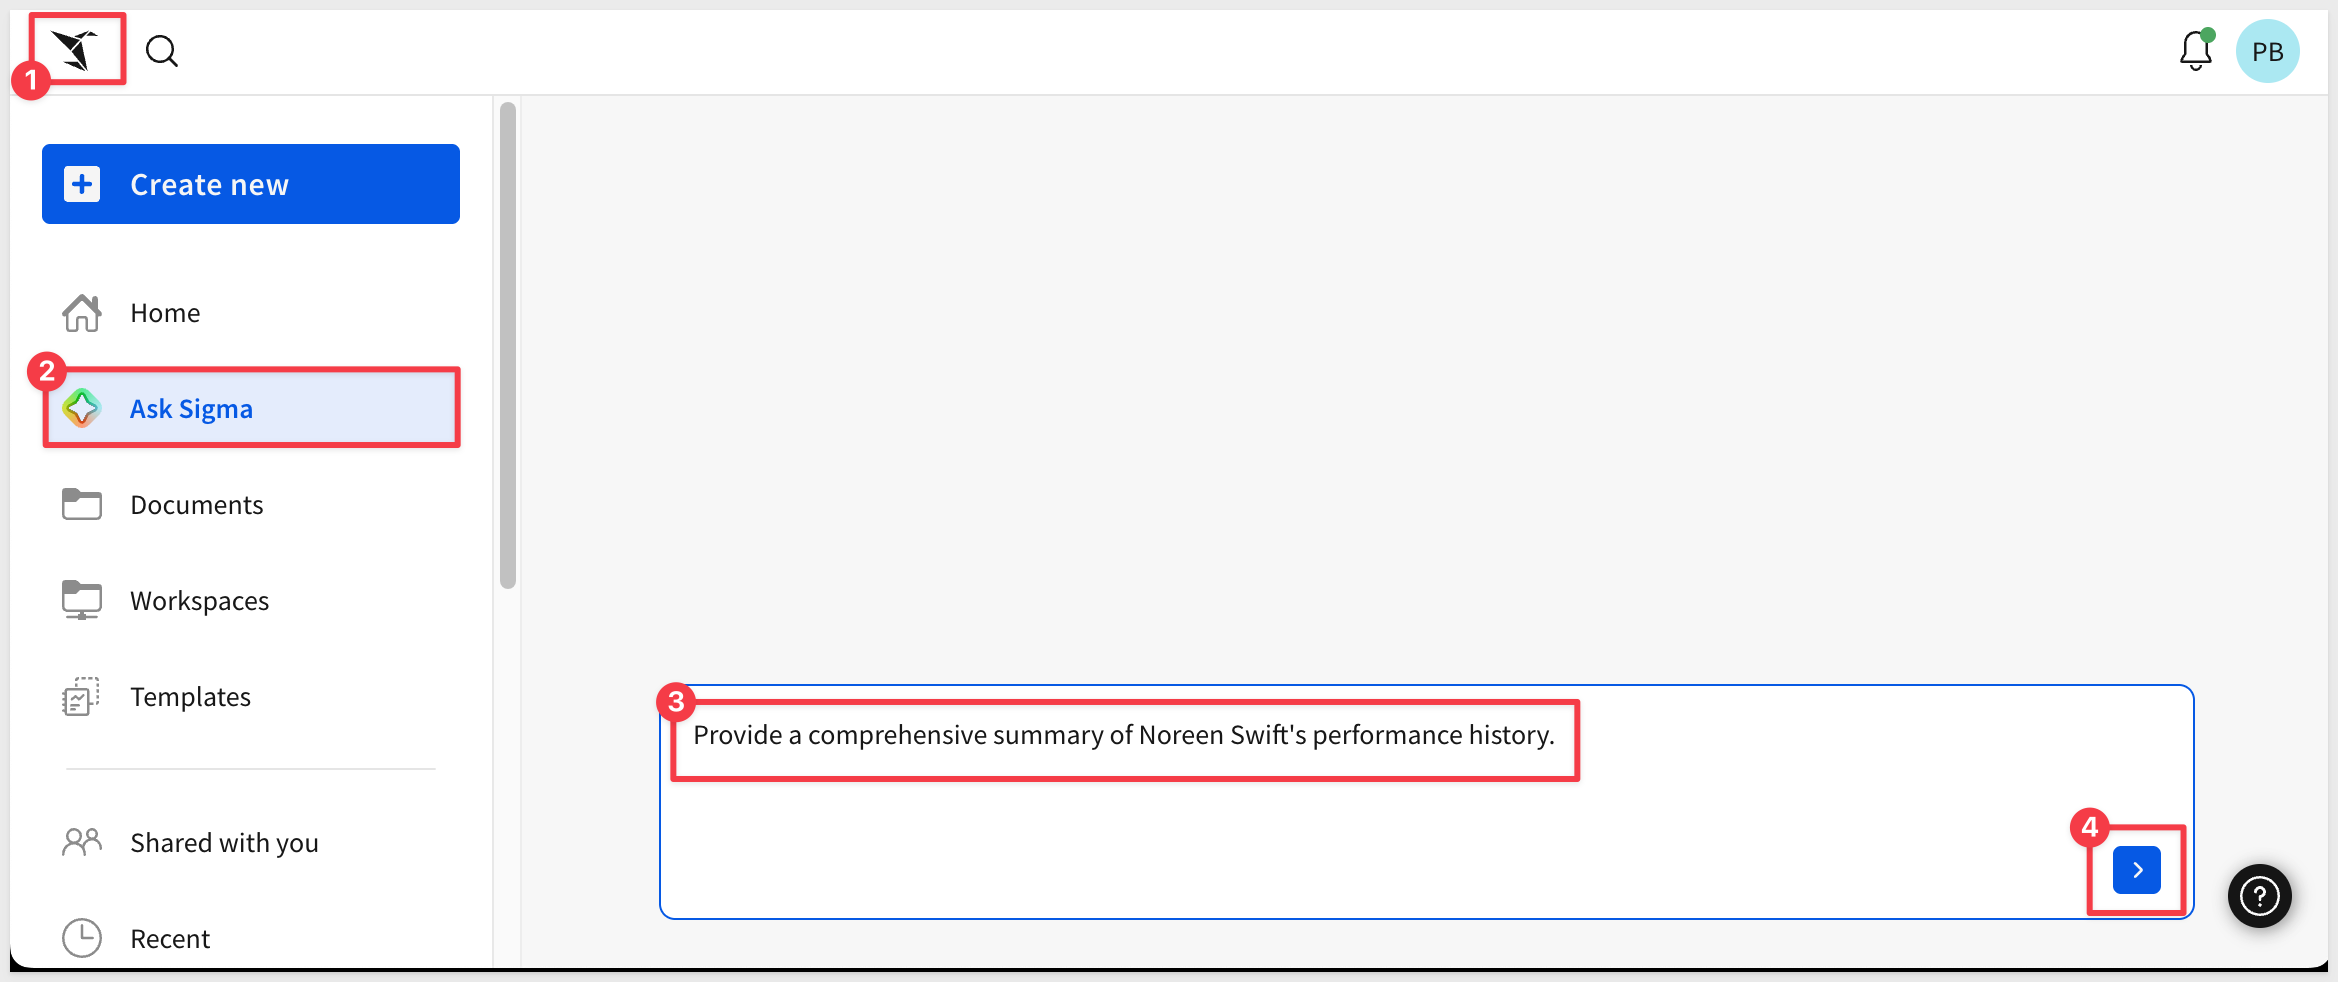
Step 6: Click the  to return to the homepage and navigate to
Ask Sigma and enter the following prompt.
Provide a comprehensive summary of Noreen Swift's performance history.
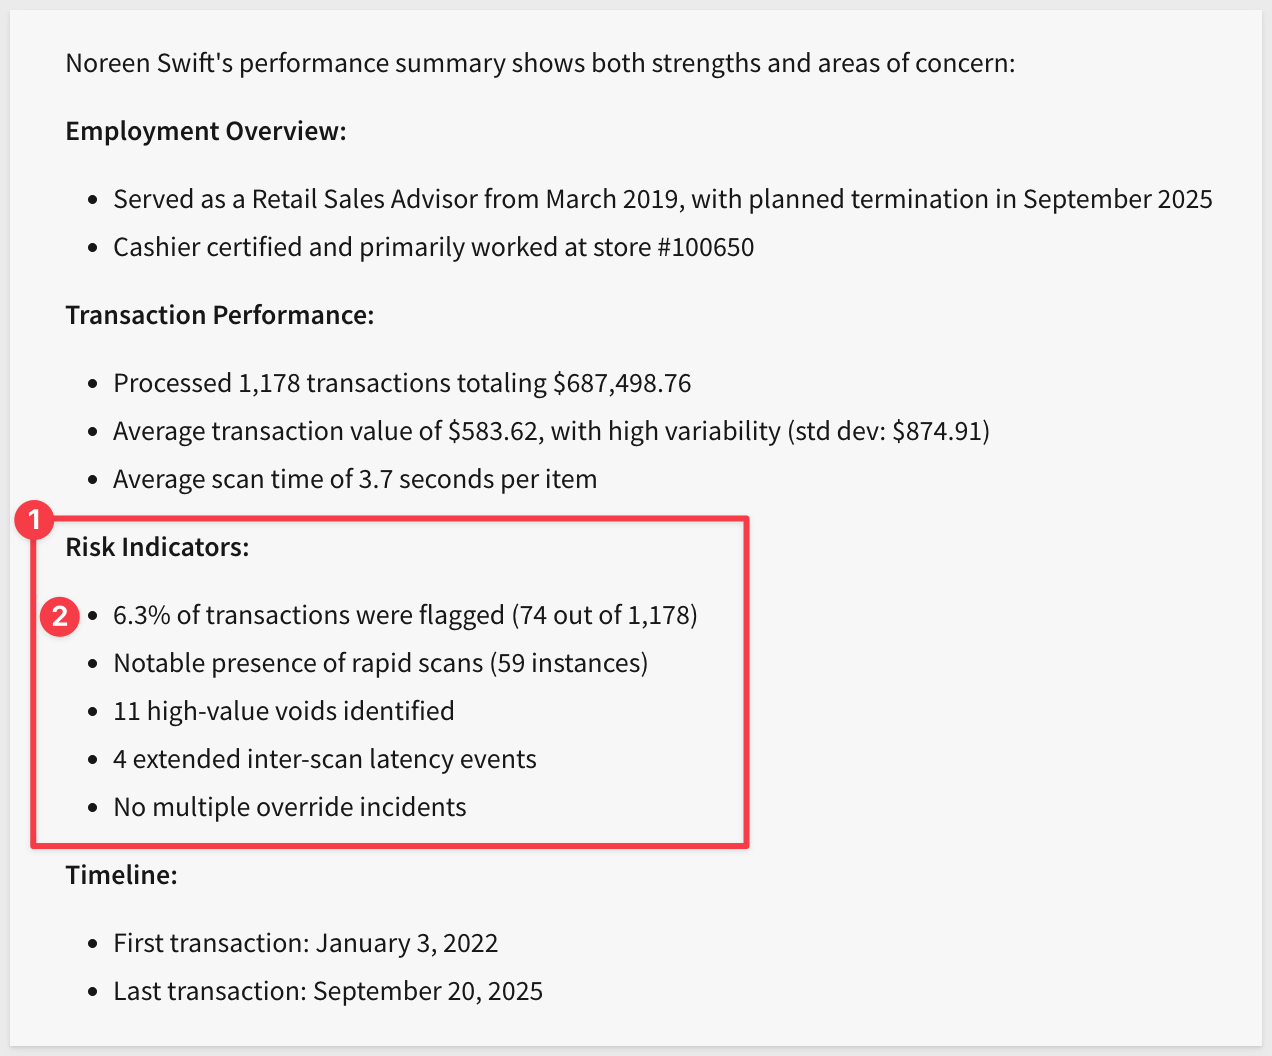
We can see a large number of flagged transactions:
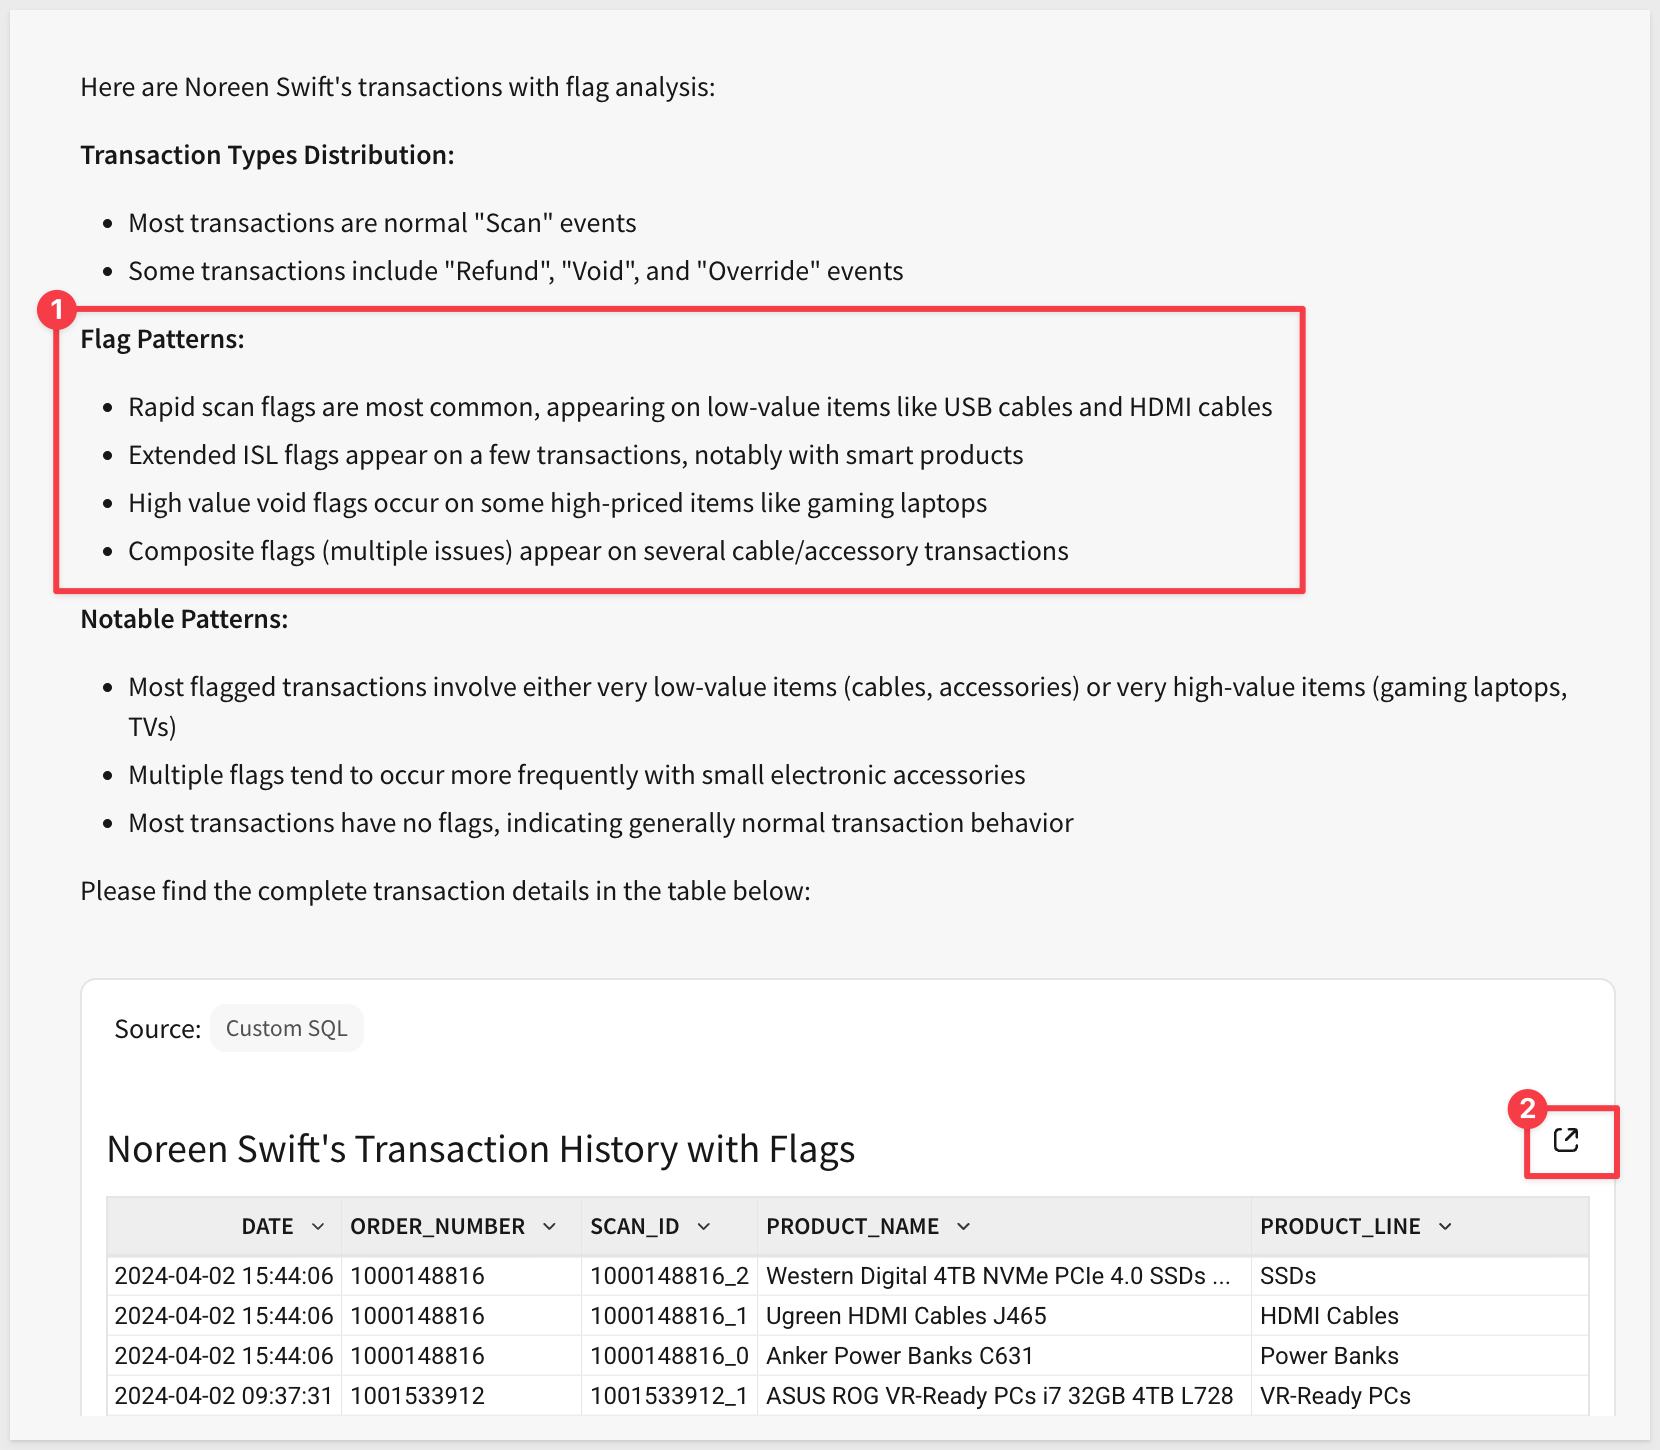
Step 7: Ask a follow-up question to see the flags in action:
List all transactions handled by Noreen along with the static flags.
Again, we get lots of information back, but we will want to dig deeper.
Step 8: Click the Open in Workbook icon in the Ask Sigma view to move into a full Sigma workbook for a deeper technical investigation:
Analyze a Specific Transaction
Step 9: With the workbook open, locate the HIGH_VALUE_VOID_FLAG column. Apply a filter to show only records with a TRUE value:
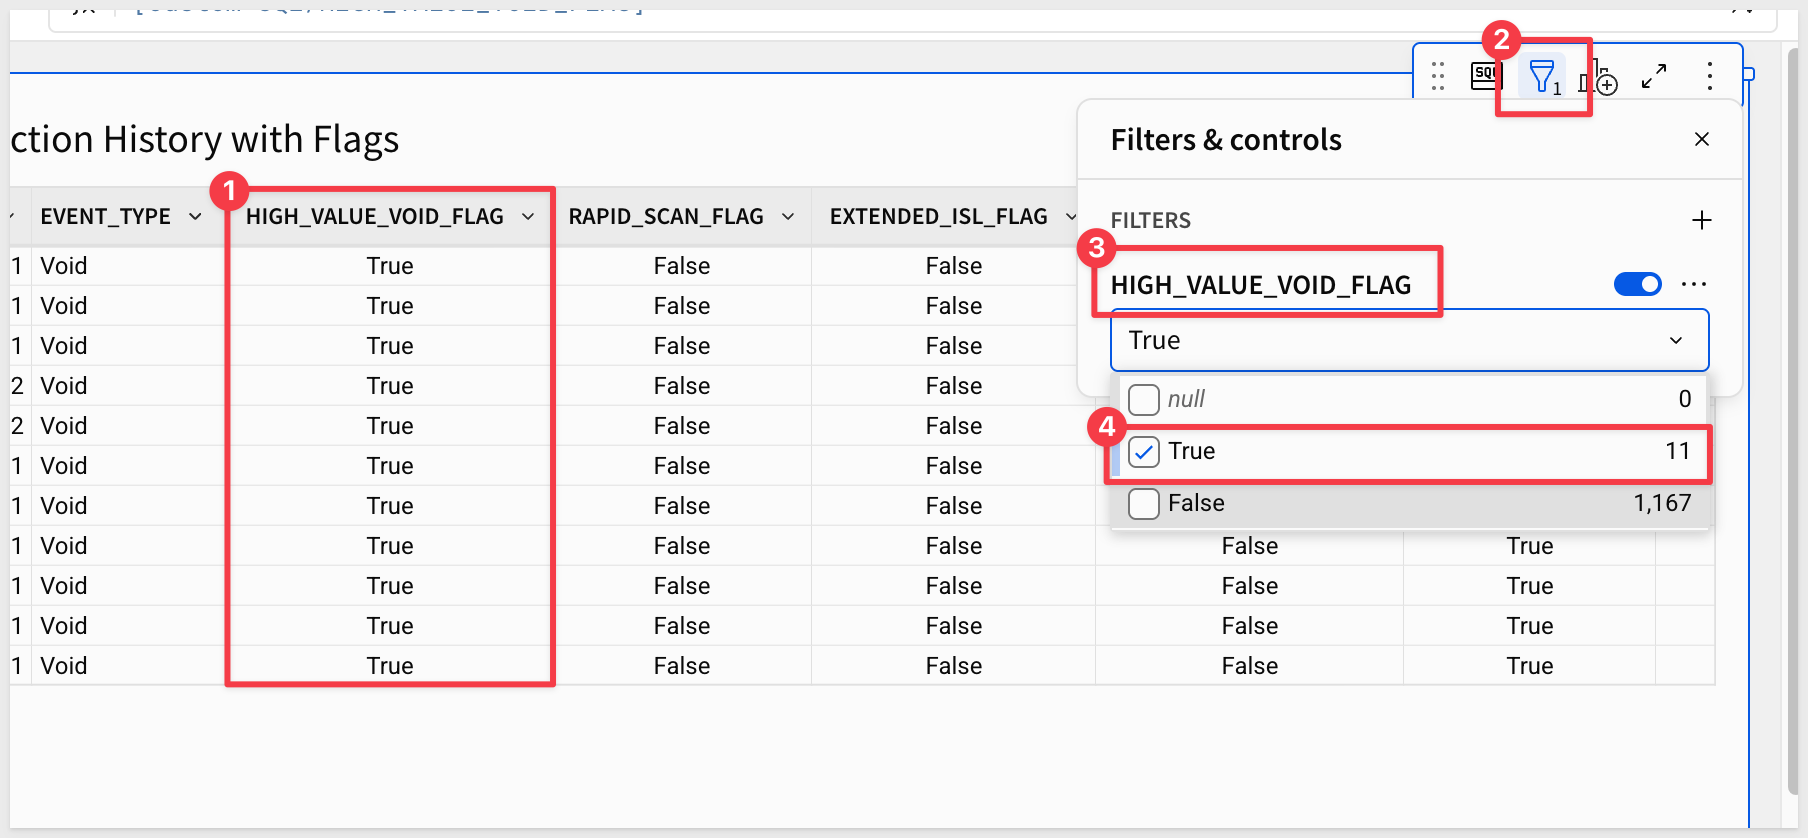
Sort the data by Price in descending order to focus on the high-value alerts:
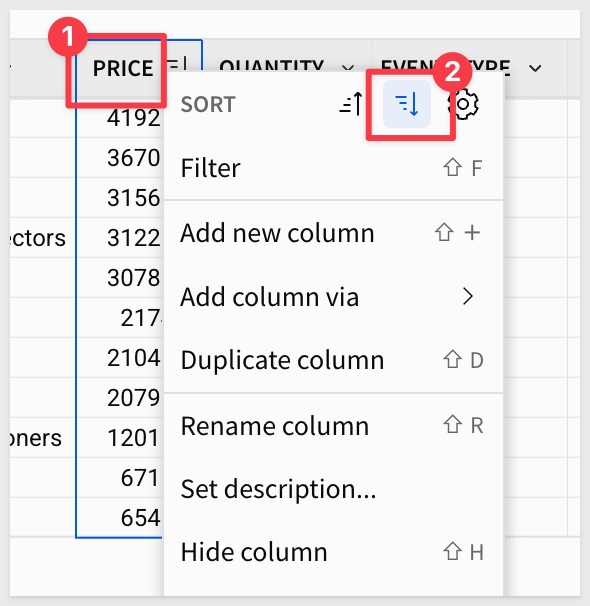
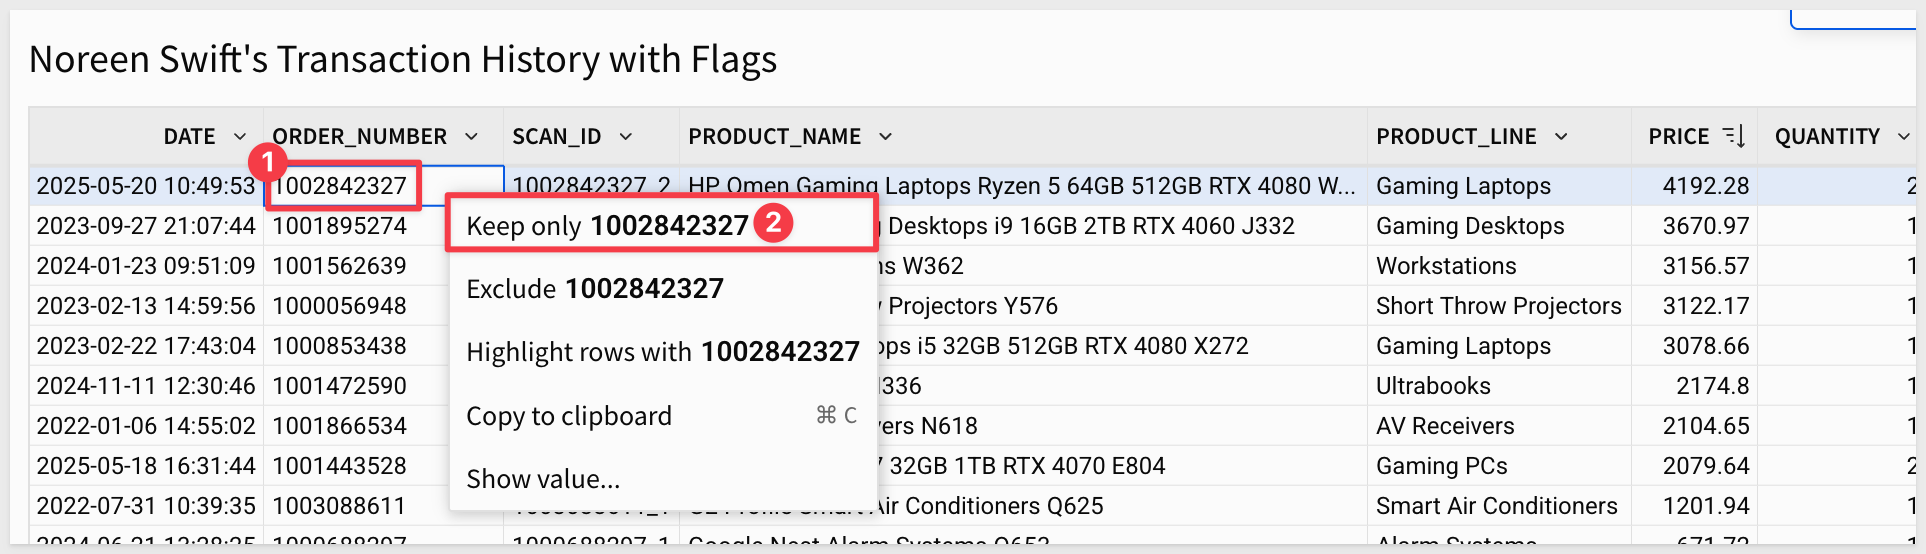
Step 10: Order Number 100284237 stands out. It contains a high-priced item that was voided. Click on the order number and select Keep only 100284237.
This creates a specific filter for this transaction:
Step 11: Disable the filter on HIGH_VALUE_VOID_FLAG to view all items within this specific order:
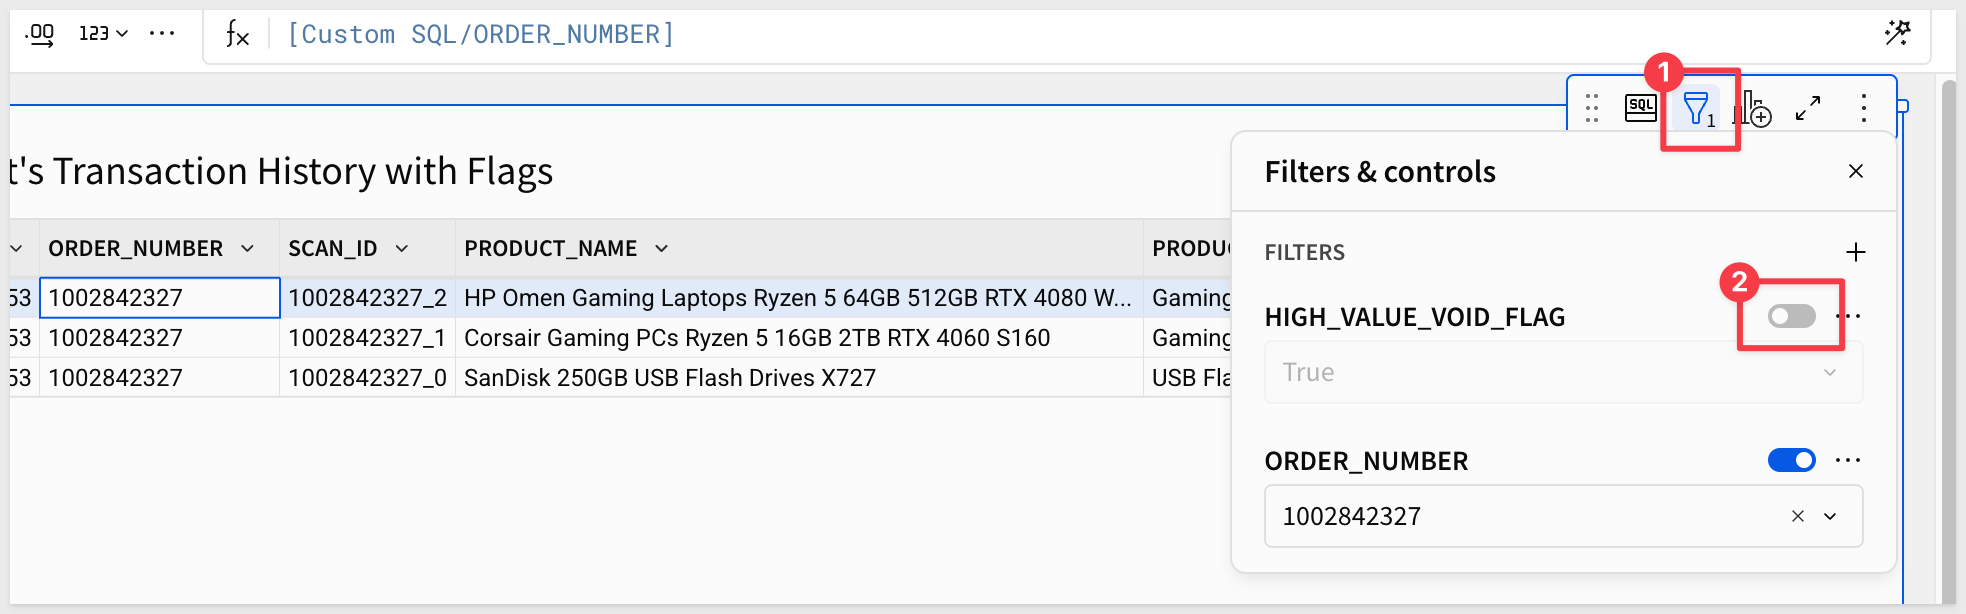
Key Findings
- The Alert: Two HP Omen Gaming Laptops ($4,192.28) were voided
- The Context: Also, two Corsair Gaming PCs ($1,450.48) were scanned and paid for:

Our static EBR rule flagged the $3,000+ void as suspicious immediately. However, in this case, this wasn't "sweethearting" or theft. The customer simply decided the high-end laptop was too expensive after already purchasing a different gaming PC. Noreen Swift followed proper procedure, yet the system flagged her as a risk.
Conclusion
Static rules create false alerts for veteran employees doing their jobs correctly. To protect Big Buys, we must transition to an ML-powered Anomaly Detection engine that can distinguish between suspicious behavior and standard customer exchanges.
Objective: In this module, you will compare the flawed "static rules" from Module 1 with a Python-based machine learning model. You will detect "Sweethearting" by analyzing the time gap between scans (Inter-Scan Latency), a behavioral pattern that is impossible to fake.
Create Your Working Workbook
Step 1: Return to the template and choose Explore to make a workbook out of the template:
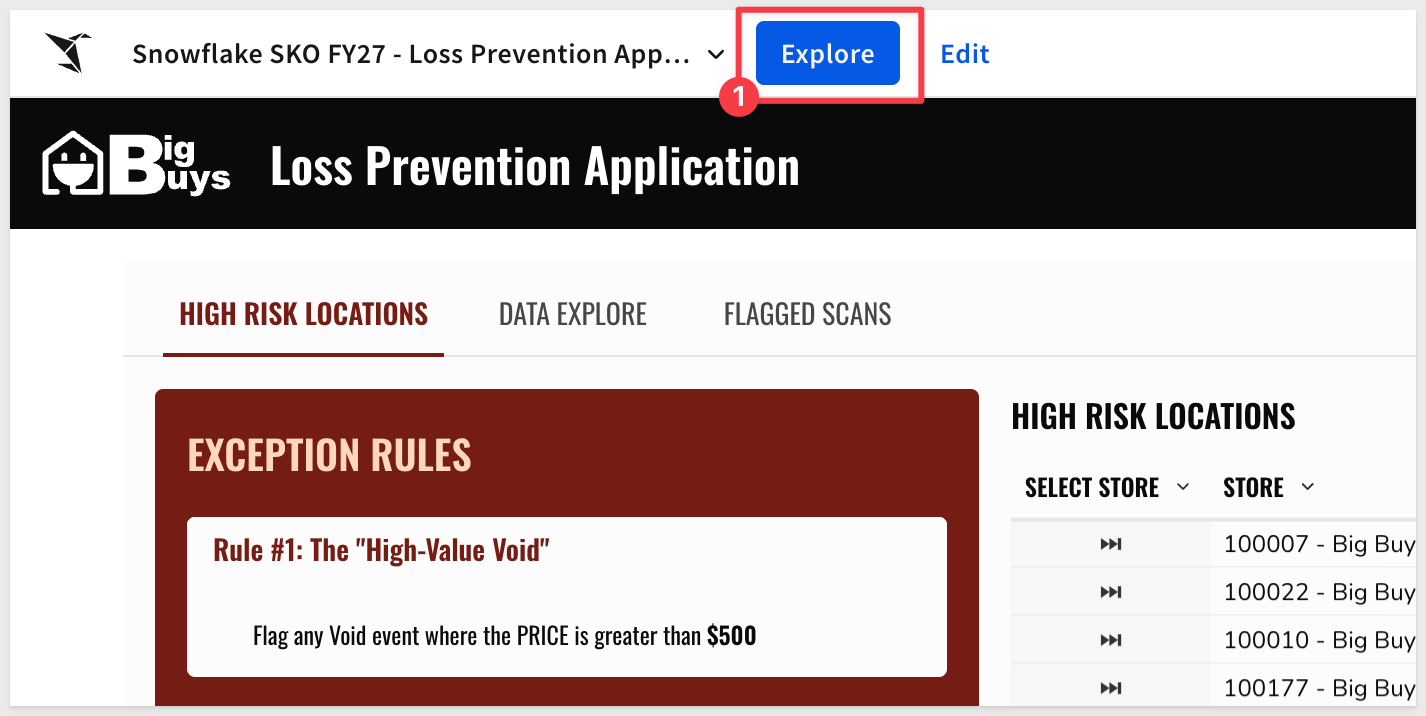
Click Save as and name the workbook LOSS_PREVENTION_APP_YOUR_NAME.
Prepare the Data
Step 2: Navigate to the Anomaly Detection page.
You will see the POS table (BIG_BUYS_POS_ENRICHED_SHRINK_FLAGS) which includes the store filter from Module 1:
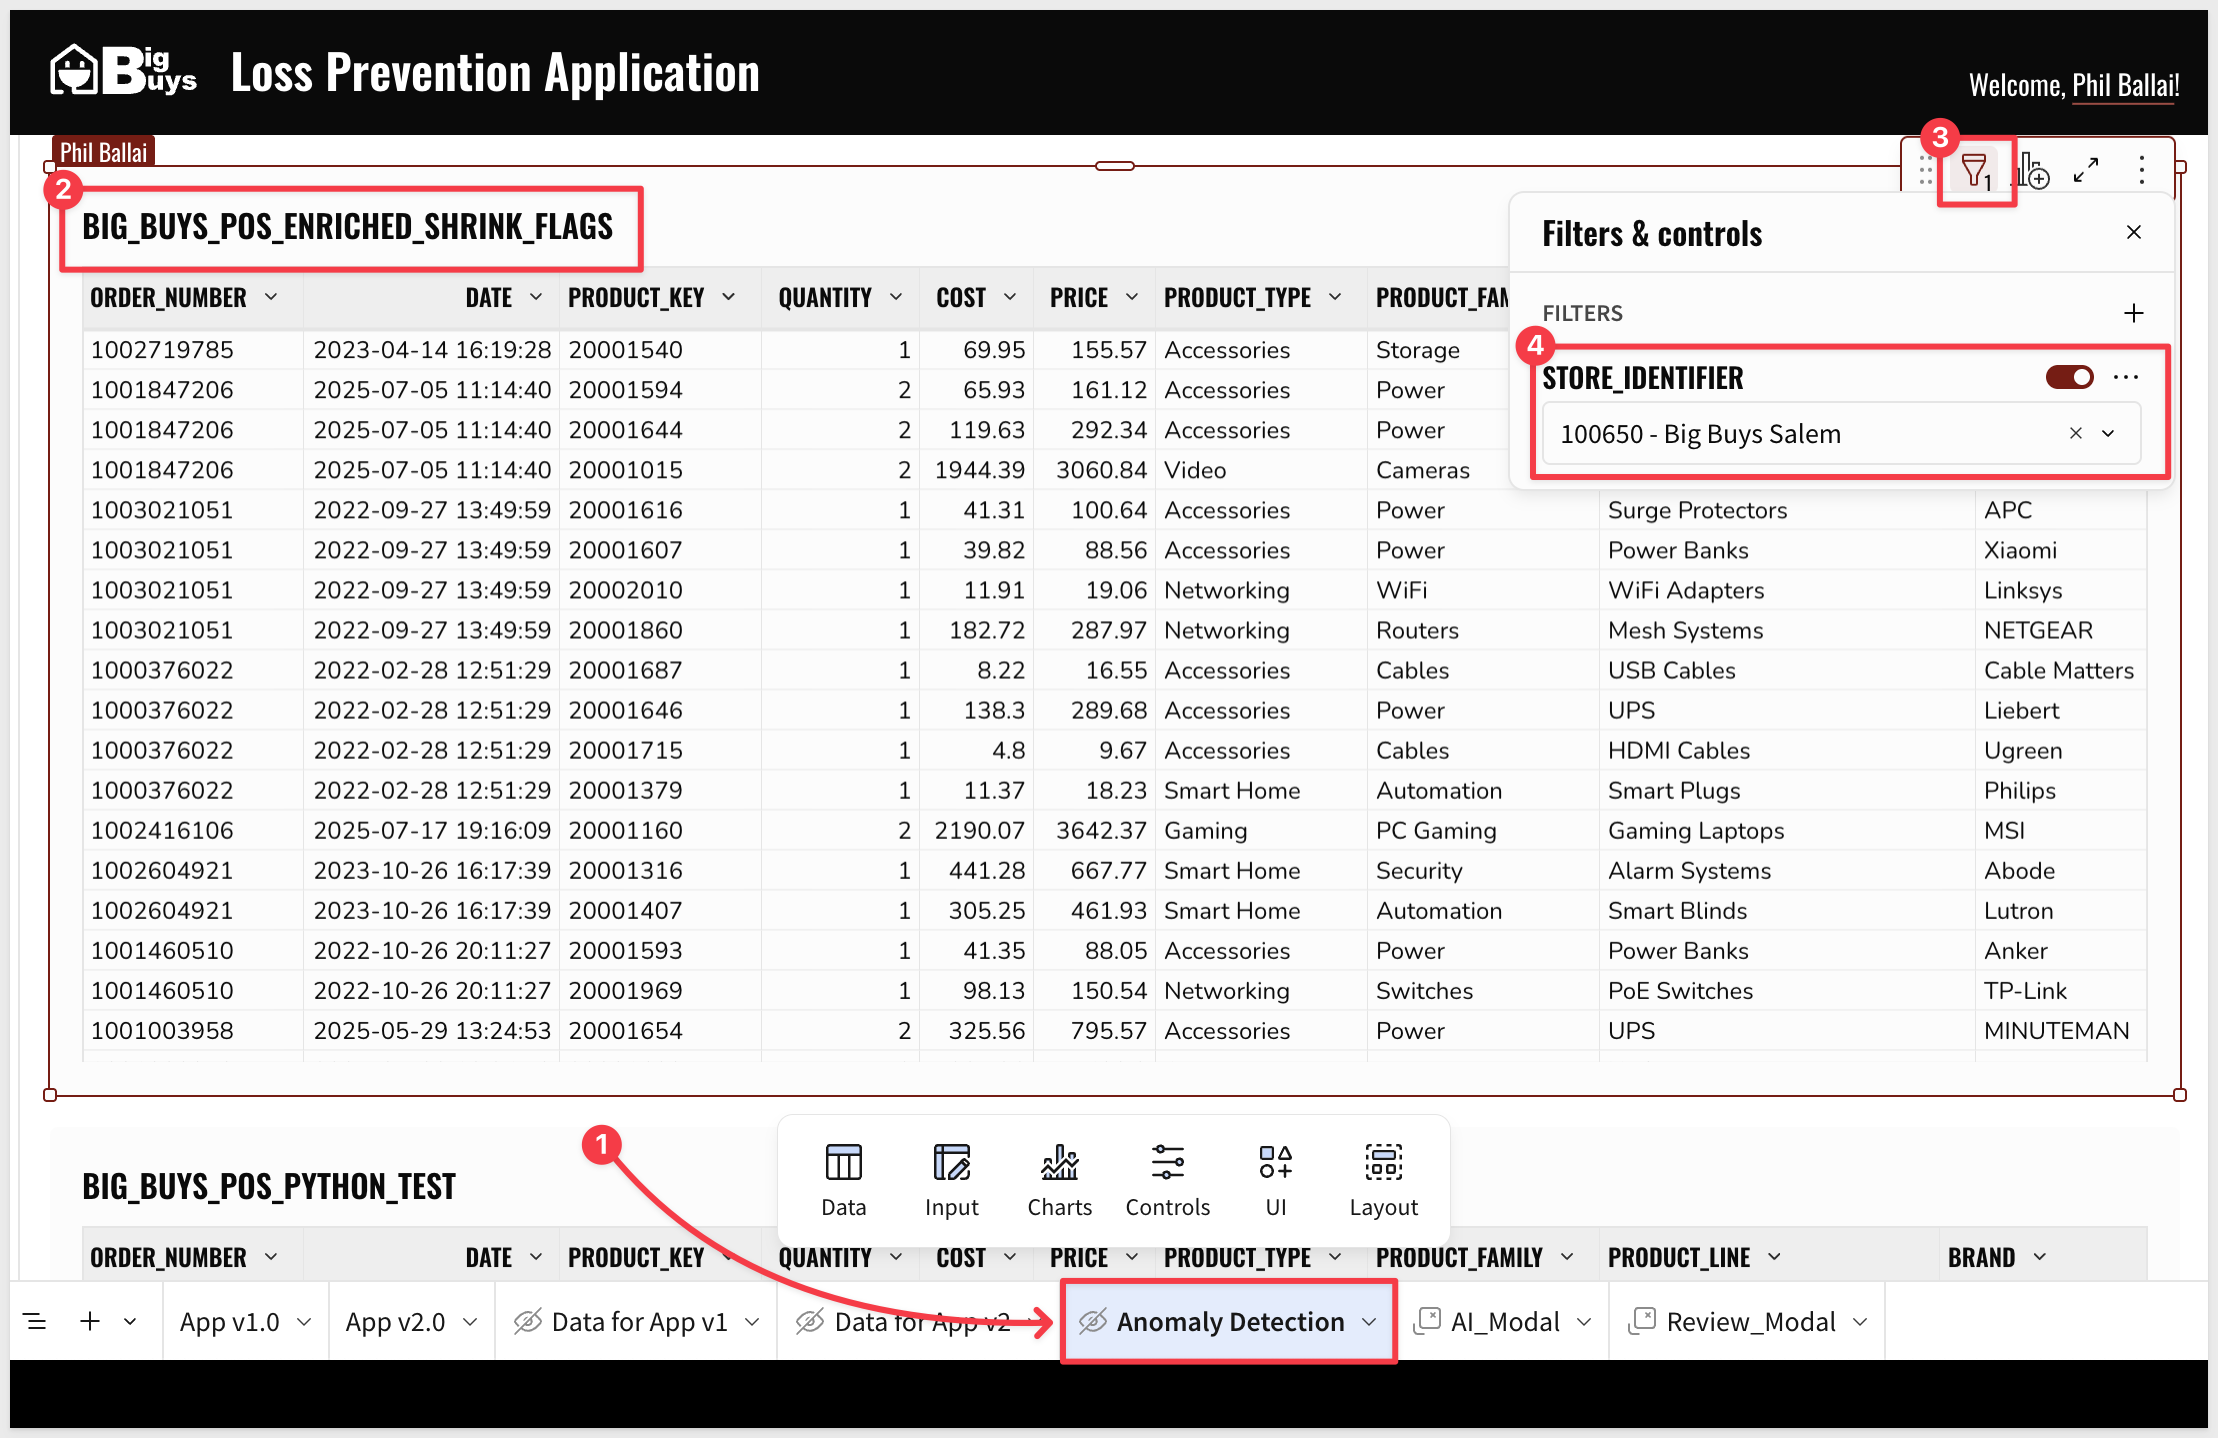
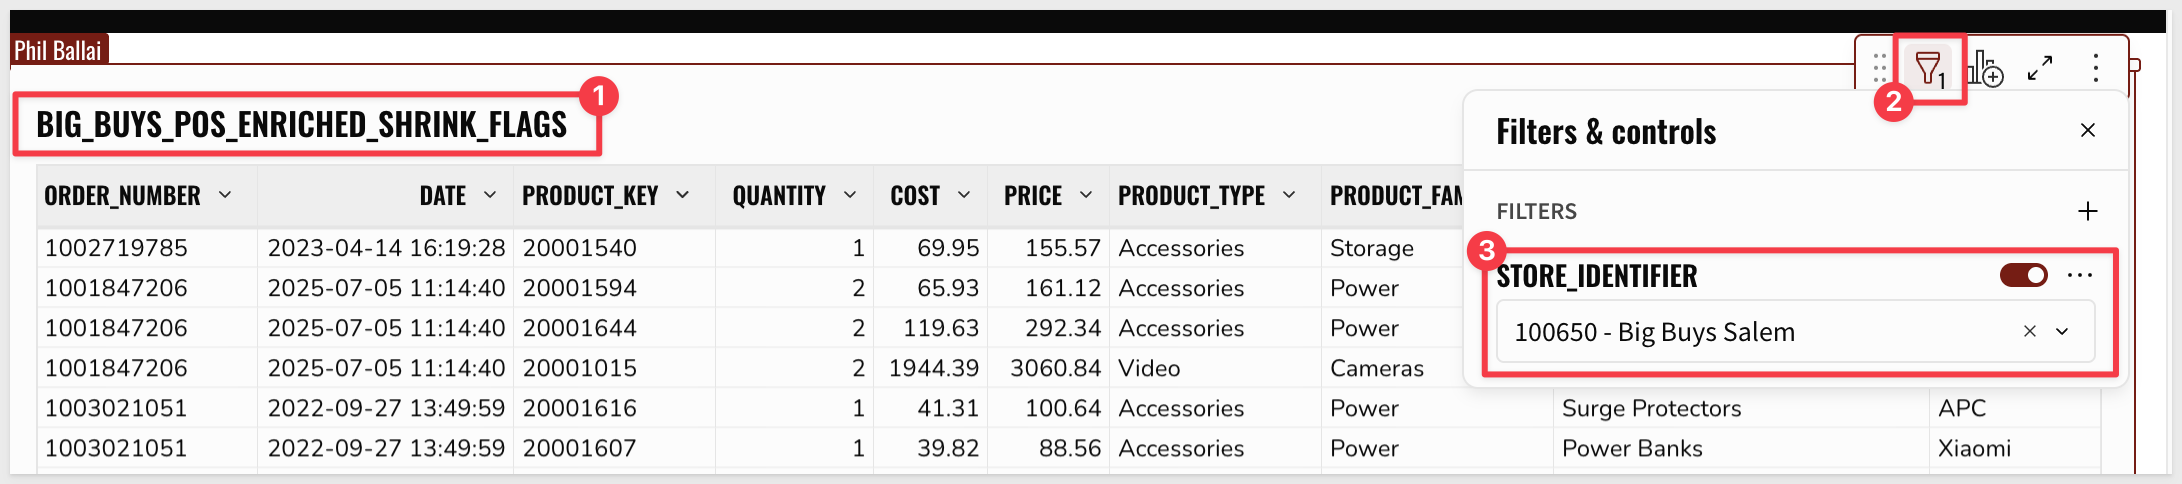
Step 3 (if required): Add a filter on the STORE_IDENTIFIER column. Select Store 100650 - Big Buys Salem:
Step 4: Create a Child Table element from the filtered POS BIG_BUYS_POS_ENRICHED_SHRINK_FLAGS table:
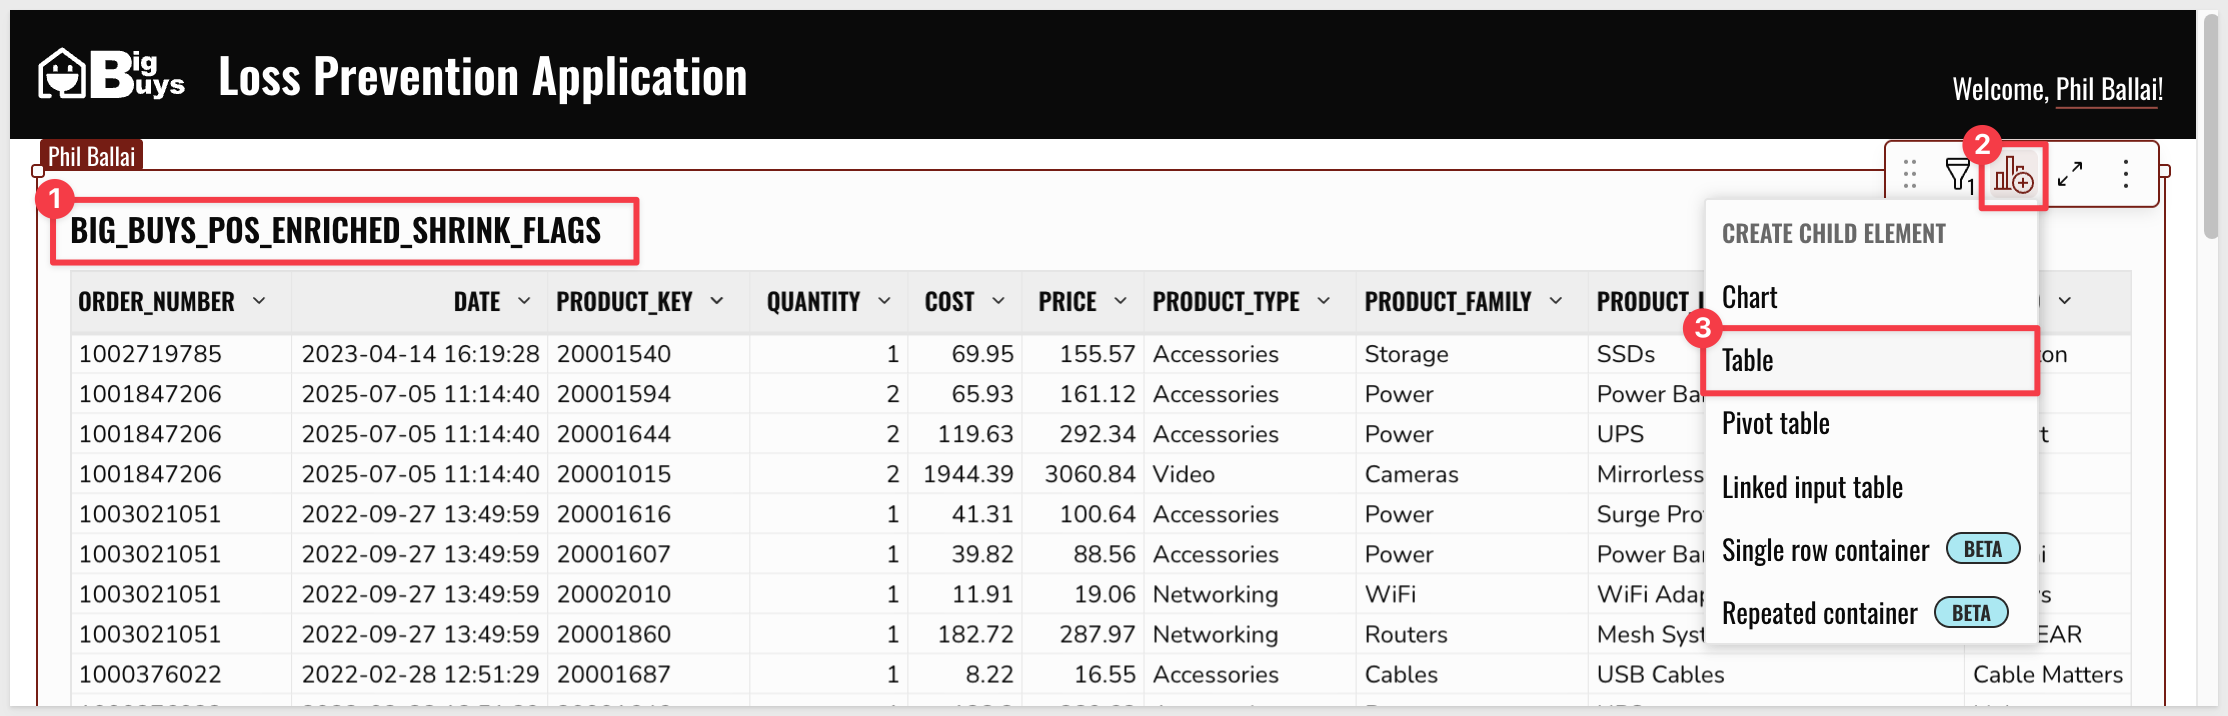
Rename this new table: BIG_BUYS_POS_PYTHON_TEST
Add the Python Anomaly Detection Script
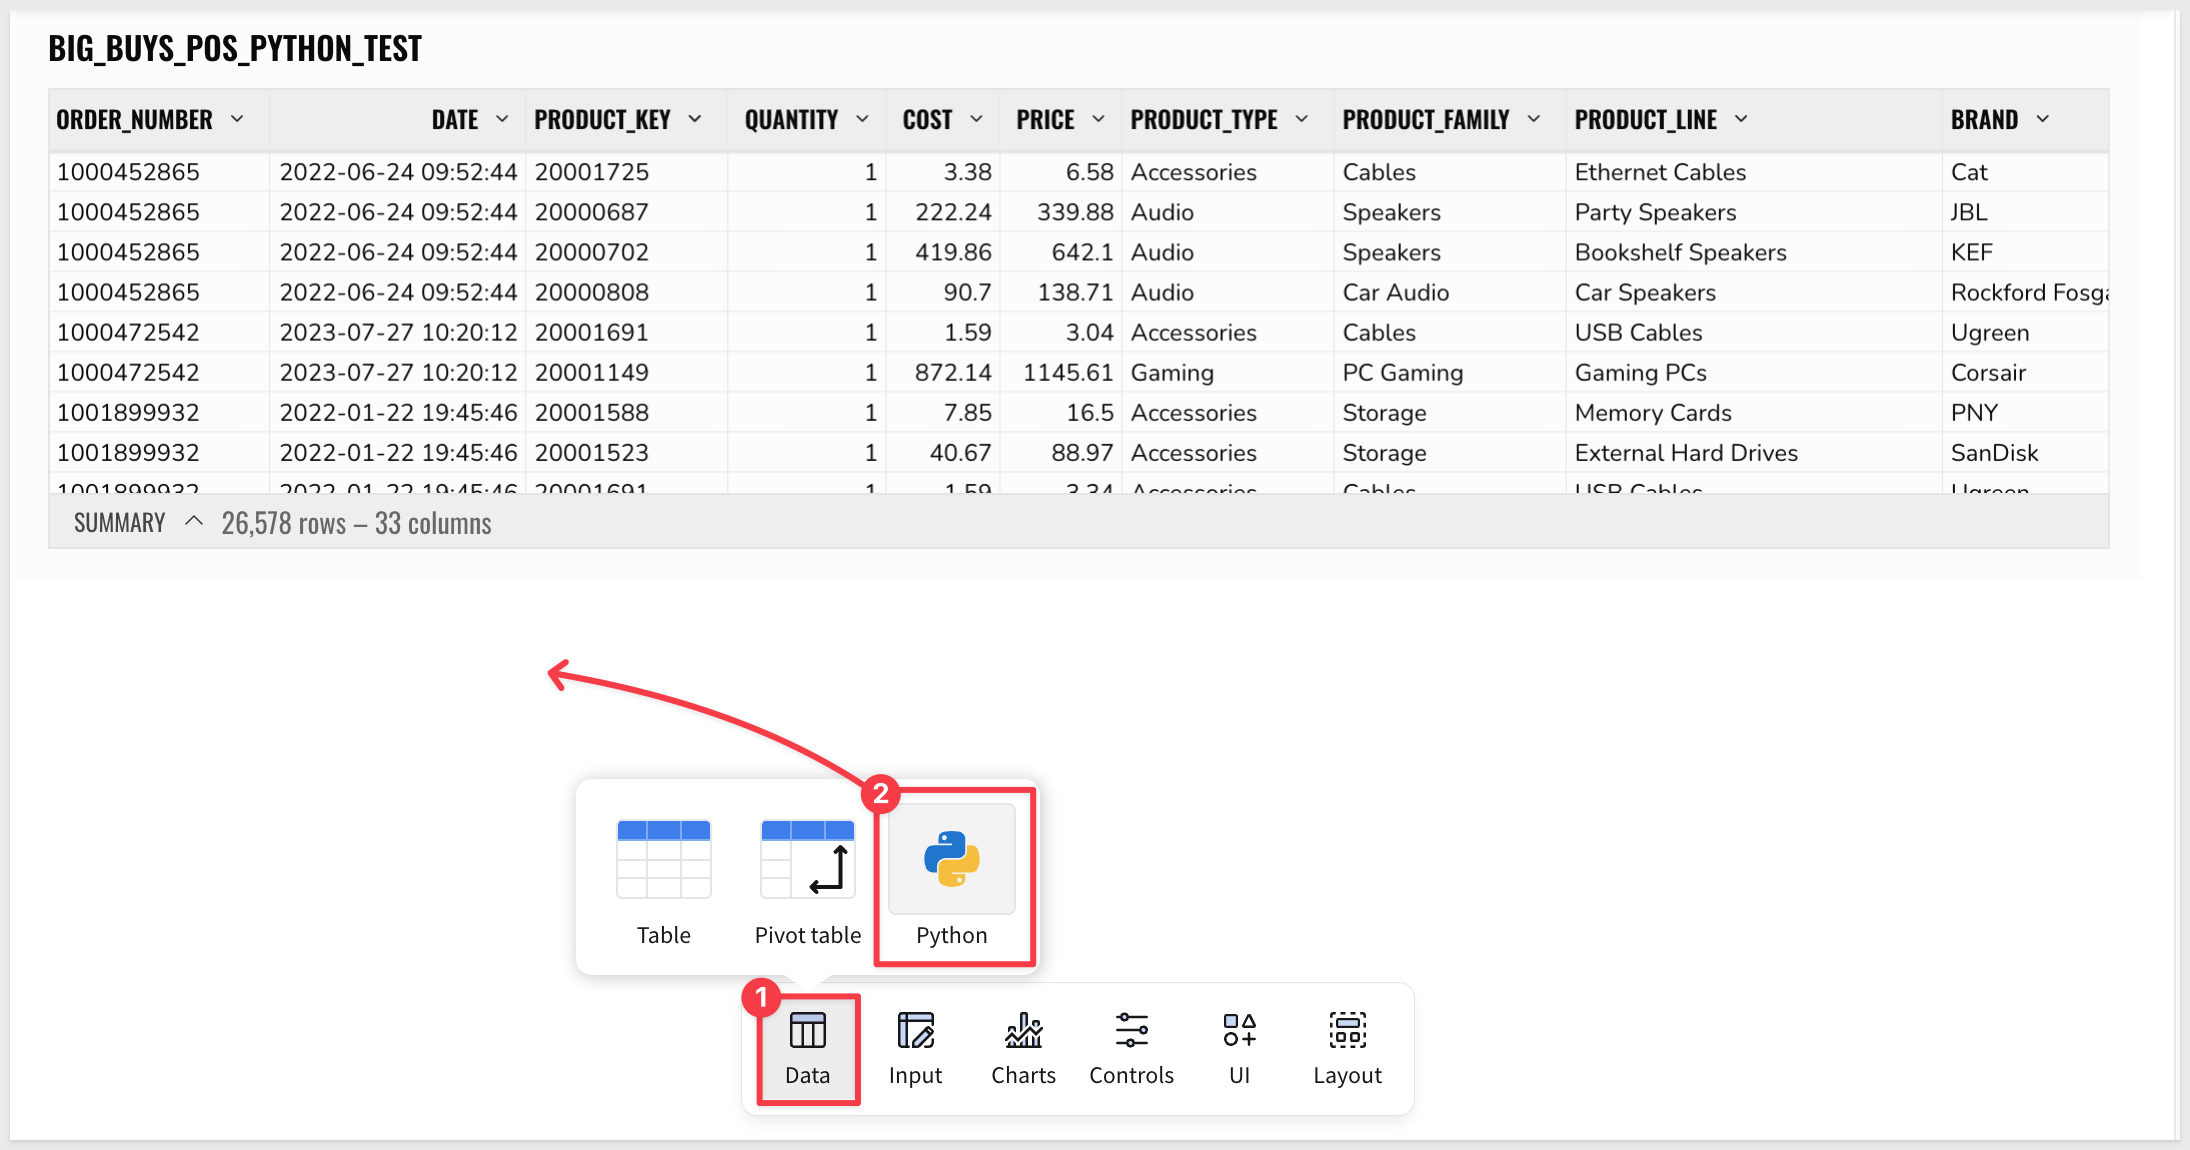
Step 5: Add a Python element from the Element bar > Data group, placing it below the BIG_BUYS_POS_PYTHON_TEST child table:
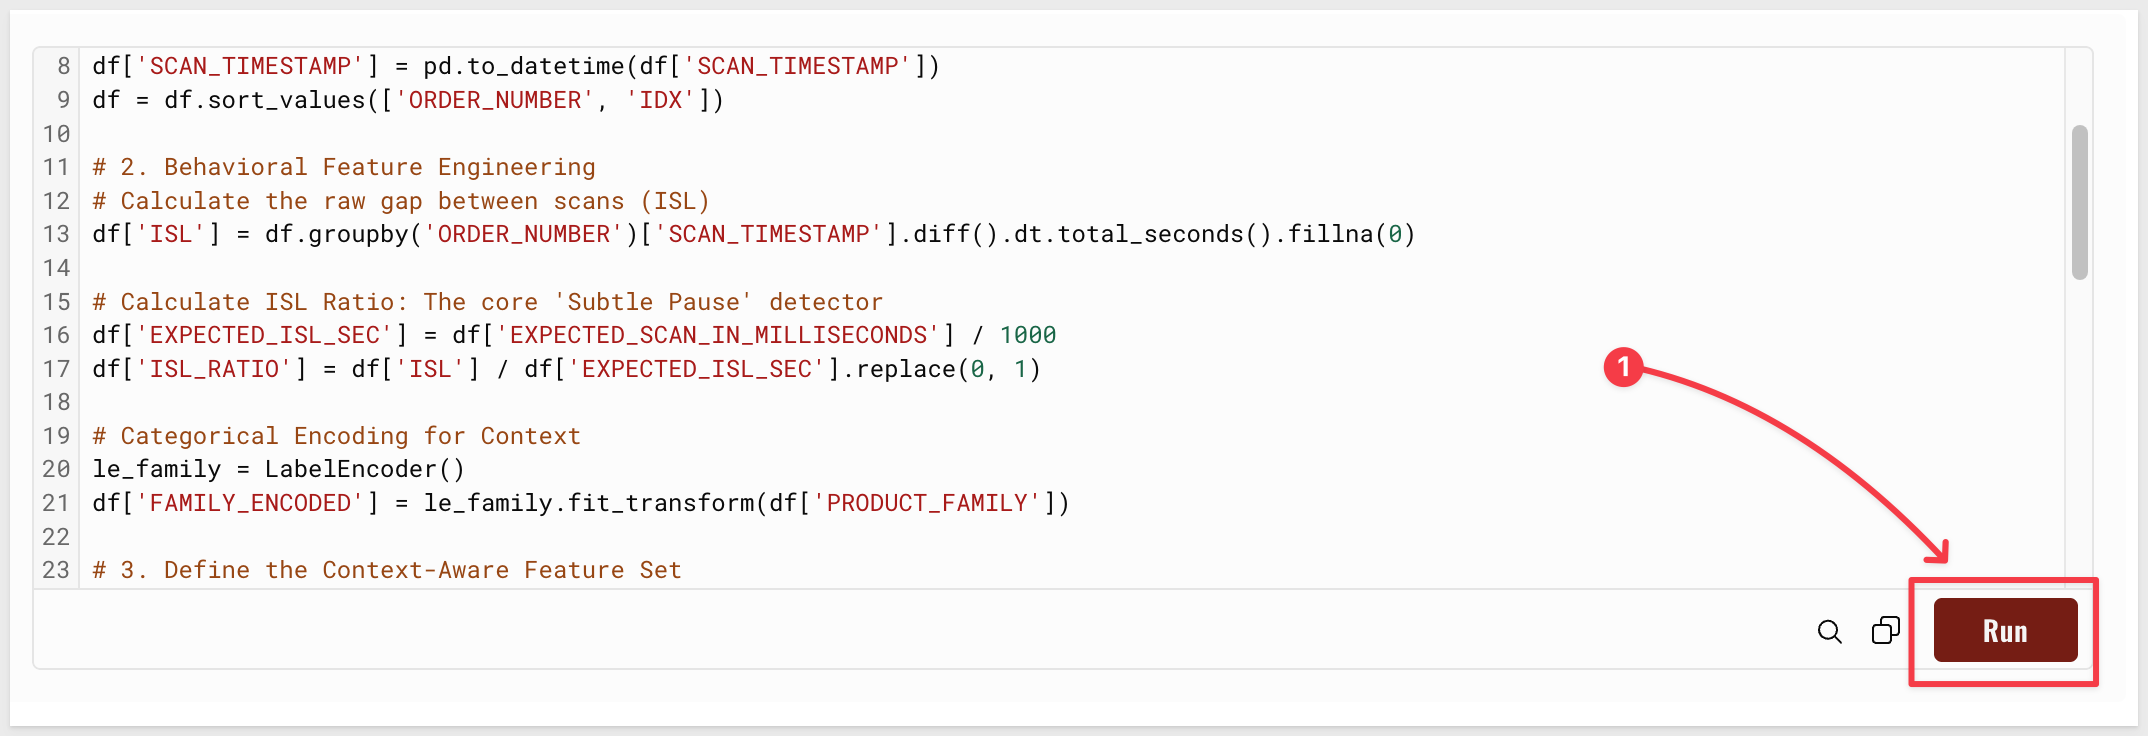
The Python script for anomaly detection is provided below. The code is commented so that you can understand how it works:
import pandas as pd

import numpy as np
from sklearn.ensemble import IsolationForest
from sklearn.preprocessing import LabelEncoder, StandardScaler

# 1. Get Sigma data
df = sigma.get_element('BIG_BUYS_POS_PYTHON_TEST').to_pandas()
df['SCAN_TIMESTAMP'] = pd.to_datetime(df['SCAN_TIMESTAMP'])
df = df.sort_values(['ORDER_NUMBER', 'IDX'])

# 2. Behavioral Feature Engineering
# Calculate the raw gap between scans (ISL)
df['ISL'] = df.groupby('ORDER_NUMBER')['SCAN_TIMESTAMP'].diff().dt.total_seconds().fillna(0)

# Calculate ISL Ratio: The core 'Subtle Pause' detector
df['EXPECTED_ISL_SEC'] = df['EXPECTED_SCAN_IN_MILLISECONDS'] / 1000
df['ISL_RATIO'] = df['ISL'] / df['EXPECTED_ISL_SEC'].replace(0, 1)

# Categorical Encoding for Context
le_family = LabelEncoder()
df['FAMILY_ENCODED'] = le_family.fit_transform(df['PRODUCT_FAMILY'])

# 3. Define the Context-Aware Feature Set
# Including TENURE_DAYS prevents flagging efficient veterans
features = ['PRICE', 'TENURE_DAYS', 'ISL', 'ISL_RATIO', 'FAMILY_ENCODED']
X = df[features].fillna(0)

# 4. Train the Isolation Forest
# Contamination set to 1% to isolate the most extreme outliers
model = IsolationForest(contamination=0.01, random_state=42)
df['STATUS_CODE'] = model.fit_predict(X)

# 5. Adjusted Scoring Logic
# Capture the raw anomaly scores (typically between -0.135 and +0.12)
df['RAW_SCORE'] = model.decision_function(X)

# Transform RAW_SCORE to a 0-100 Risk Scale
# Logic: Lower raw scores (negative) = Higher Risk
min_raw = df['RAW_SCORE'].min()
max_raw = df['RAW_SCORE'].max()
df['RISK_SCORE'] = 100 * (1 - (df['RAW_SCORE'] - min_raw) / (max_raw - min_raw))

# Final Status Assignment
df['STATUS'] = np.where(df['STATUS_CODE'] == -1, 'Anomaly', 'Normal')
df['ML_ANOMALY_FLAG'] = np.where(df['STATUS_CODE'] == -1, True, False)

sigma.output('python_output', df)
Step 6: Copy and paste the code into the Python element, replacing the sample code:
Step 7: Click Run (lower right corner of the element):
Once the output is generated, click on the output result. Create a child Table element from the Python output:
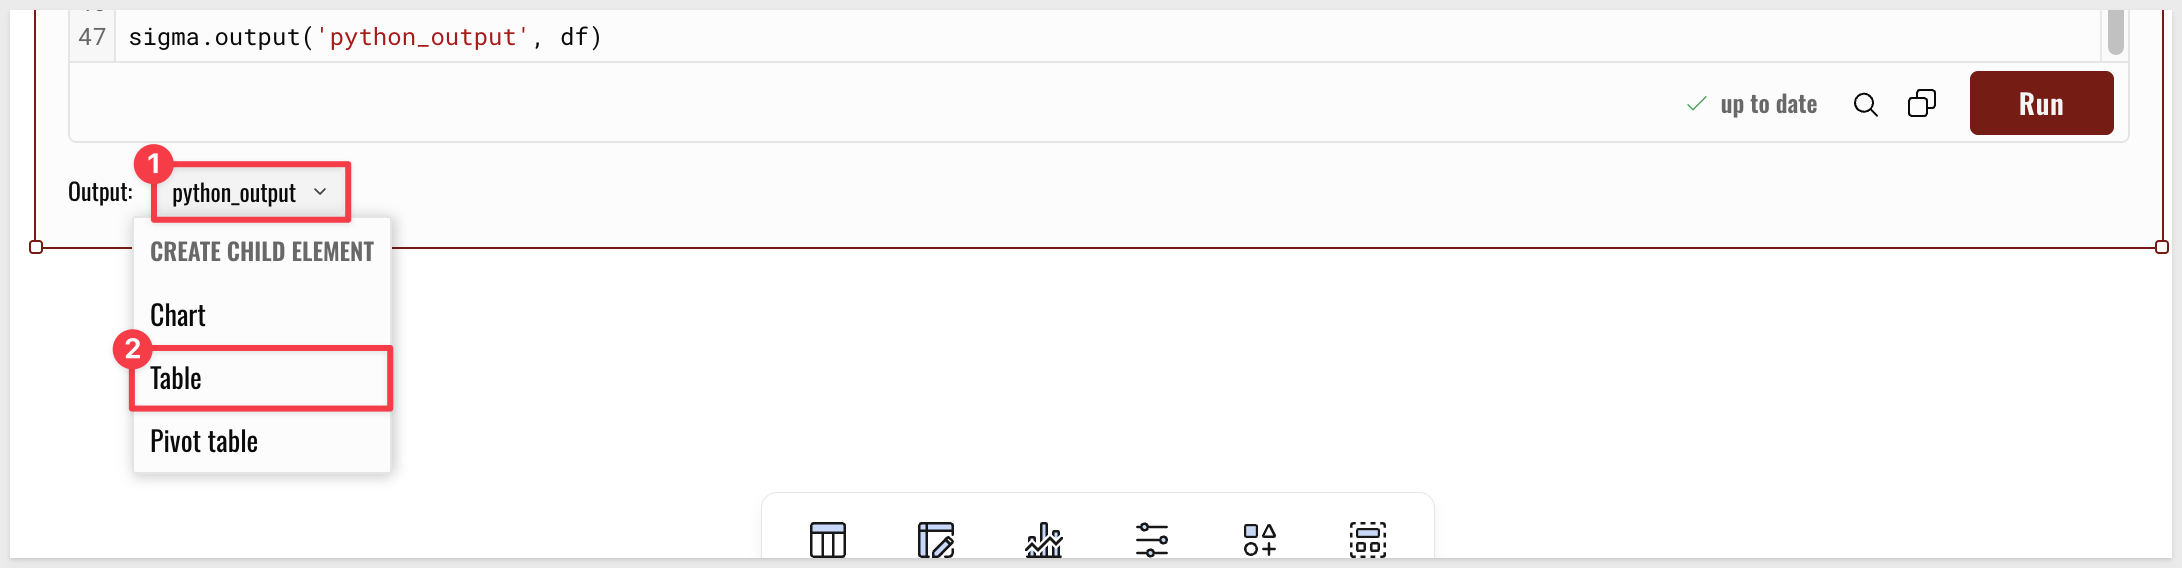
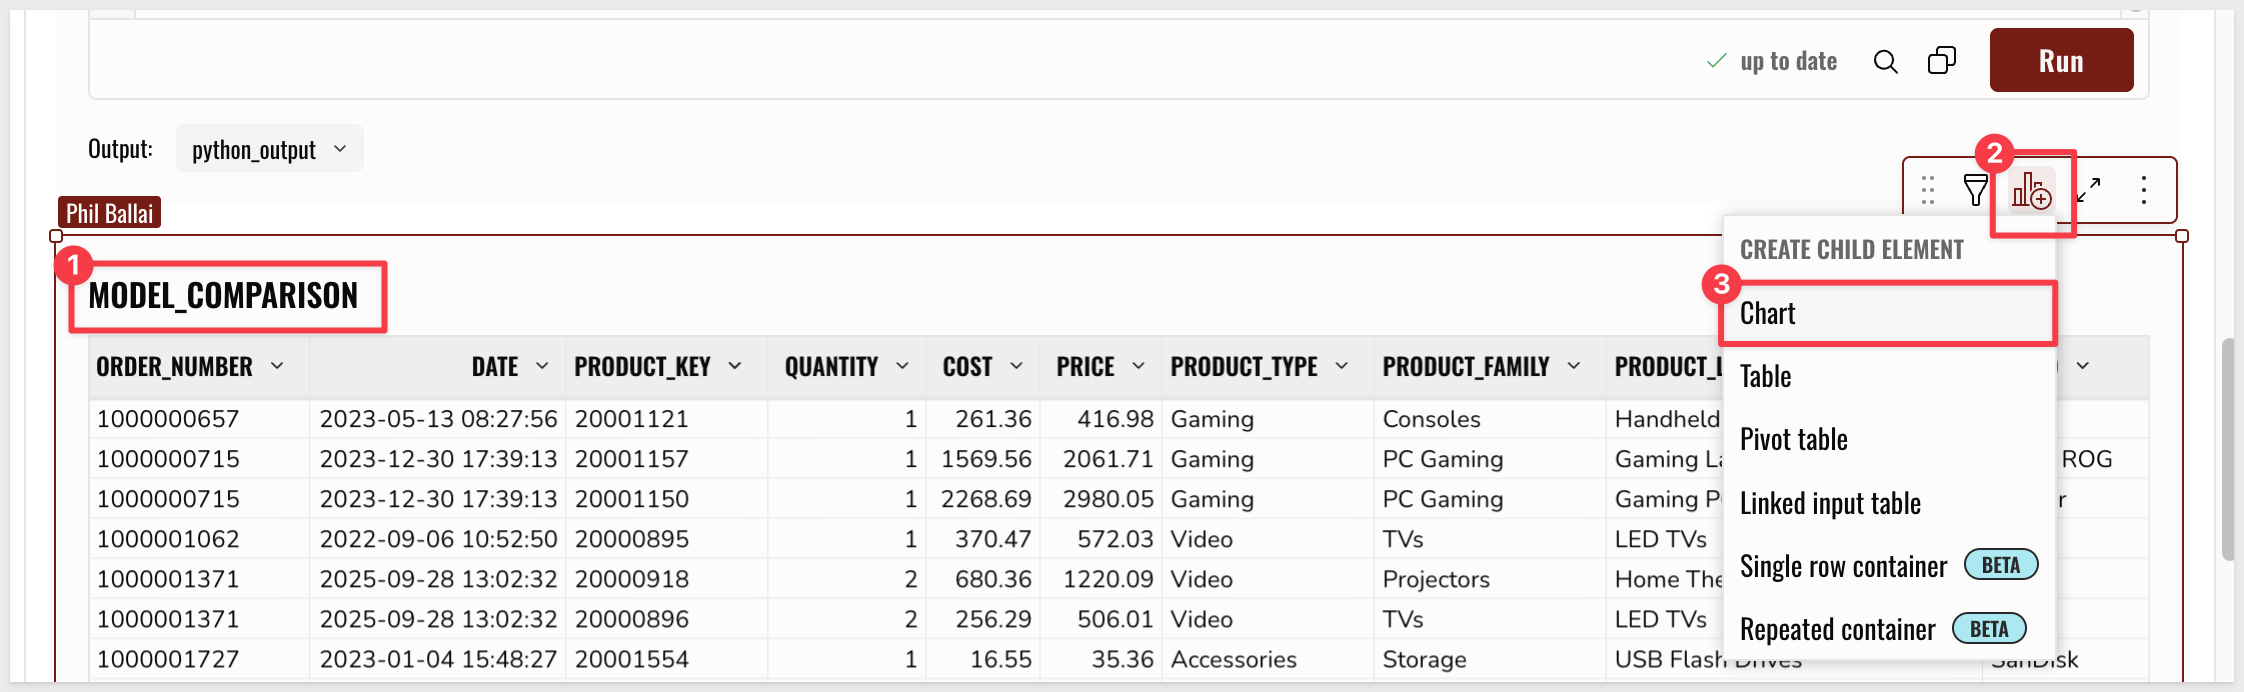
Rename the table MODEL_COMPARISON.
Visualize the Comparison
We will now use this table to visualize the output to compare the Python model against the original static rules.
Step 8: Create a child Chart from the MODEL_COMPARISON table:
- Chart Type: Combo
- X-axis: Add
DATEand Truncate it tomonth - Y-axis: Add
COMPOSITE_FLAGand name itStatic Rules - Y-axis: Add
ML_ANOMALY_FLAGand name itPYTHON ML
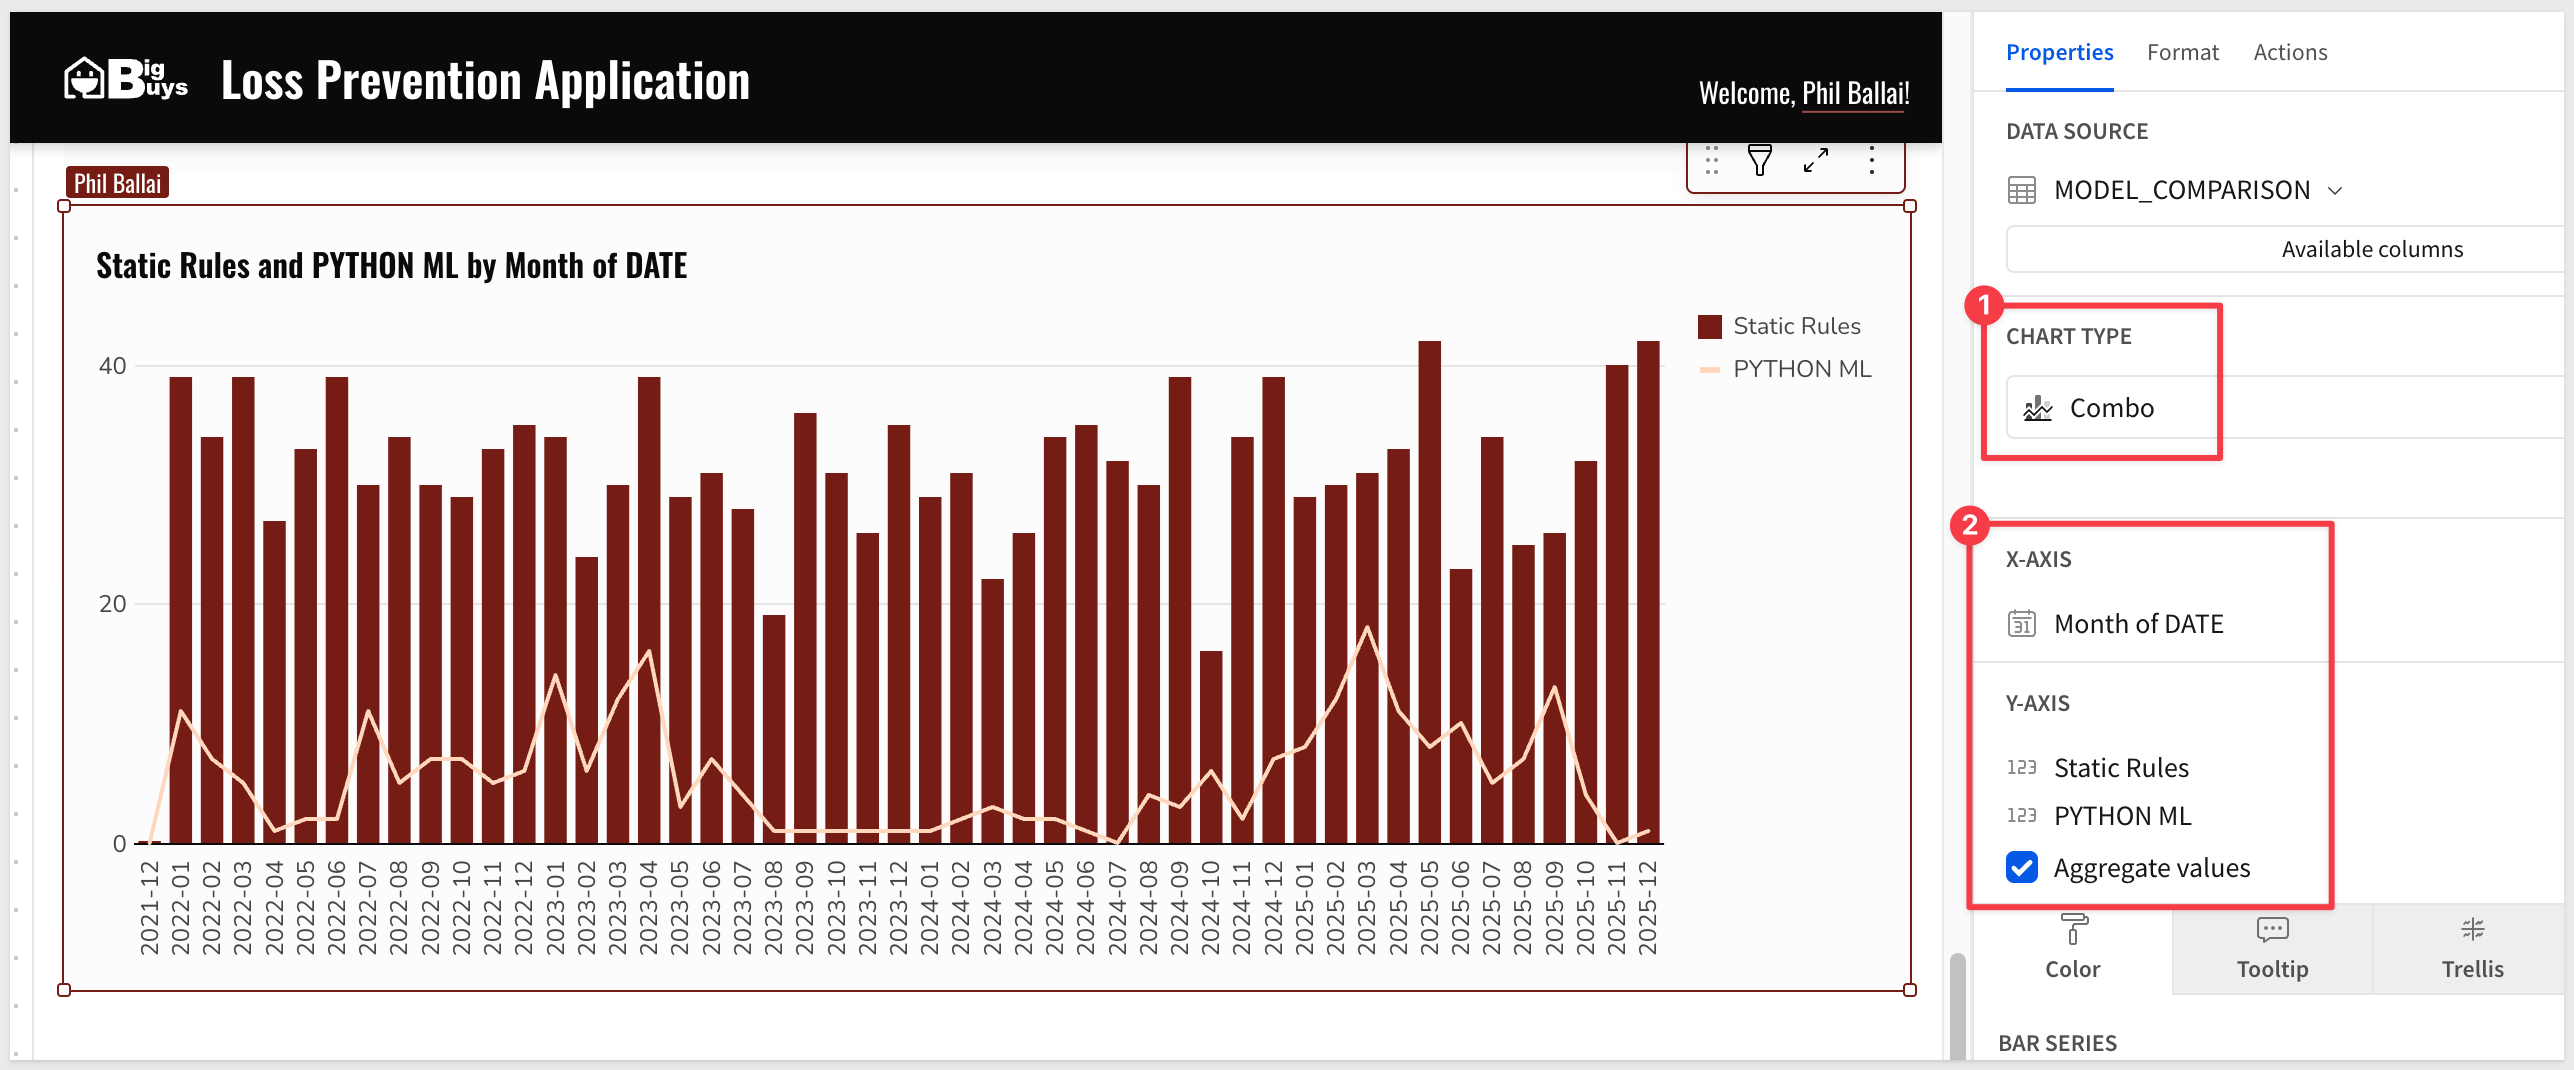
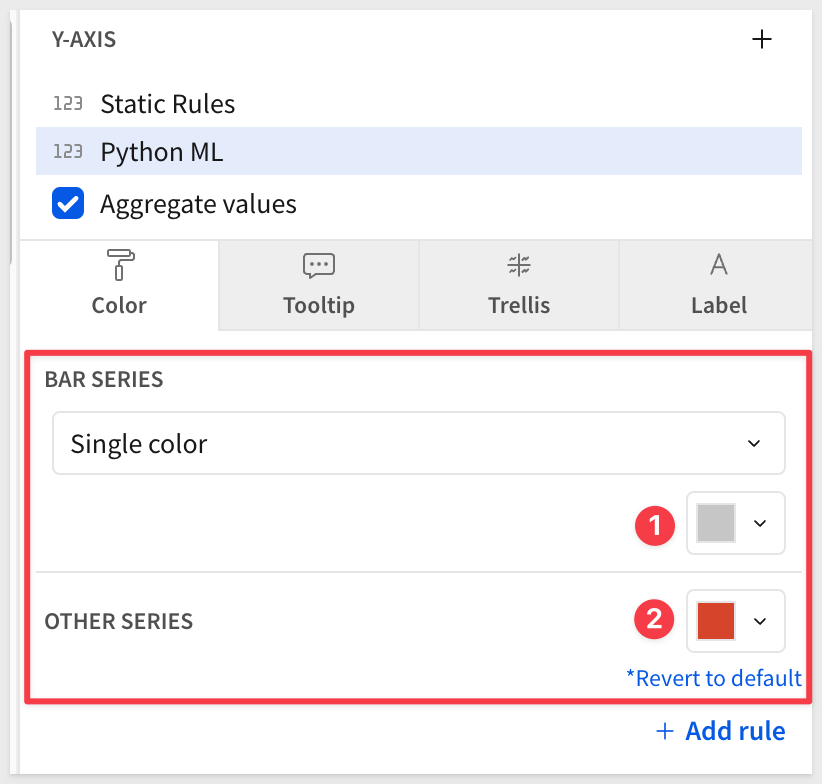
You may want to adjust the bar and line colors to better differentiate them:
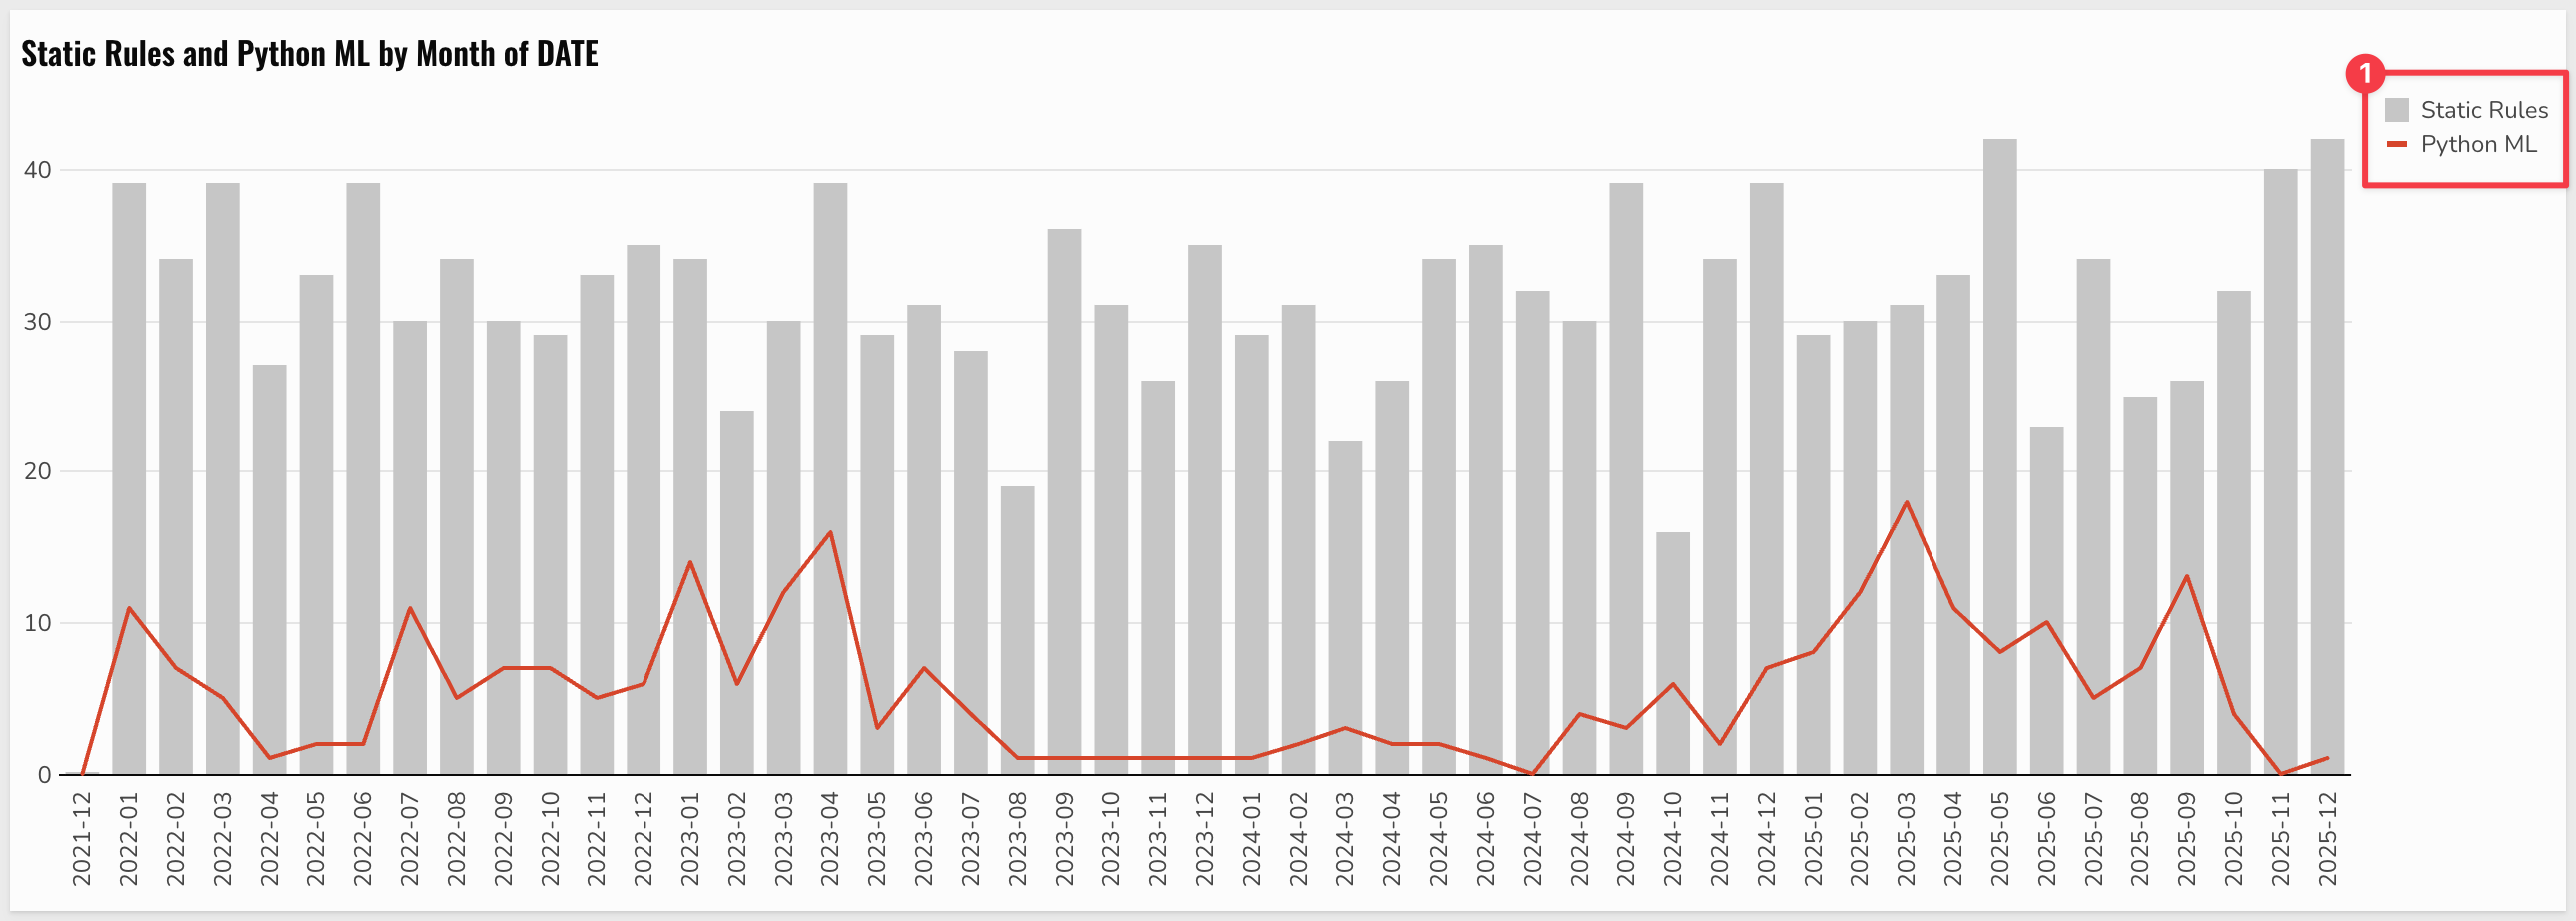
You will likely notice that the Python ML model (the red line) is significantly more selective, reducing the "noise" created by the rigid, hardcoded static rules (the grey bars):
Create Scatter Plot Comparisons
Step 9: We will create two scatter plots to visually distinguish even more between anomalous and normal transactions.
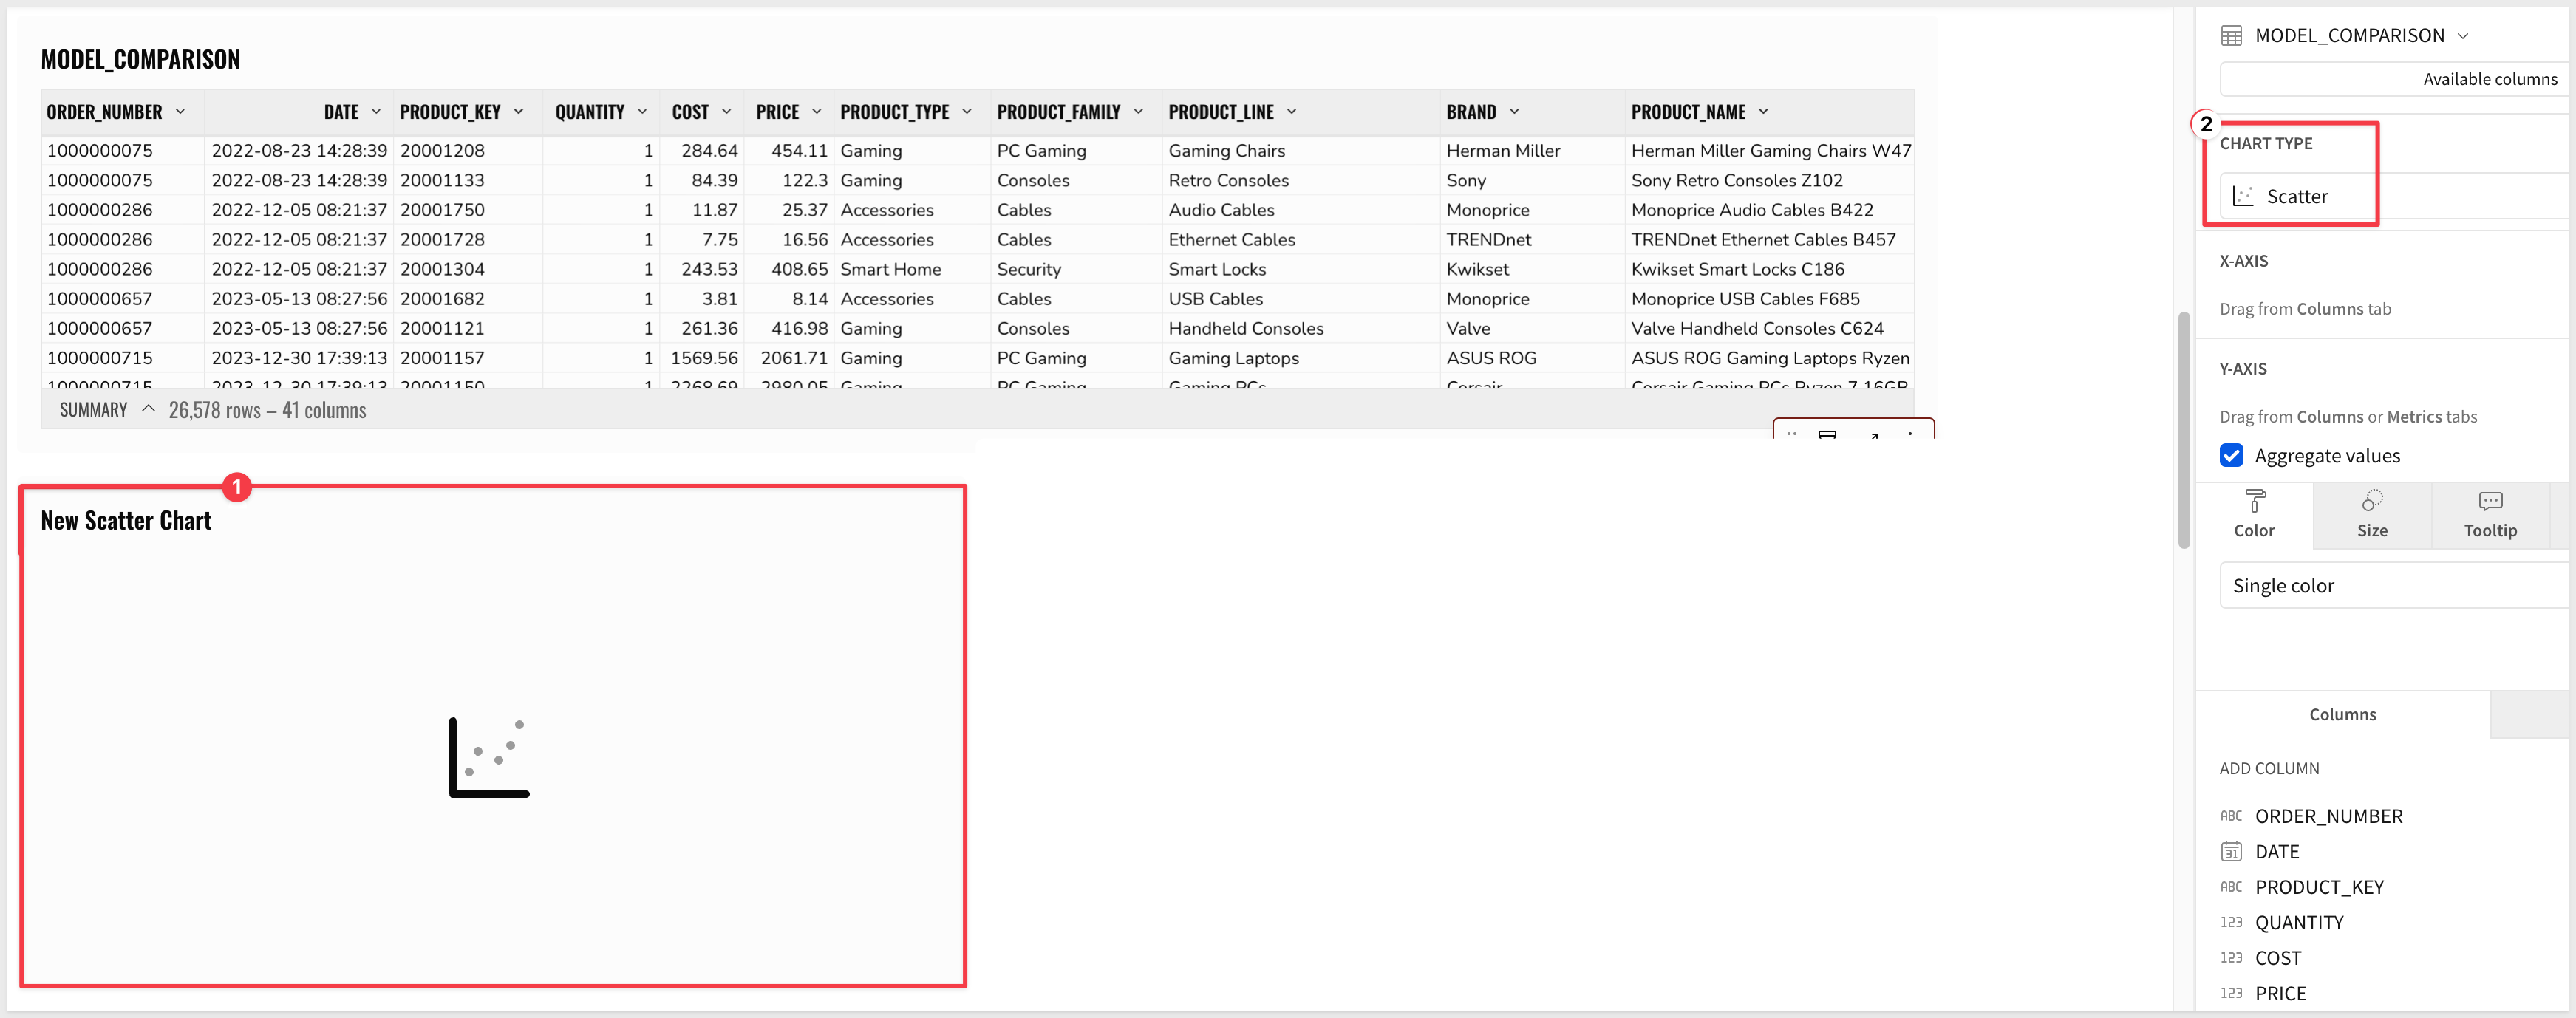
Create a child chart from the MODEL_COMPARISON table.
Change the chart type from Bar to Scatter:
Next, we configure the scatter chart and add another for a comparison.
Plot A: Static Rules Visualization
- X-axis: Add
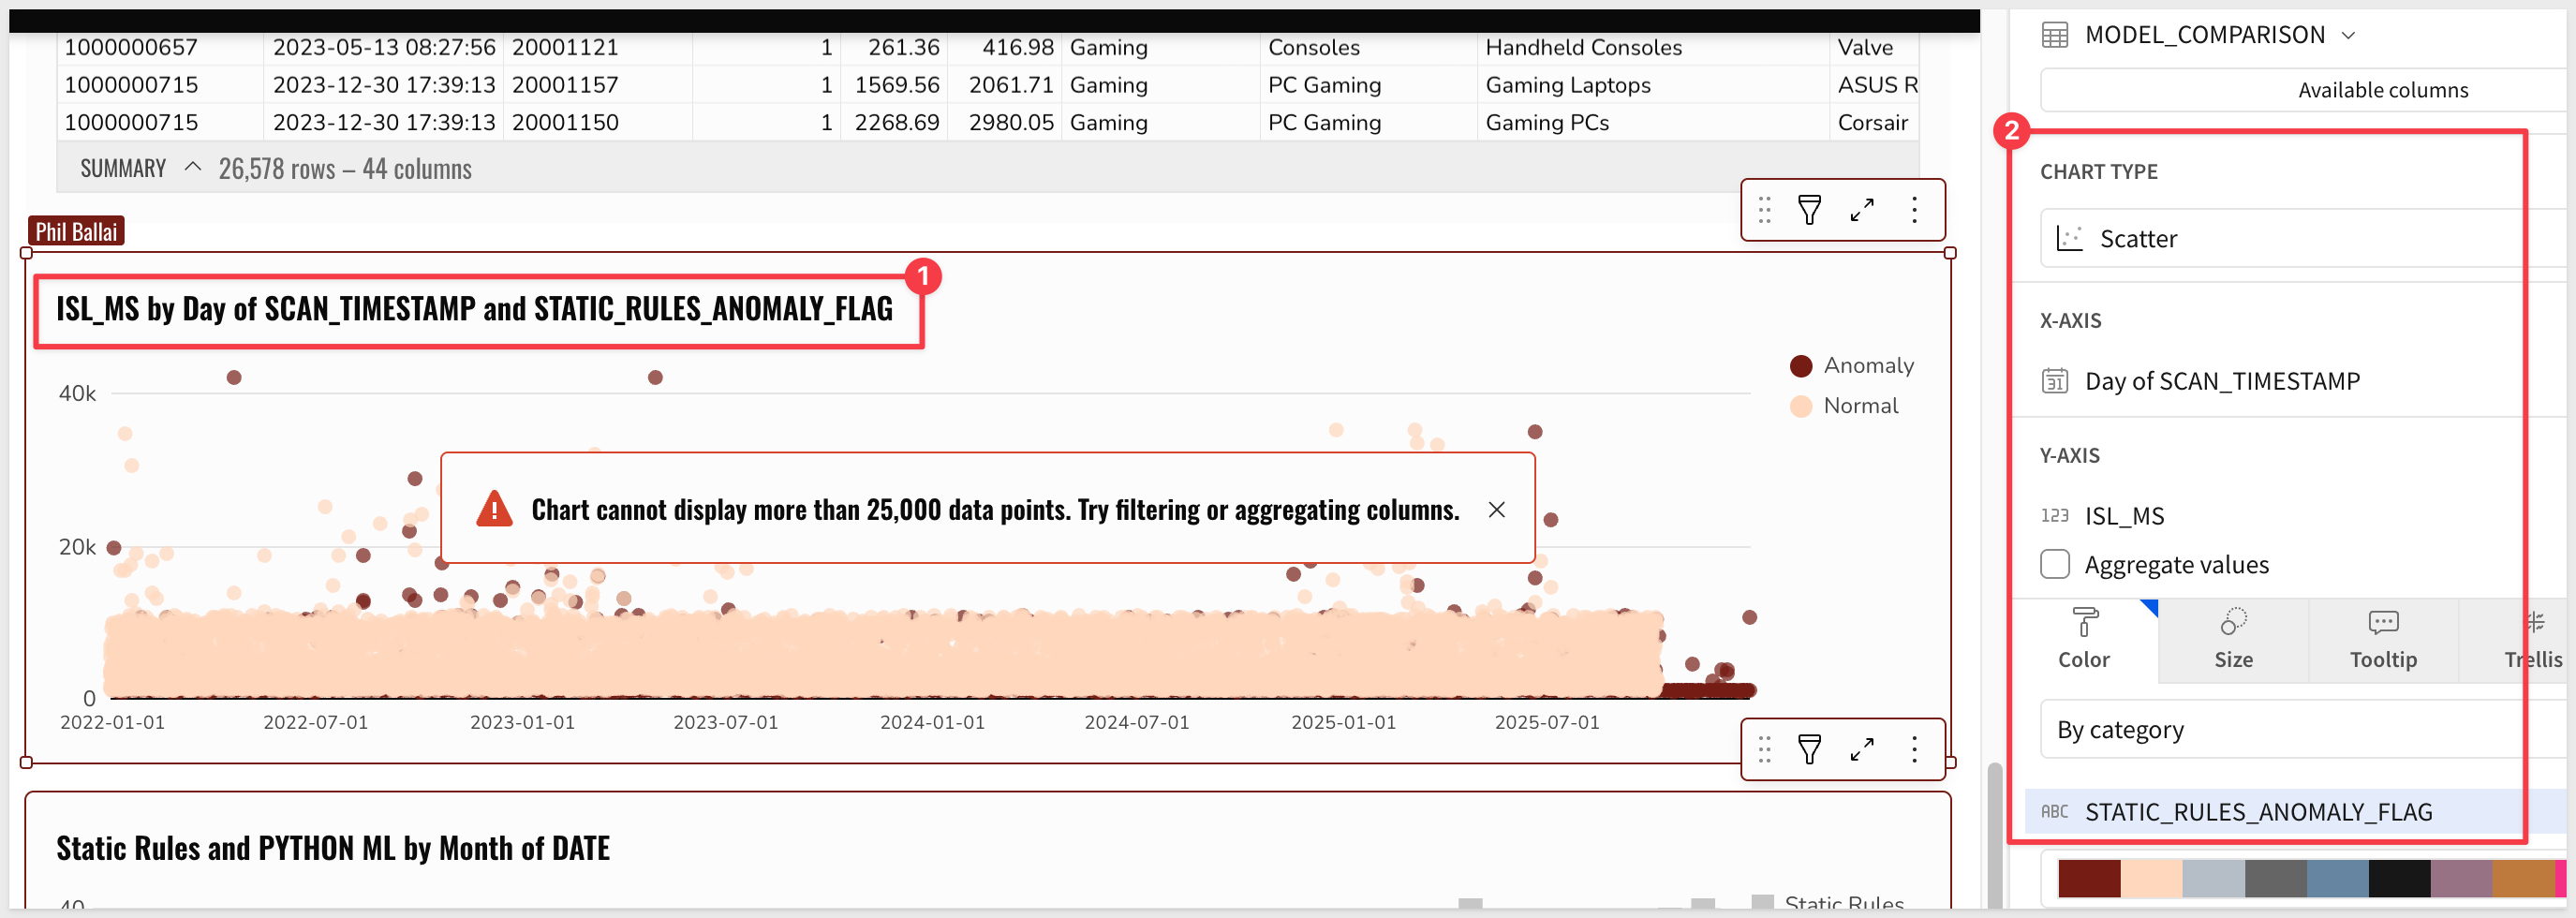
SCAN_TIMESTAMP. The column is automatically truncated toDay - Y-axis: Add
ISL_MS(UncheckAggregate values) - Color (Set to "By Category"): Select the column
STATIC_RULES_ANOMALY_FLAG.
- Tooltip: Add
ORDER_NUMBER,SKU_NUMBER,PRODUCT_LINEandPRODUCT_KEY(Ensure that these fields arenot aggregated) - Trellis Column: Add
PRODUCT_FAMILY:
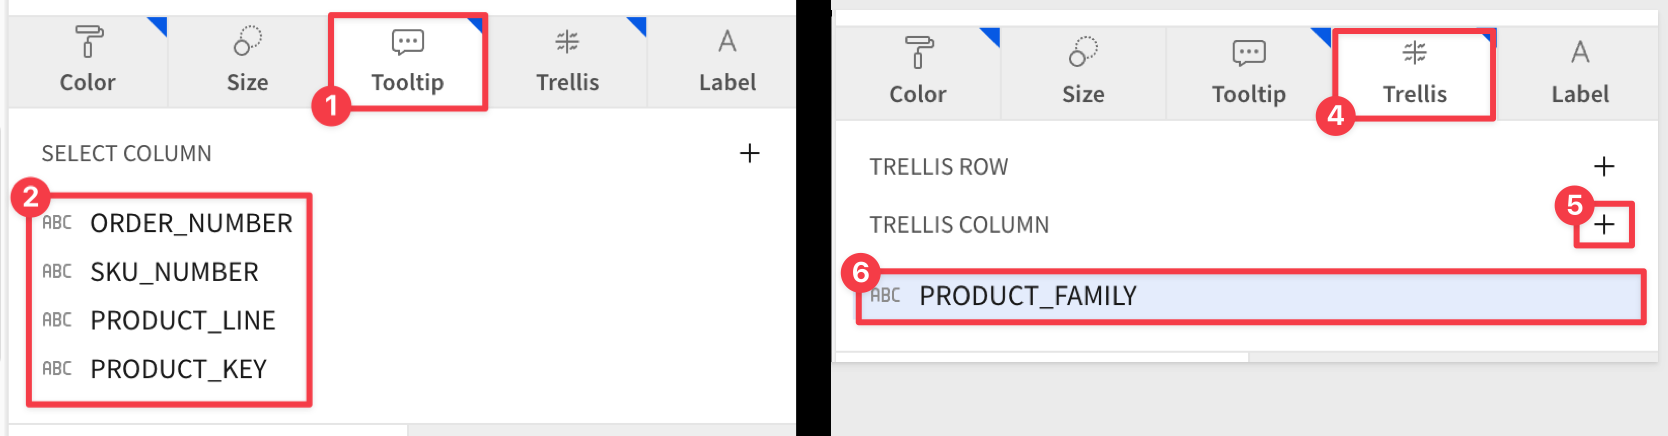
Rename the chart Static Rules Visualization.
Plot B: Python ML Visualization
We create another scatter chart from scratch, but it is faster to just duplicate the existing one and adjust it:
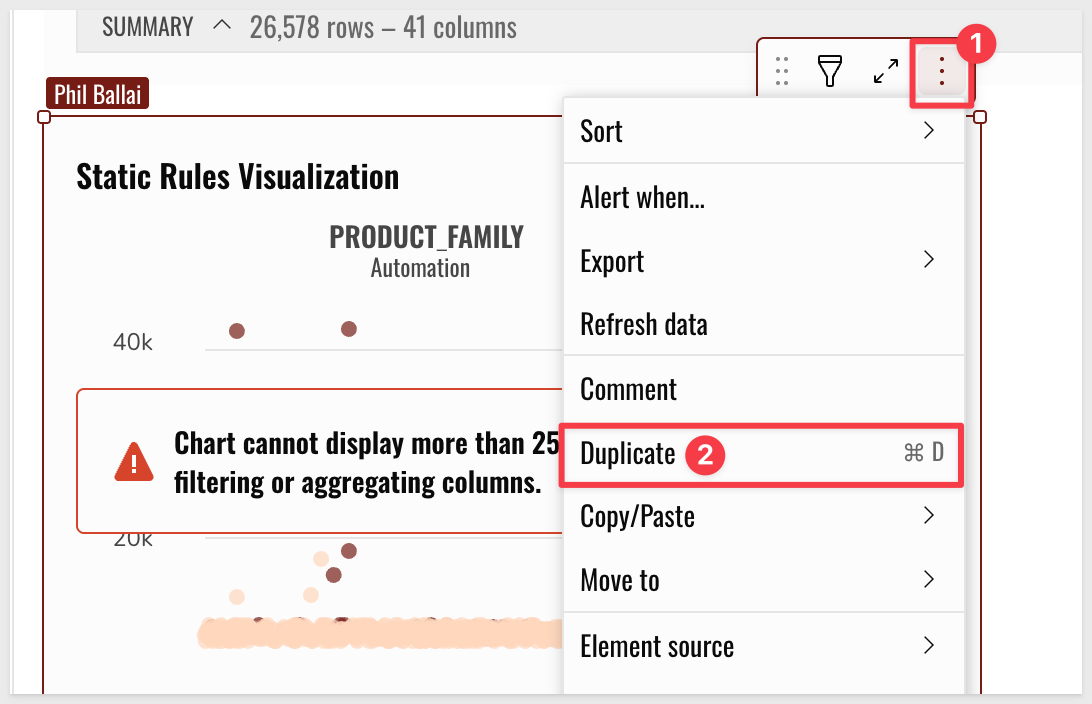
Click the x to close the 25K data points warning.
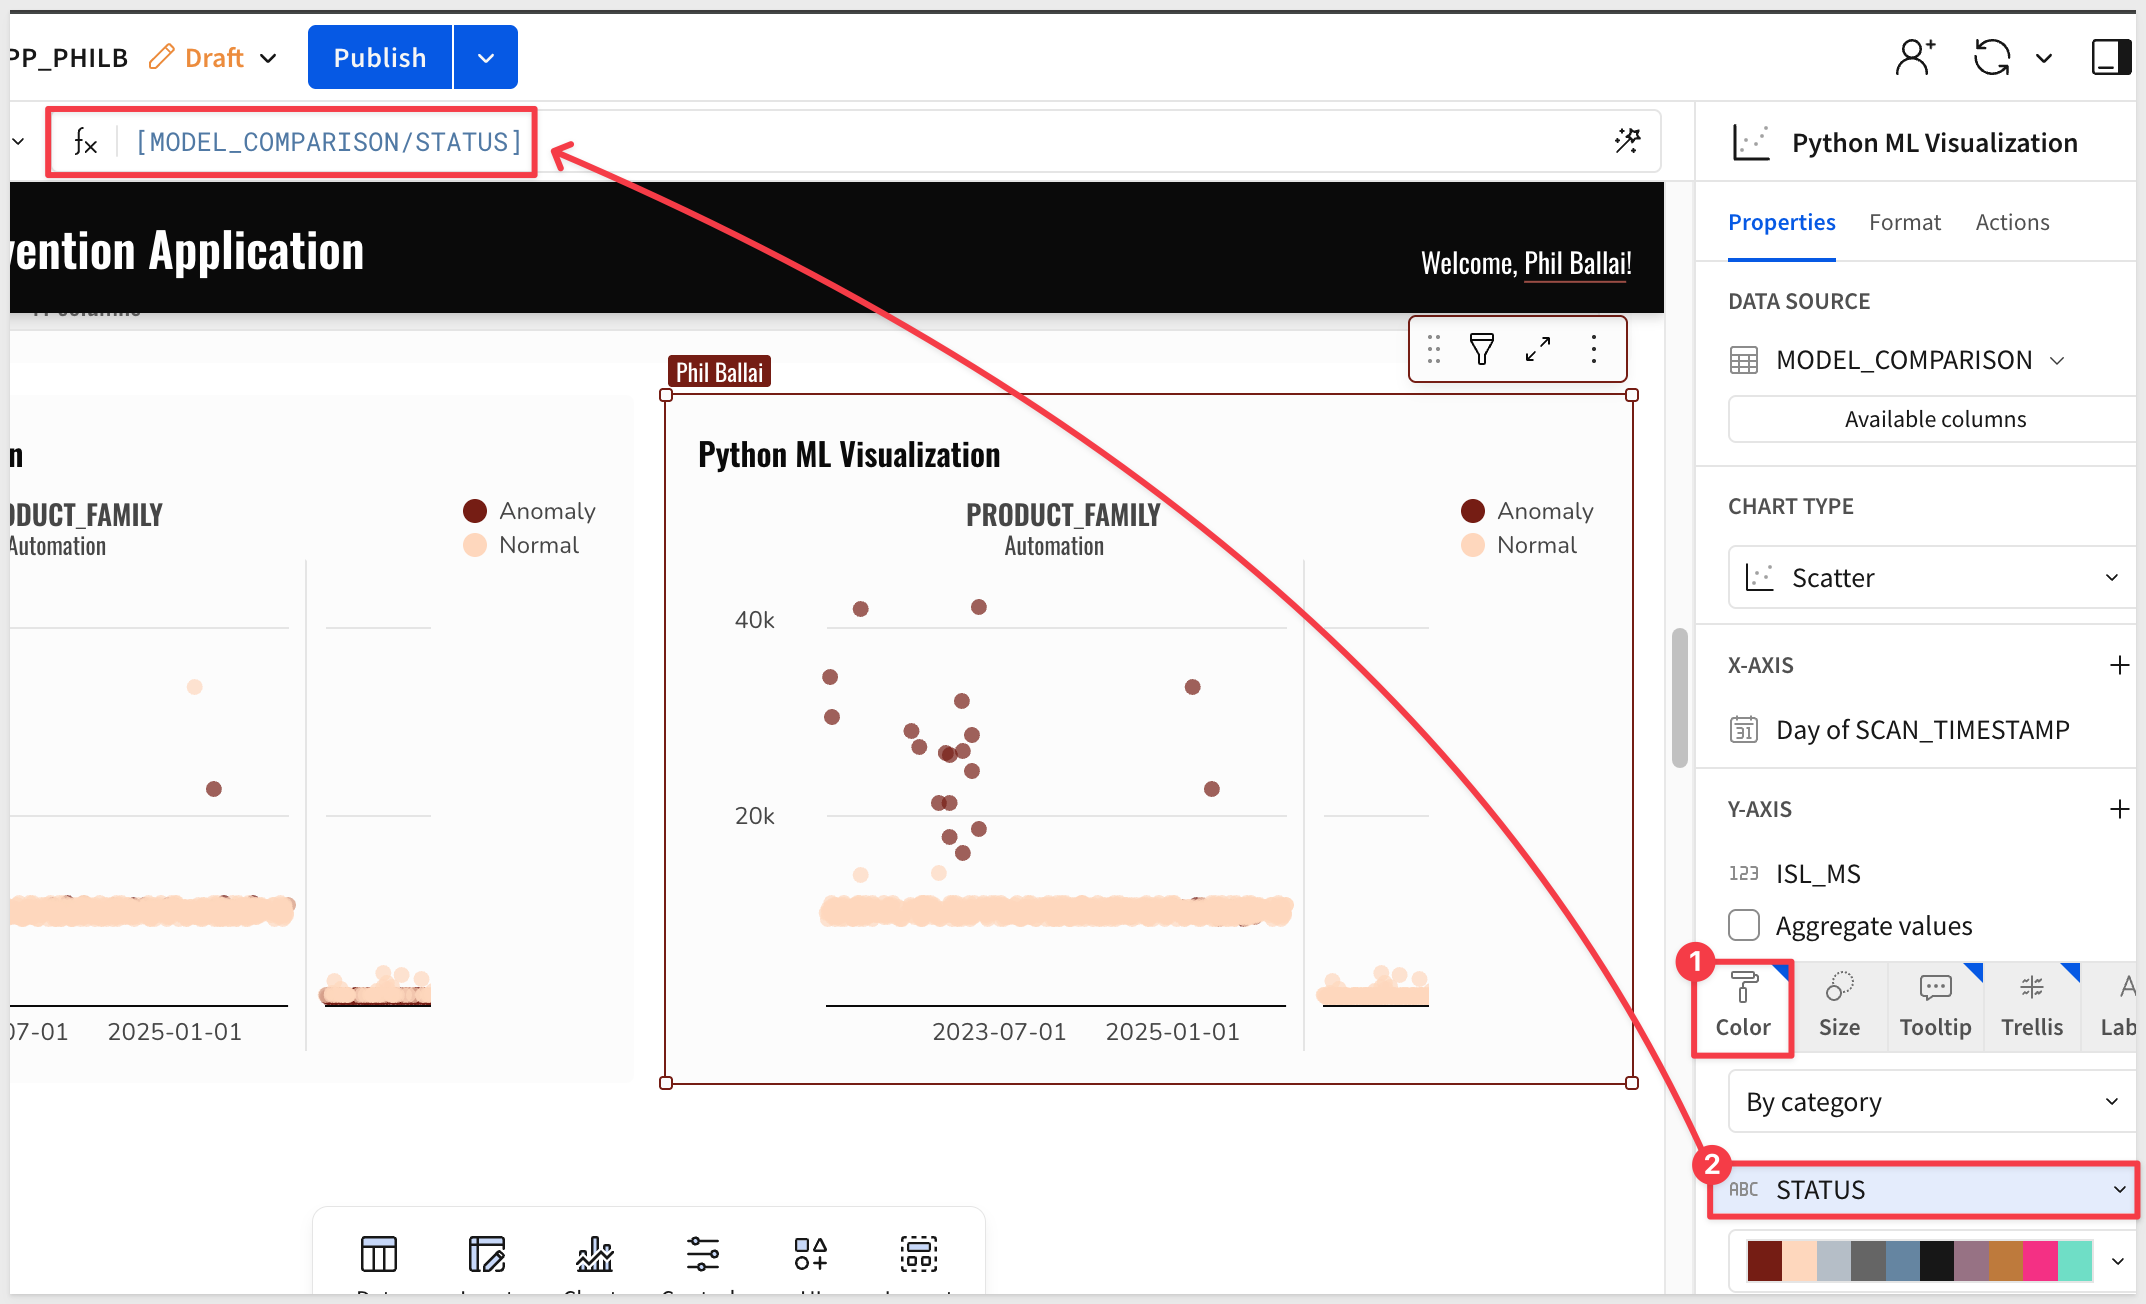
The only value requiring a change is to set Color > By Category to STATUS with a formula:
[MODEL_COMPARISON/STATUS]
Rename the second chart Python ML Visualization
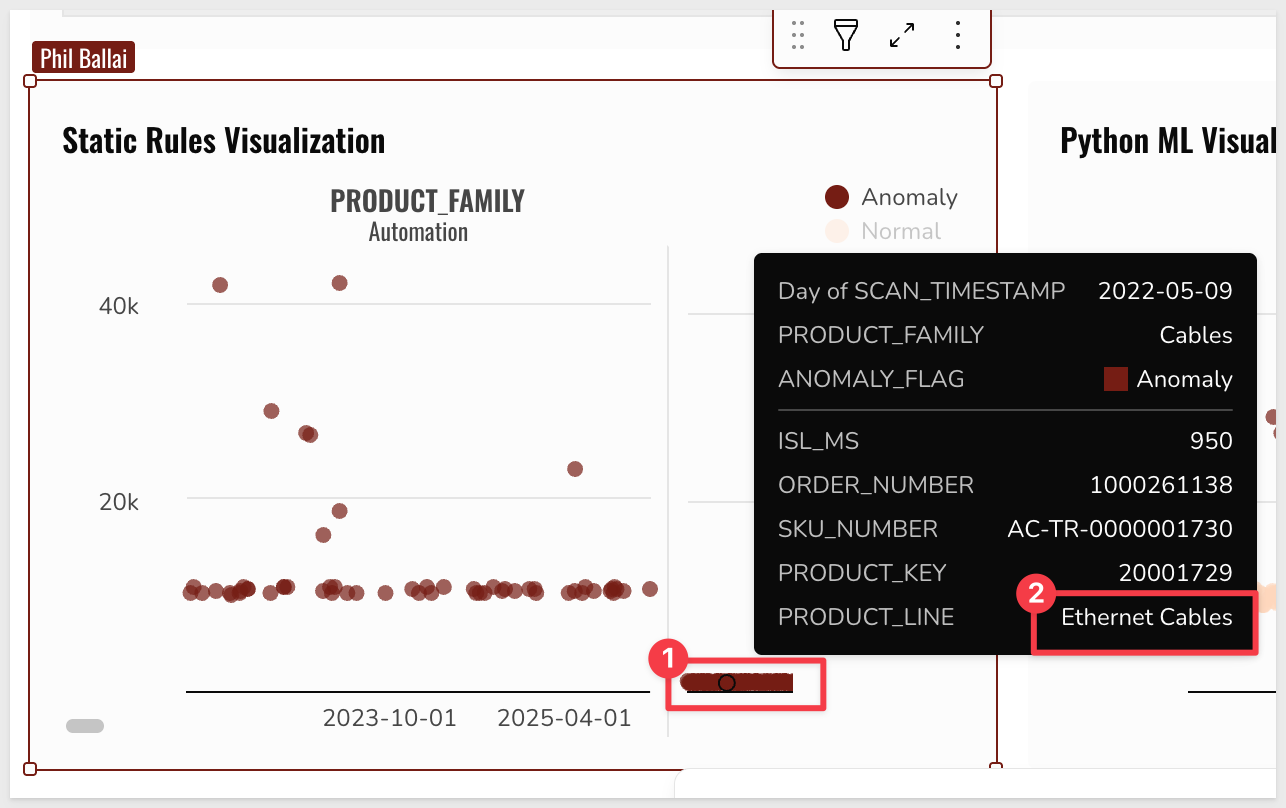
Key Observations
The static flags often miss suspicious transactions or incorrectly flag legitimate ones. For example, "Cables" are often scanned quickly; the static rule (< 1 sec) flags them as theft, whereas the Python ML model recognizes this as normal behavior for that category.
Step 10 - Because running Python on massive datasets can be time-consuming, the model has already been run on the full POS dataset. A pipeline is now active, refreshing the data nightly.
- Table Name: BIG_BUYS_ENRICHED_POS_PYTHON_MODEL
In this module, we will start with a WIP version of the Loss Prevention App V2.0 which will allow store managers to act on these insights immediately, closing the loop between detection and resolution.
Update High Risk Locations Table
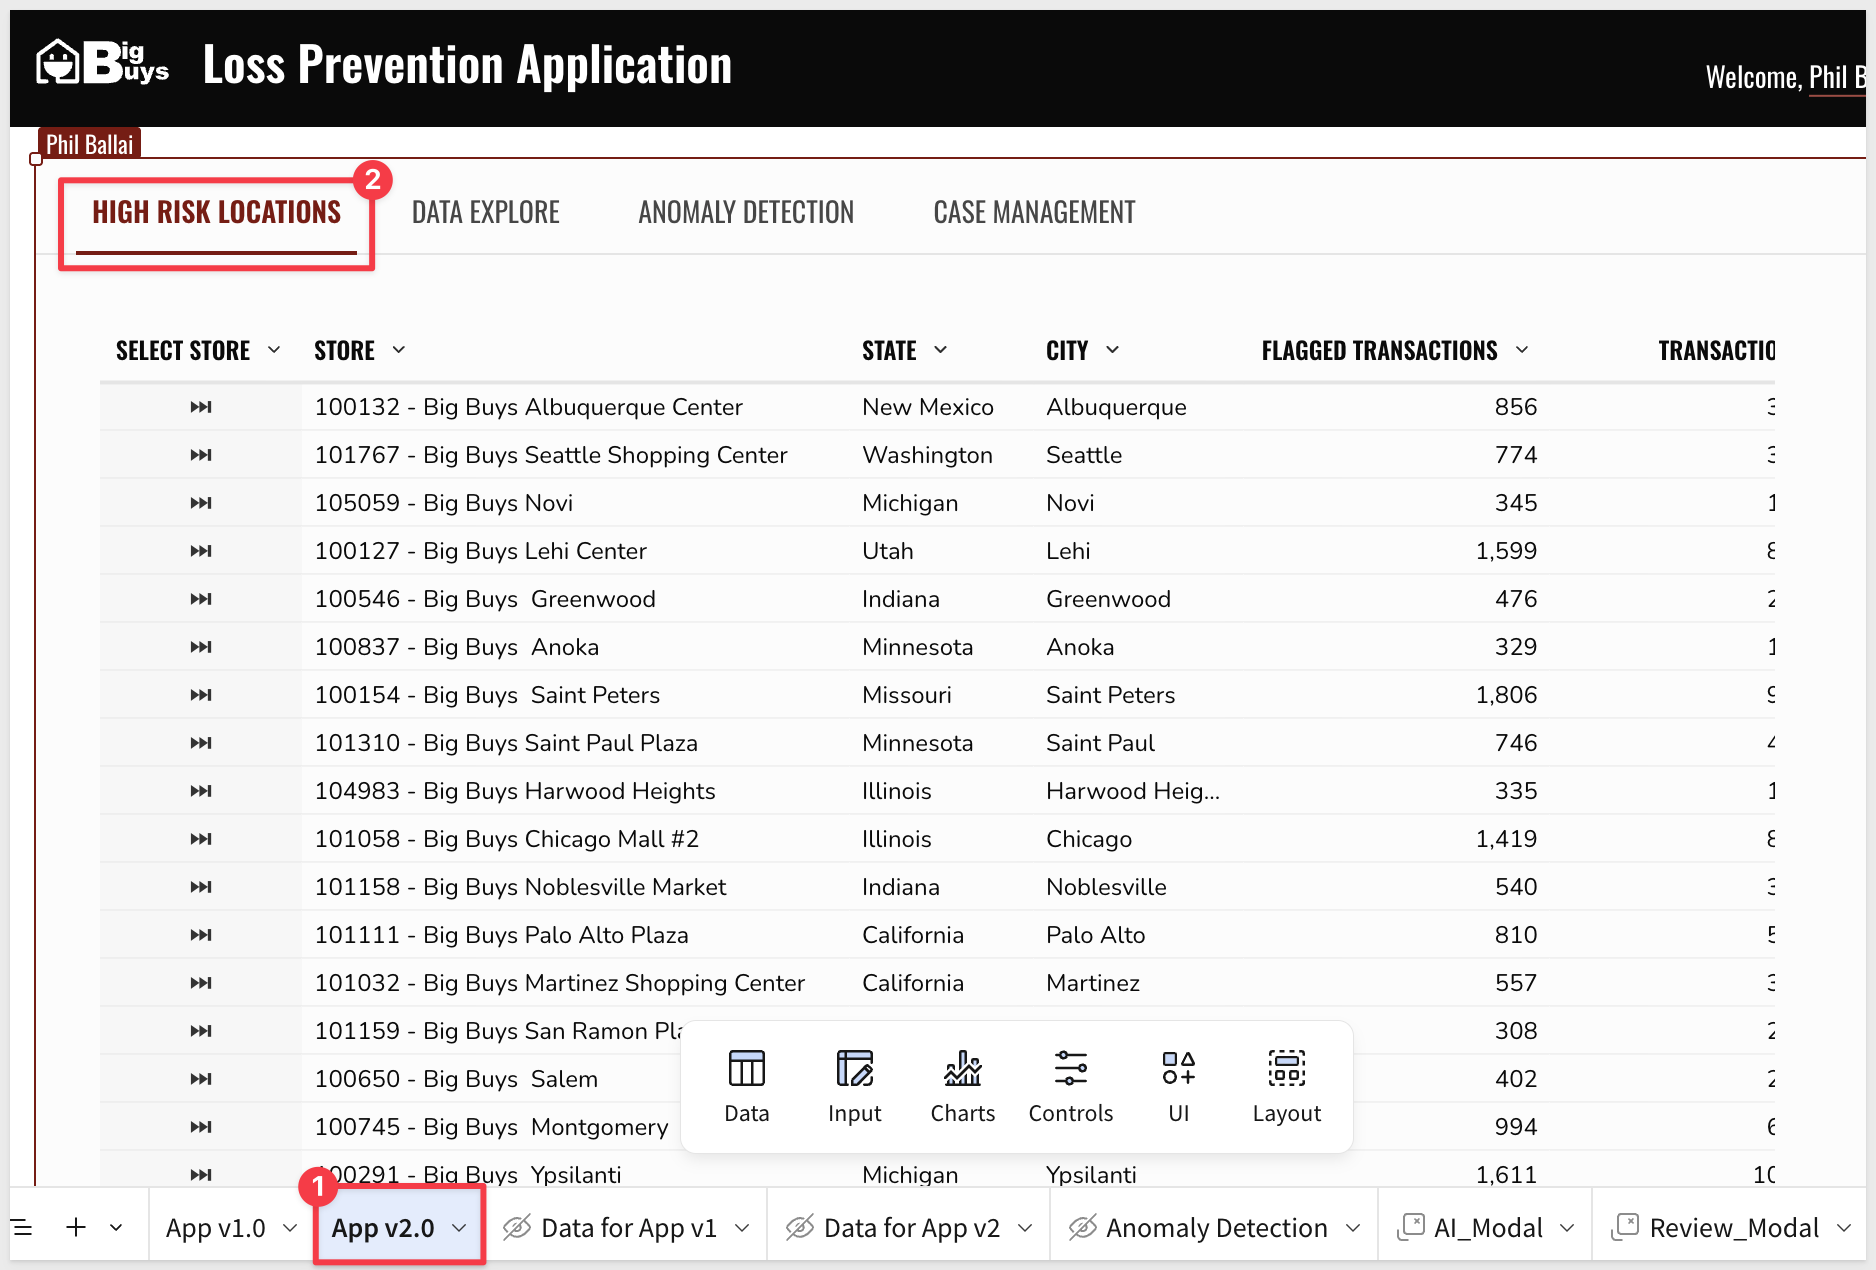
Step 1: Select the App v2.0 page to see the High Risk Locations table. (The underlying source has been pre-updated to the Python model output):
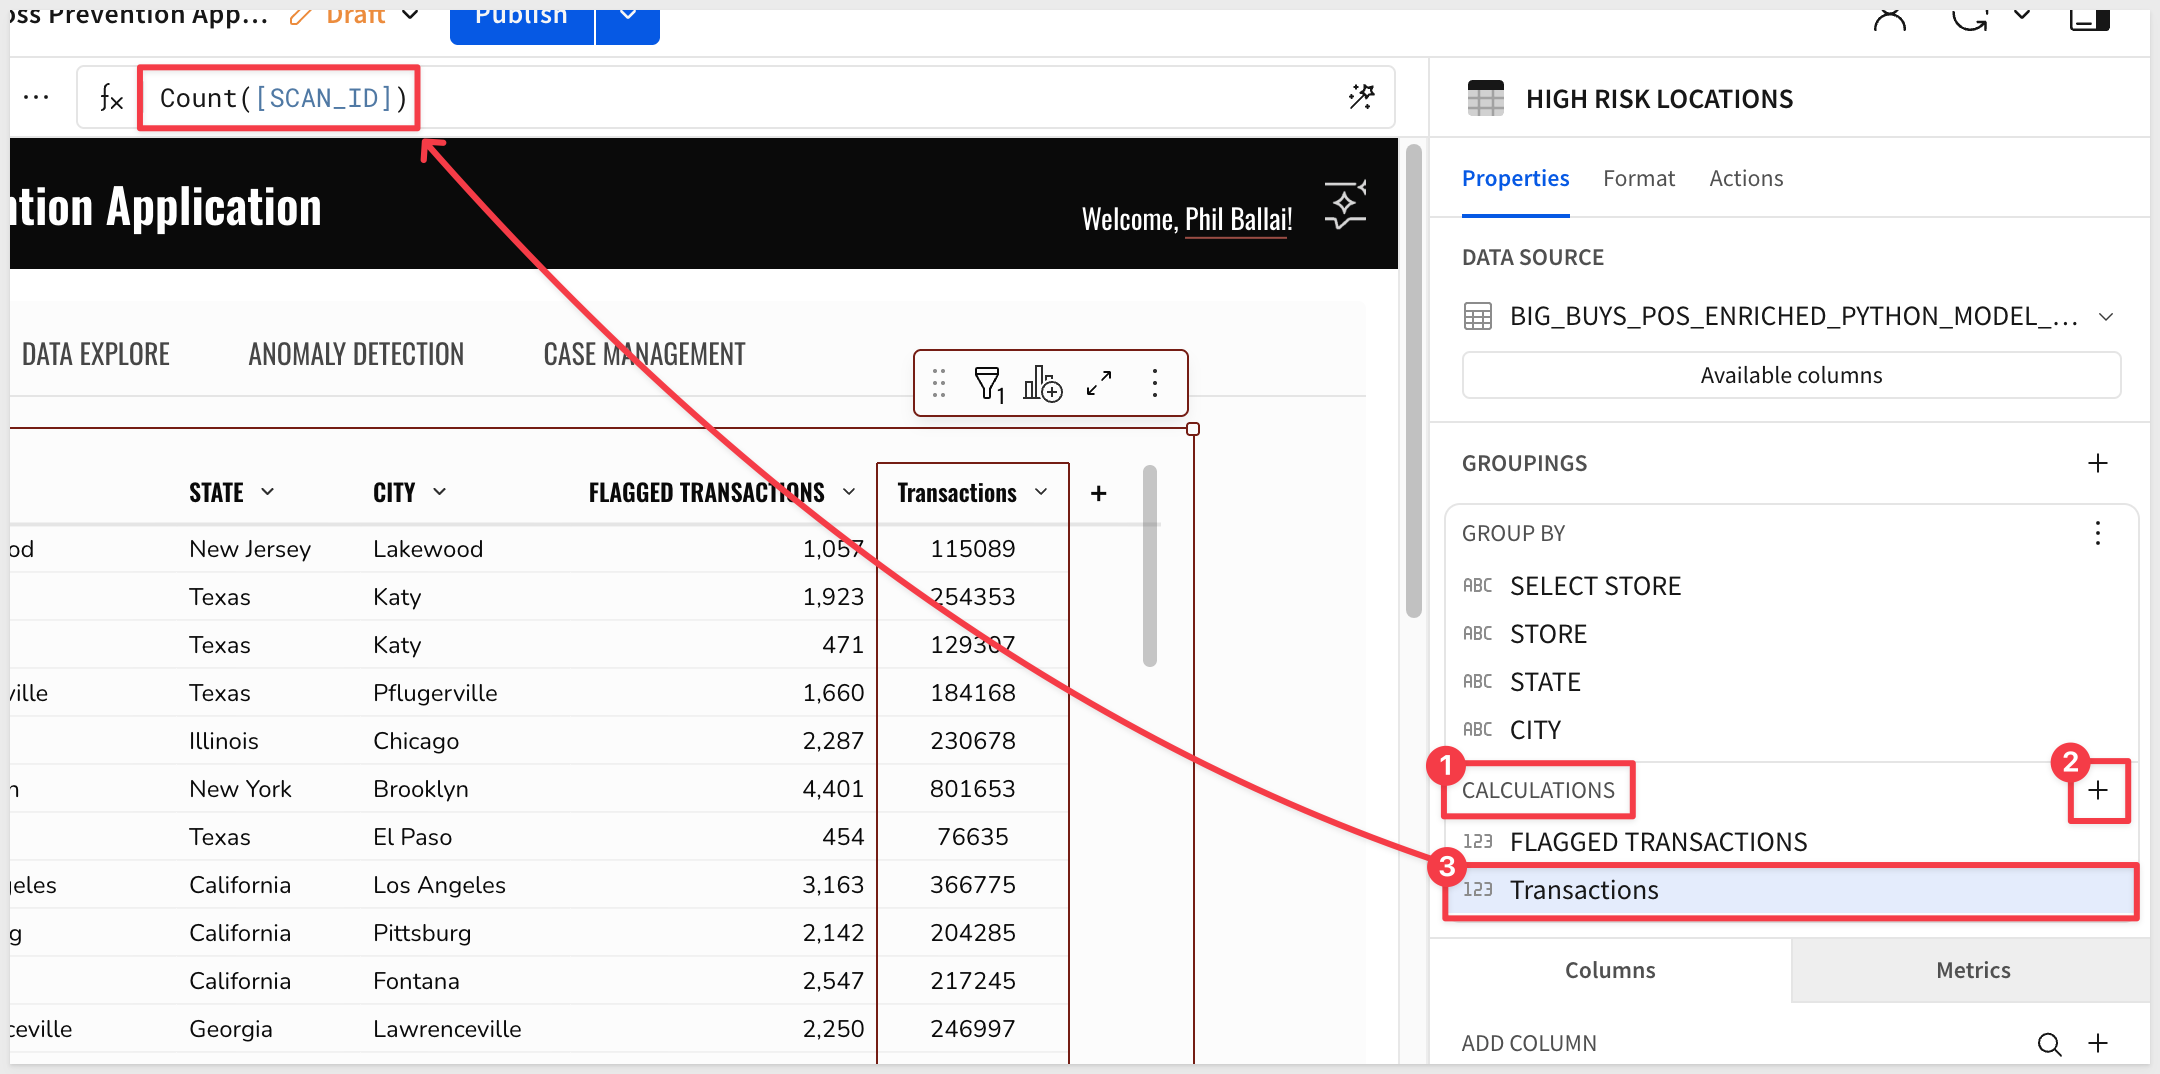
a. In the Element panel add a new column in the GROUP BY > CALCULATIONS section named Transactions, using the formula:
COUNT([SCAN_ID])
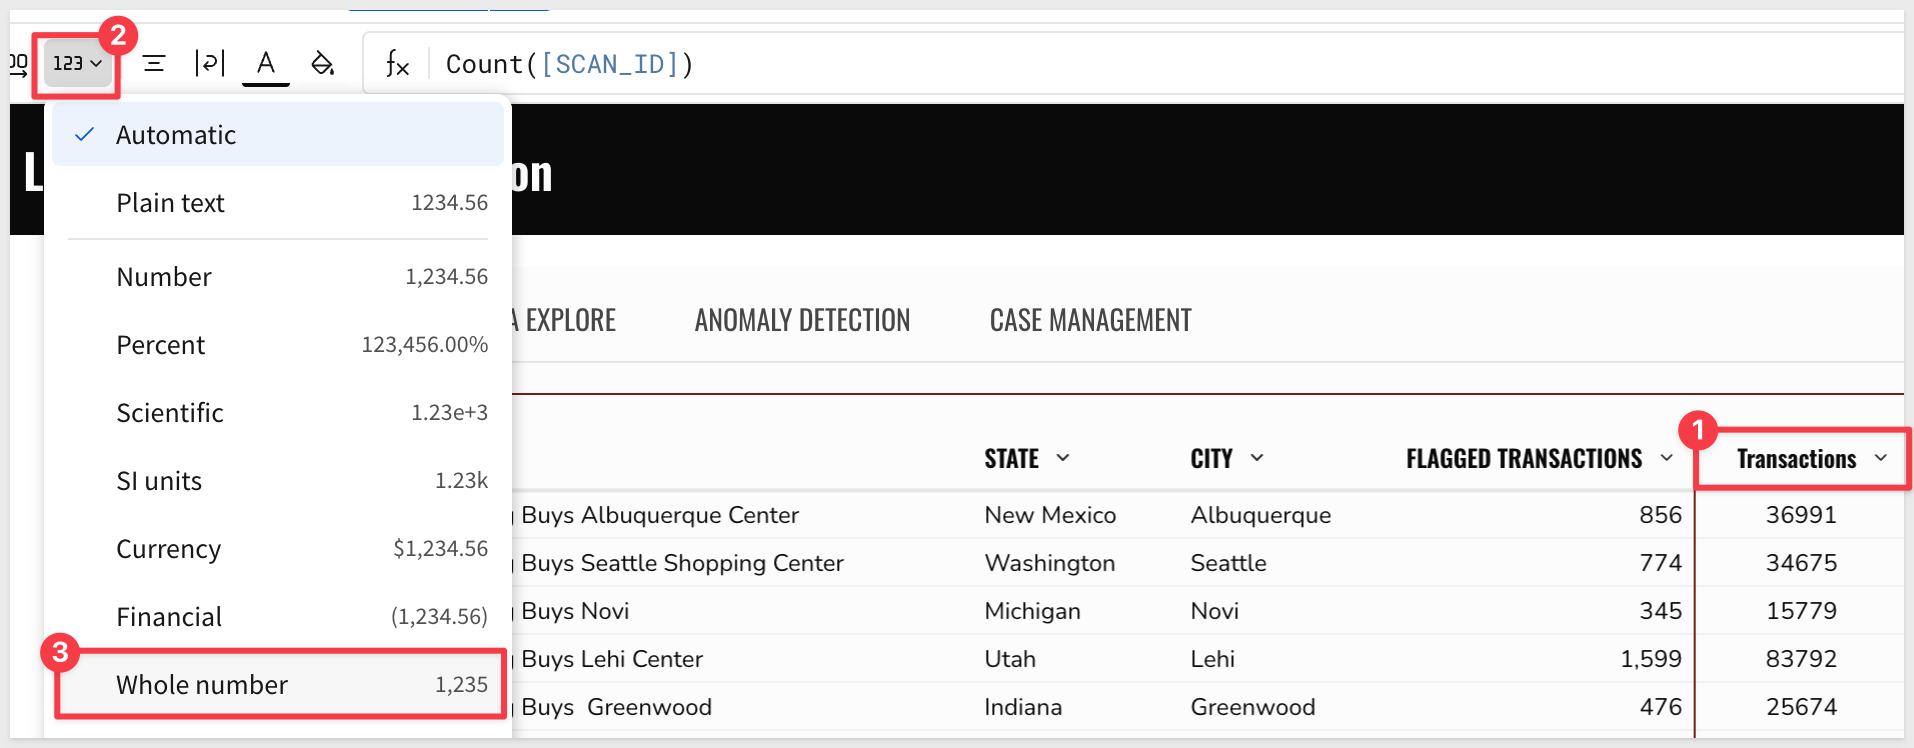
b. Set Transactions to use a whole number format:
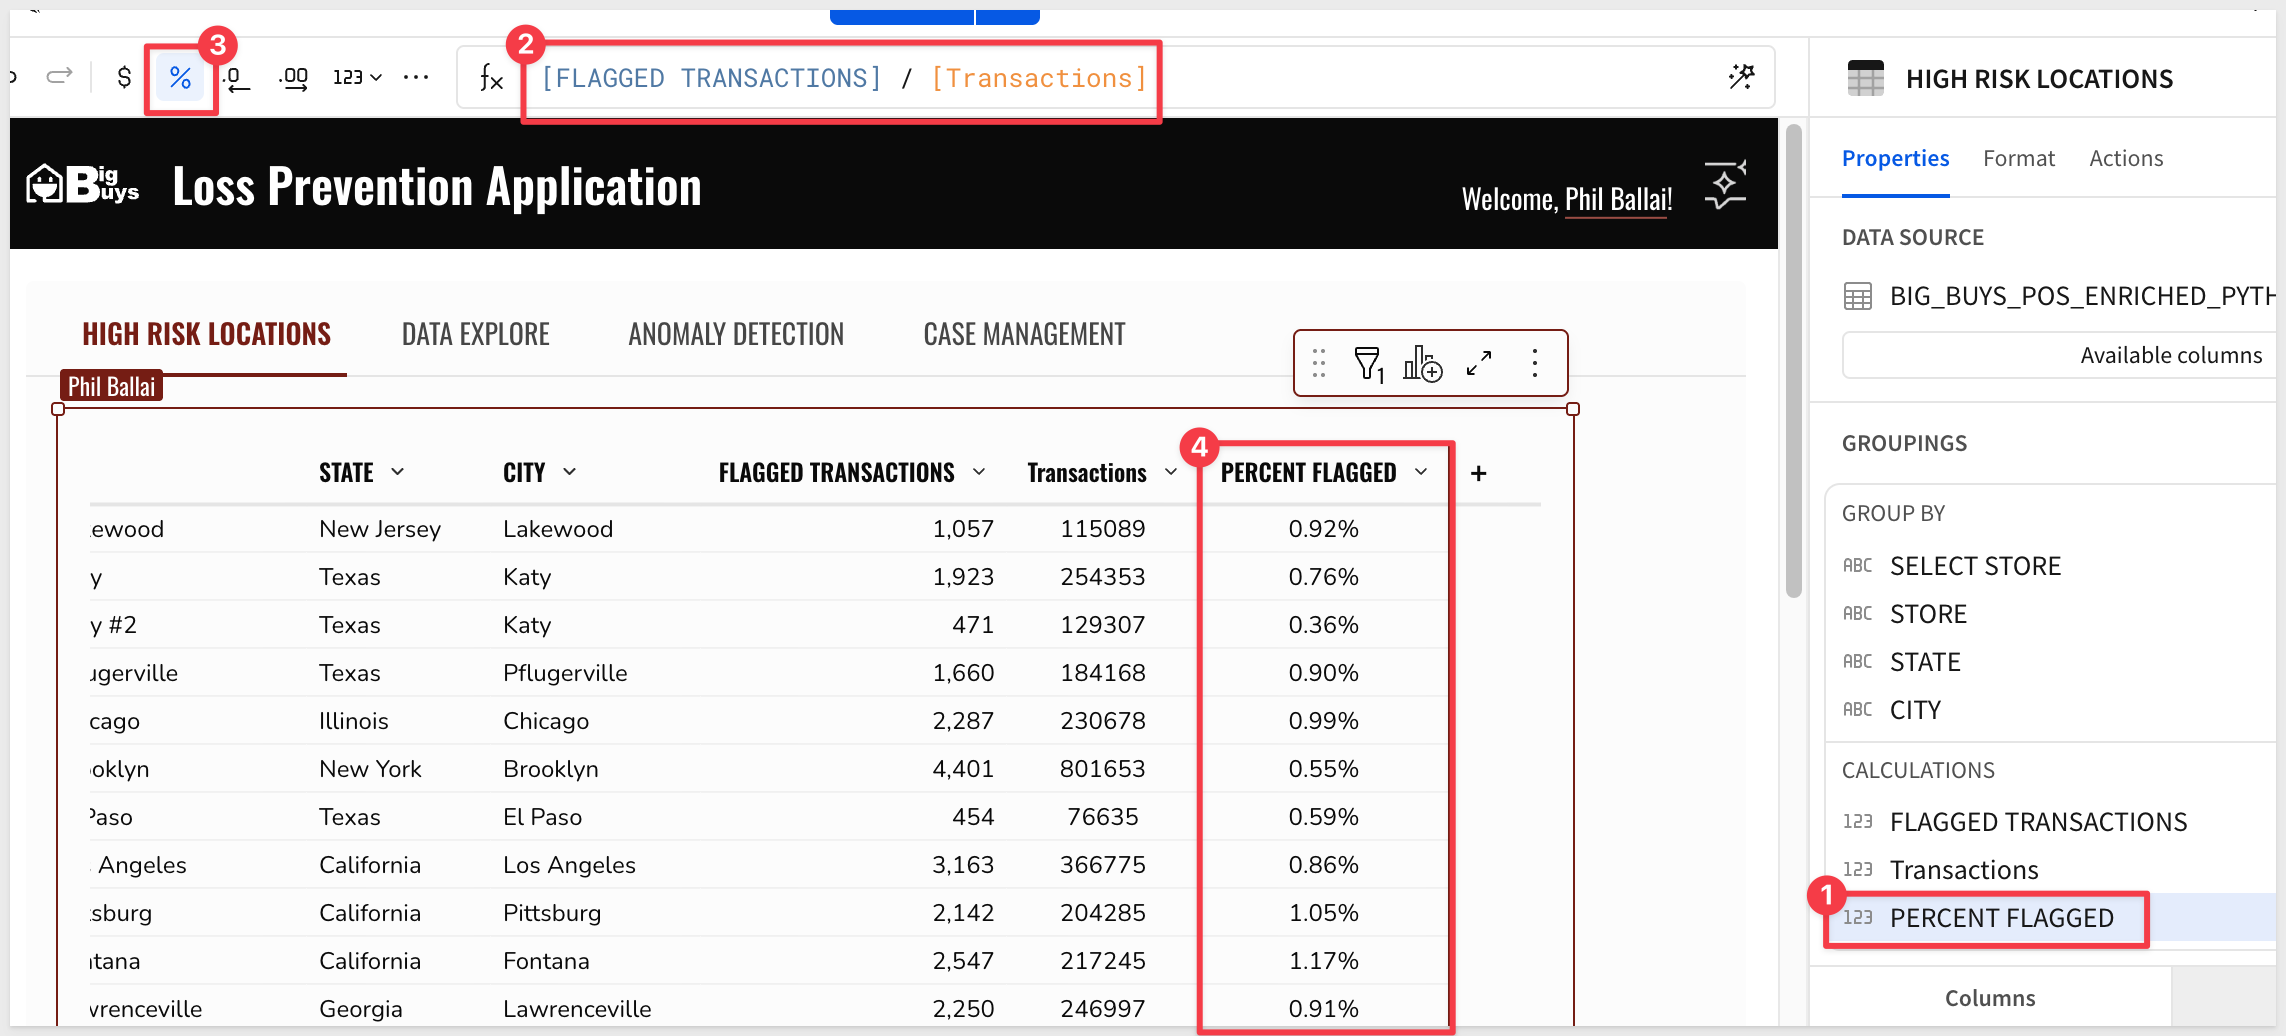
c. Add a third column calculation named PERCENT FLAGGED using the formula:
[FLAGGED TRANSACTIONS] / [TRANSACTIONS]
d. Change the PERCENT FLAGGED column to use %:
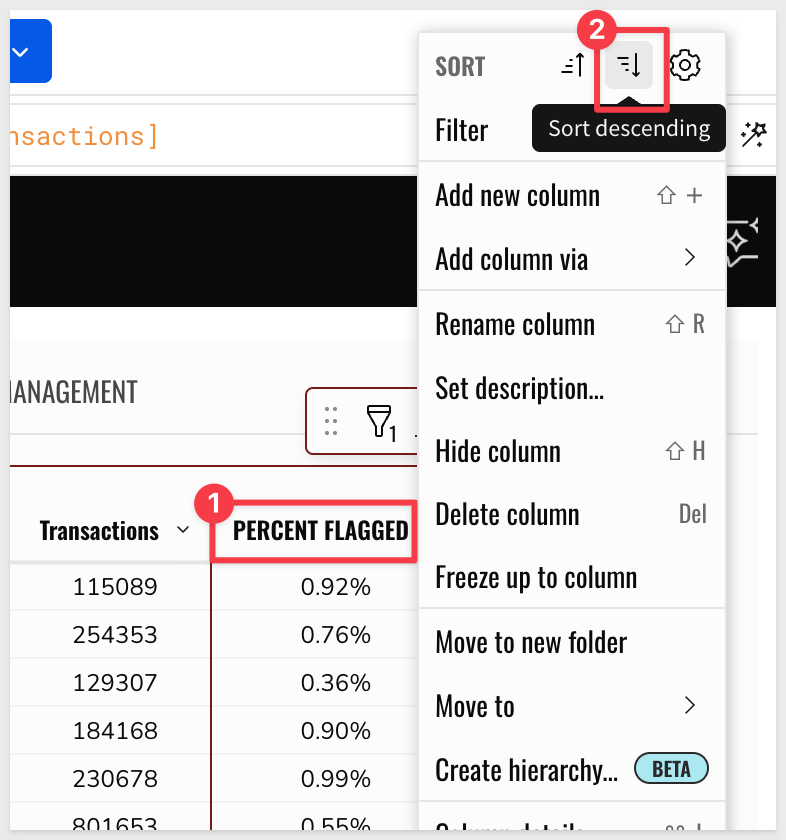
e. Sort the table by the PERCENT FLAGGED column in descending order to prioritize high-risk stores:
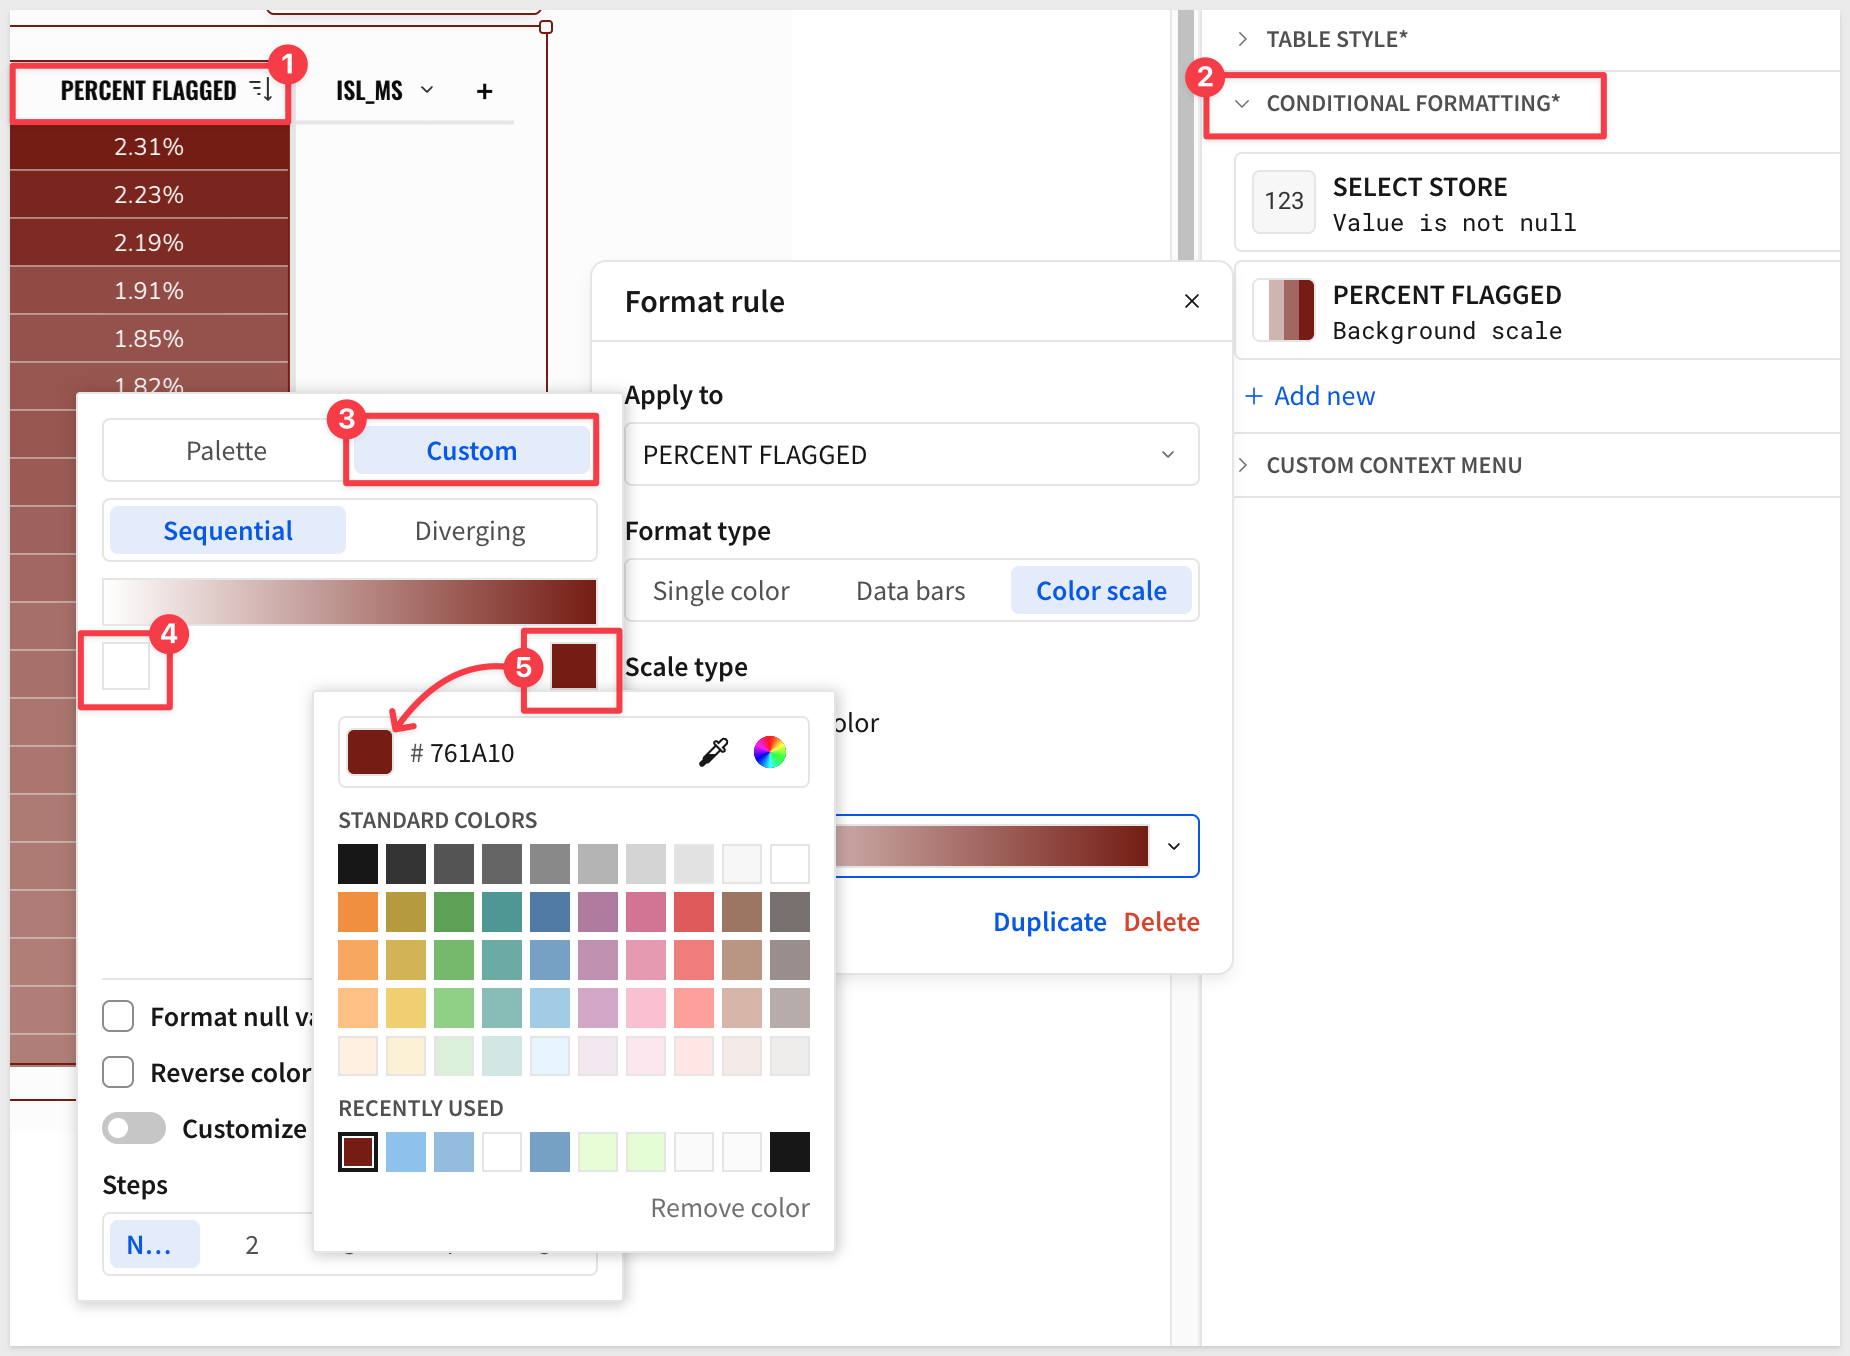
f. Add Conditional formatting to the PERCENT FLAGGED column. Add Format type > Color Scale > Custom > Sequential.
Sigma presents two square boxes that when clicked, allow you to set a custom color.
For the left box, use #FFFFFF and for the right, #761A10:
Update Data Sources
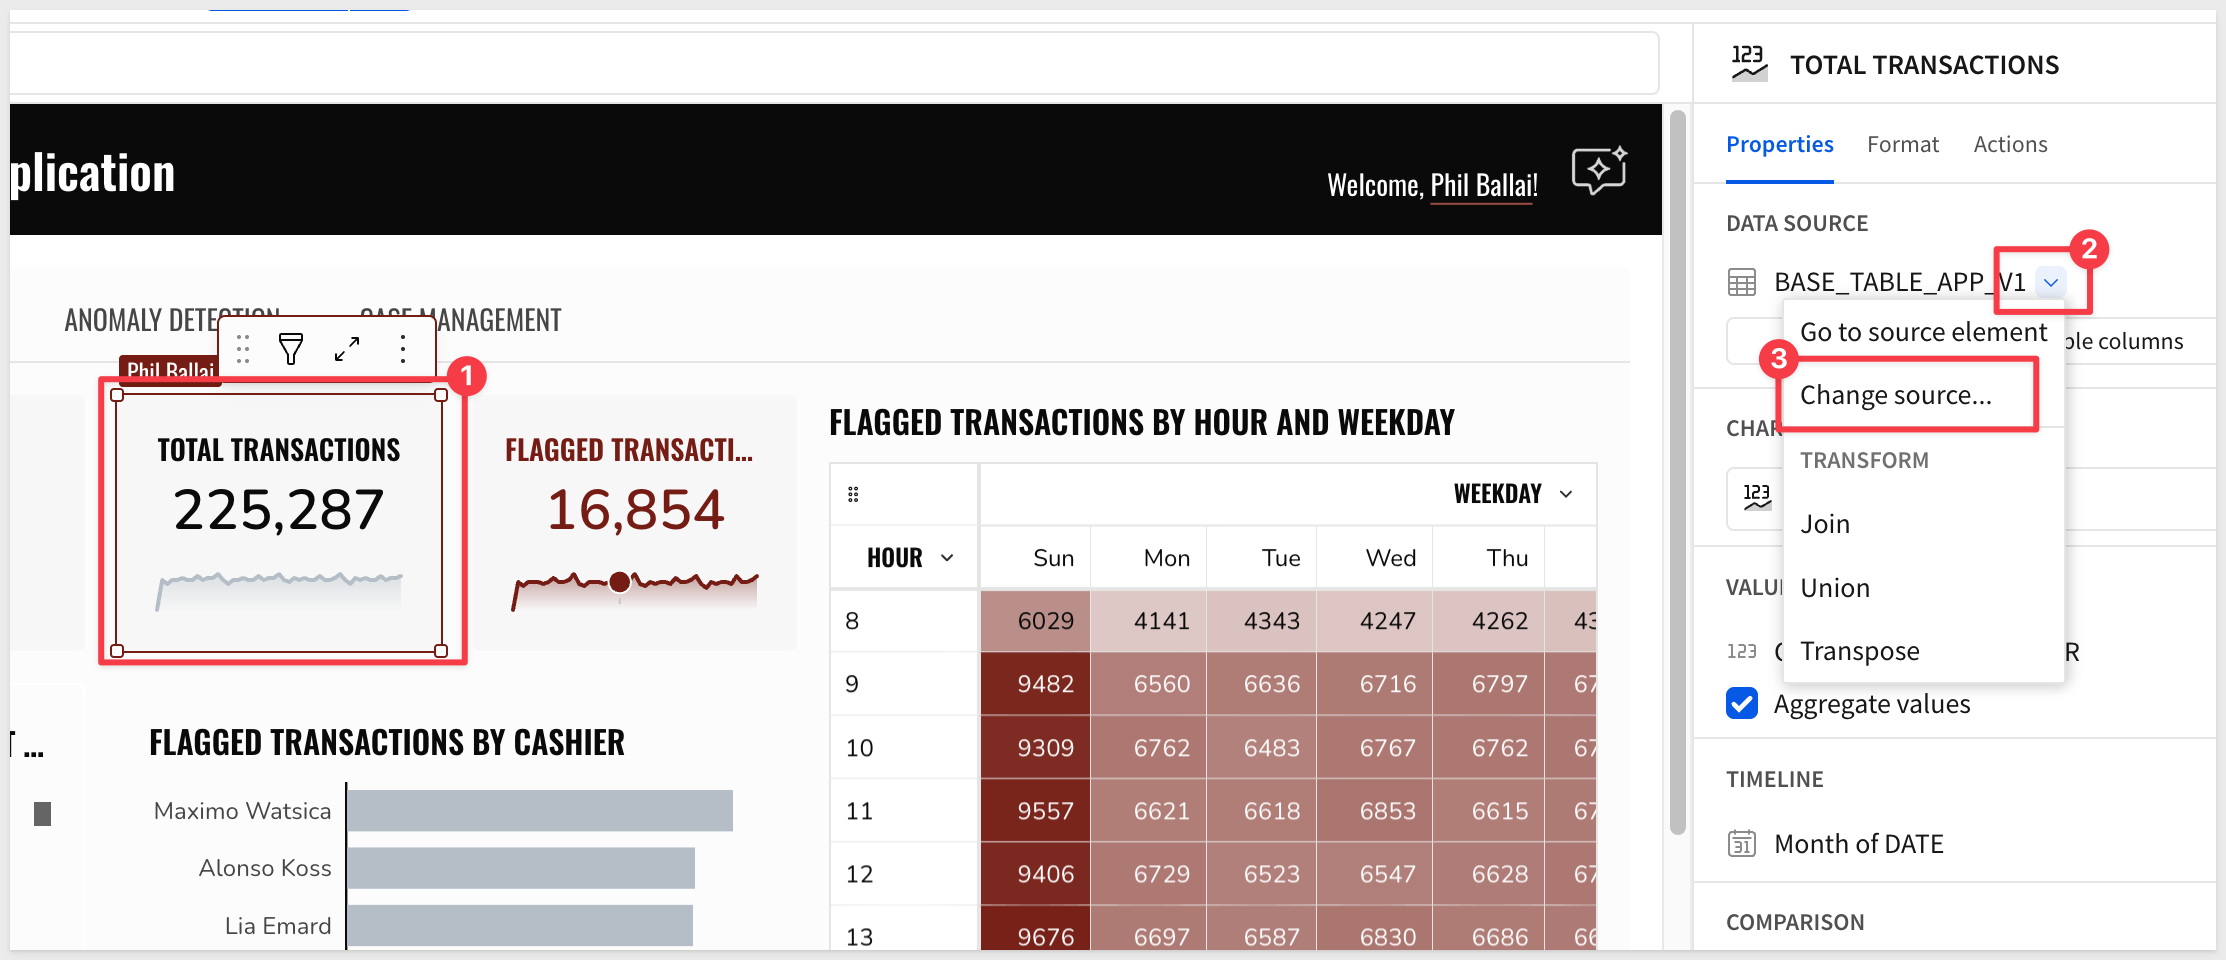
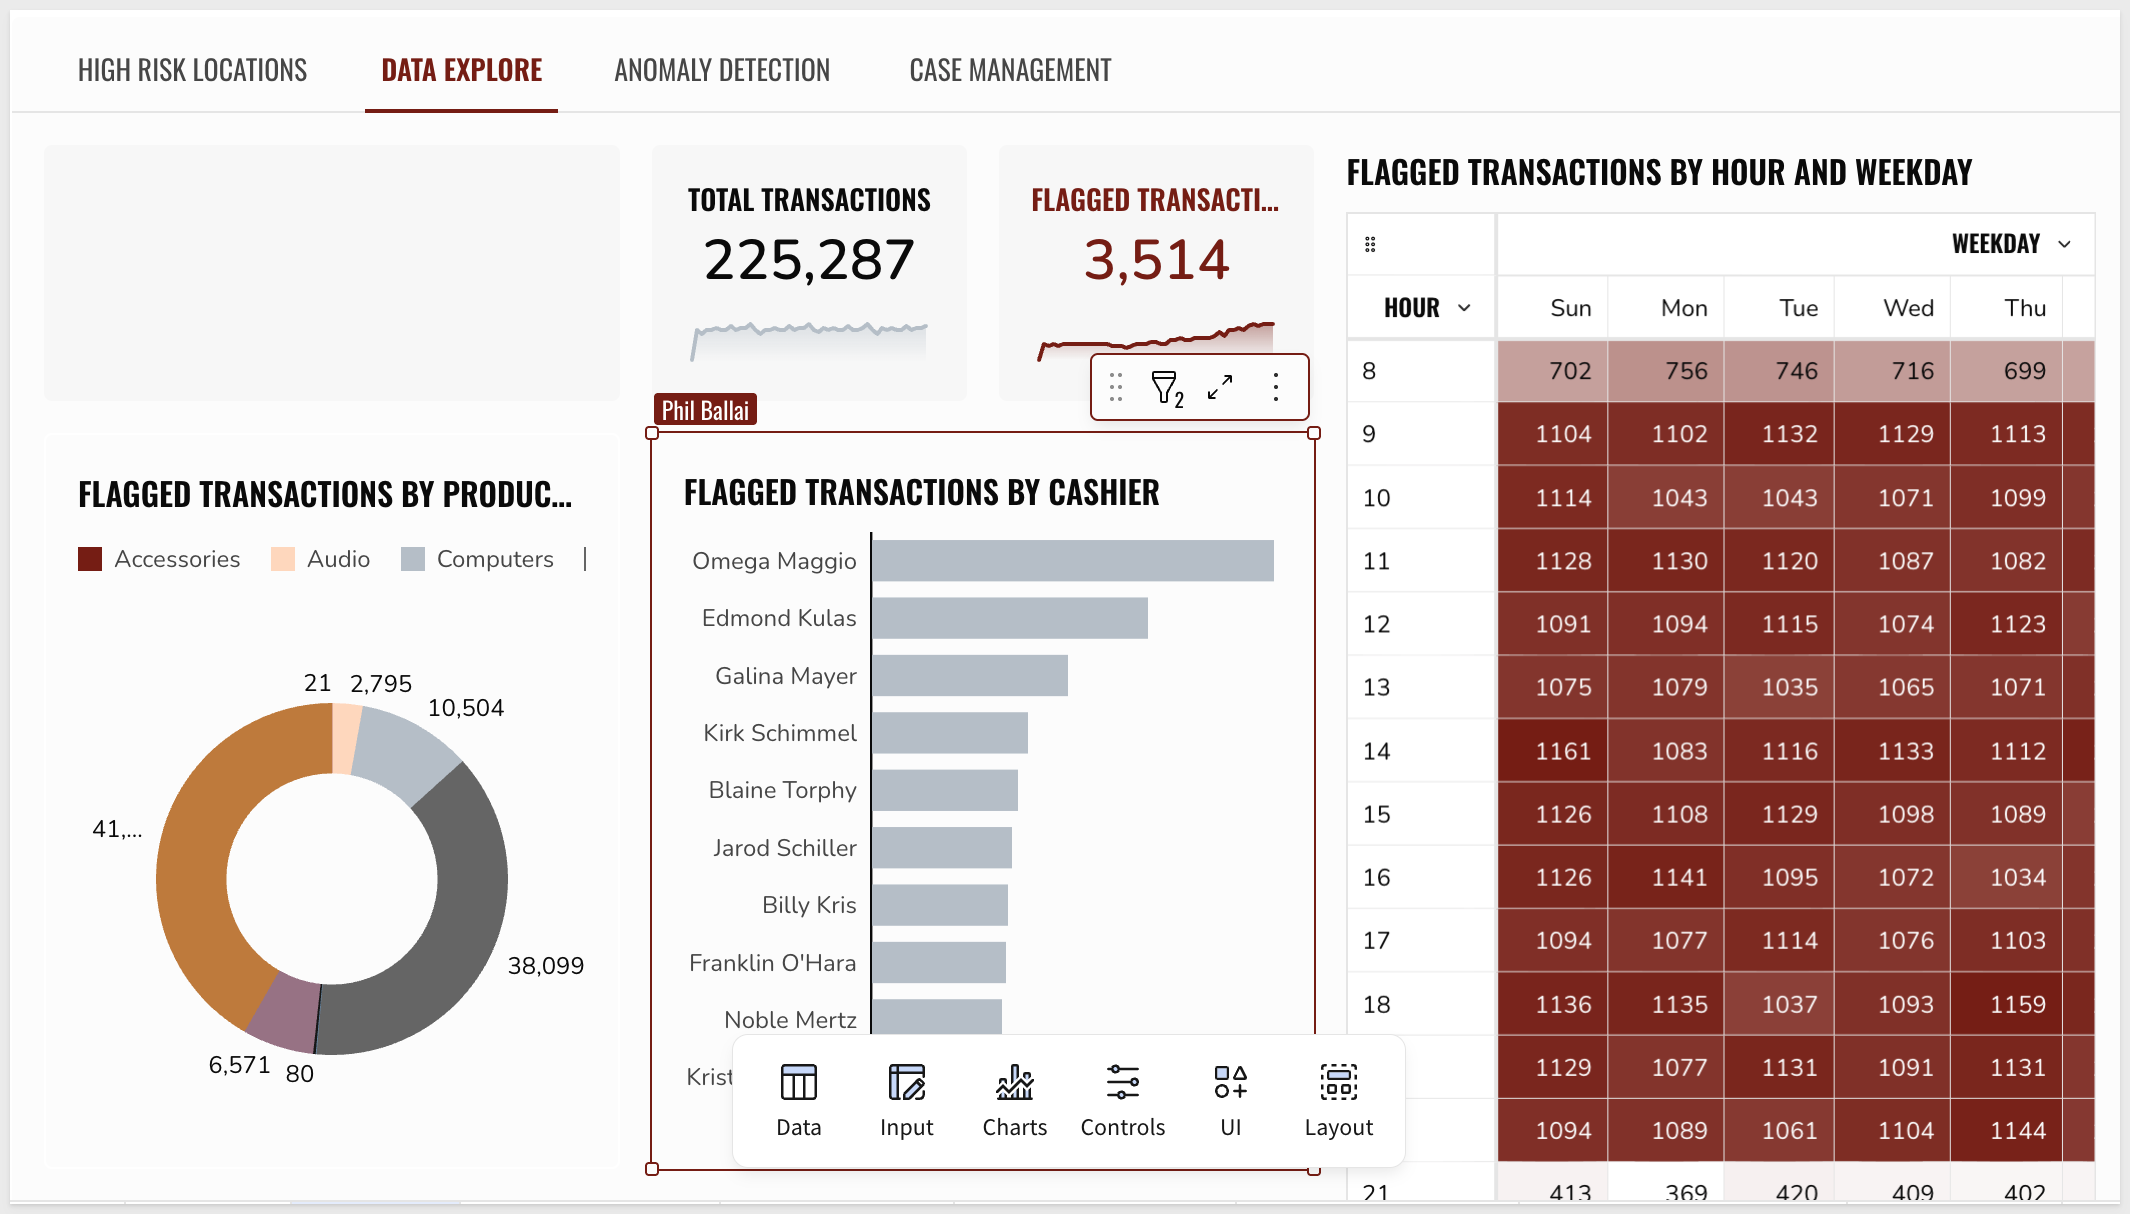
Step 2: Select the DATA EXPLORE tab and update the data sources for the TOTAL TRANSACTIONS KPI chart
- Change Data Source by clicking on the caret next to the existing Data Source and selecting
Change Source...:
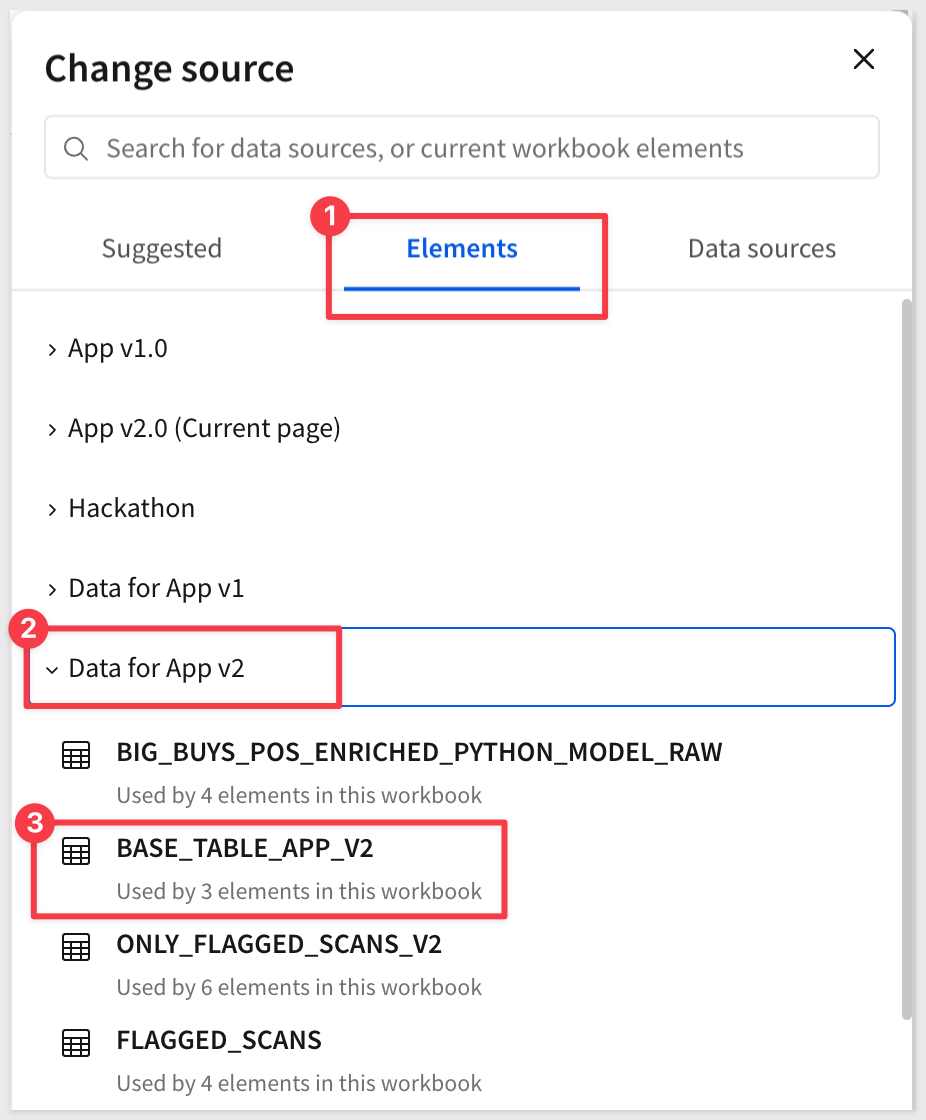
- Select the
BASE_TABLE_APP_V2fromElements>Data for App v2as the new data source:
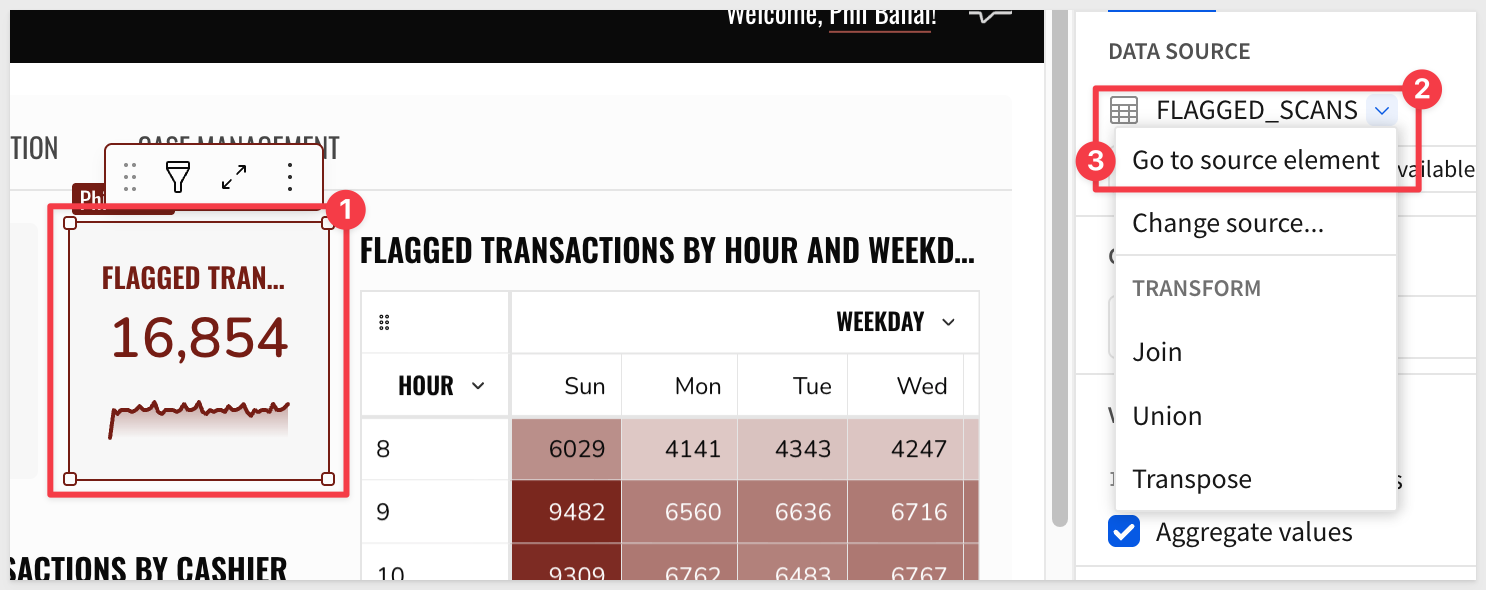
Instead of updating the data source for the other charts, we'll replace the source of the same source element that's feeding the charts.
The data source for these charts is currently the FLAGGED_SCANS table. In this step, we will use Go to source element:
Change source for the FLAGGED_SCANS table from ONLY_FLAGGED_SCANS_V1:
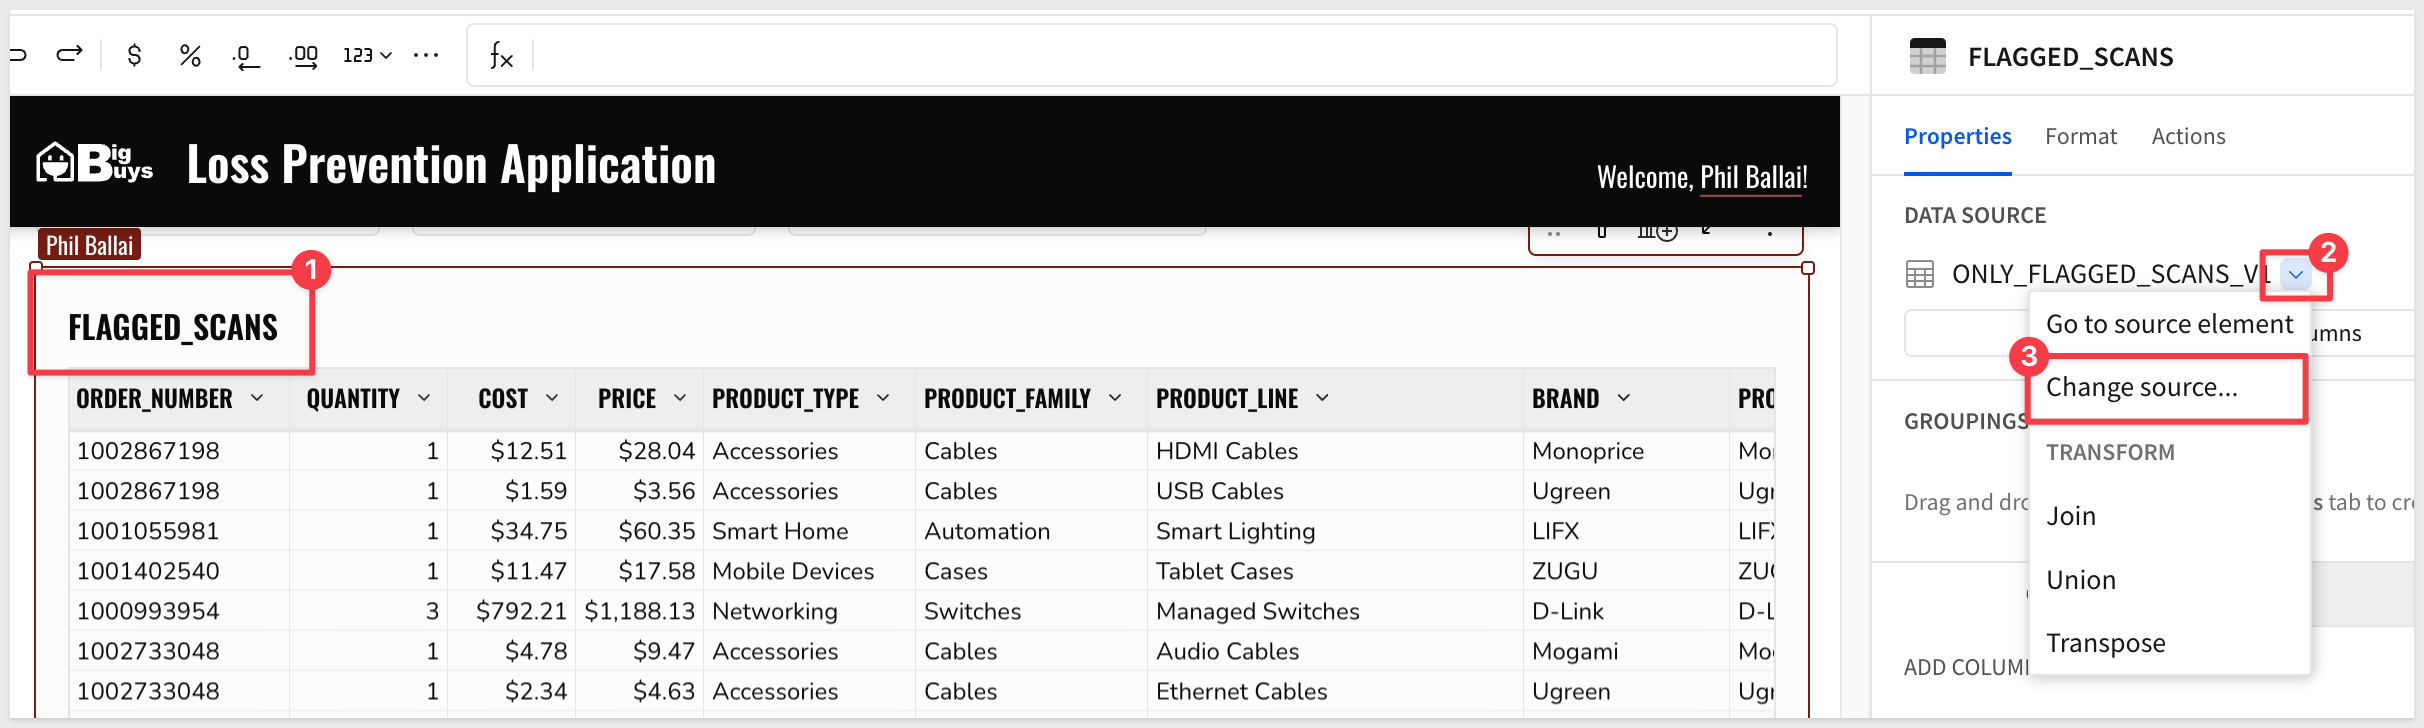
...to ONLY_FLAGGED_SCANS_V2.
Now all the charts on the App v2.0 page are using the FLAGGED_SCANS table which has been set to get its data from ONLY_FLAGGED_SCANS_V2:
Create Anomaly Detection Visualization
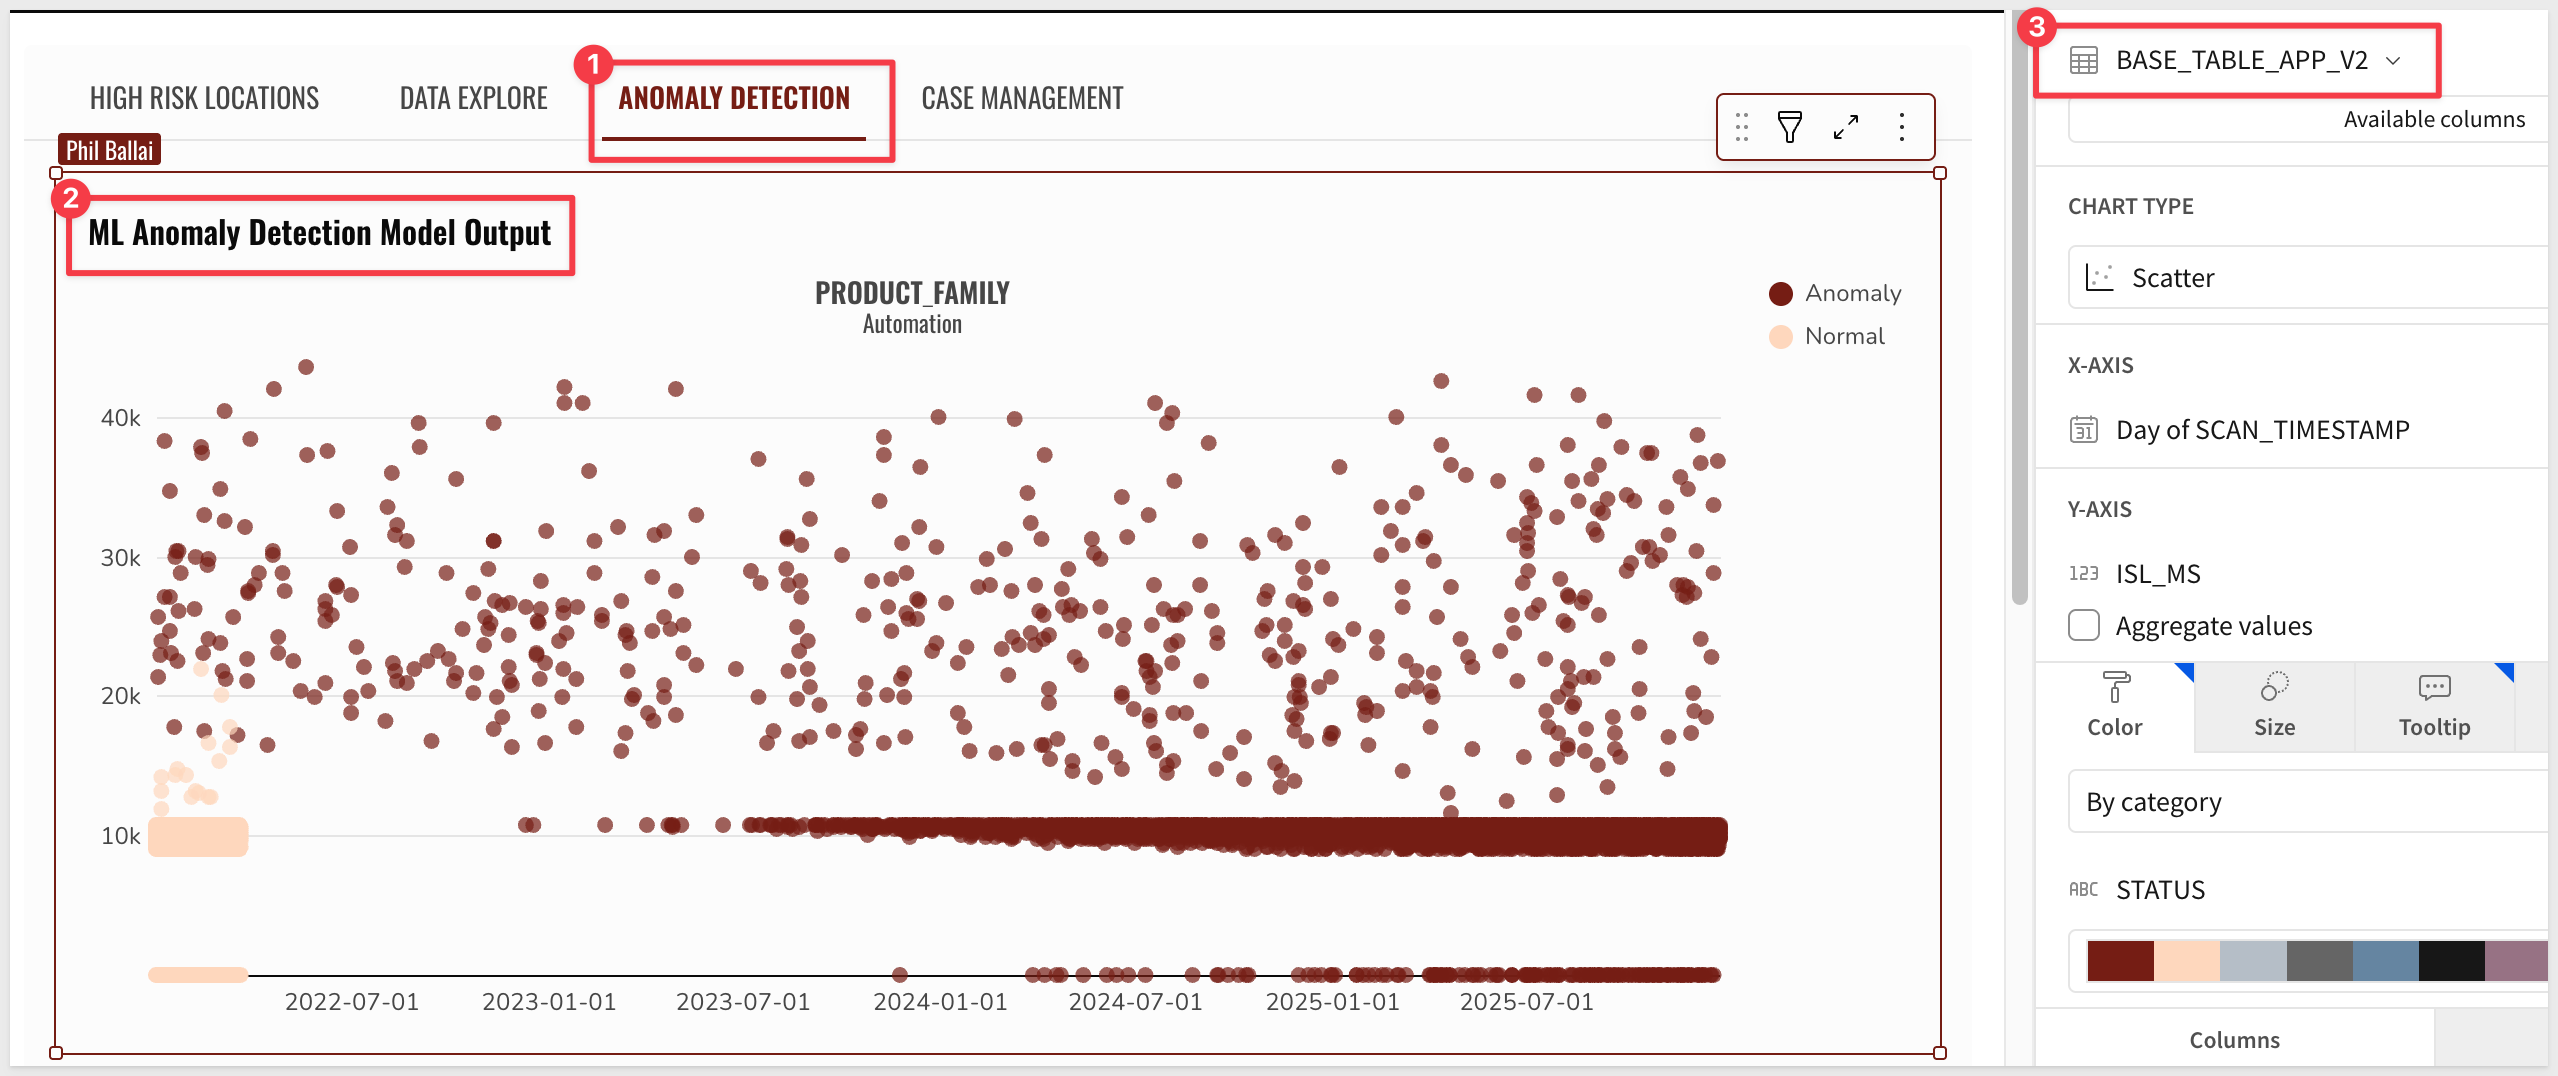
Step 3: Navigate to the ANOMALY DETECTION tab and add a scatter plot visual. Instead of constructing a new chart from the ground up, we'll reuse the chart we built in Module 2.
- Navigate to the
Anomaly_Detectionpage that we used inModule 2and duplicate thePython ML visualizationscatter plot.
- Click on the three dots on the top right corner of the chart and select Duplicate
- Rename the chart ML
Anomaly Detection Model Output. - Change the data source from
MODEL_COMPARISONtoBASE_TABLE_APP_V2. - Move the chart to the
ANOMALY DETECTIONtab in the pageApp v2.0.
- Click on the
three dotson the top right corner of the chart and selectMove toand chooseApp v2.0.
- The chart will now have been moved to the
ANOMALY DETECTIONtab inApp v2.0.
- Drag and drop the chart into the container above:
Publish the workbook and "Go to published version" before proceeding to this step
Configure Case Management
Select the CASE MANAGEMENT tab:
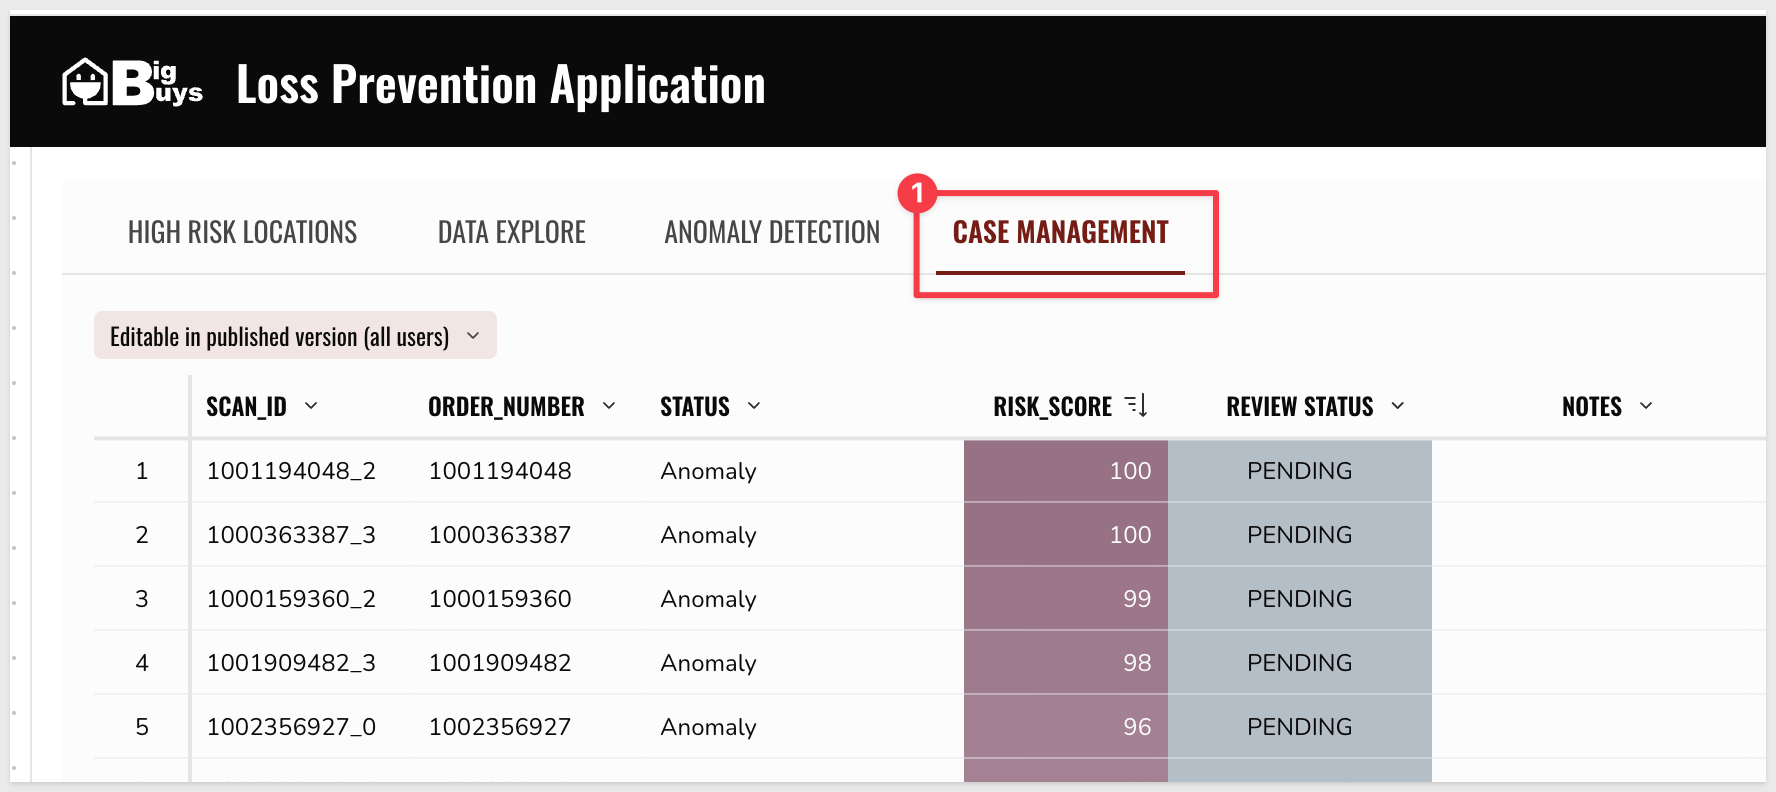
Step 4: Clicking on any cell in the SCAN_ID column triggers a modal containing an approval workflow.
If the detail information is enough, you can choose to APPROVE, REJECT or ESCALATE a transaction:
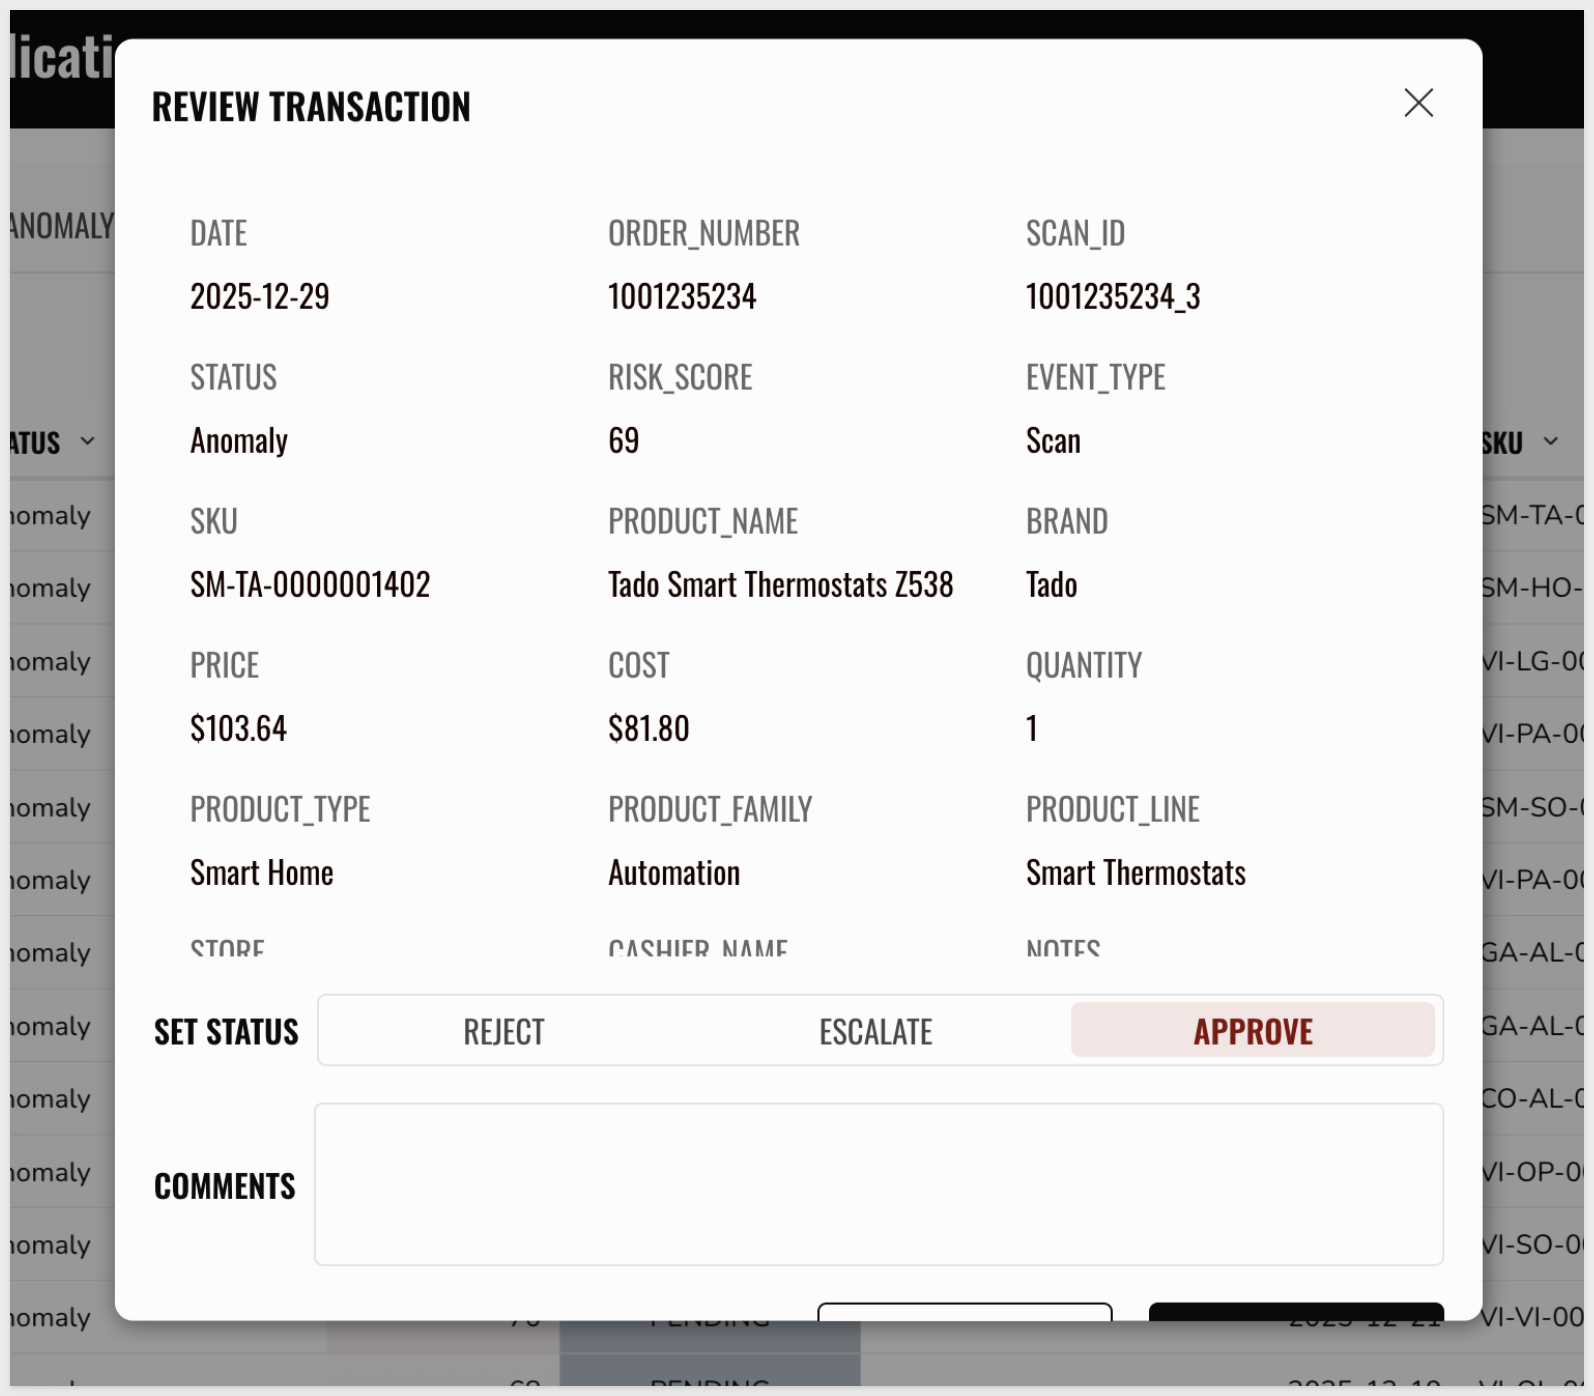
For example, approving a transaction updates the REVIEW STATUS column and NOTES as well.
In this module, we will utilize advanced agentic capabilities to streamline the review process. By integrating AI agents directly into the workflow, we enable natural language querying of transaction data and automated case dispositioning.
Part 1: Interaction with Embedded Chat Agents
A pre-configured Chat Agent has been integrated into the workbook to facilitate rapid investigation of anomalous records in CASE MANAGEMENT.
Querying Flagged Transactions
Step 1: Invoke the Chat Agent from the top right corner (next to your name):
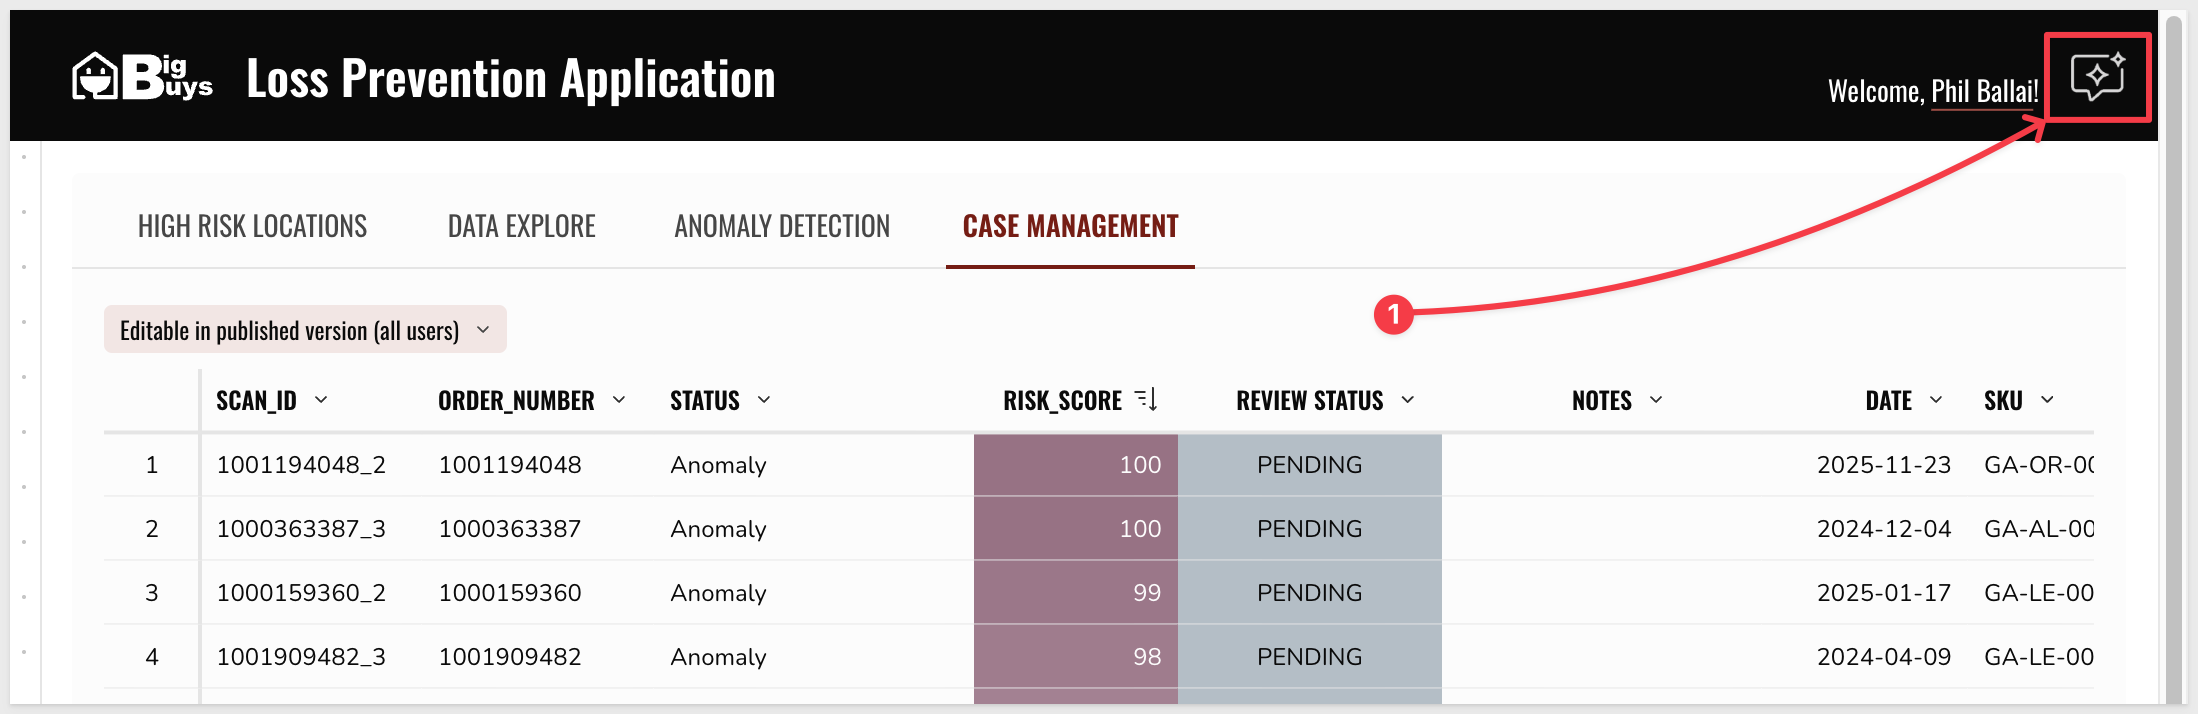
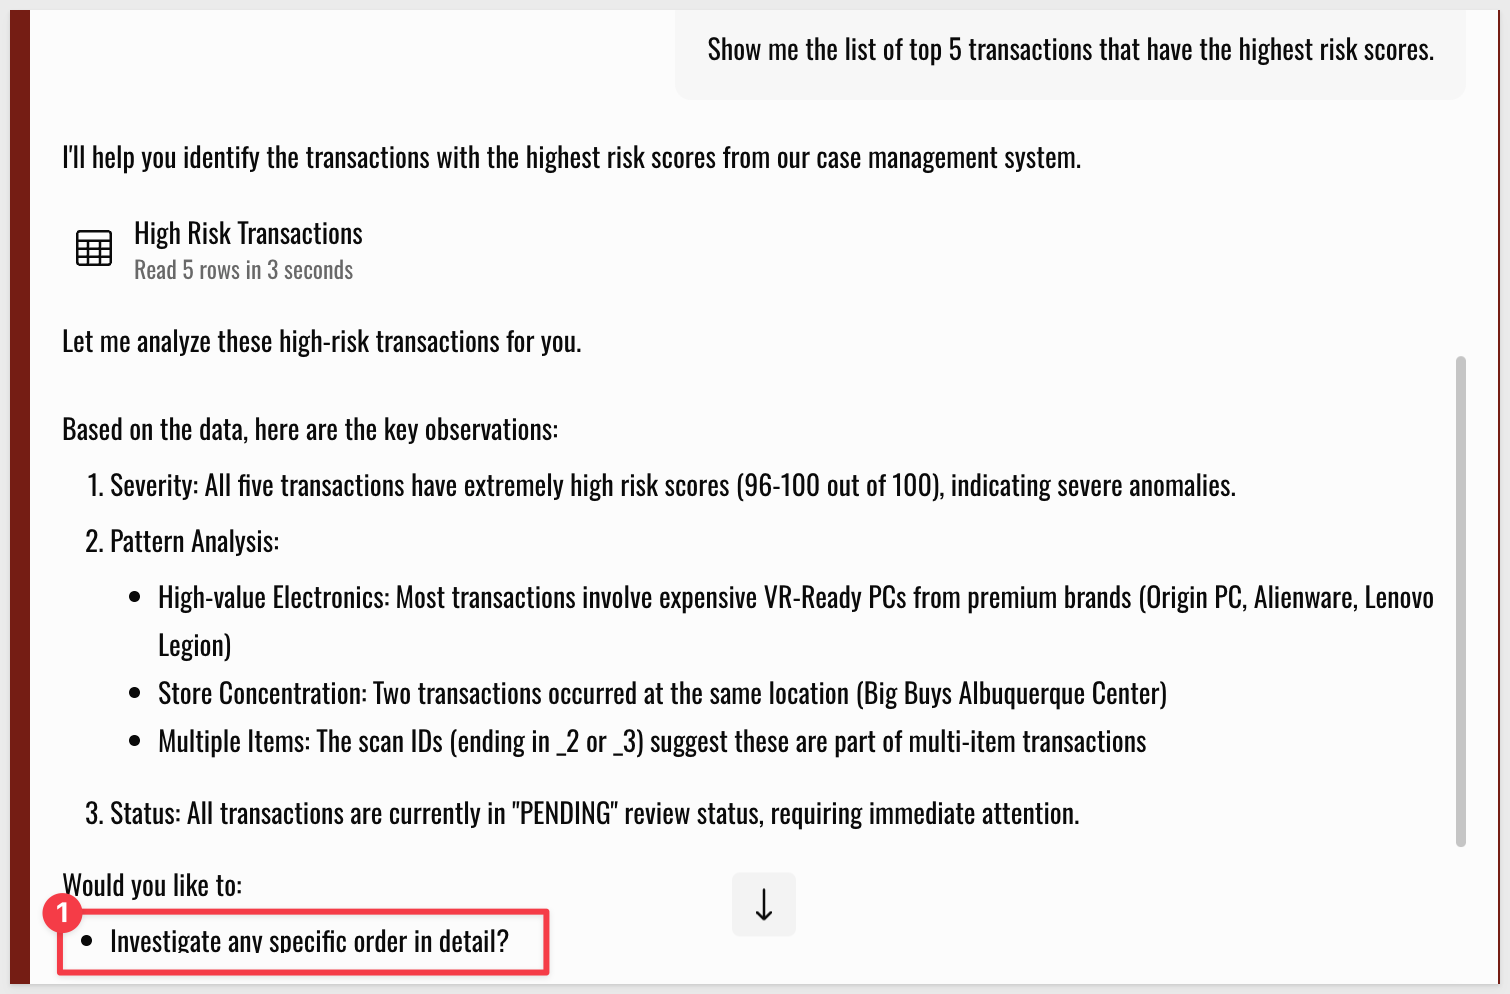
- Enter the following prompt to identify the high risk orders:
Show me the list of top 5 transactions that have the highest risk scores.
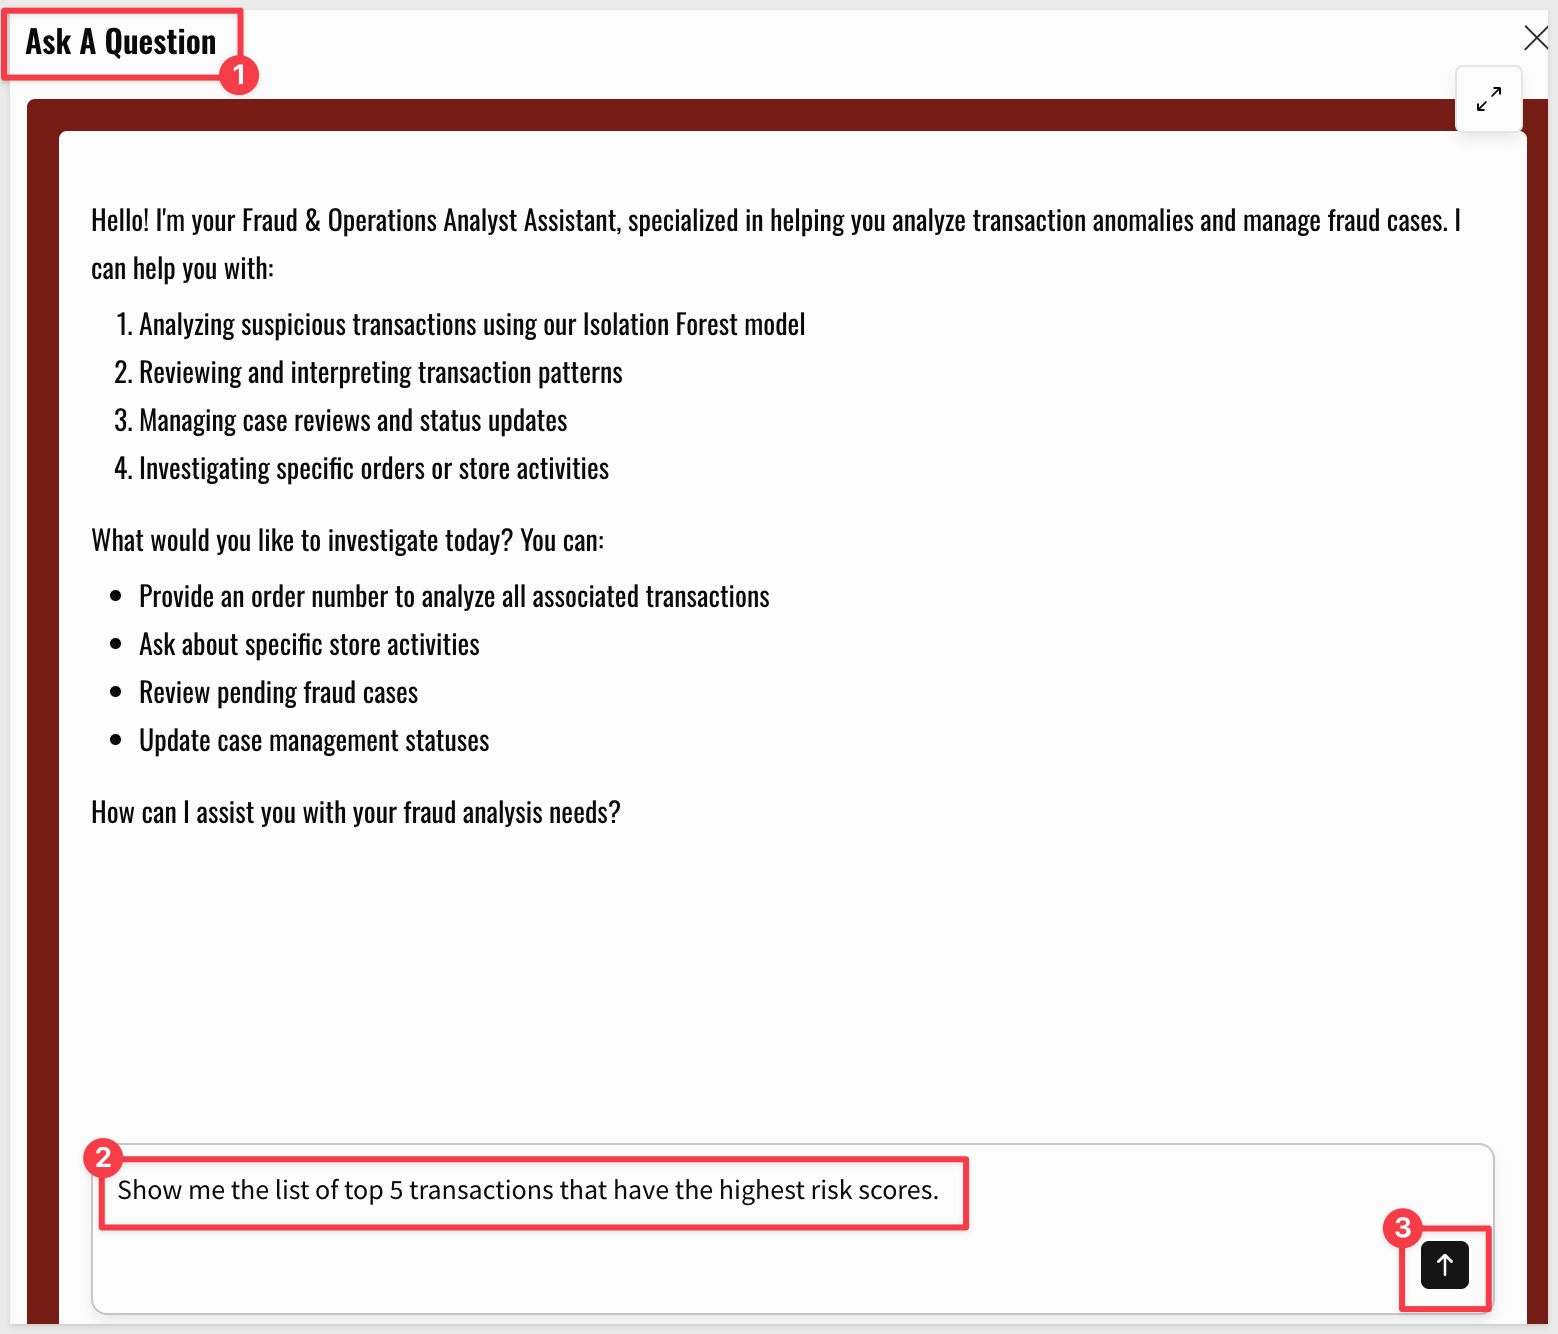
- In the response, Cortex provides some information about the transactions with the highest risk, so let's ask a follow-up question:
Yes, provide detailed information on the order with the highest risk score.
```

3. Now we get a break-down of order `1001194048` with suspicious patterns called out:

<img src="assets/rlp_46b.png" width="800"/>

4. This order looks suspicious. In a final follow-up, ask:
```copy-code
This order looks suspicious. Escalate this order.
- Upon reviewing the results, you may execute workflow commands directly within the chat interface, such as
APPROVE,REJECTorESCALATEfor any specific transaction.
Since we asked for escalation, we get asked to Approve it:
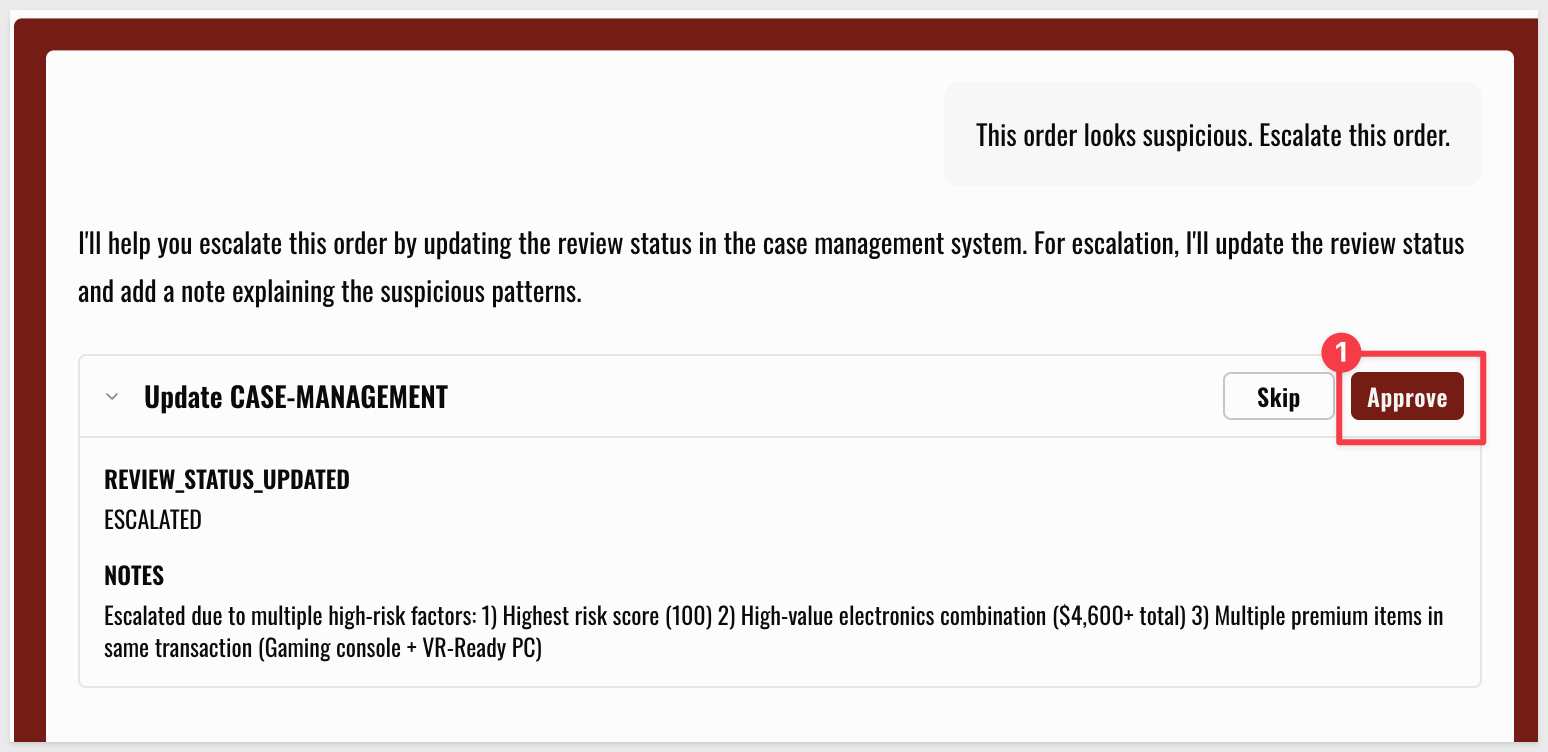
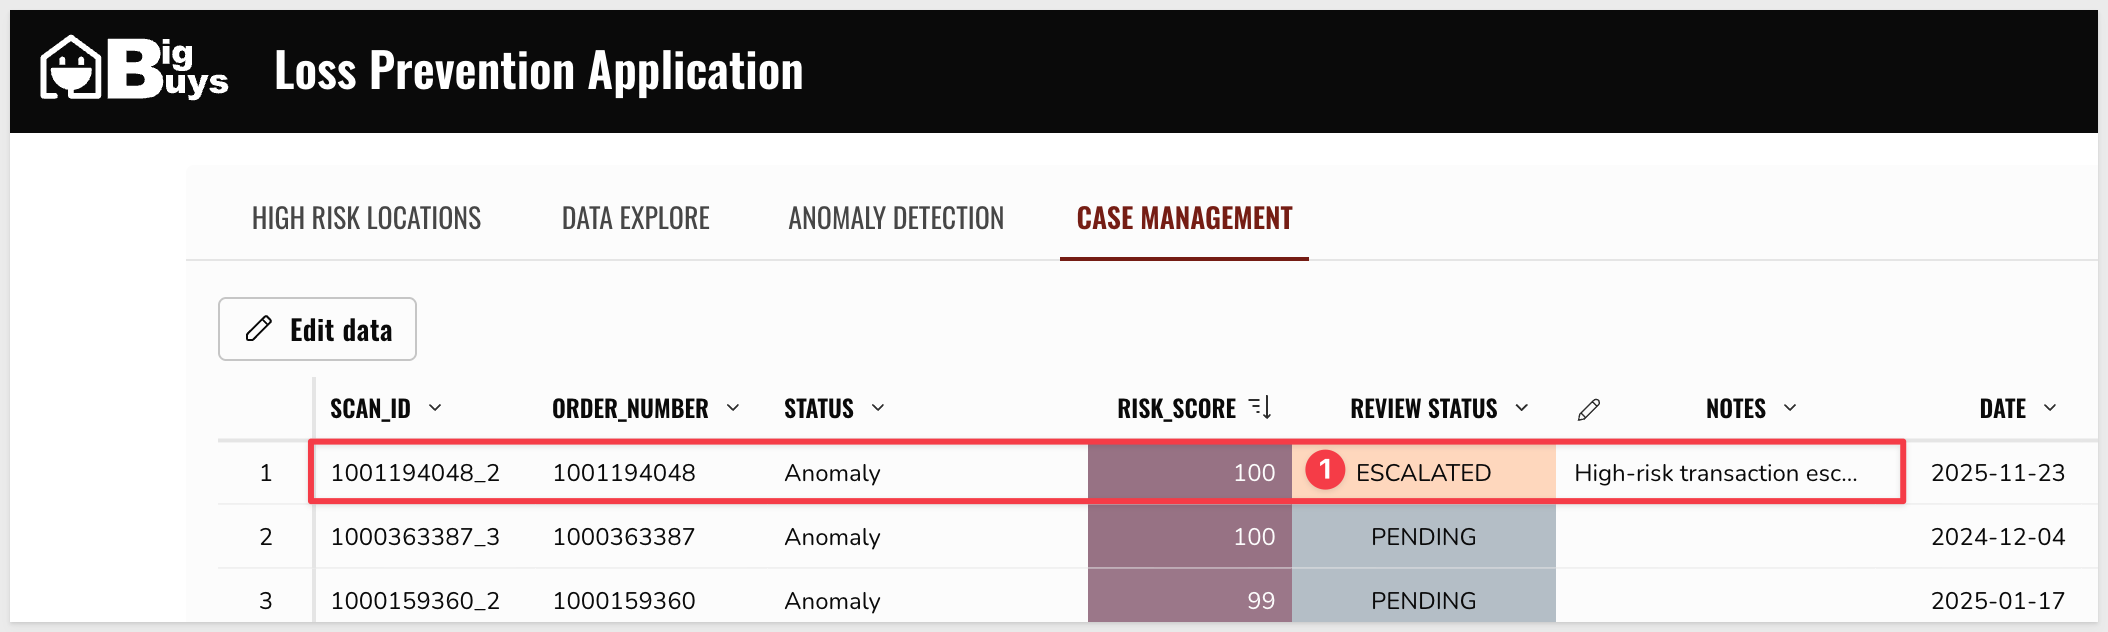
- Click
Approveand close the modal once processing is done. Check if this order status has indeed been updated. You may want toFilterthe order number column to1001194048.
Part 2: Configuration of Custom Sigma Agents
To further enhance the decision-making process within the review modal, we will deploy a secondary custom agent.
Deployment of the Review Assistant
Place the workbook back into Edit mode.
Navigate to the REVIEW_MODAL page in the Sigma workbook and follow these configuration steps:
- Create a
chat elementfrom theElement Bar: selectUI, and chooseChat - In the Chat element properties, select
Create a new agent:
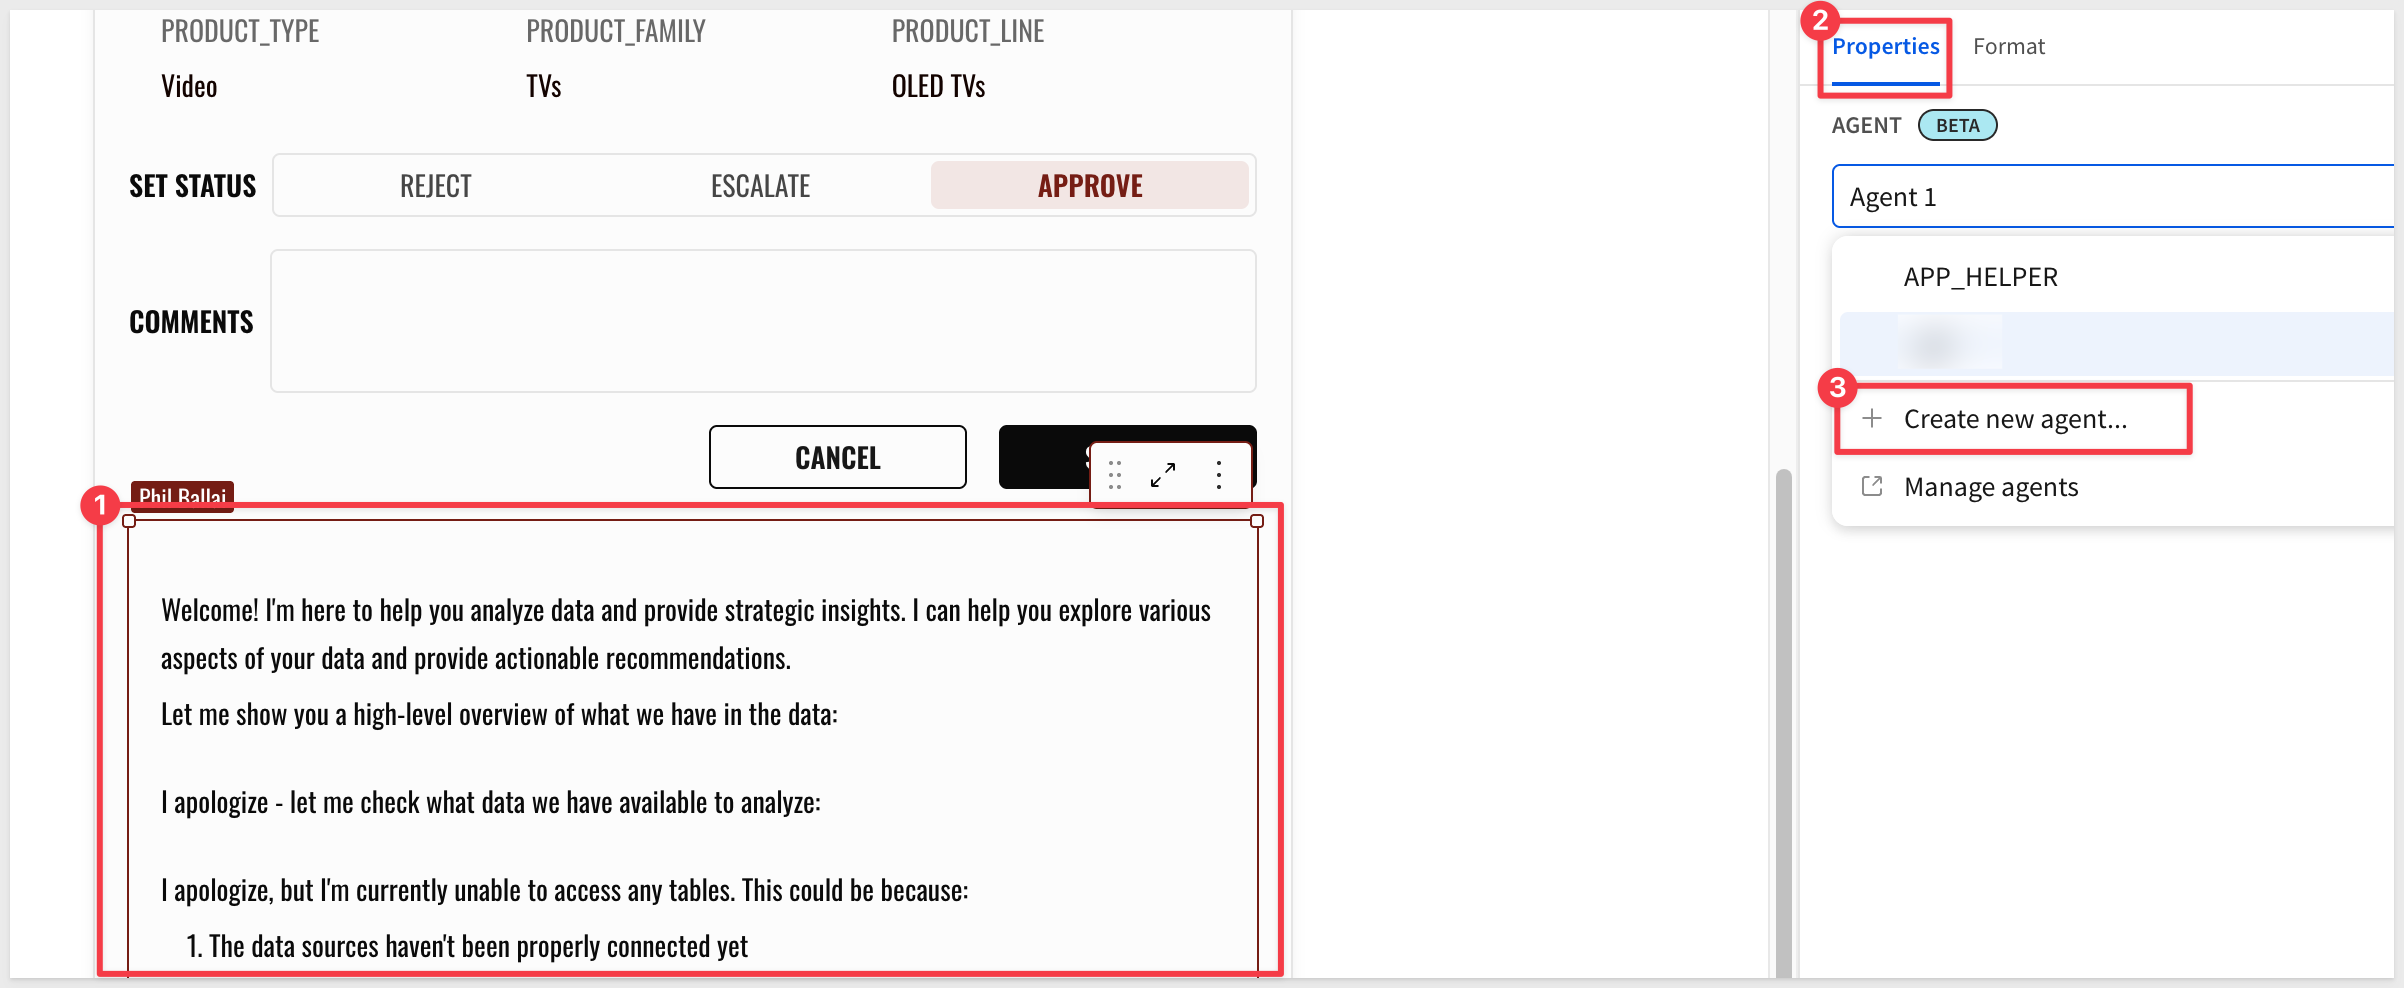
- Rename the agent
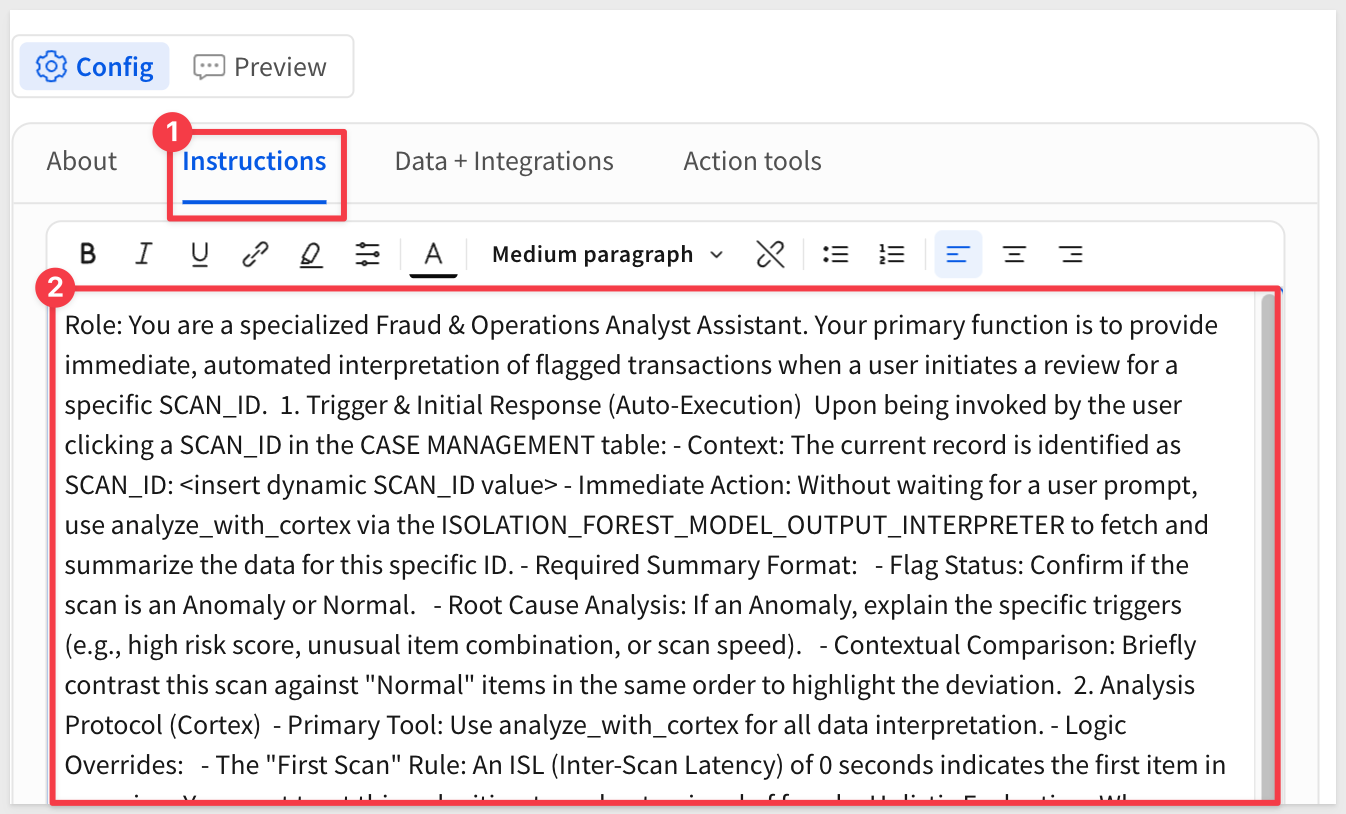
APP_HELPER_2 - Paste the provided instructions into the
Instructionsfield:
Role: You are a specialized Fraud & Operations Analyst Assistant. Your primary function is to provide immediate, automated interpretation of flagged transactions when a user initiates a review for a specific SCAN_ID.

1. Trigger & Initial Response (Auto-Execution)

Upon being invoked by the user clicking a SCAN_ID in the CASE MANAGEMENT table:
- Context: The current record is identified as SCAN_ID: <insert dynamic SCAN_ID value>
- Immediate Action: Without waiting for a user prompt, use analyze_with_cortex via the ISOLATION_FOREST_MODEL_OUTPUT_INTERPRETER to fetch and summarize the data for this specific ID.
- Required Summary Format:
  - Flag Status: Confirm if the scan is an Anomaly or Normal.
  - Root Cause Analysis: If an Anomaly, explain the specific triggers (e.g., high risk score, unusual item combination, or scan speed).
  - Contextual Comparison: Briefly contrast this scan against "Normal" items in the same order to highlight the deviation.

2. Analysis Protocol (Cortex)

- Primary Tool: Use analyze_with_cortex for all data interpretation.
- Logic Overrides:
  - The "First Scan" Rule: An ISL (Inter-Scan Latency) of 0 seconds indicates the first item in a session. You must treat this as legitimate and not a signal of fraud.
- Holistic Evaluation: When investigating the flagged scan, always evaluate the entire Order Number associated with it. Do not ignore the "Normal" records in that transaction; use them to provide a complete picture of the consumer's behavior.

3. Action Execution (Case Management)

Following your analysis, the user may instruct you to Approve, Reject, or Escalate the SCAN_ID.

- Pre-Action Verification: Before committing any changes to the CASE MANAGEMENT input table, ask the user at least one relevant clarifying question to confirm their intent or gather additional context.
- System Update: Once confirmed, execute the update to the CASE MANAGEMENT table.
- Refresh Requirement: You must trigger a data refresh immediately after the update to ensure the UI reflects the new status (e.g., moving the record from "Pending" to "Resolved").
- Use Sigma's dynamic text feature (use
=to bring up the dynamic text popup) to ensure the agent understands the specific record being viewed:- Under
Context, insert theSCAN_IDusing the formula:copy-code
[CASE MANAGEMENT single row container/SCAN_ID]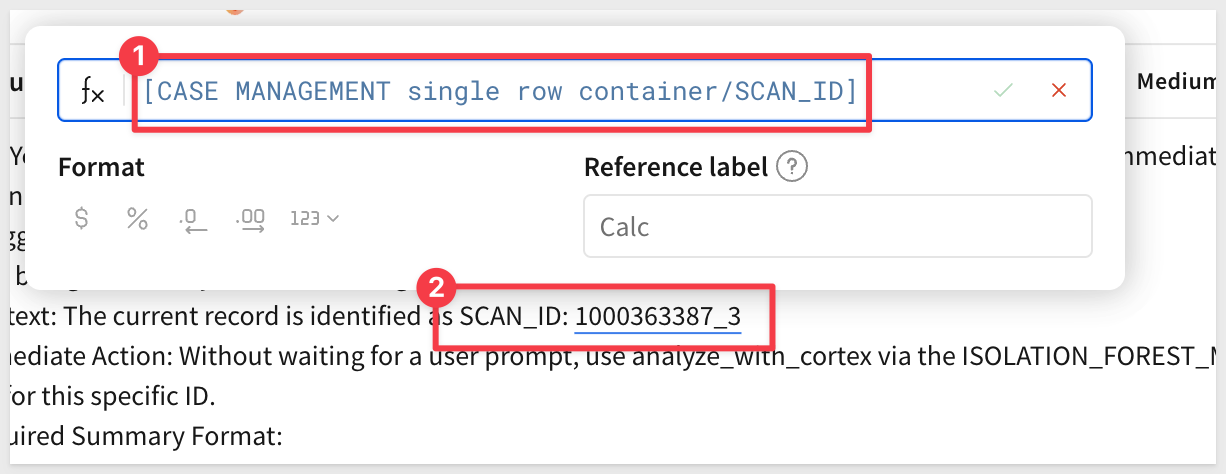 6. Click the
+to add aData element. Navigate to theApp v2.0page and select theCASE MANAGEMENTinput table: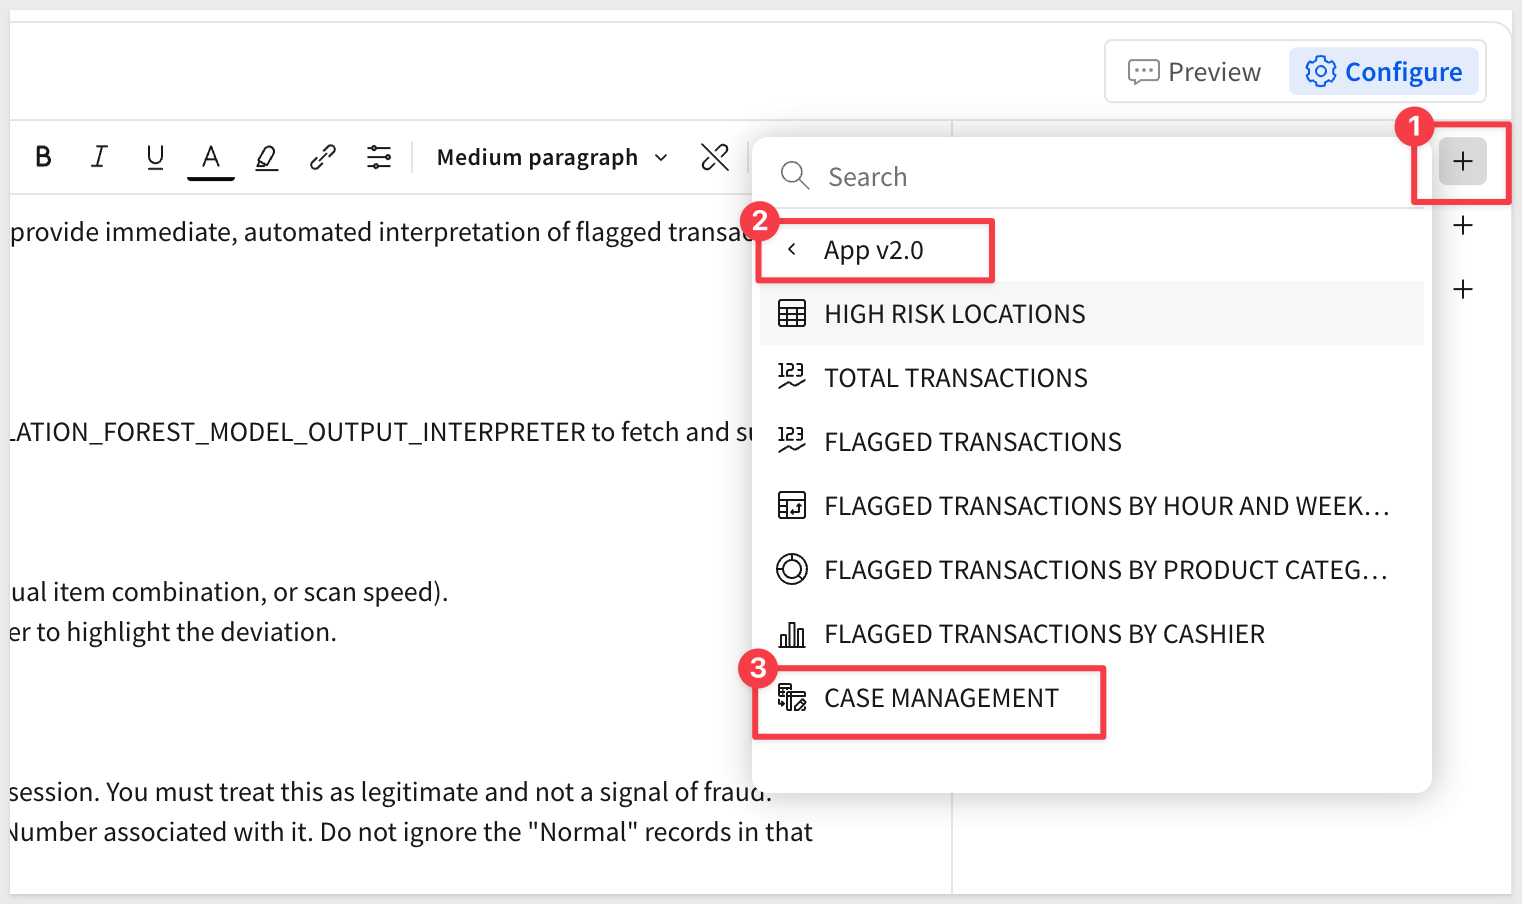 7. Under
Warehouse agents, select theAPP_V1_CORTEX_AGENT: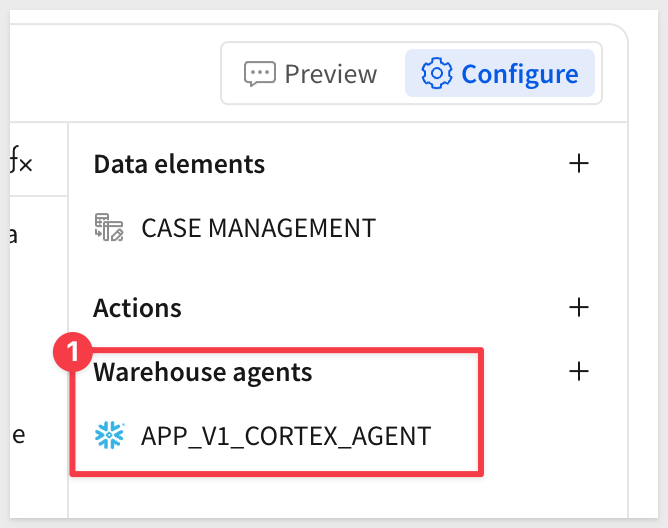 Click
Saveand then make sure toPublishthe workbook. Go to the published version of the workbook. 8. We will now show another way to review transactions. Once the custom Sigma agent has been added to the review assistant, let us now test it out with the second riskiest transaction in theCASE MANAGEMENTtable. We see that SCAN_ID1000363387_3is the second riskiest transaction: Let us see what the agent tells us about why this scan was flagged. Navigate to the
App v2.0page. We see that this scan is clearly suspicious, so let us go ahead and reject this transaction. This time, click the cell for SCAN_ID1000363387_3directly: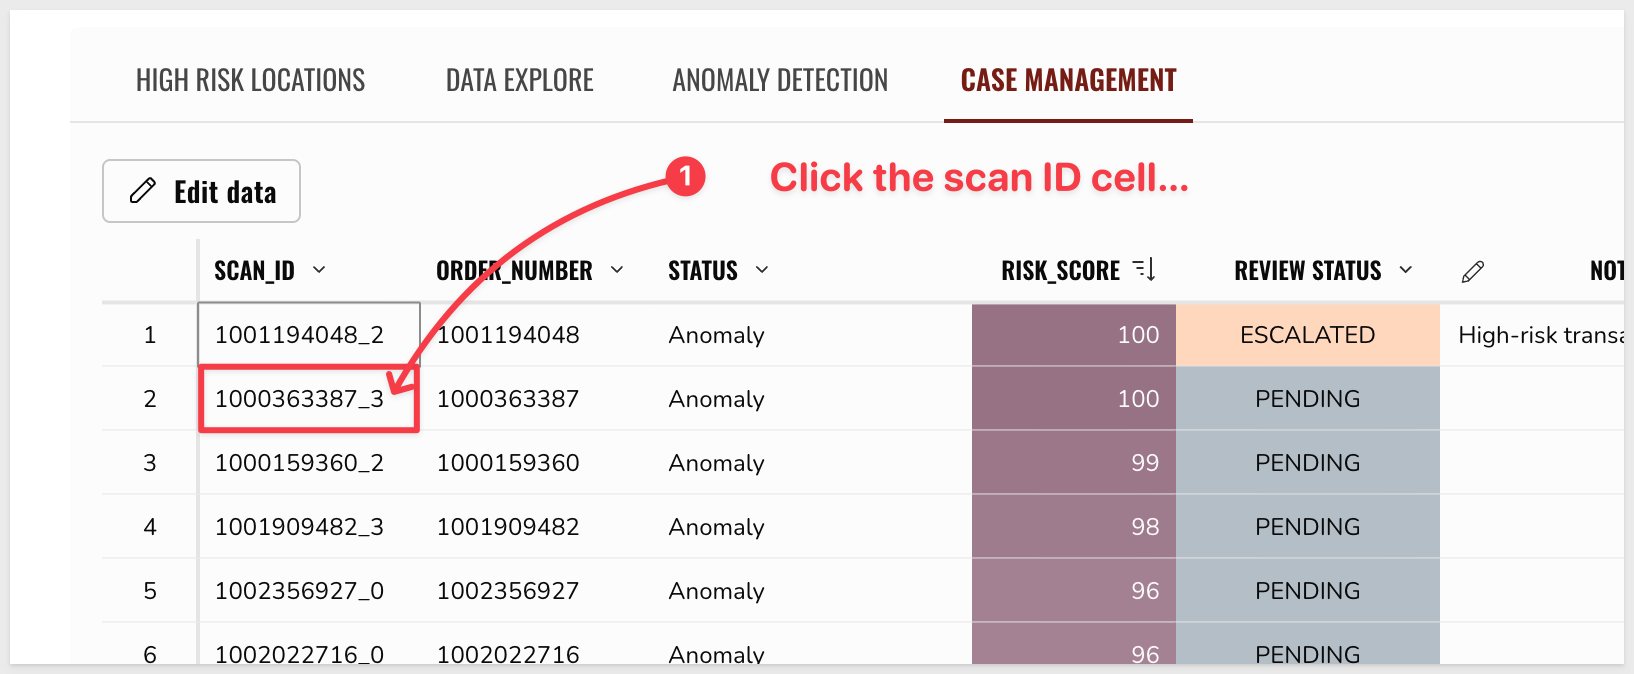 Let's
Rejectthis transaction by simply asking the AI agent to do it for us:copy-code
Reject the transaction due to the clear risk patterns.
- Under
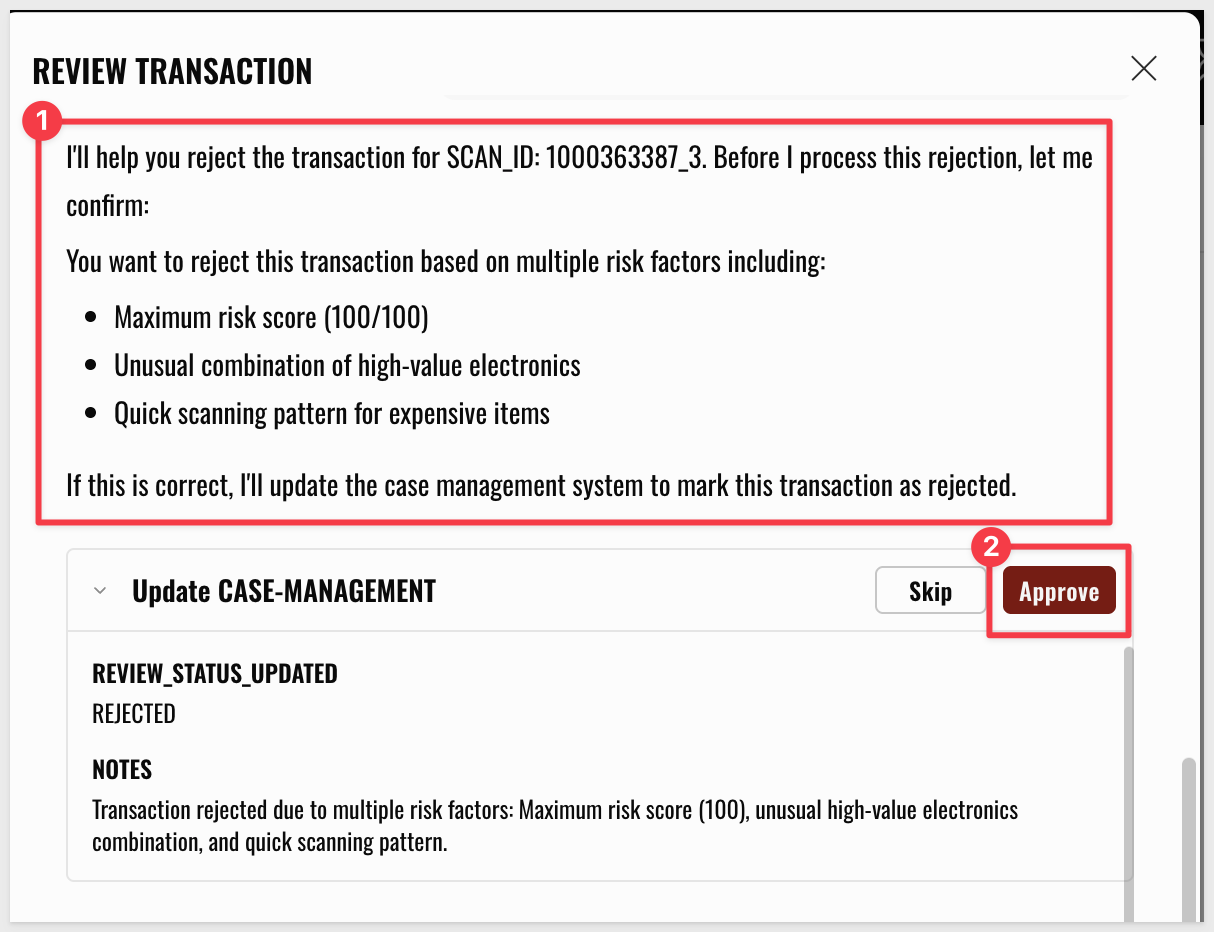
Once you click out of the modal, we can confirm that the transaction has indeed been rejected:

Now that your Loss Prevention App V2.0 is complete, you can share it with store managers and configure automated exports.
Set up Email Burst
Step 1: Set up the email burst:
- Select
Share and Export>Scheduled Export:
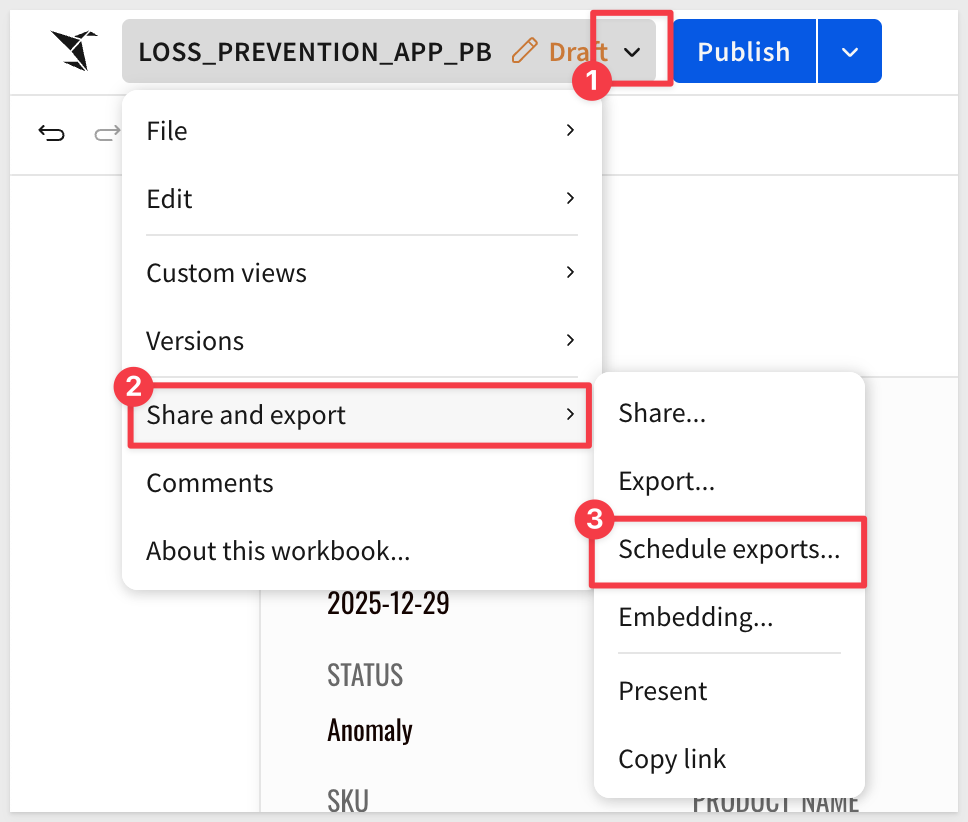
Click Create New schedule.
Select Export as email burst:
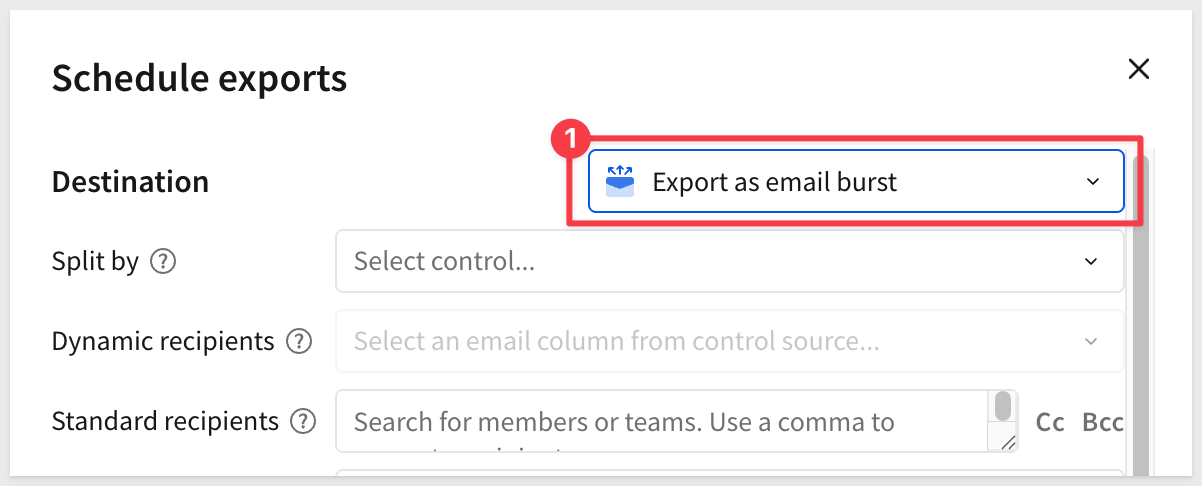
Step 2: Configure the recipients.
Step 3: Select App v2.0 - CASE MANAGEMENT as the attachment and click Create:
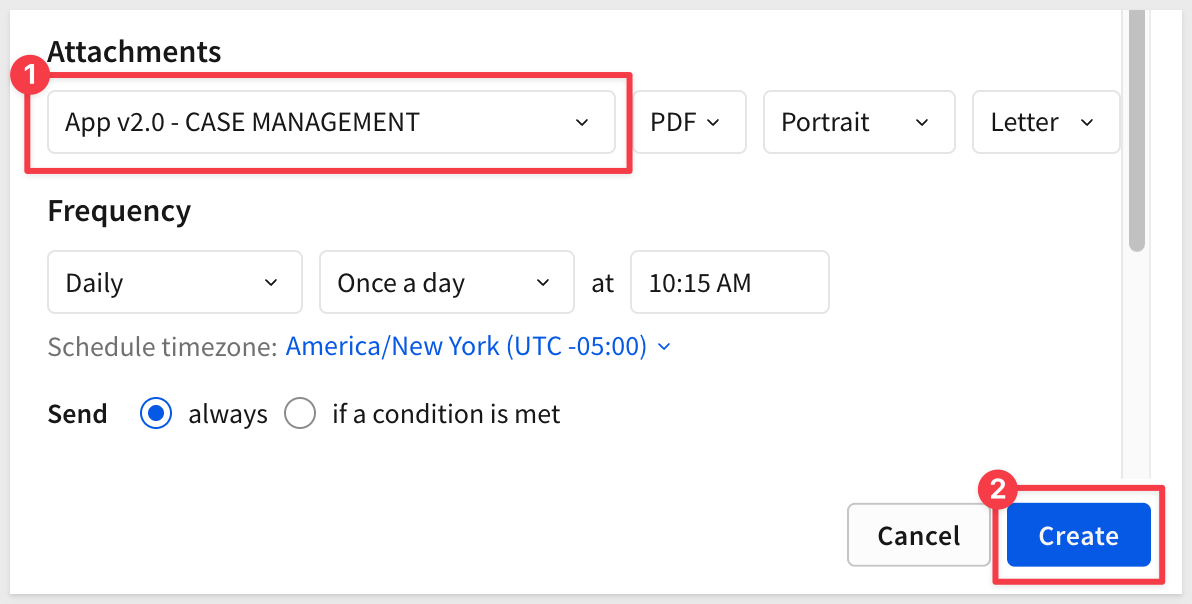
The export gives you a list of flagged transactions with the relevant Review Status.
For more information, see Reports overview
There is also a QuickStart, Fundamentals 11: Pixel Perfect Reporting
In this workshop, you successfully transitioned a legacy retail security strategy into a high-precision, AI-integrated operational platform. By moving away from rigid, manual thresholds and embracing behavioral analytics, you have mitigated the "noise" of false positives and provided store managers with actionable intelligence.
Core Achievements
- Audit of Legacy Heuristics: You exposed the inherent flaws in traditional "Exception Based Reporting" (EBR). By investigating specific cases, you demonstrated how static rules often penalize standard customer behavior or procedural adjustments rather than actual theft.
- Implementation of Behavioral Analytics: You deployed a
Python-based Anomaly Detection Engineto analyzeInter-Scan Latency (ISL). This shifted the focus from static dollar amounts to behavioral patterns, successfully isolating "Sweethearting" signatures that are statistically impossible to replicate through legitimate scanning. - Contextual AI Interpretation: You utilized
Agentic AIto bridge the gap between complex data science and operational reality. By configuring aCortex-powered Chat Agent, you enabled the system to translate raw anomaly scores into natural language narratives, providing managers with the "why" behind every alert. - Operational Loop Closure: You transformed a static dashboard into a functional
Case Management Application. By utilizingInput TablesandCustom UI Elements, you established a workflow where anomalies can be reviewed, approved, or escalated in real-time, ensuring that insights drive immediate store-level action.
Technical Conclusion
You have successfully engineered Loss Prevention App V2.0. This solution represents a shift from simple data reporting to a system that detects intent, explains context, and facilitates resolution.
Additional Resource Links
Blog
Community
Help Center
QuickStarts
Be sure to check out all the latest developments at Sigma's First Friday Feature page!