Sigma's App Templates are ready-to-use applications built on Sigma's native features and connected to sample data. Each one ships fully functional — you can explore it immediately, learn how it's built by switching to edit mode, and adapt it to your own data and workflows without starting from scratch.
The Budget Variance Analysis app gives finance and FP&A teams a structured end-to-end workflow: identify where actuals diverged from budget, document the explanation, build a reforecast scenario with AI-assisted recommendations, and route it through executive sign-off — all within a single connected workbook. Once approved, the new baseline is locked and the cycle resets for the next period.
This QuickStart walks through how the app works as a user, how it's designed under the hood, and how to connect it to your own financial data.
Target Audience
Finance and FP&A teams evaluating or adopting Sigma for variance and reforecast workflows. Solutions Engineers and technical stakeholders exploring the app as a reference design.
Prerequisites
- Access to a Sigma environment.
- The Budget Variance Analysis App Template available in your org — find it under
Templates>App Templates. - Write access enabled on a connection — required for input tables that store scenario data, analyst commentary, and budget overrides. See Set up write access
- AI provider configured for your organization — required for the inline AI reforecast and approval recommendations. See Configure AI features for your organization
- Some familiarity with Sigma workbooks is helpful but not required.
What You'll Learn
- How the five-page variance-to-reforecast cycle works end to end
- How to document variance commentary and flag items for reforecast
- How AI recommendations surface on the Reforecast Budget and Executive Signoff pages
- The data architecture that powers named scenarios, budget overrides, and approval tracking
- How to connect the app to your own financial warehouse data

Open and Save the Template
Navigate to Templates in the left sidebar. The Budget Variance Analysis app appears in the Made by Sigma collection:
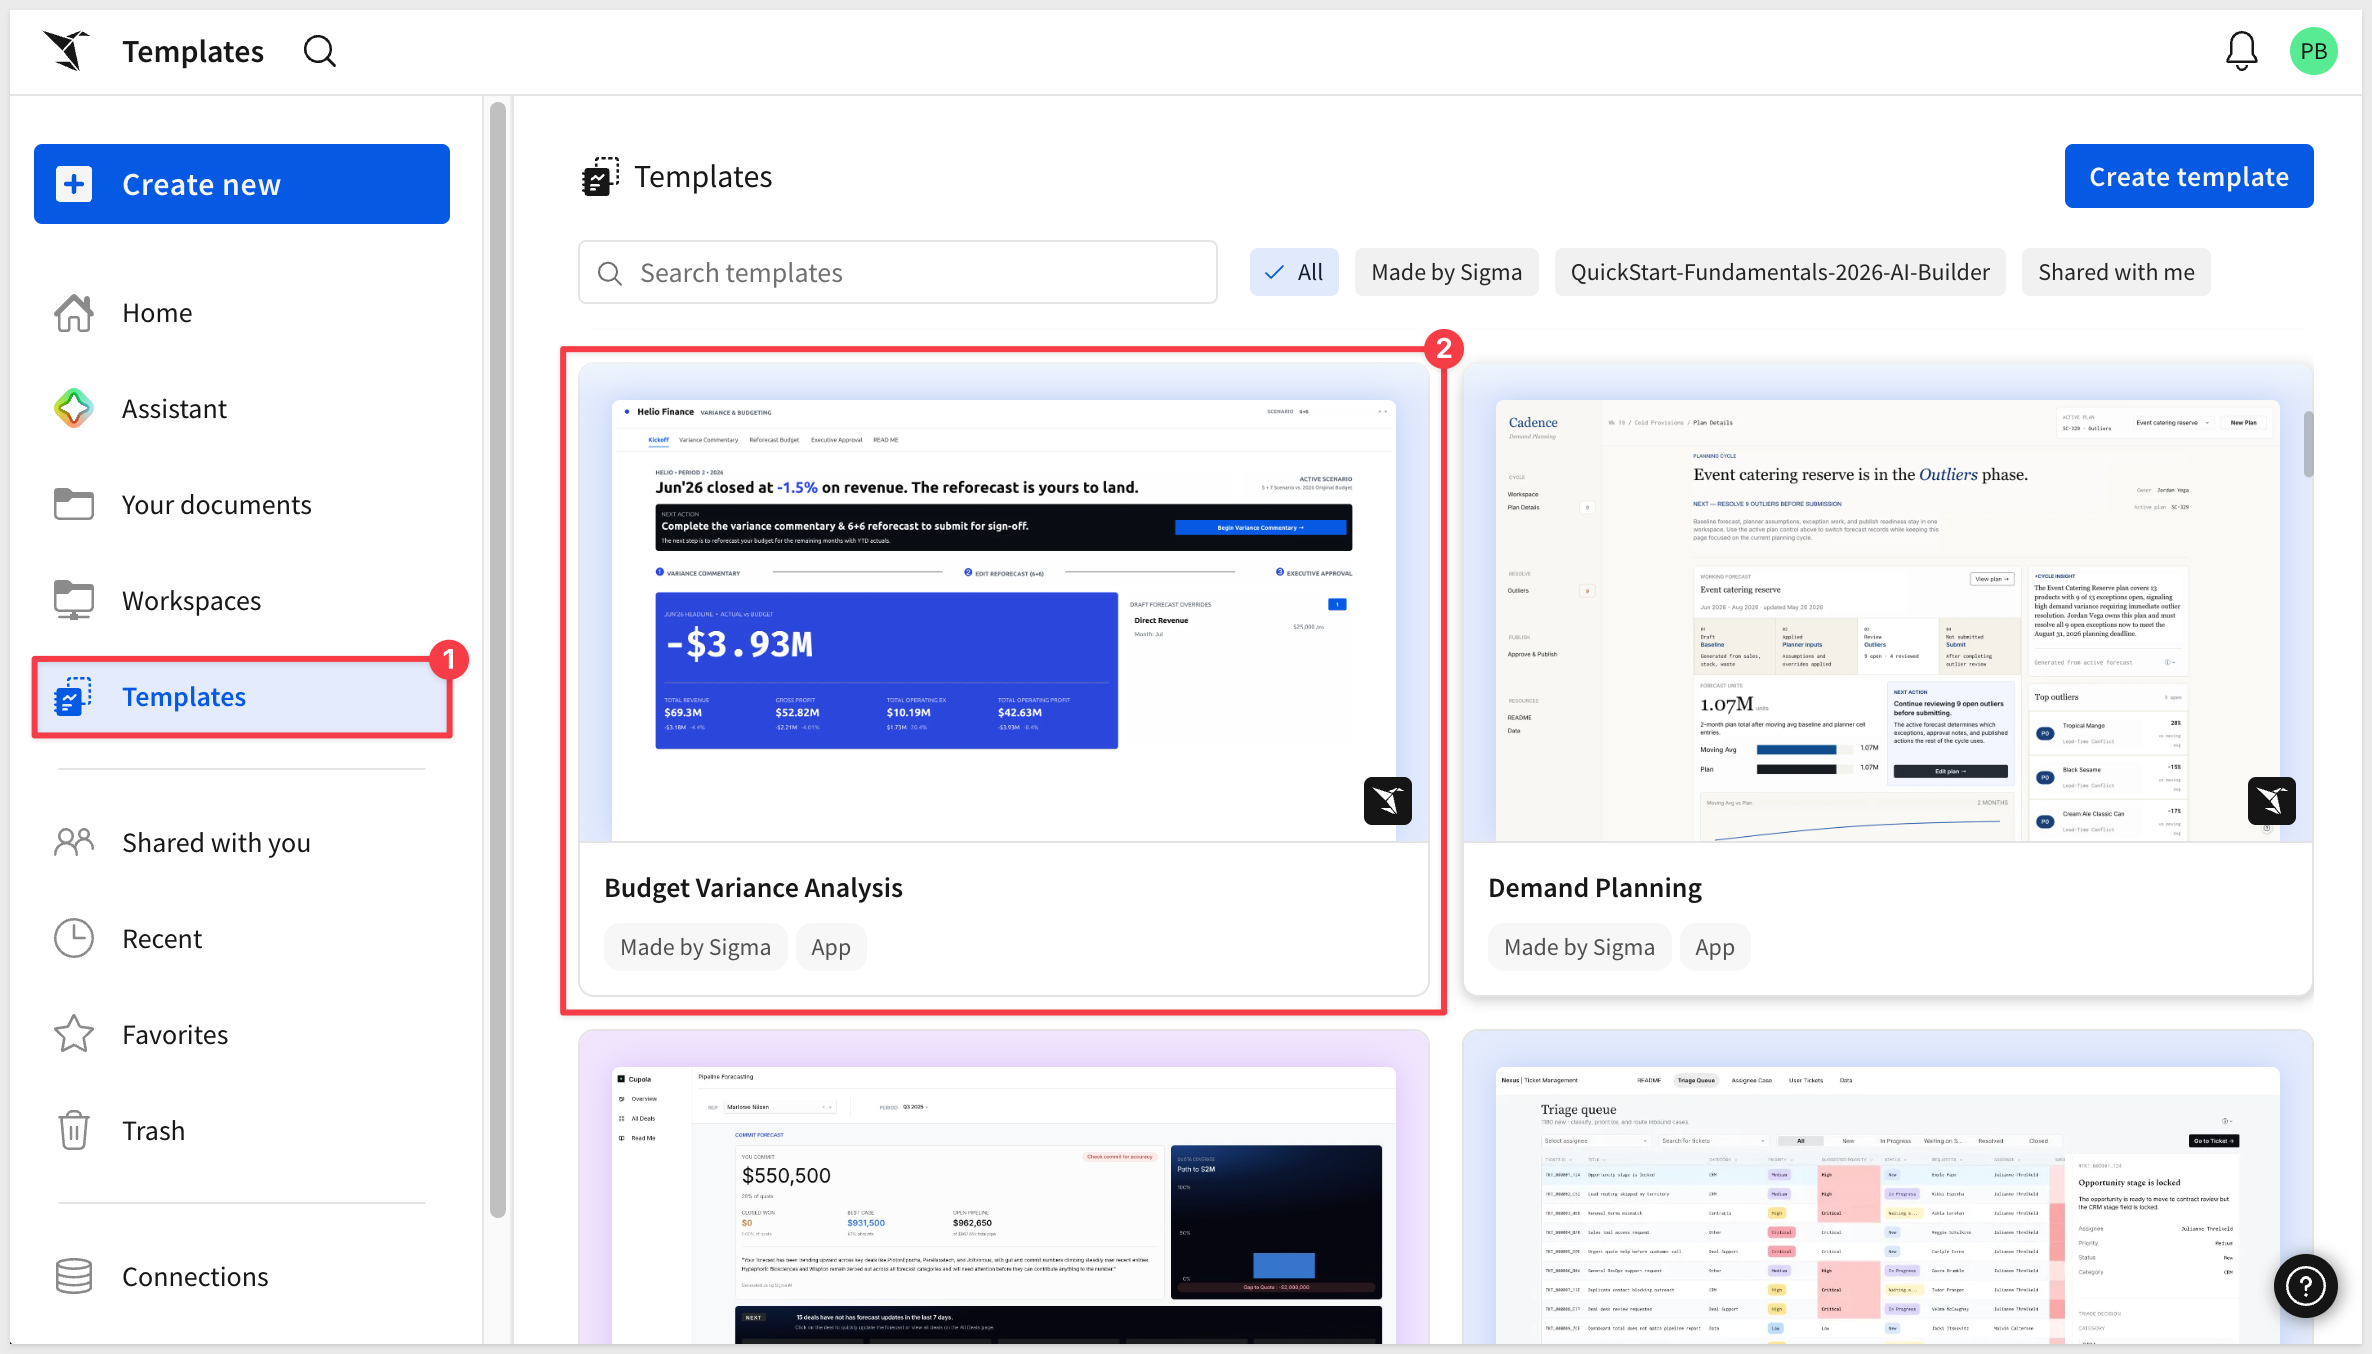
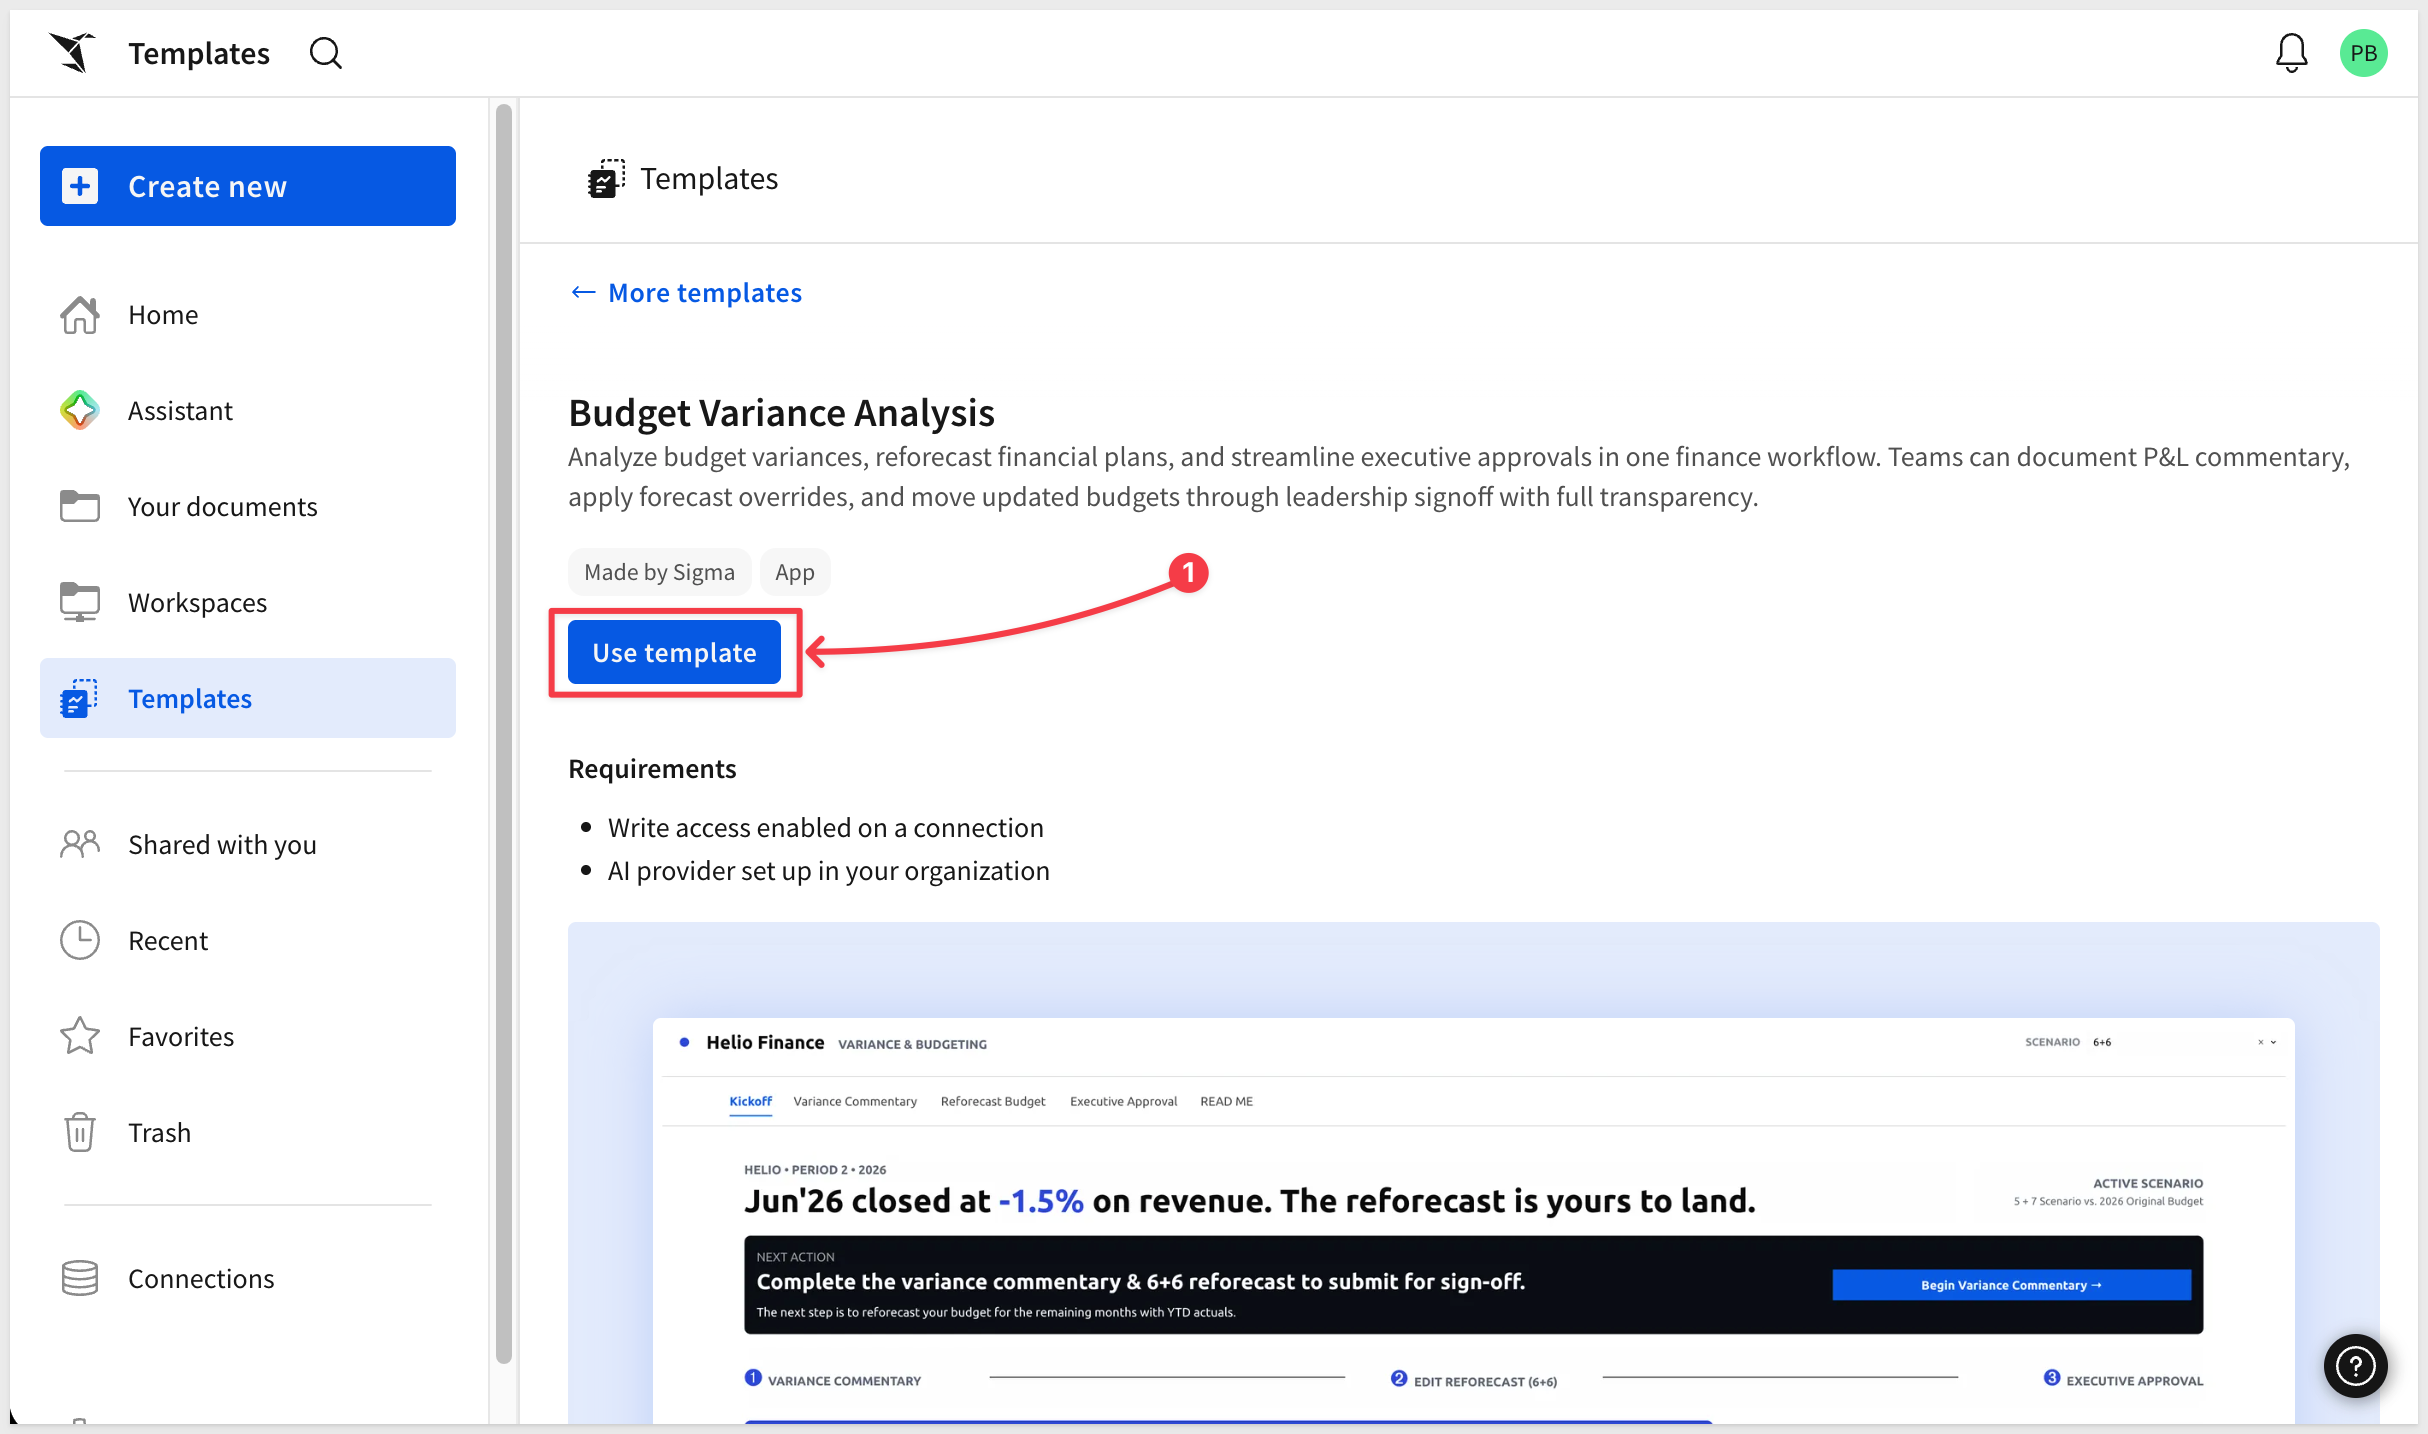
Click the template card to open a preview. Before clicking Use template, confirm the two requirements shown on the detail page are met:
- Write access enabled on a connection — required for all input tables in the app
- AI provider set up in your organization — required for inline AI recommendations
Click Use template:
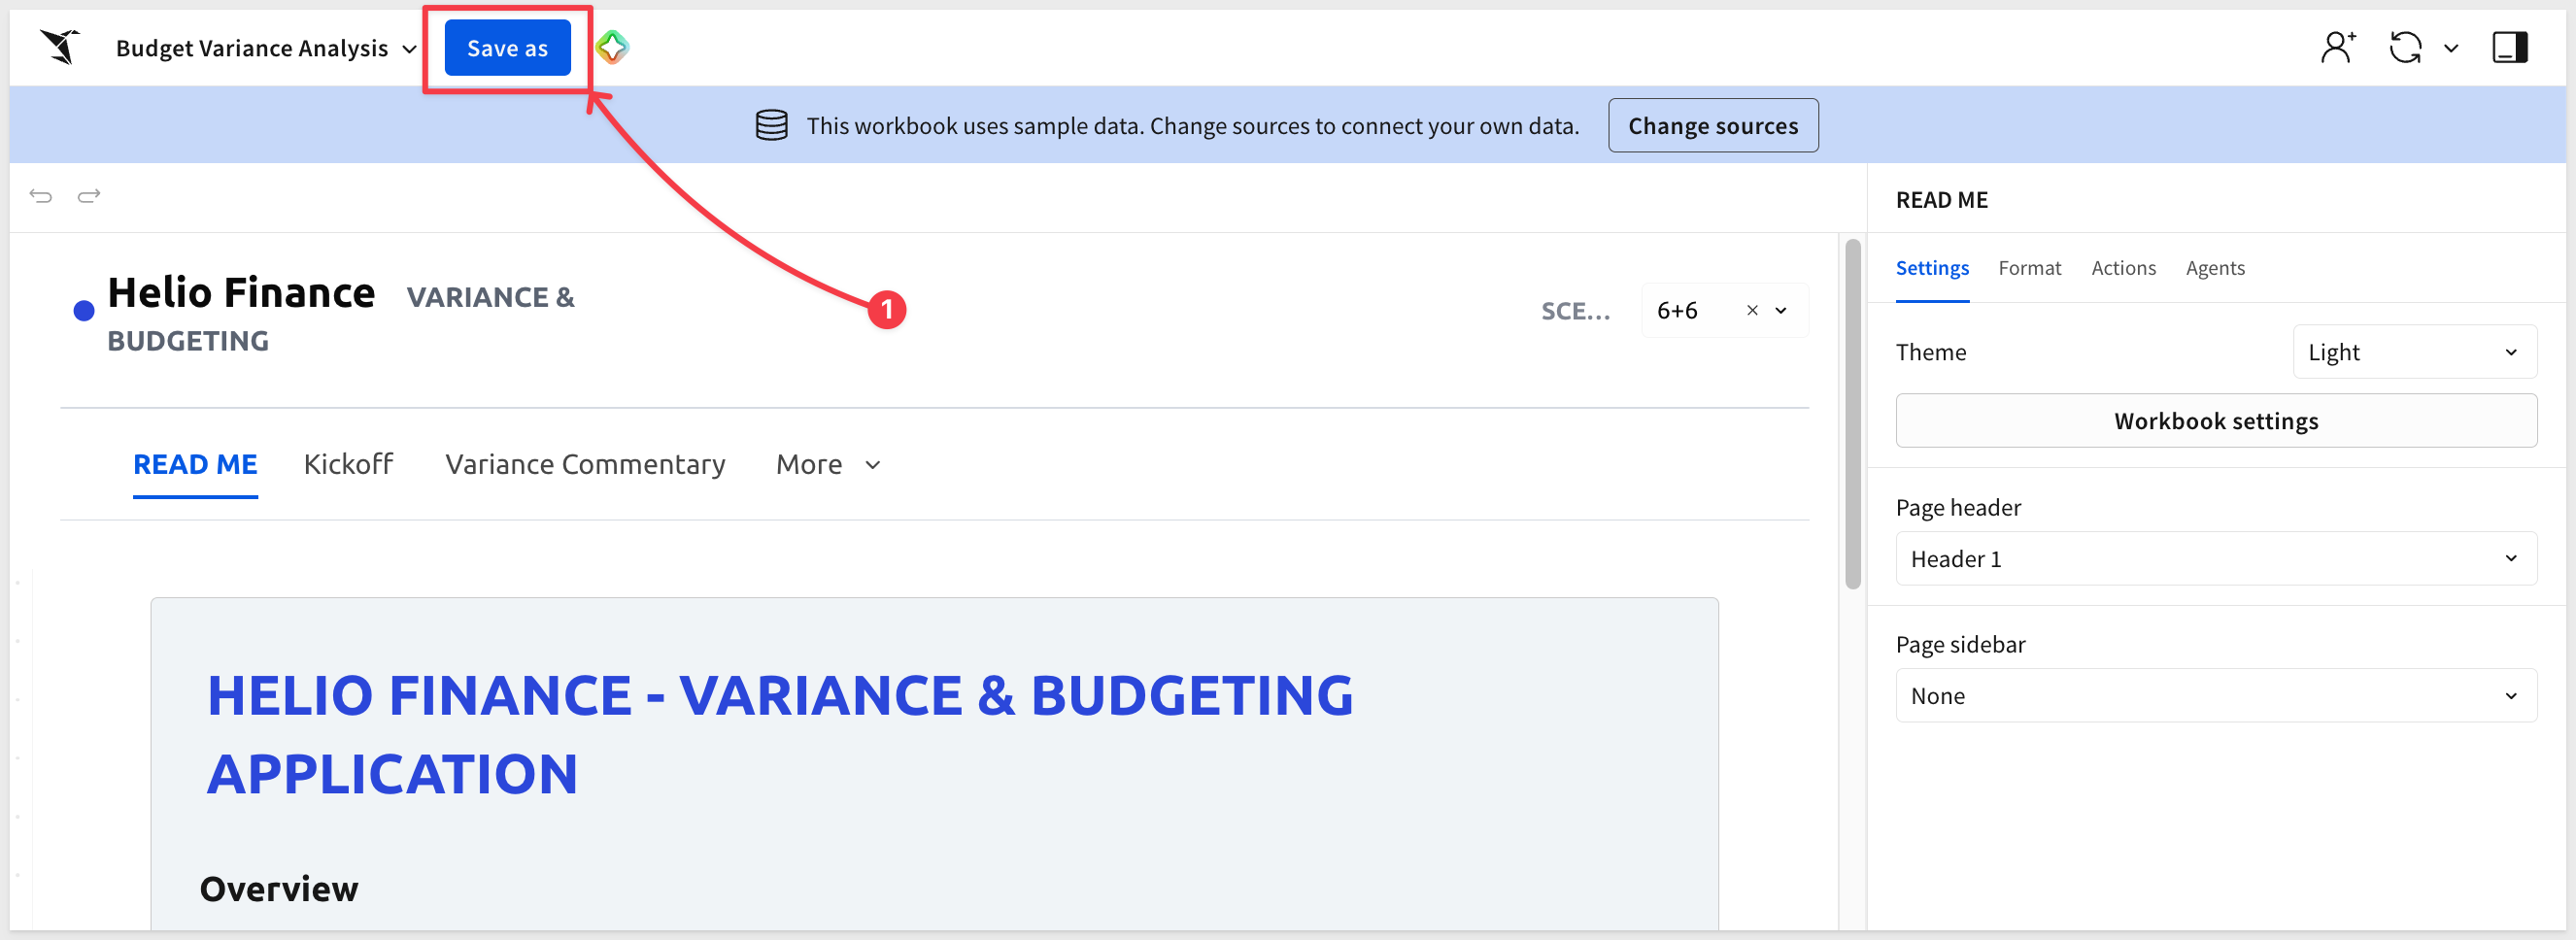
Click Save as, give the workbook a name, and choose a folder to save it:
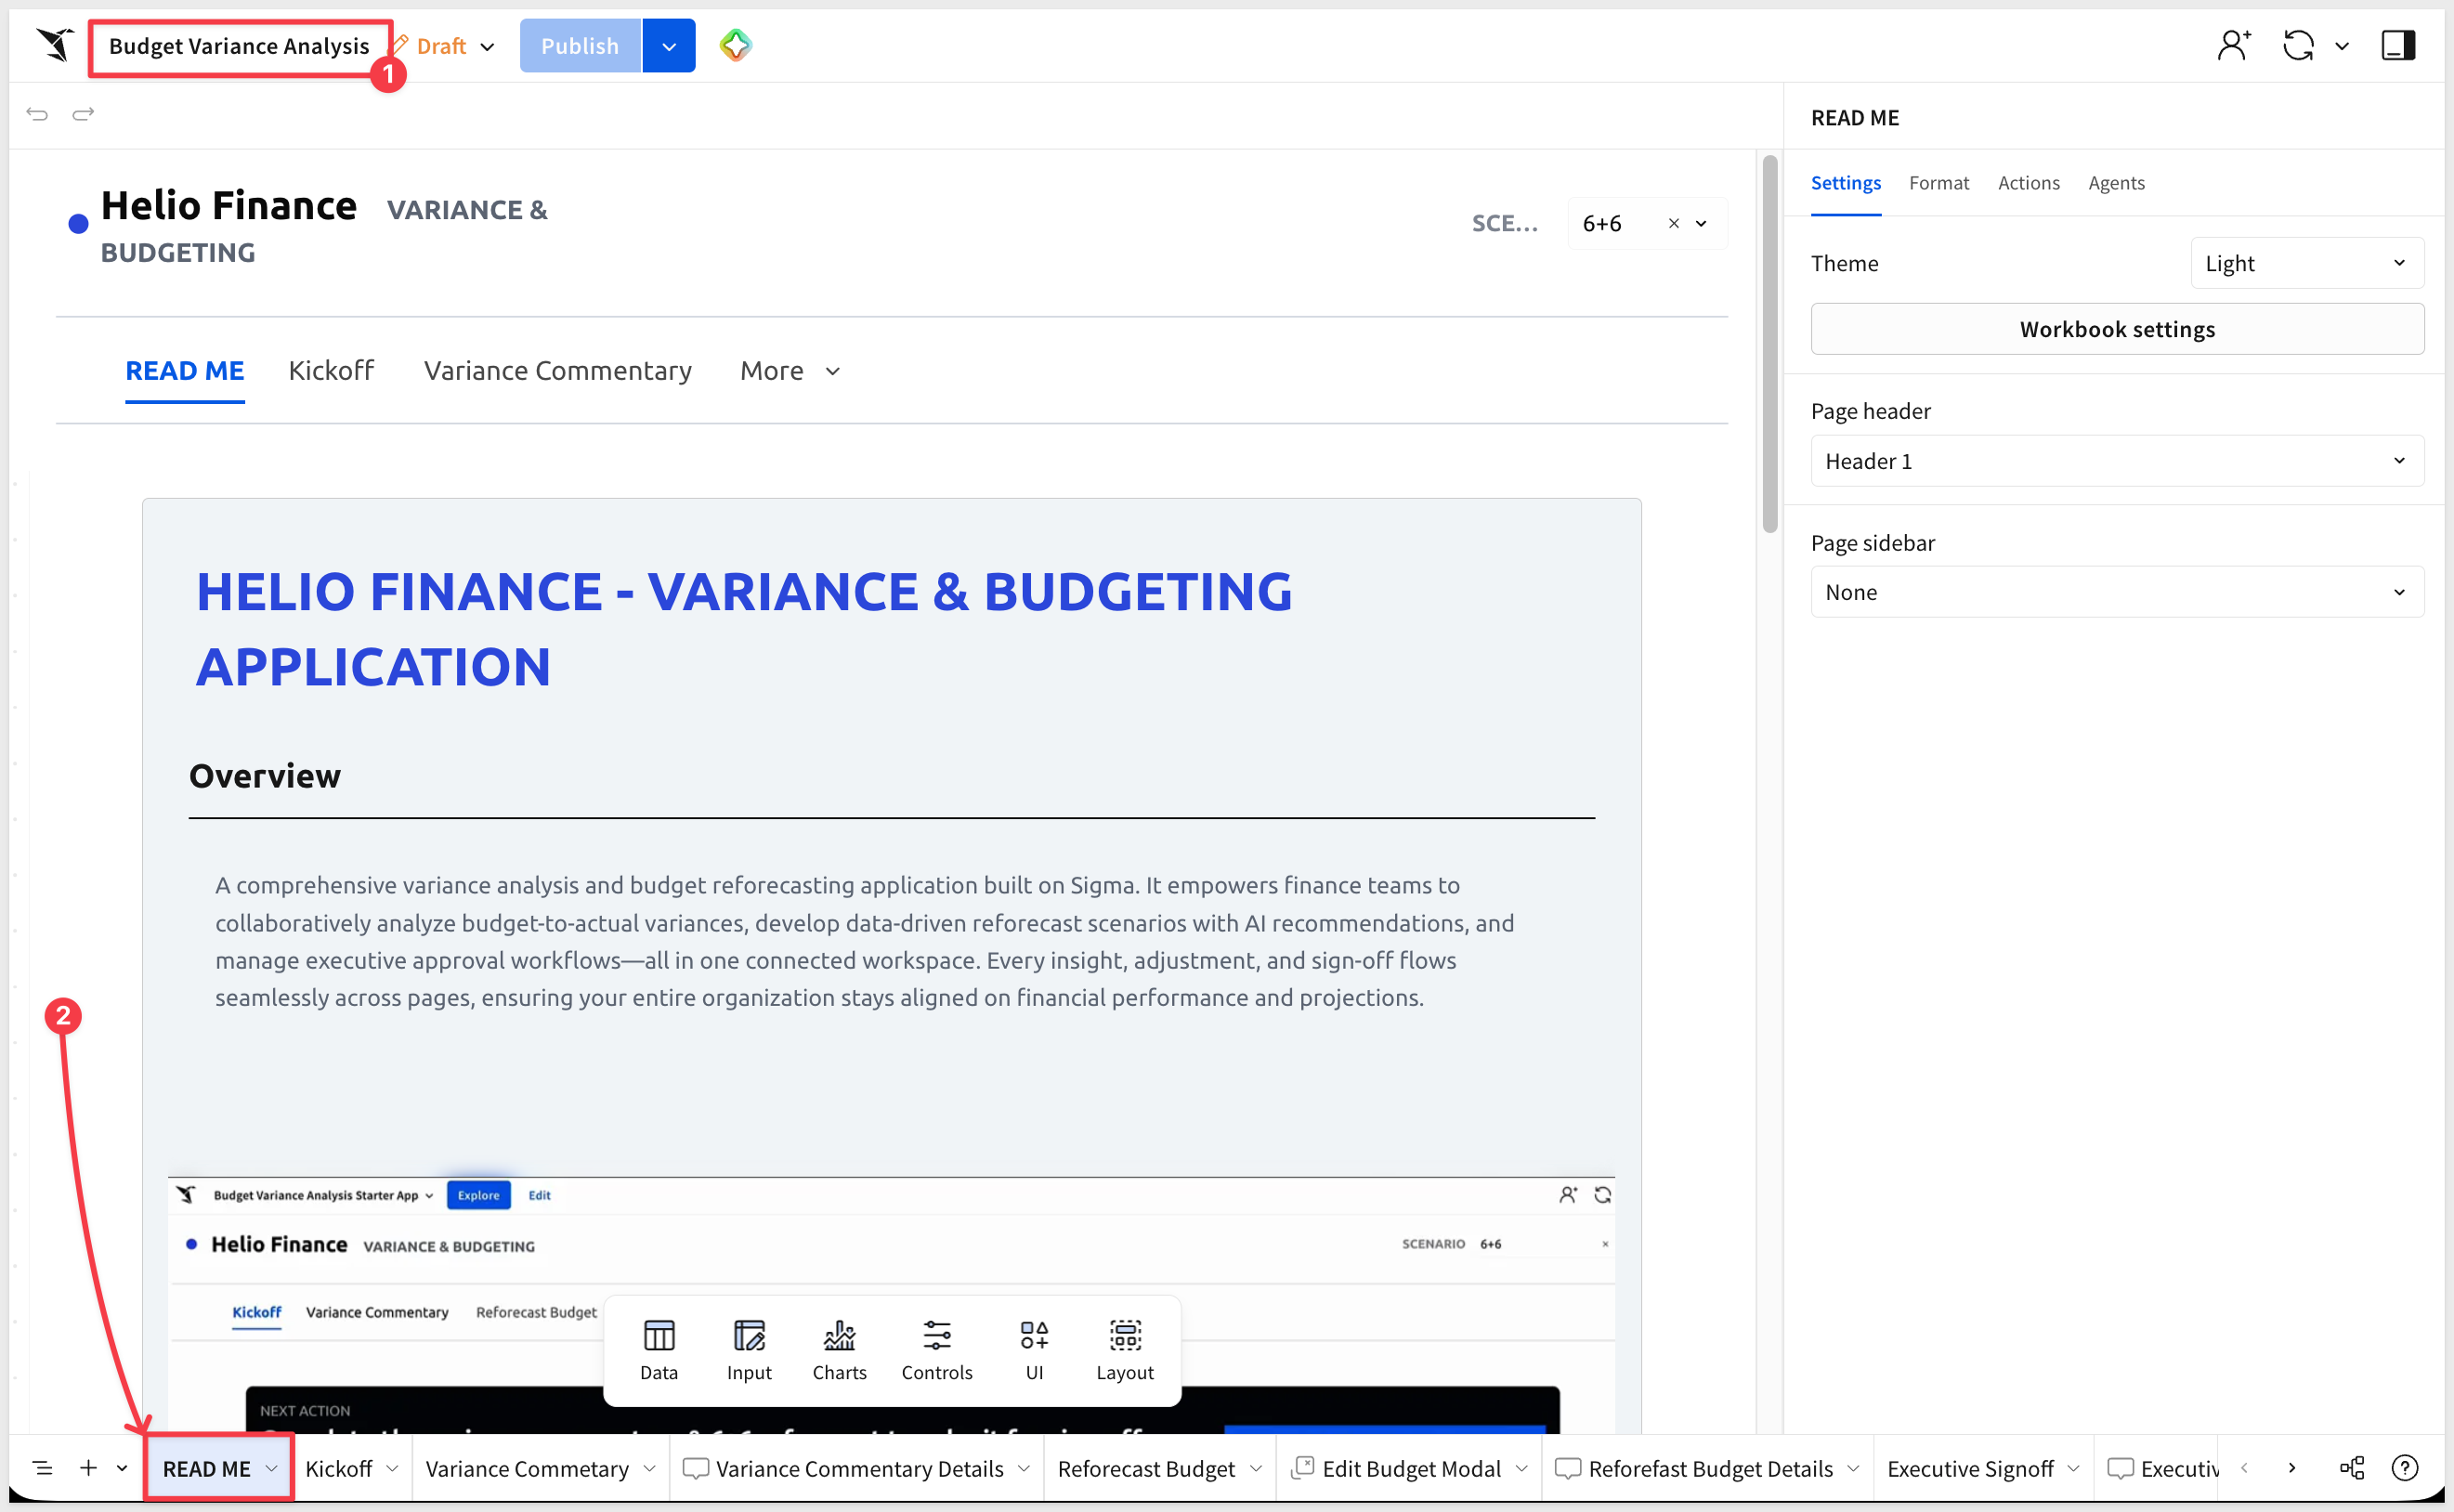
The app opens to its READ ME page:
App Pages
The app is organized across five visible pages, each serving a distinct role in the planning cycle:
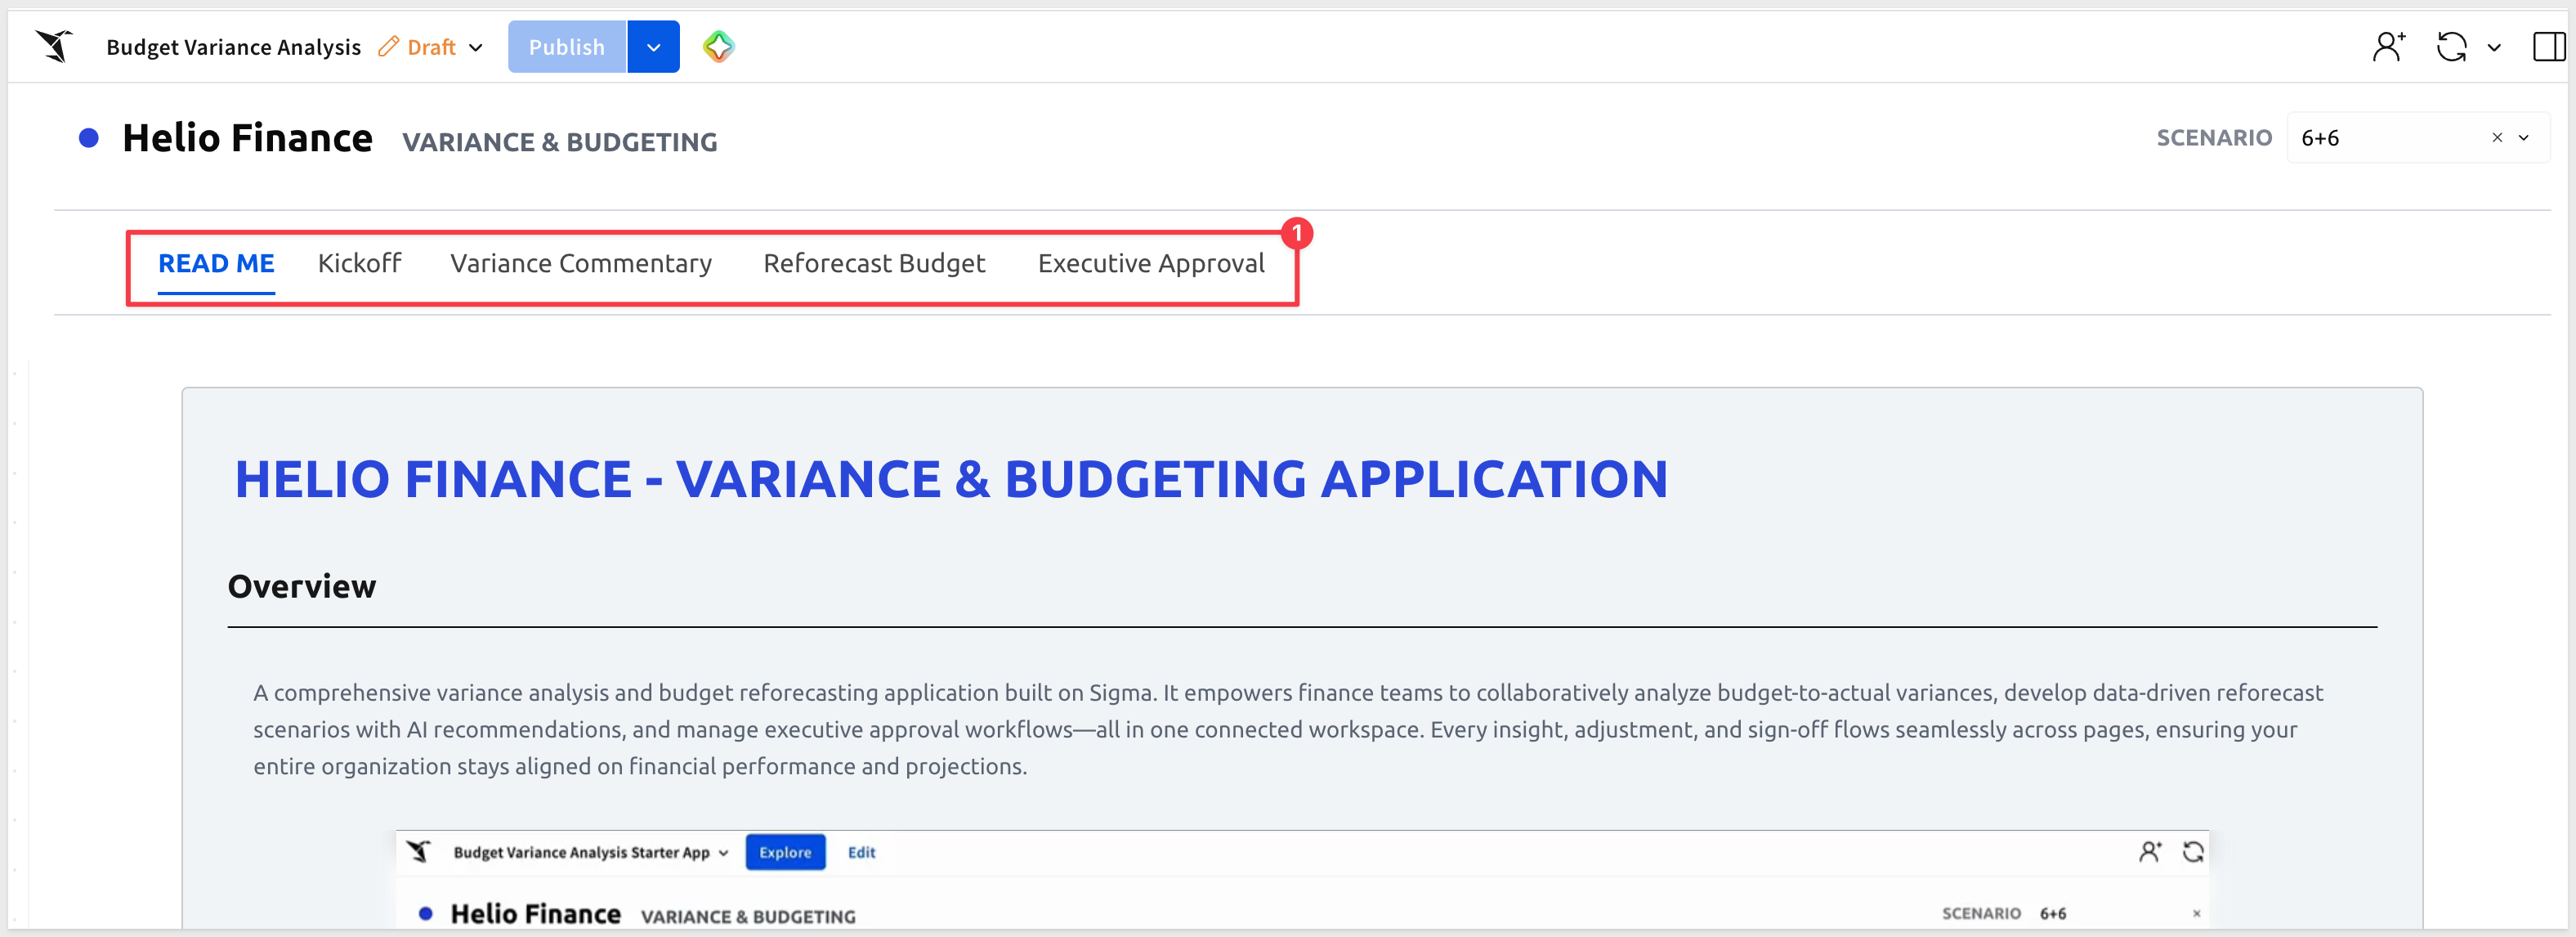
Page | Purpose |
READ ME | Setup instructions and a summary of the five-step workflow |
Kickoff | Planning command center — headline metrics, active scenario status, and your next action |
Variance Commentary | Workspace for documenting budget-to-actual explanations by category |
Reforecast Budget | Editable pivot for adjusting the forecast with AI recommendations |
Executive Signoff | Final approval workspace — review, sign off, and lock the new baseline |
The Kickoff Page
The Kickoff page is where each planning cycle begins. It surfaces the most important context at a glance:
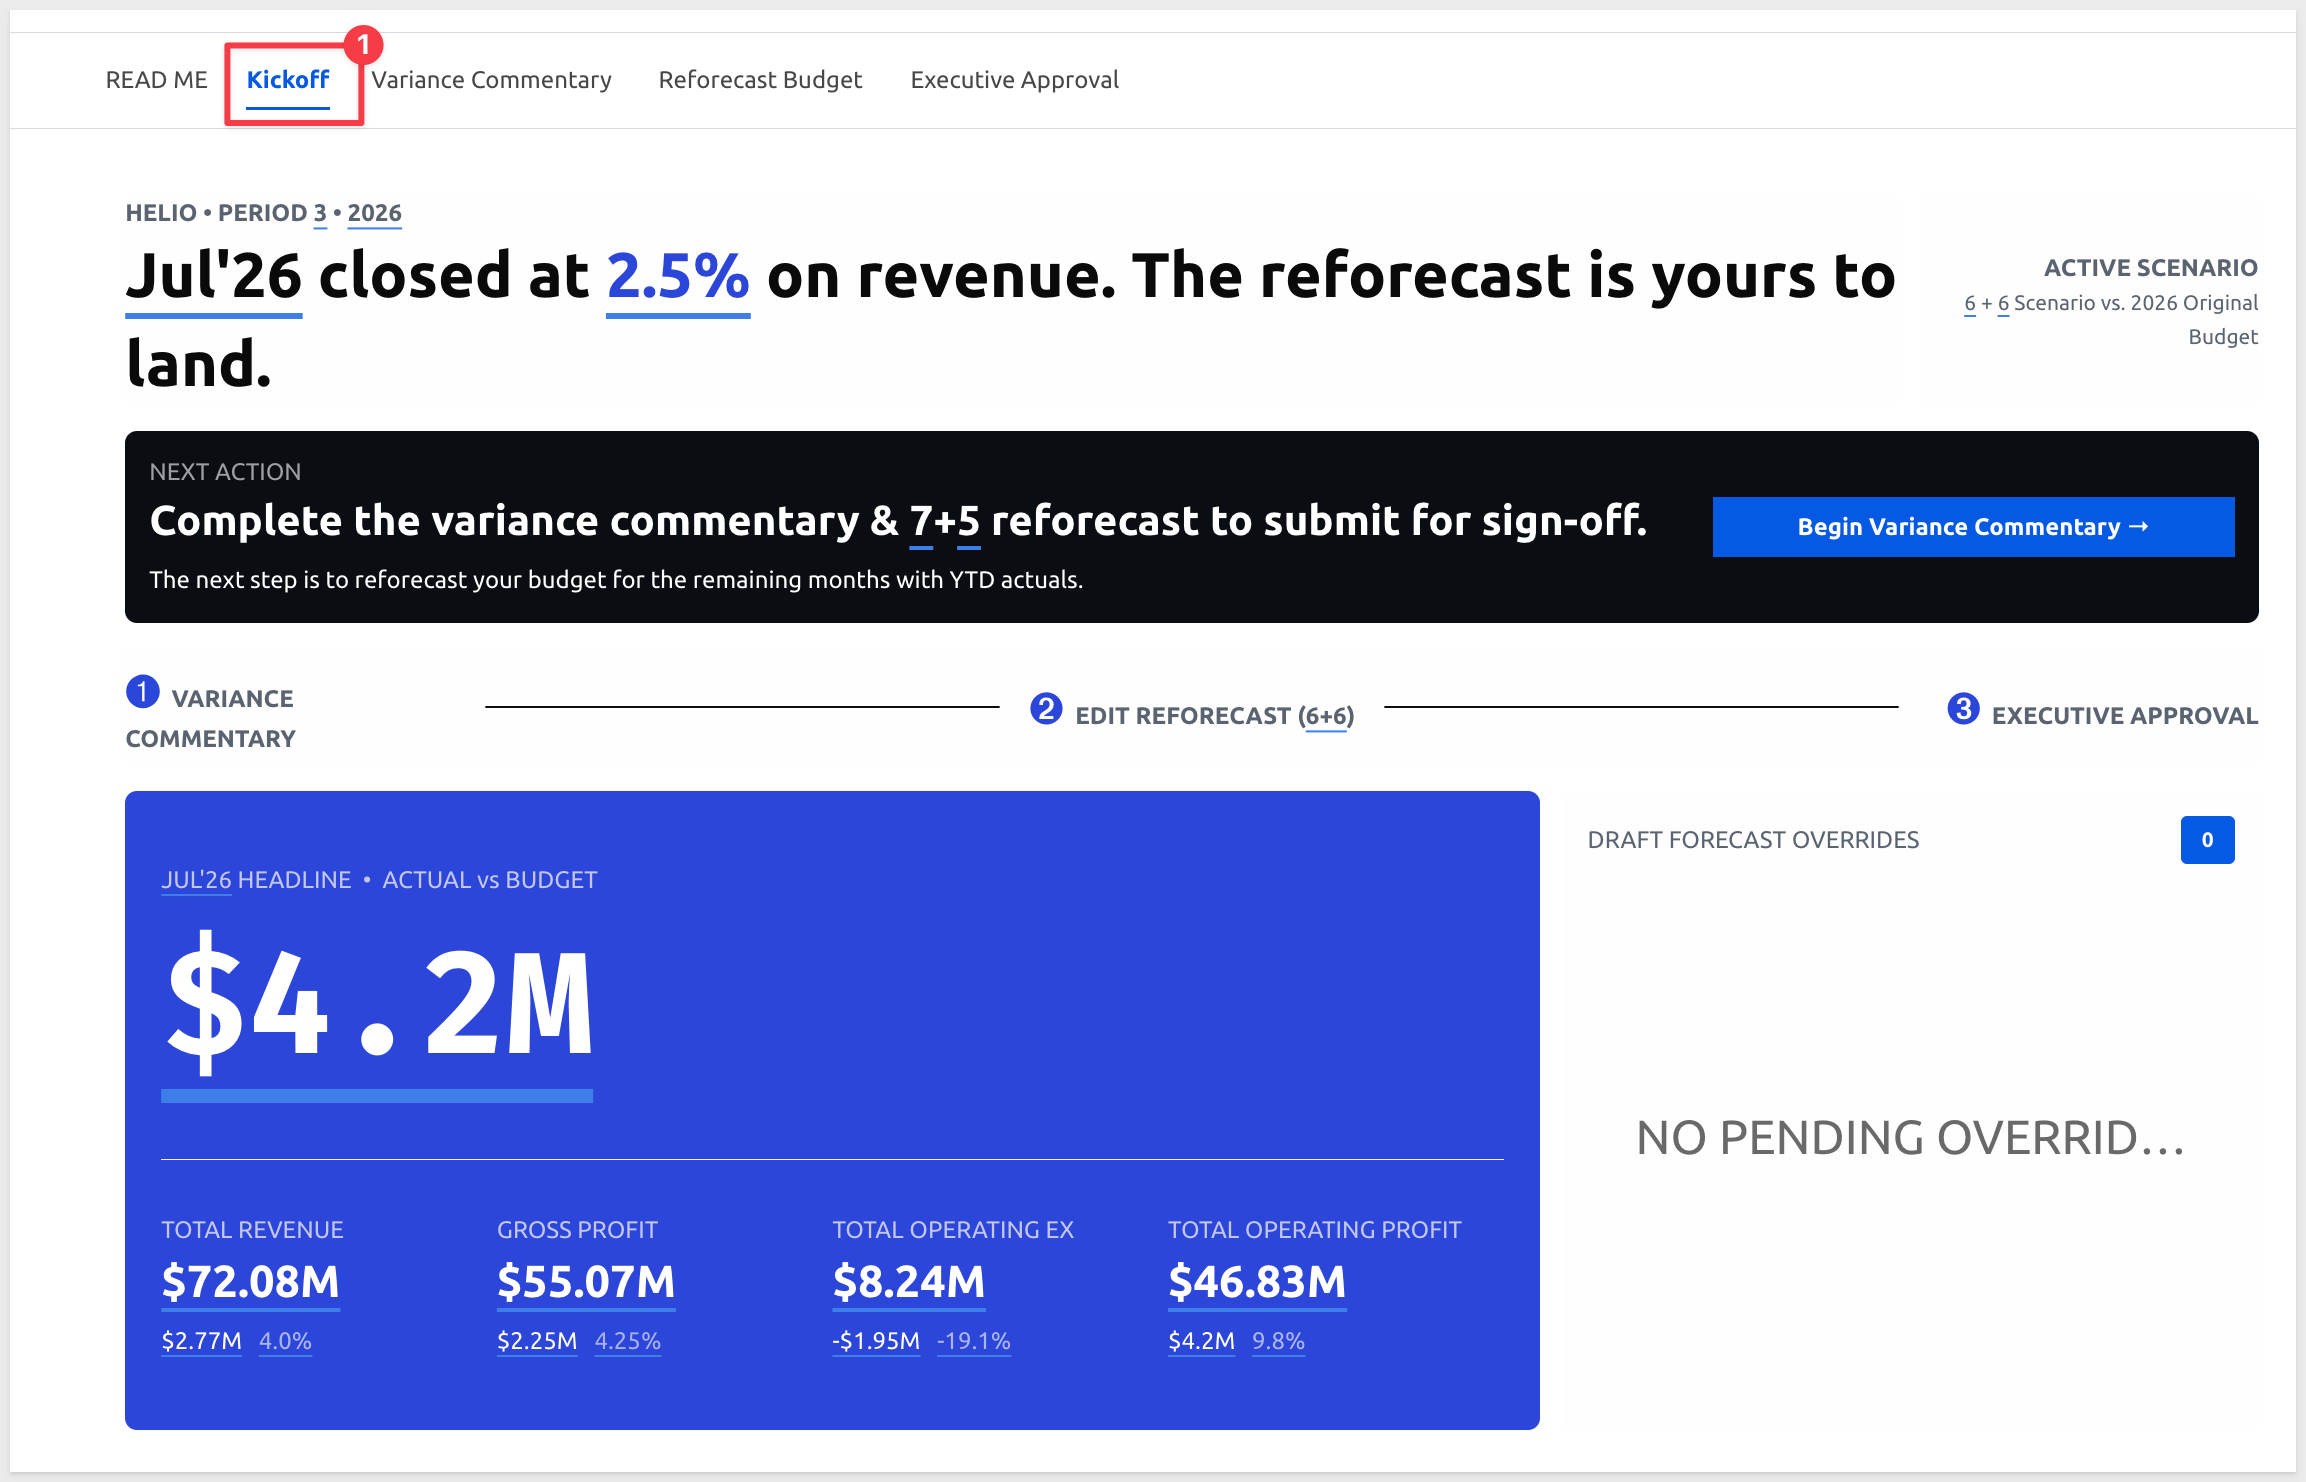
Headline metric — the current period's revenue variance percentage against budget, calculated live from the warehouse. The figure updates automatically as new actuals close.
Period metrics panel — Total Revenue, Gross Profit, Total Operating Expenses, and Total Operating Profit for the current month, with month-over-month dollar and percentage change shown alongside each figure.
Next Action prompt — a dark card that states the outstanding task for the current cycle: completing variance commentary and submitting the reforecast for sign-off.
Three-step workflow navigator — links to Variance Commentary (➊), Reforecast Budget (➋), and Executive Signoff (➌), keeping the cycle visible at all times.
Draft Forecast Overrides — a live feed of budget adjustments that have been staged but not yet approved, so analysts and managers can see what's in flight.
A sixth page, Data, is hidden and contains all source tables. It is covered in the Under the Hood section.
Planning Scenarios
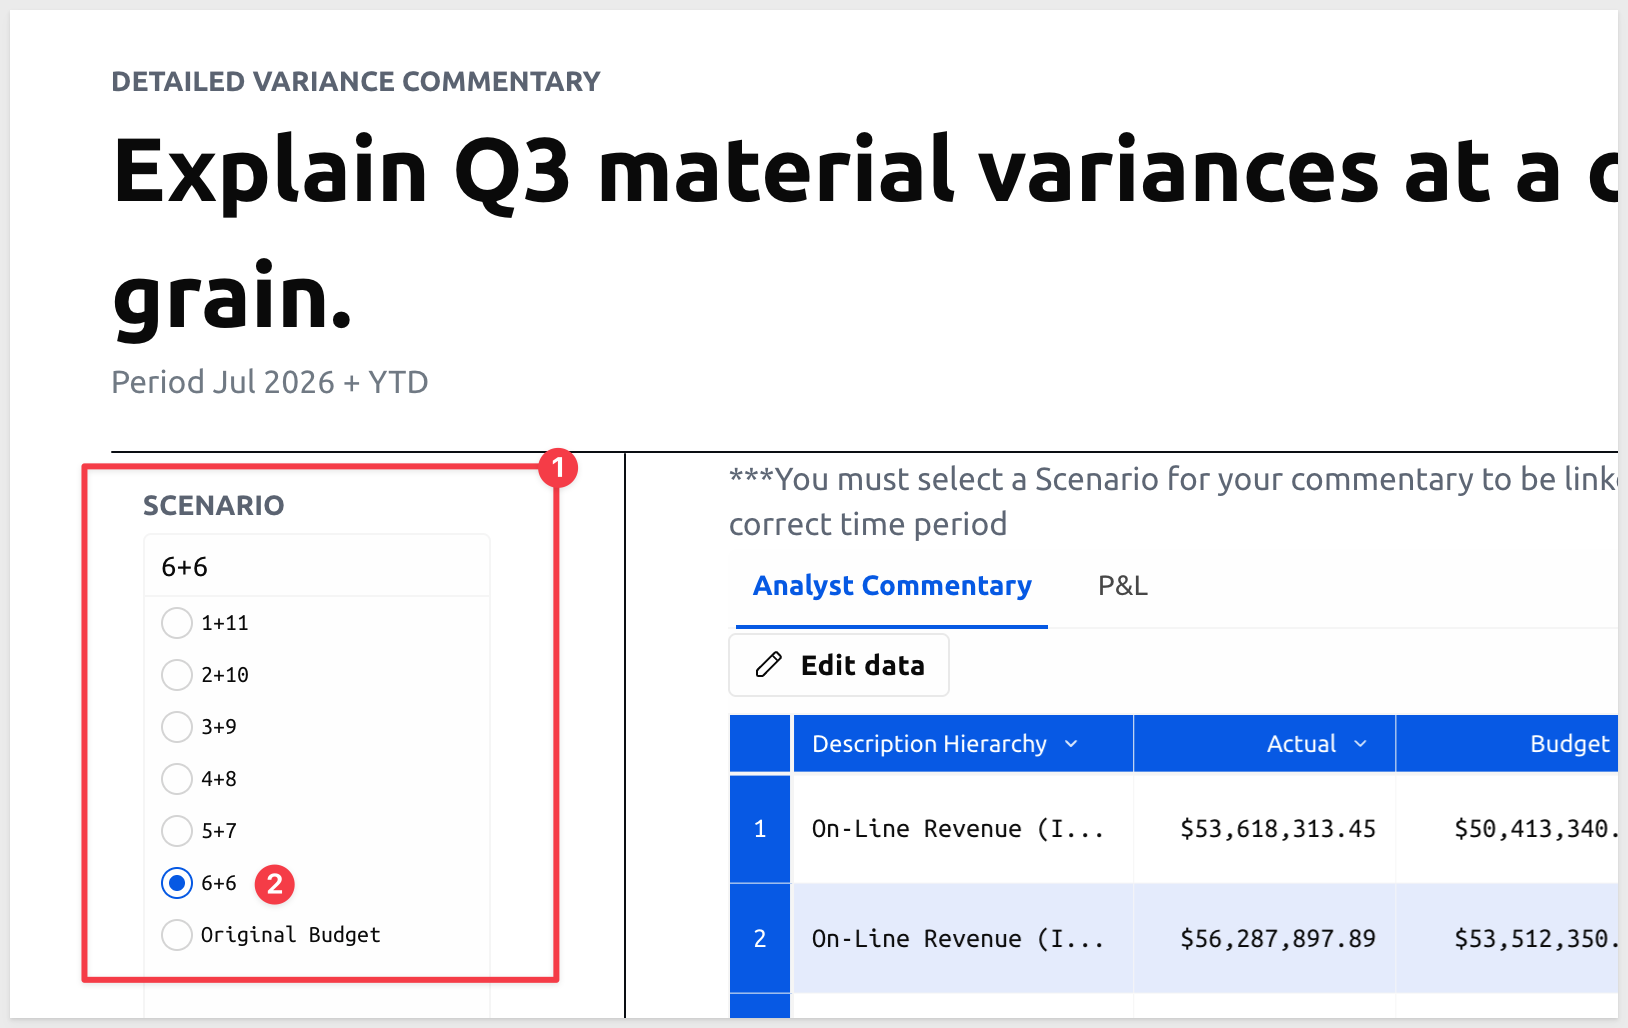
The app ships with six pre-built planning scenarios, visible as radio buttons in the SCENARIO filter on the Variance Commentary page:
Scenario | Meaning |
| 1 month of actuals closed, 11 months to forecast |
| 2 months closed, 10 to forecast |
| 3 months closed, 9 to forecast |
| 4 months closed, 8 to forecast |
| 5 months closed, 7 to forecast |
| 6 months closed, 6 to forecast |
| The approved baseline — no adjustments |
The X+Y naming is standard FP&A (Financial Planning and Analysis) shorthand for a rolling monthly reforecast.
X is the number of months where real results — called actuals — have been recorded and locked.
Y is the number of months still open for forecasting. X and Y always add up to 12 because the fiscal year is 12 months long.
In practice, finance teams run this process every month-end: close the prior month's actuals, explain where performance differed from the budget (variance commentary), update the forecast for the remaining open months, and submit it for executive approval. Then the cycle repeats. The scenario name advances by one each month — 1+11 in January, 2+10 in February, and so on.
Original Budget is the annual plan approved at the start of the fiscal year. It never changes — it's the fixed baseline that every scenario is measured against. When an executive sees a 6+6 reforecast, they're comparing it to whatever the company agreed the full year should look like back in January.
The sample data in this app covers the first six months, so scenarios run through 6+6. A deployment connected to a full year of data would typically include scenarios through 11+1.
Click Variance Commentary on the navigation menu at the top of the page.
The Variance Commentary page is where analysts explain why actuals diverged from budget before touching any forecast numbers.
Commentary is linked to a specific scenario and flows forward automatically to the Executive Signoff page — so the executive sees the analyst's rationale alongside the variance data, without a separate briefing.
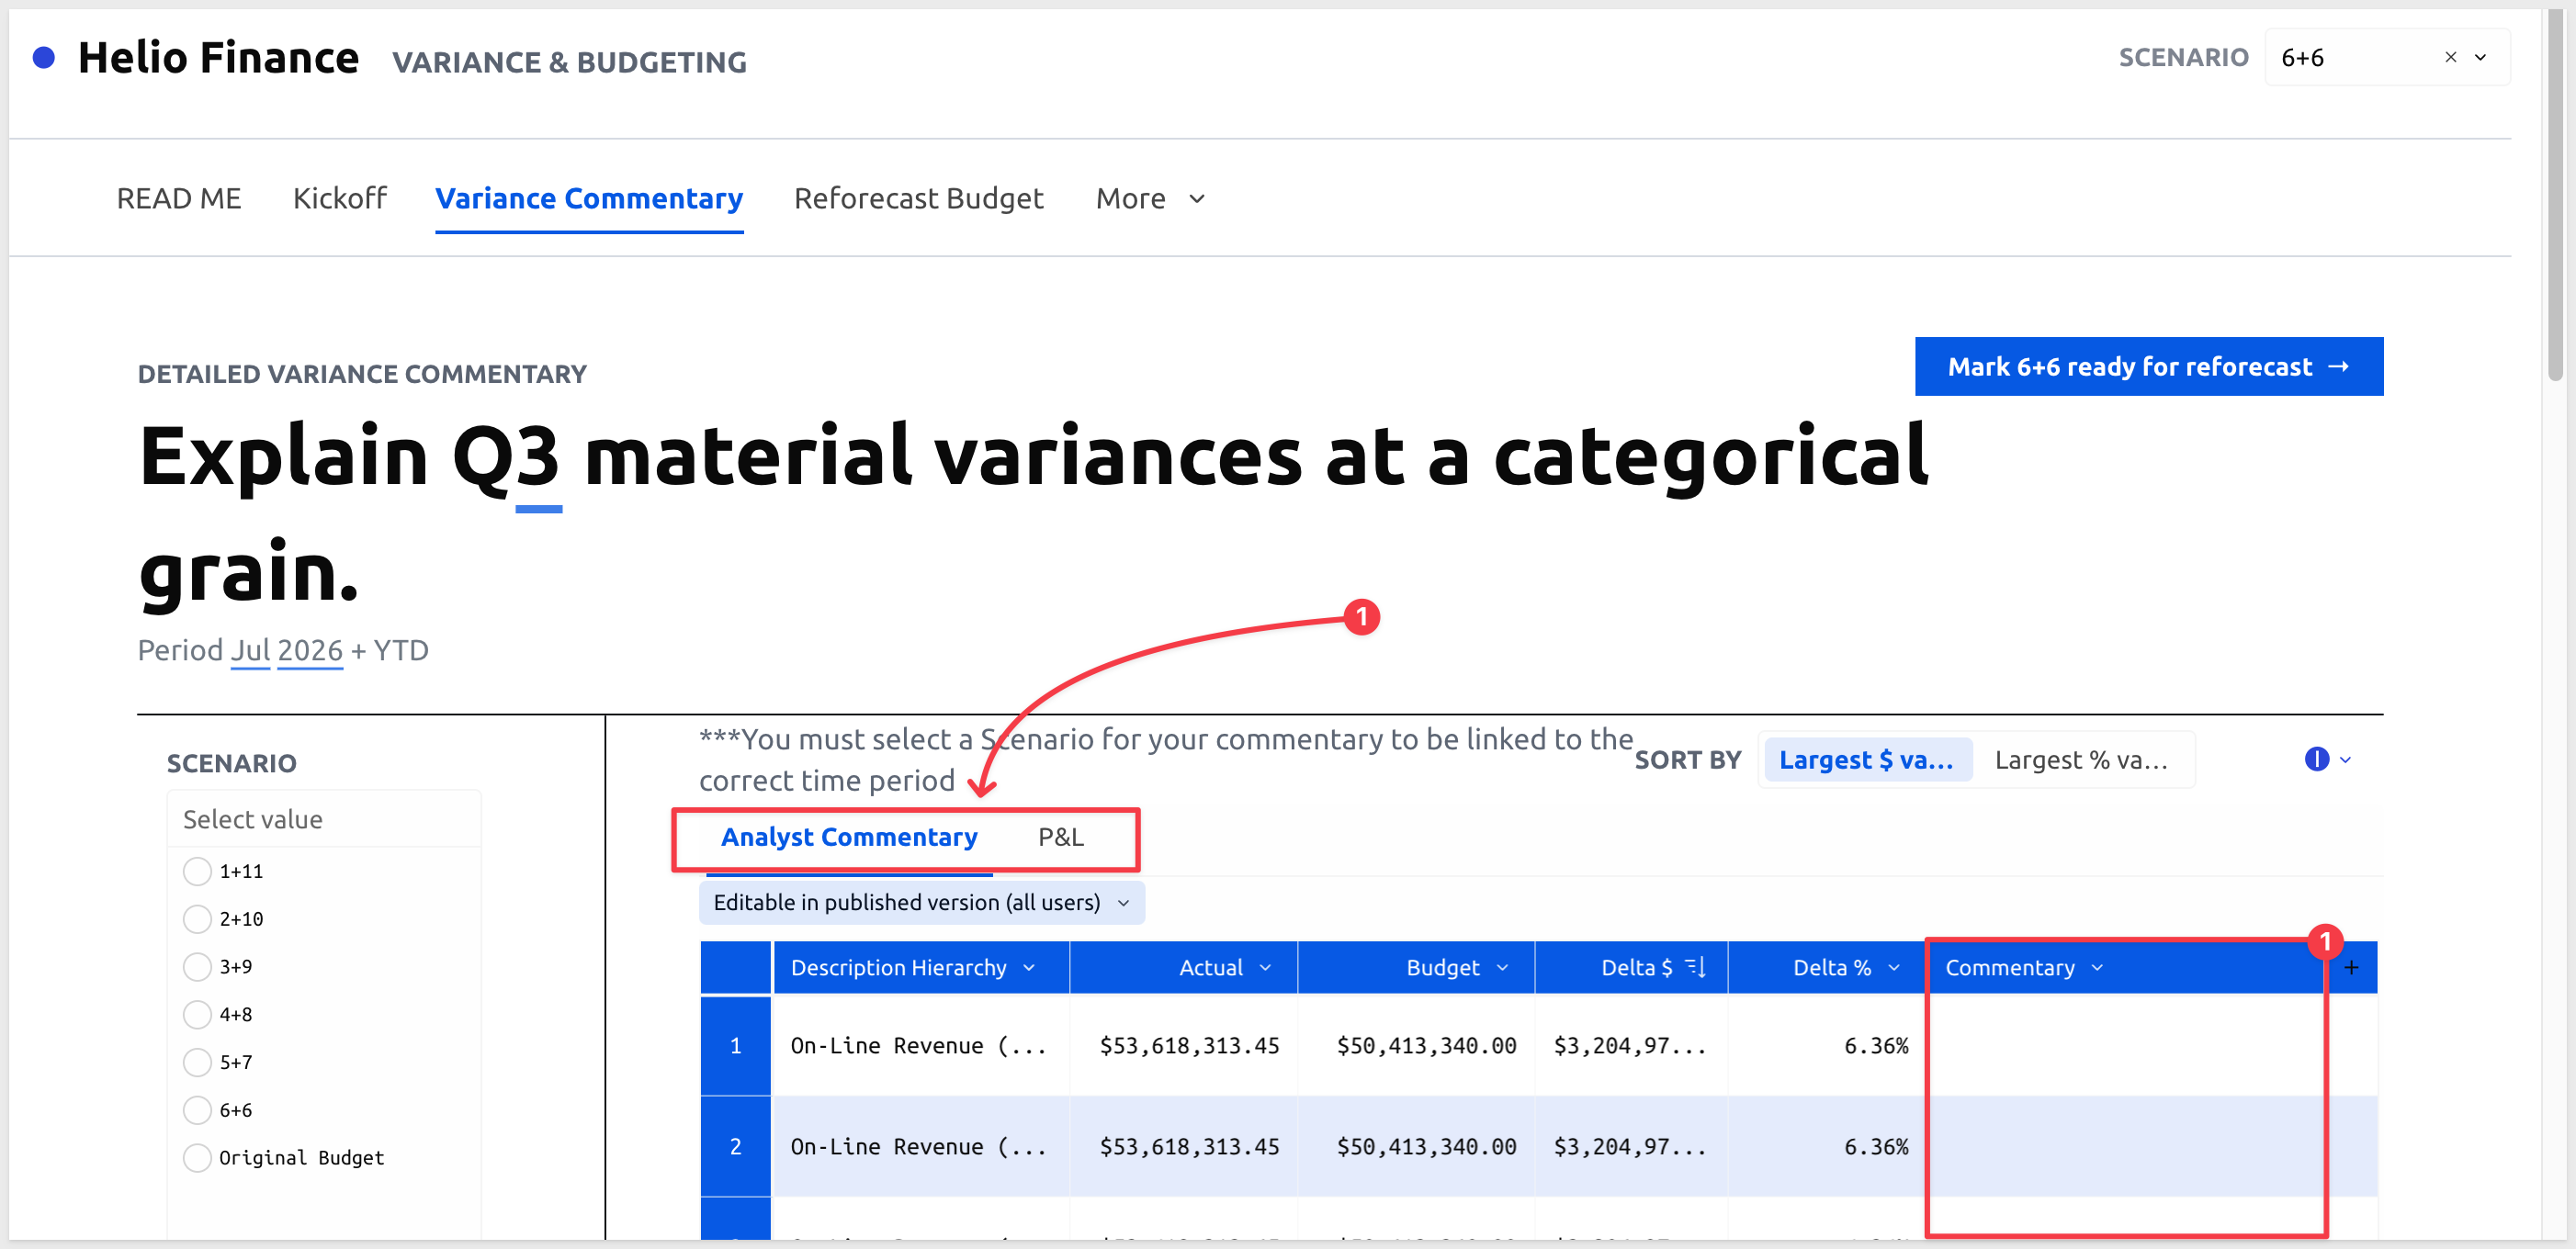
The table has two tabs: Analyst Commentary for adding explanations line by line, and P&L for a summary income statement view. The Commentary column is the only editable column and is editable in published mode — no edit access to the workbook is required:
Selecting a Scenario
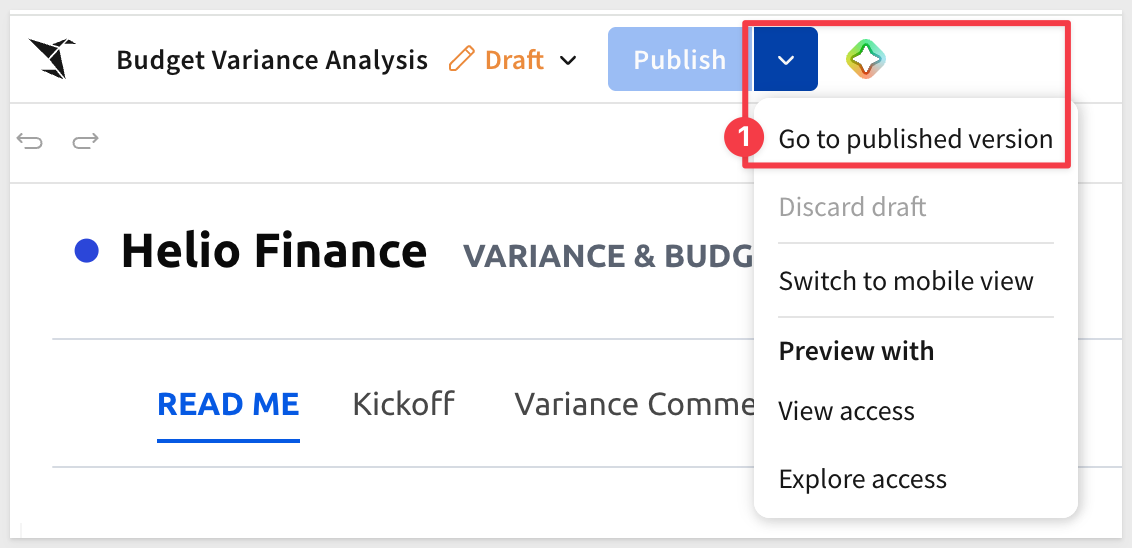
Before we go further, set the workbook to use Published mode:
The SCENARIO radio buttons on the left panel link your commentary to a specific planning cycle. Selecting a scenario here also sets it as the Active Scenario on the Reforecast Budget page — so whatever scenario you choose on this page carries forward into the forecast and approval steps automatically.
Select 6+6 to follow the example:
Filtering to the Biggest Variances
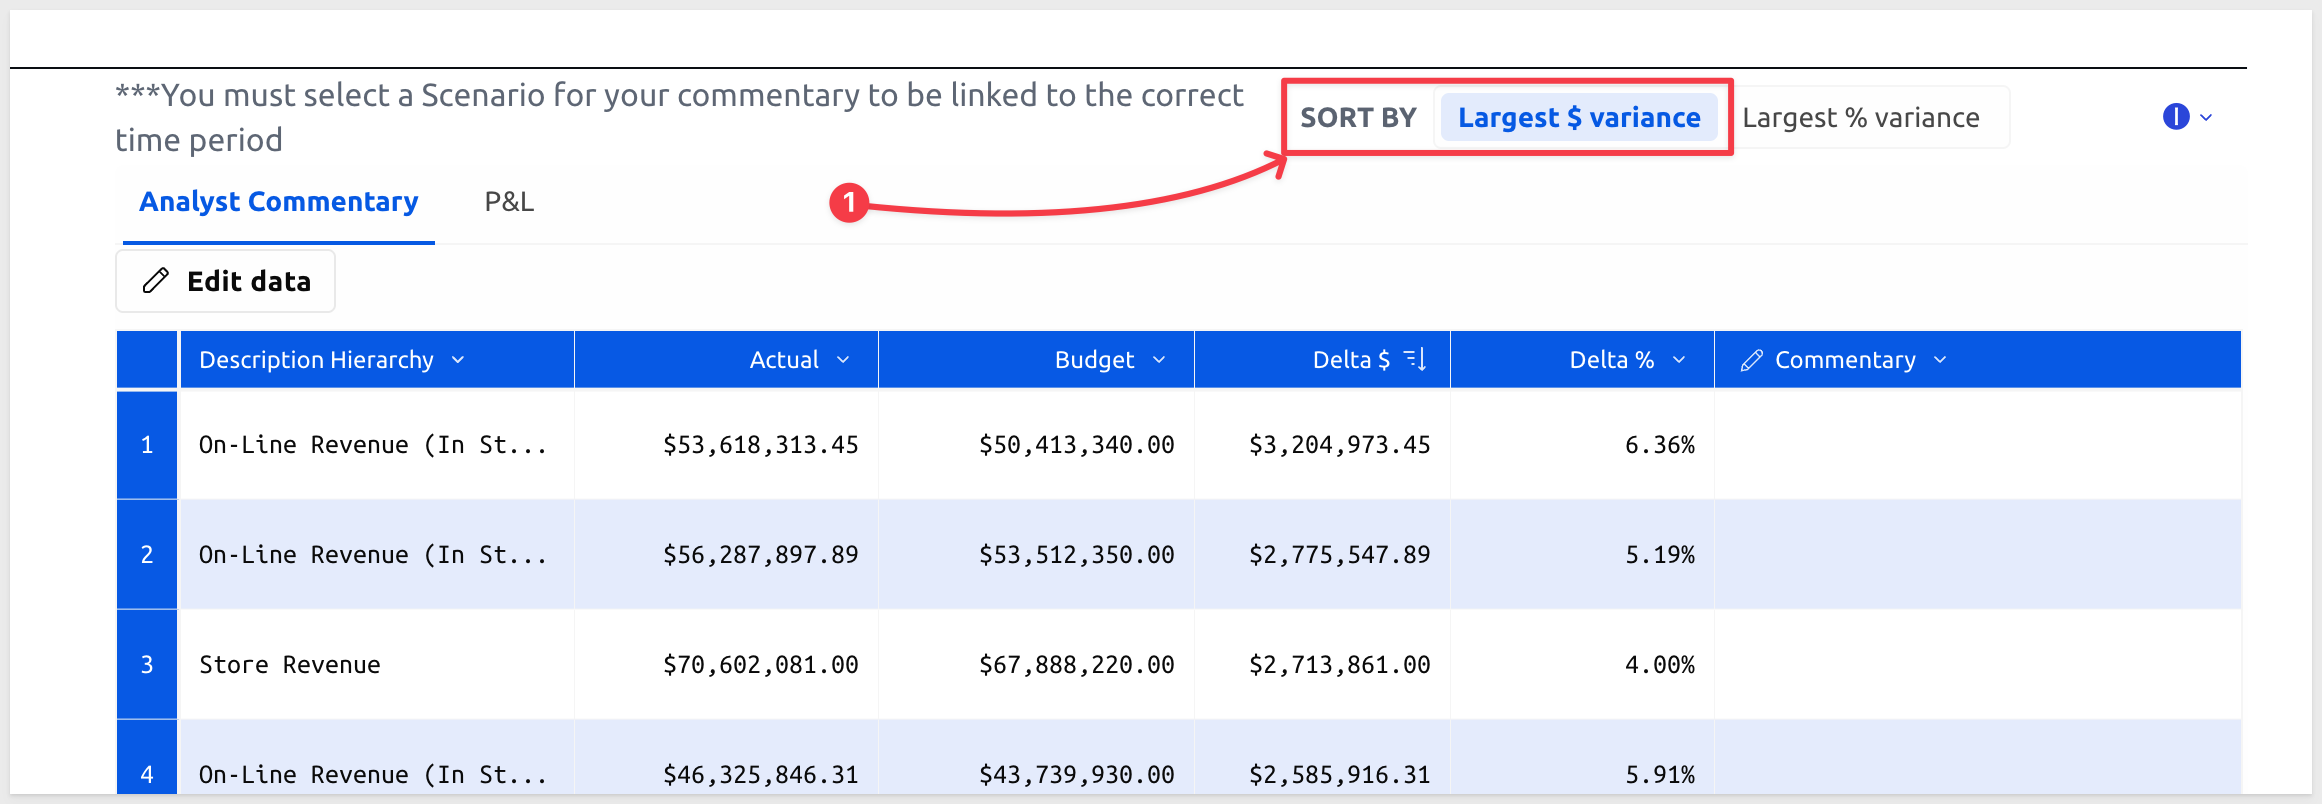
Scrolling down the page we can use CATEGORY, SITE, and SORT BY to narrow the table to the lines that need explanation.
Start with Largest $ variance to surface the biggest dollar misses first:
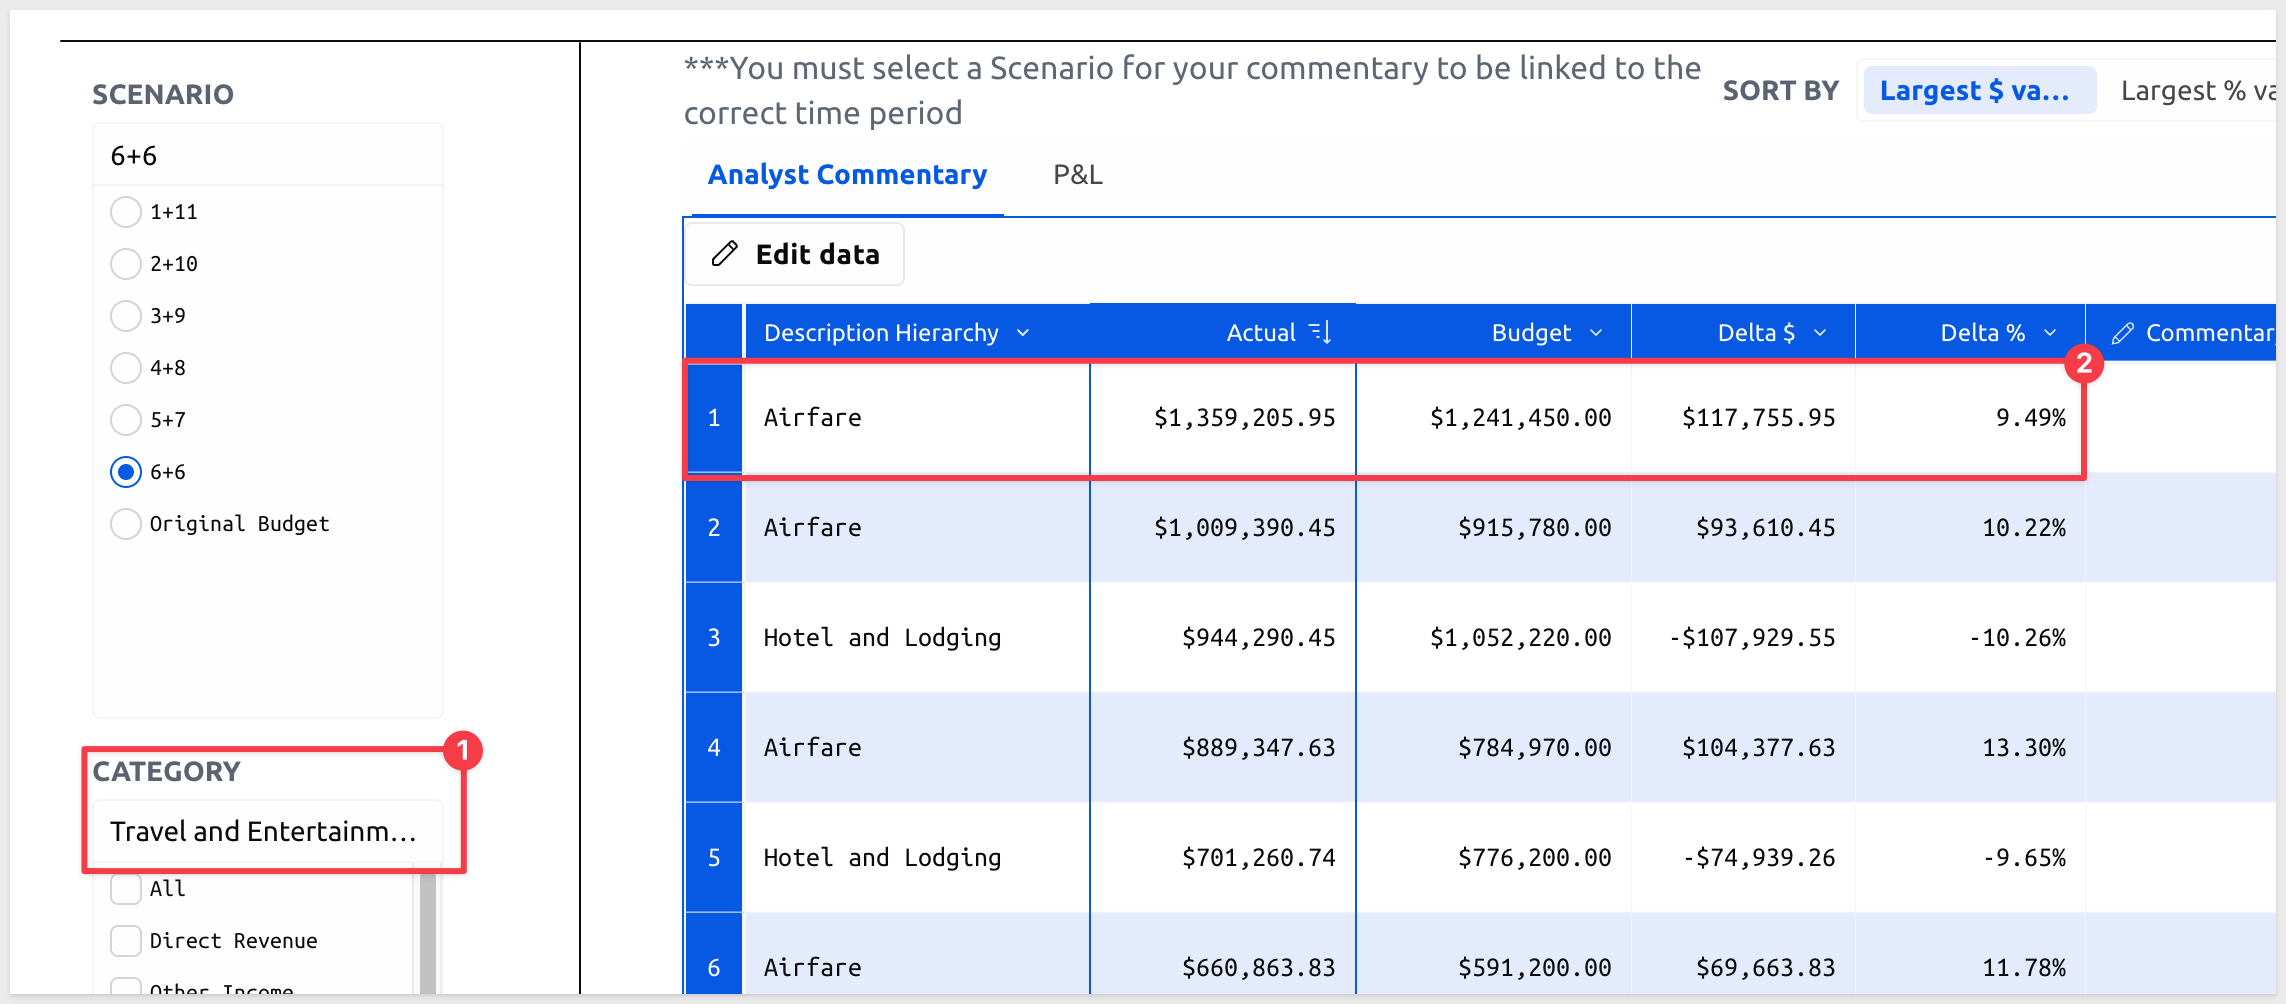
For this example, check Travel and Entertainment in the CATEGORY filter.
The table updates to show all account-level rows within Travel and Entertainment, sorted by the Actual column.
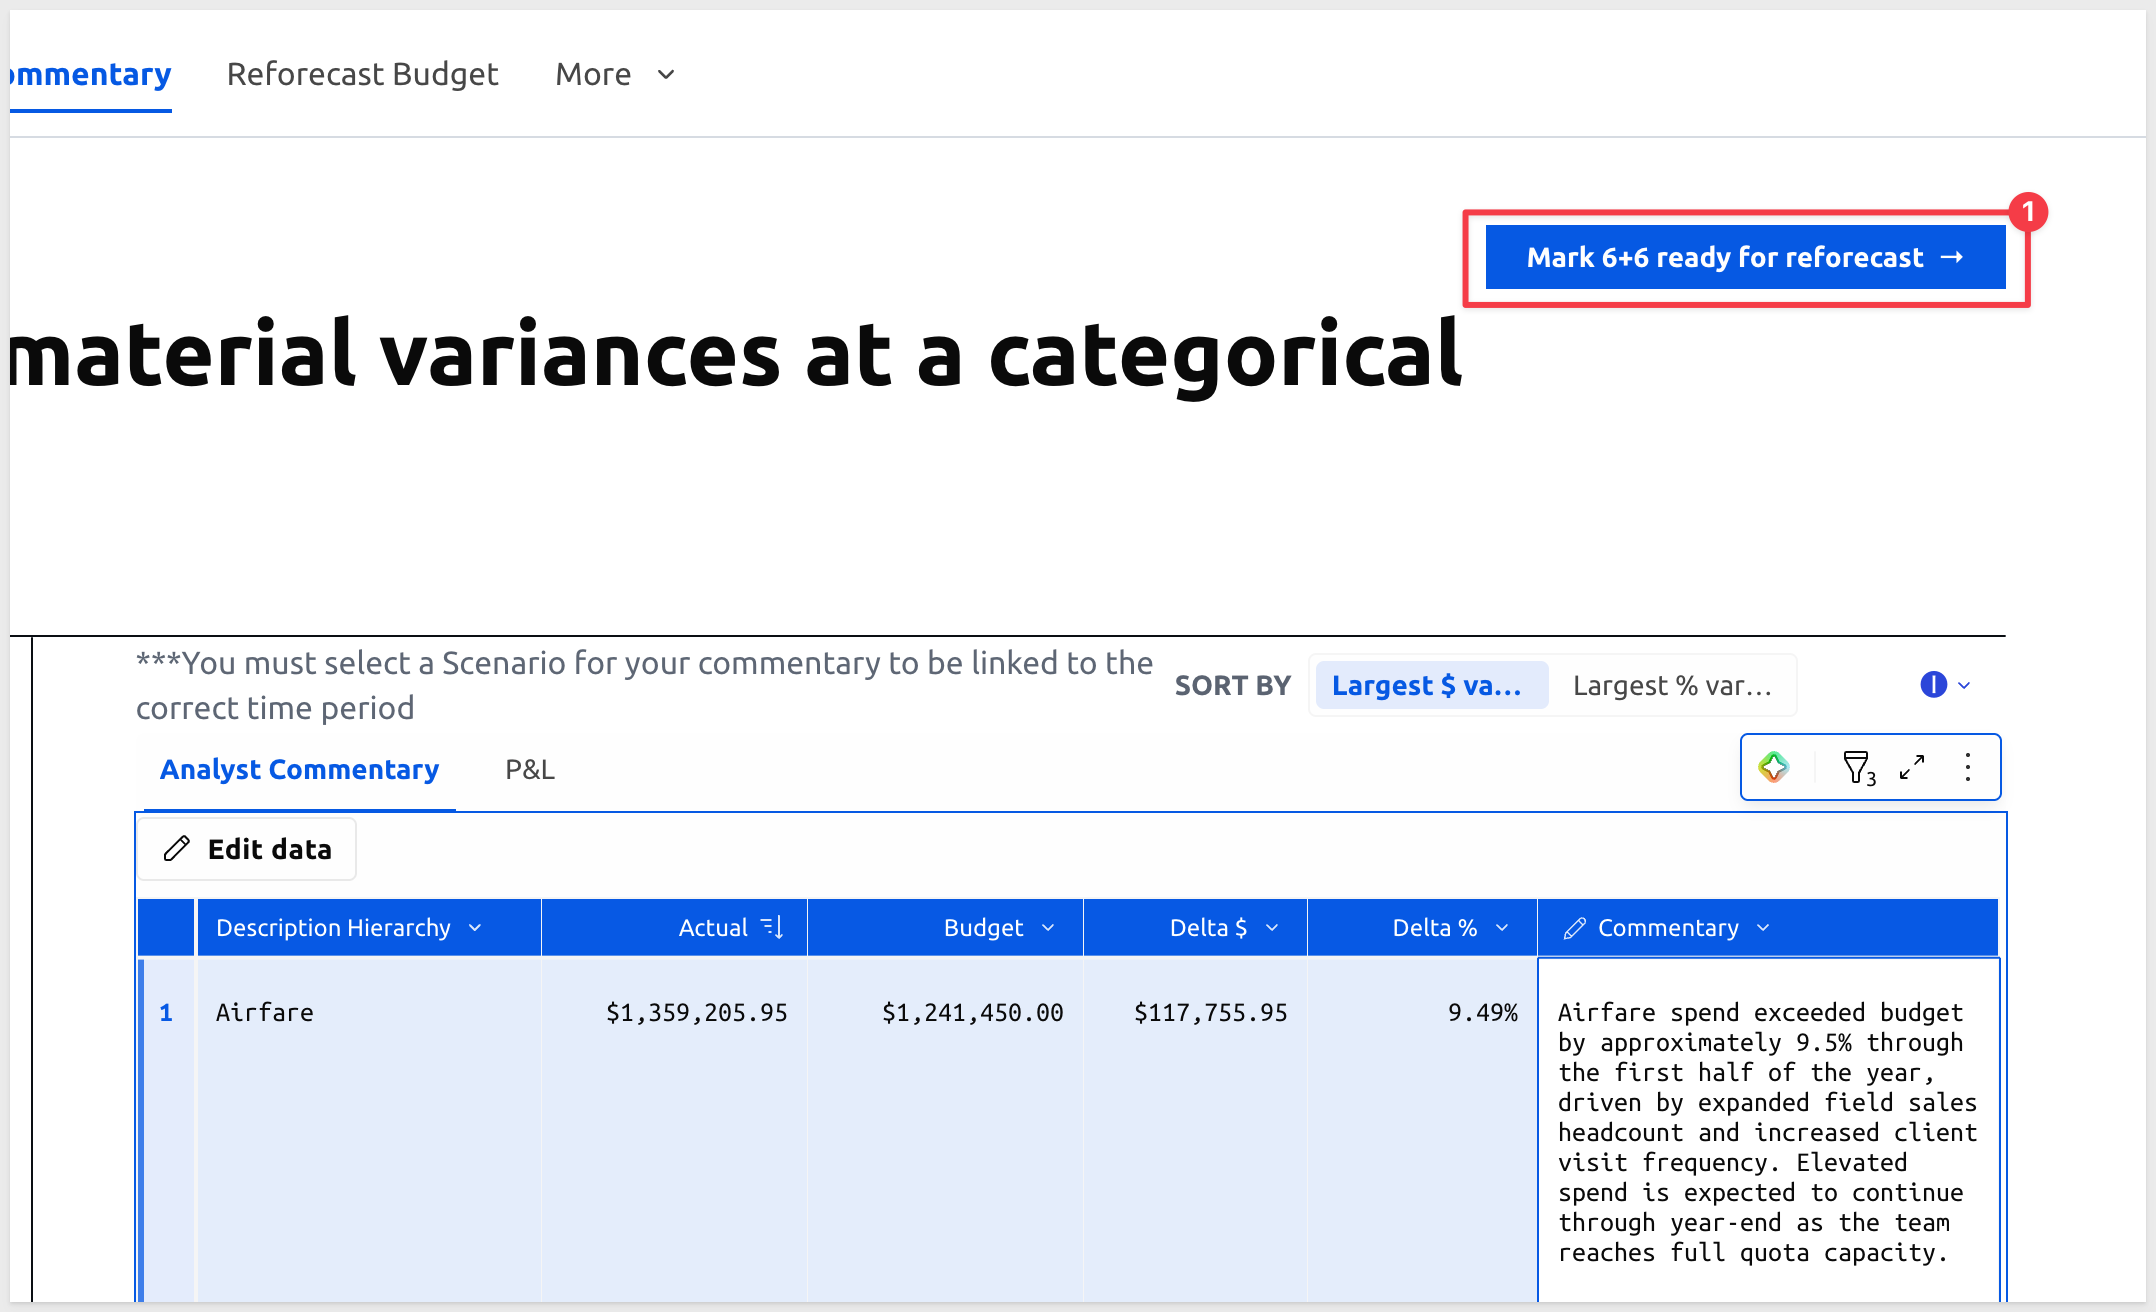
Airfare shows the largest overage — approximately $1,359,206 actual against a $1,241,450 budget, a difference of roughly $117,756 at 9.49%:
Adding Commentary
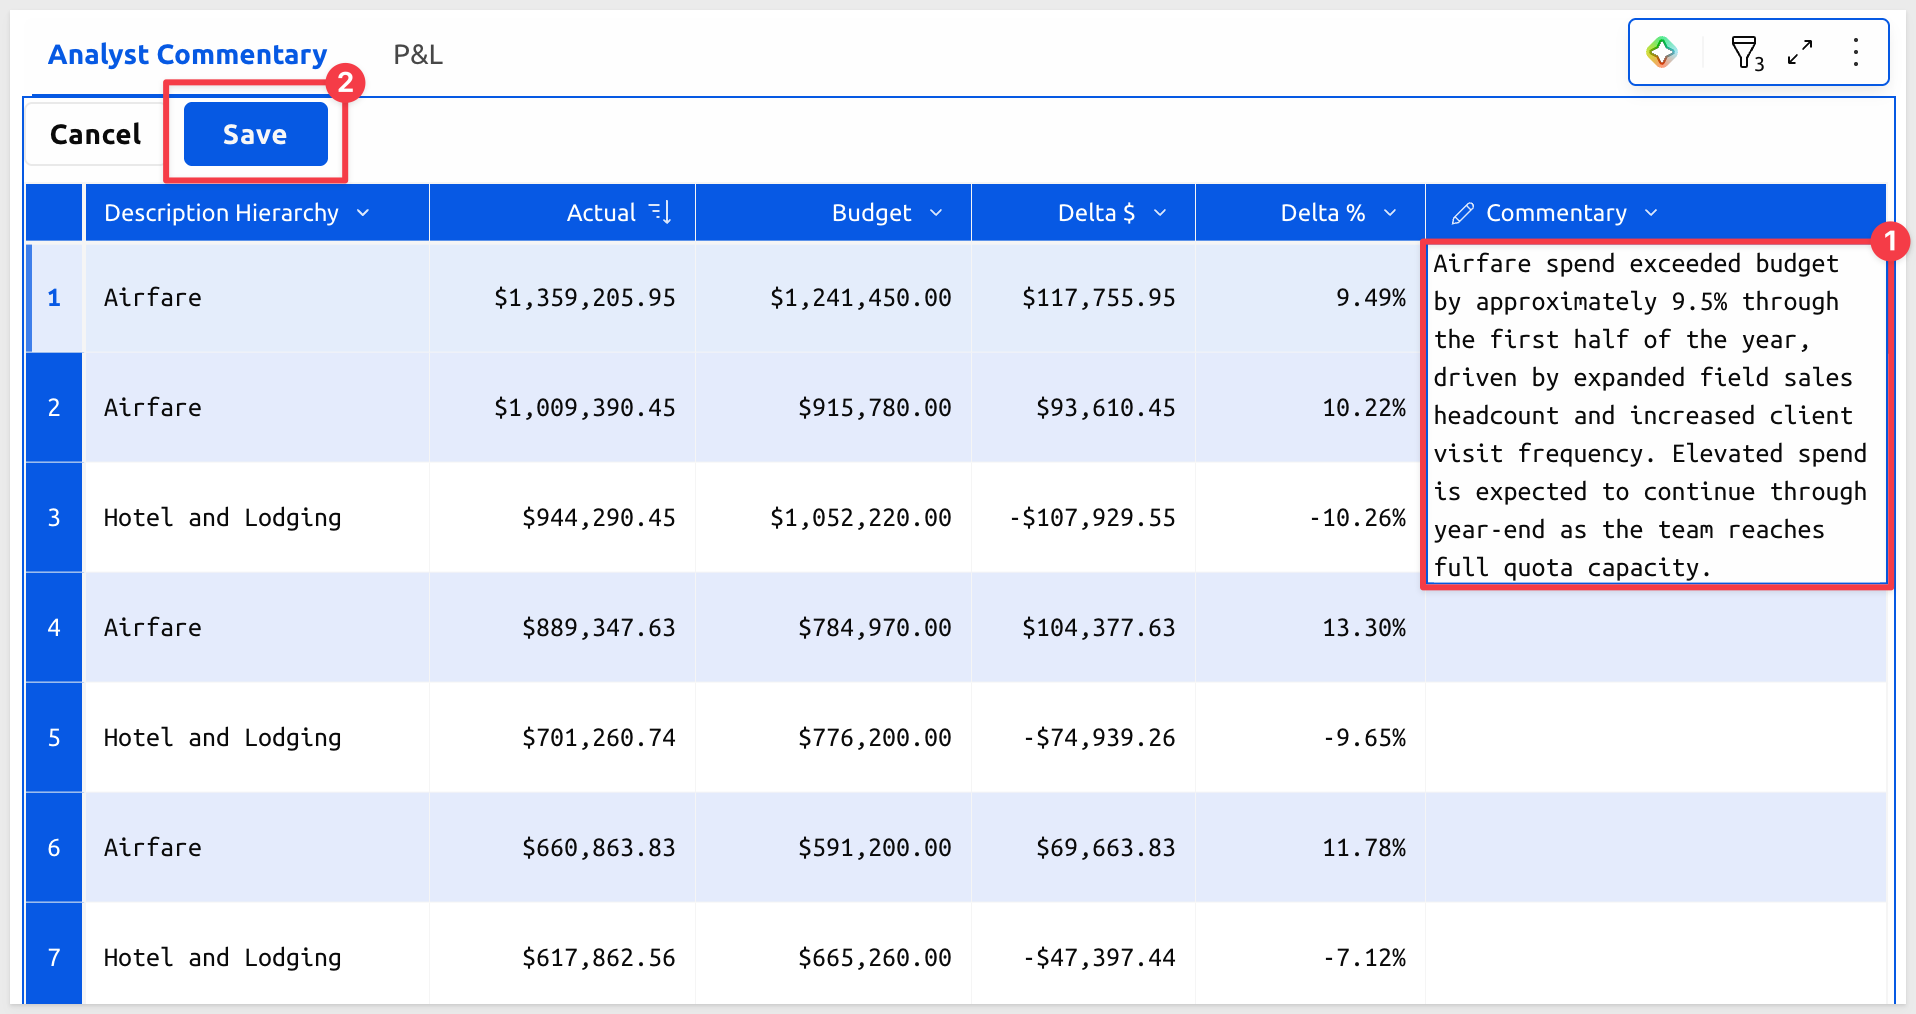
Click any cell in the Commentary column and type your explanation directly into the row.
For the Airfare overage use:
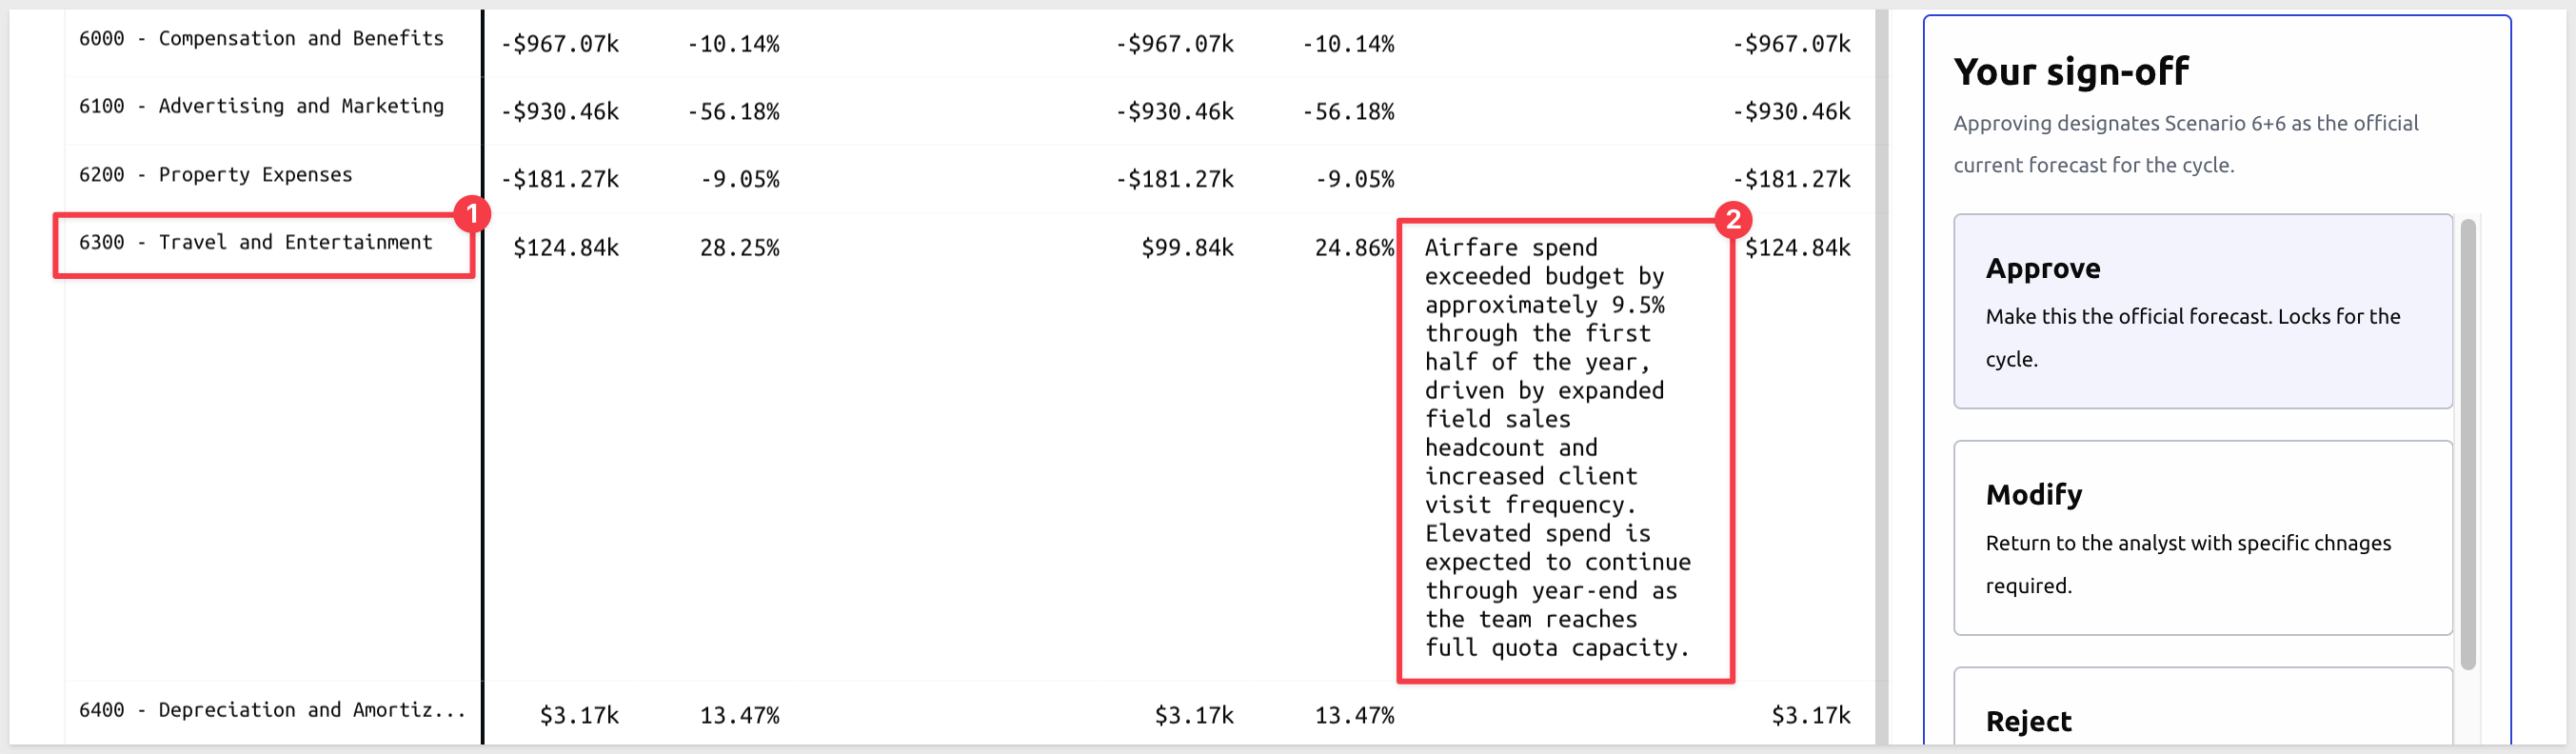
Airfare spend exceeded budget by approximately 9.5% through the first half of the year, driven by expanded field sales headcount and increased client visit frequency. Elevated spend is expected to continue through year-end as the team reaches full quota capacity.
Click Save:
Repeat for any other lines that need explanation — Hotel and Lodging shows a favorable variance (under budget) that may also warrant a note.
Once commentary is complete for the period, click the Mark 6+6 ready for reforecast → button. This signals to the manager that the commentary step is done and the 6+6 scenario is ready for forecast adjustments:
A message appears confirming the update:

WHY IT MATTERS:
Commentary isn't a side document — it's embedded in the data and travels with the scenario through every downstream step. When the executive opens the Signoff page, the Airfare explanation appears inline next to the delta figures. Finance teams replace the email chain and the deck with a single annotated view that all stakeholders read from the same source.
Click to select the Reforecast Budget page:
The Reforecast Budget page is where managers revise the forecast for the remaining months of the fiscal year.
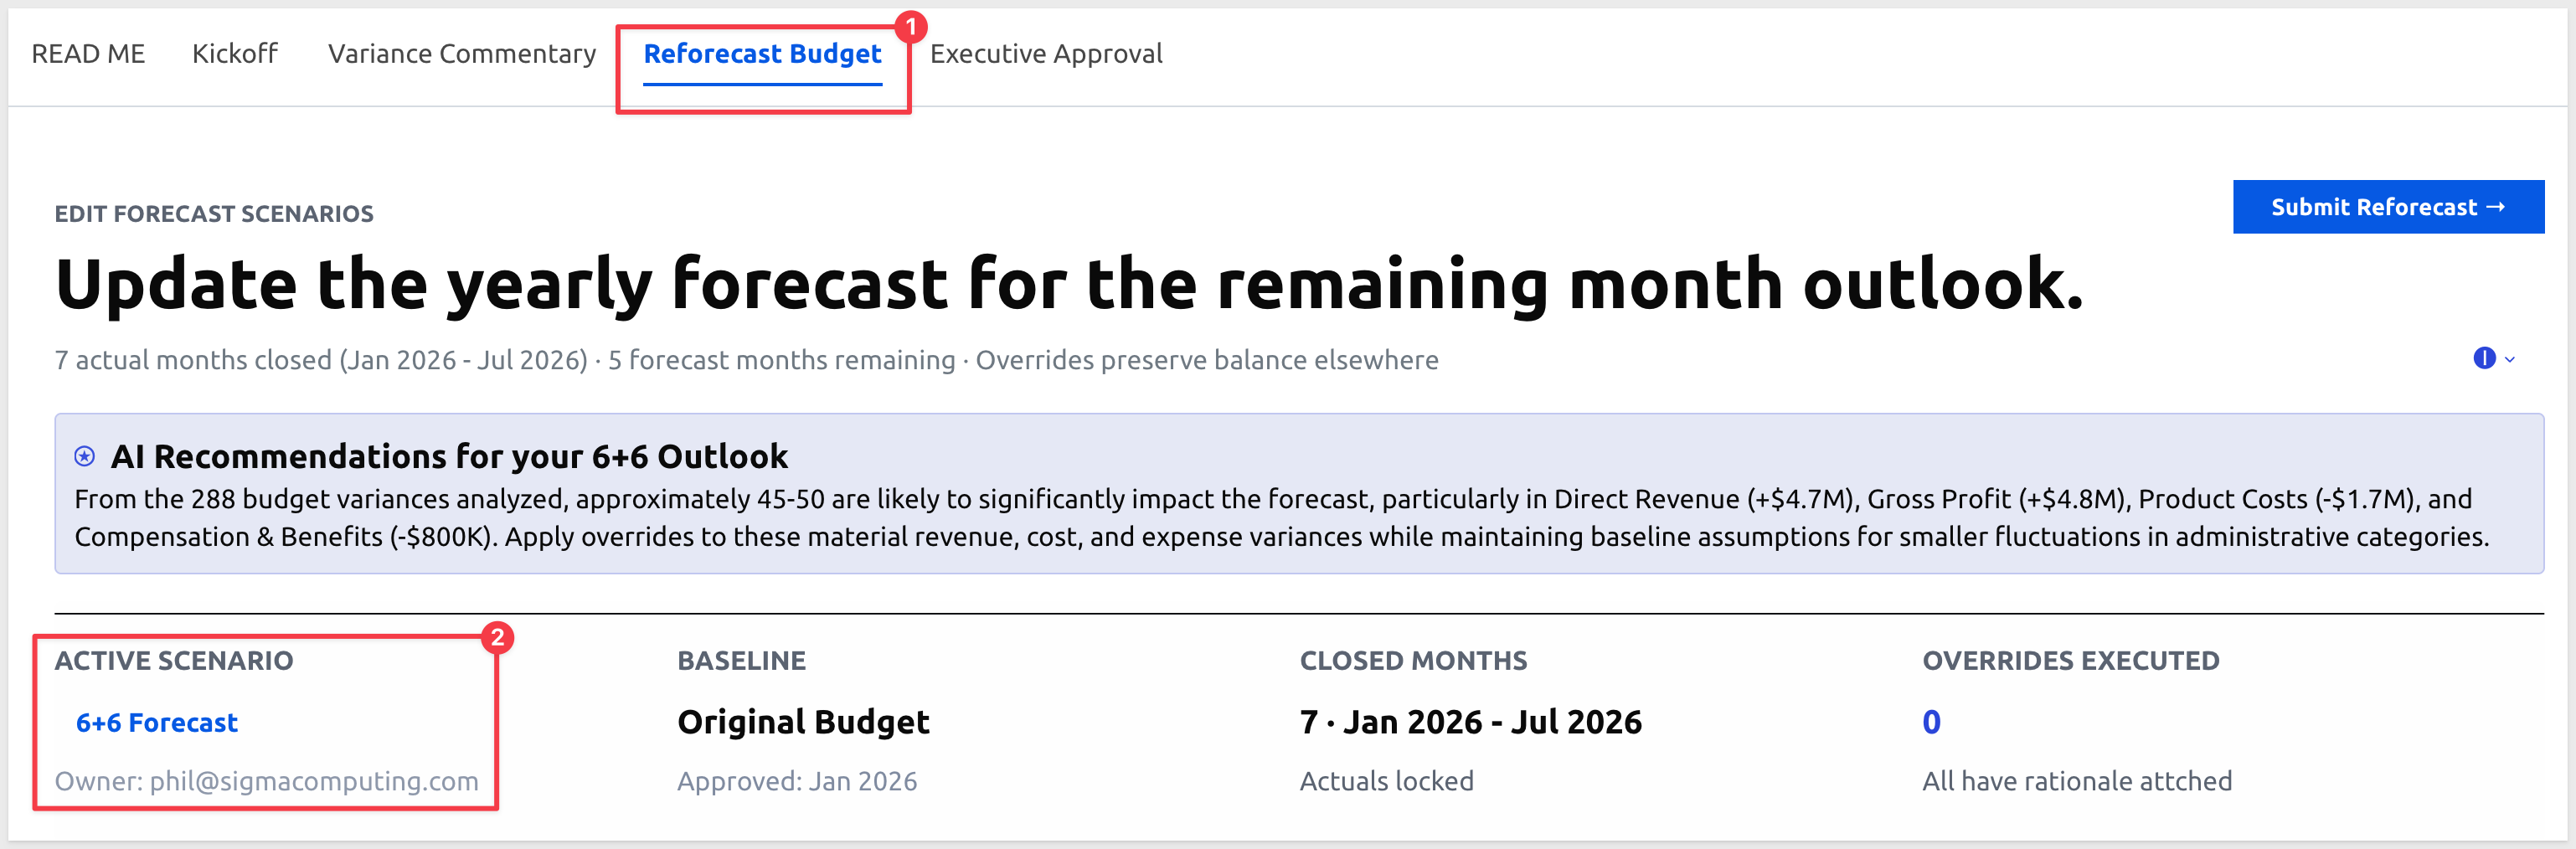
Because you selected 6+6 on the Variance Commentary page, it is already set as the Active Scenario here — no additional selection is needed:
AI Recommendations
At the top of the page, an AI recommendation summarizes which accounts are most likely to carry variance forward and which should remain on baseline. For 6+6, the model has analyzed the six months of closed actuals and the commentary entered in the prior step:

Scenario Status Bar
Below the recommendation, the status bar shows three metrics for the active scenario:
- Baseline — the original approved budget, locked as the comparison reference
- Closed Months — the number of actual months locked (Jan through June for
6+6) - Overrides Executed — count of budget lines adjusted so far; starts at zero

Adjusting the Forecast
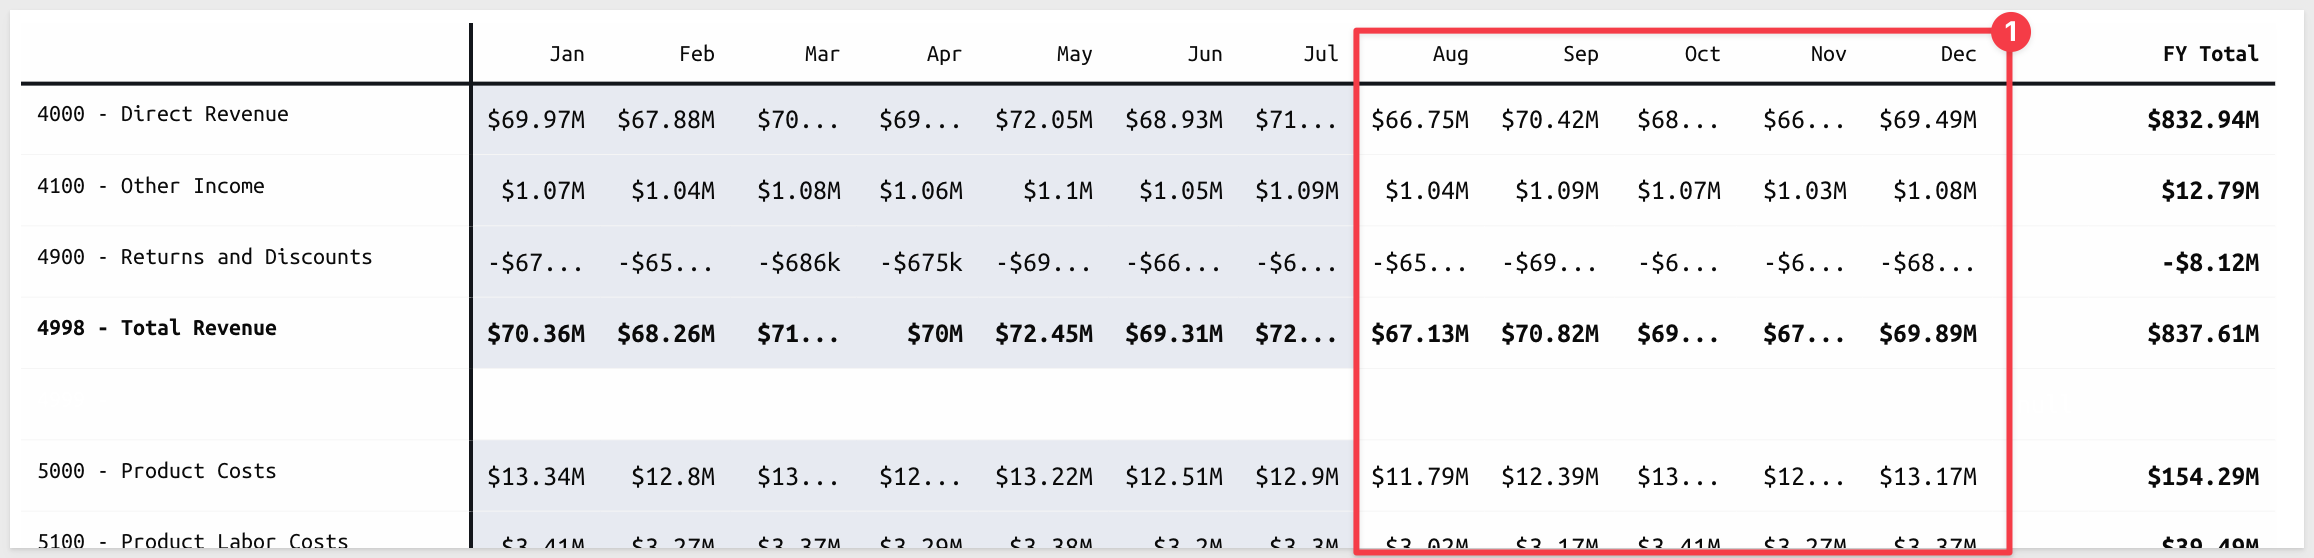
The pivot table shows P&L categories as rows and months as columns. Grey cells are closed actuals — locked, not editable. White cells are open forecast months. Blue cells have an override applied.
Clicking any white cell opens an Edit Budget Modal:
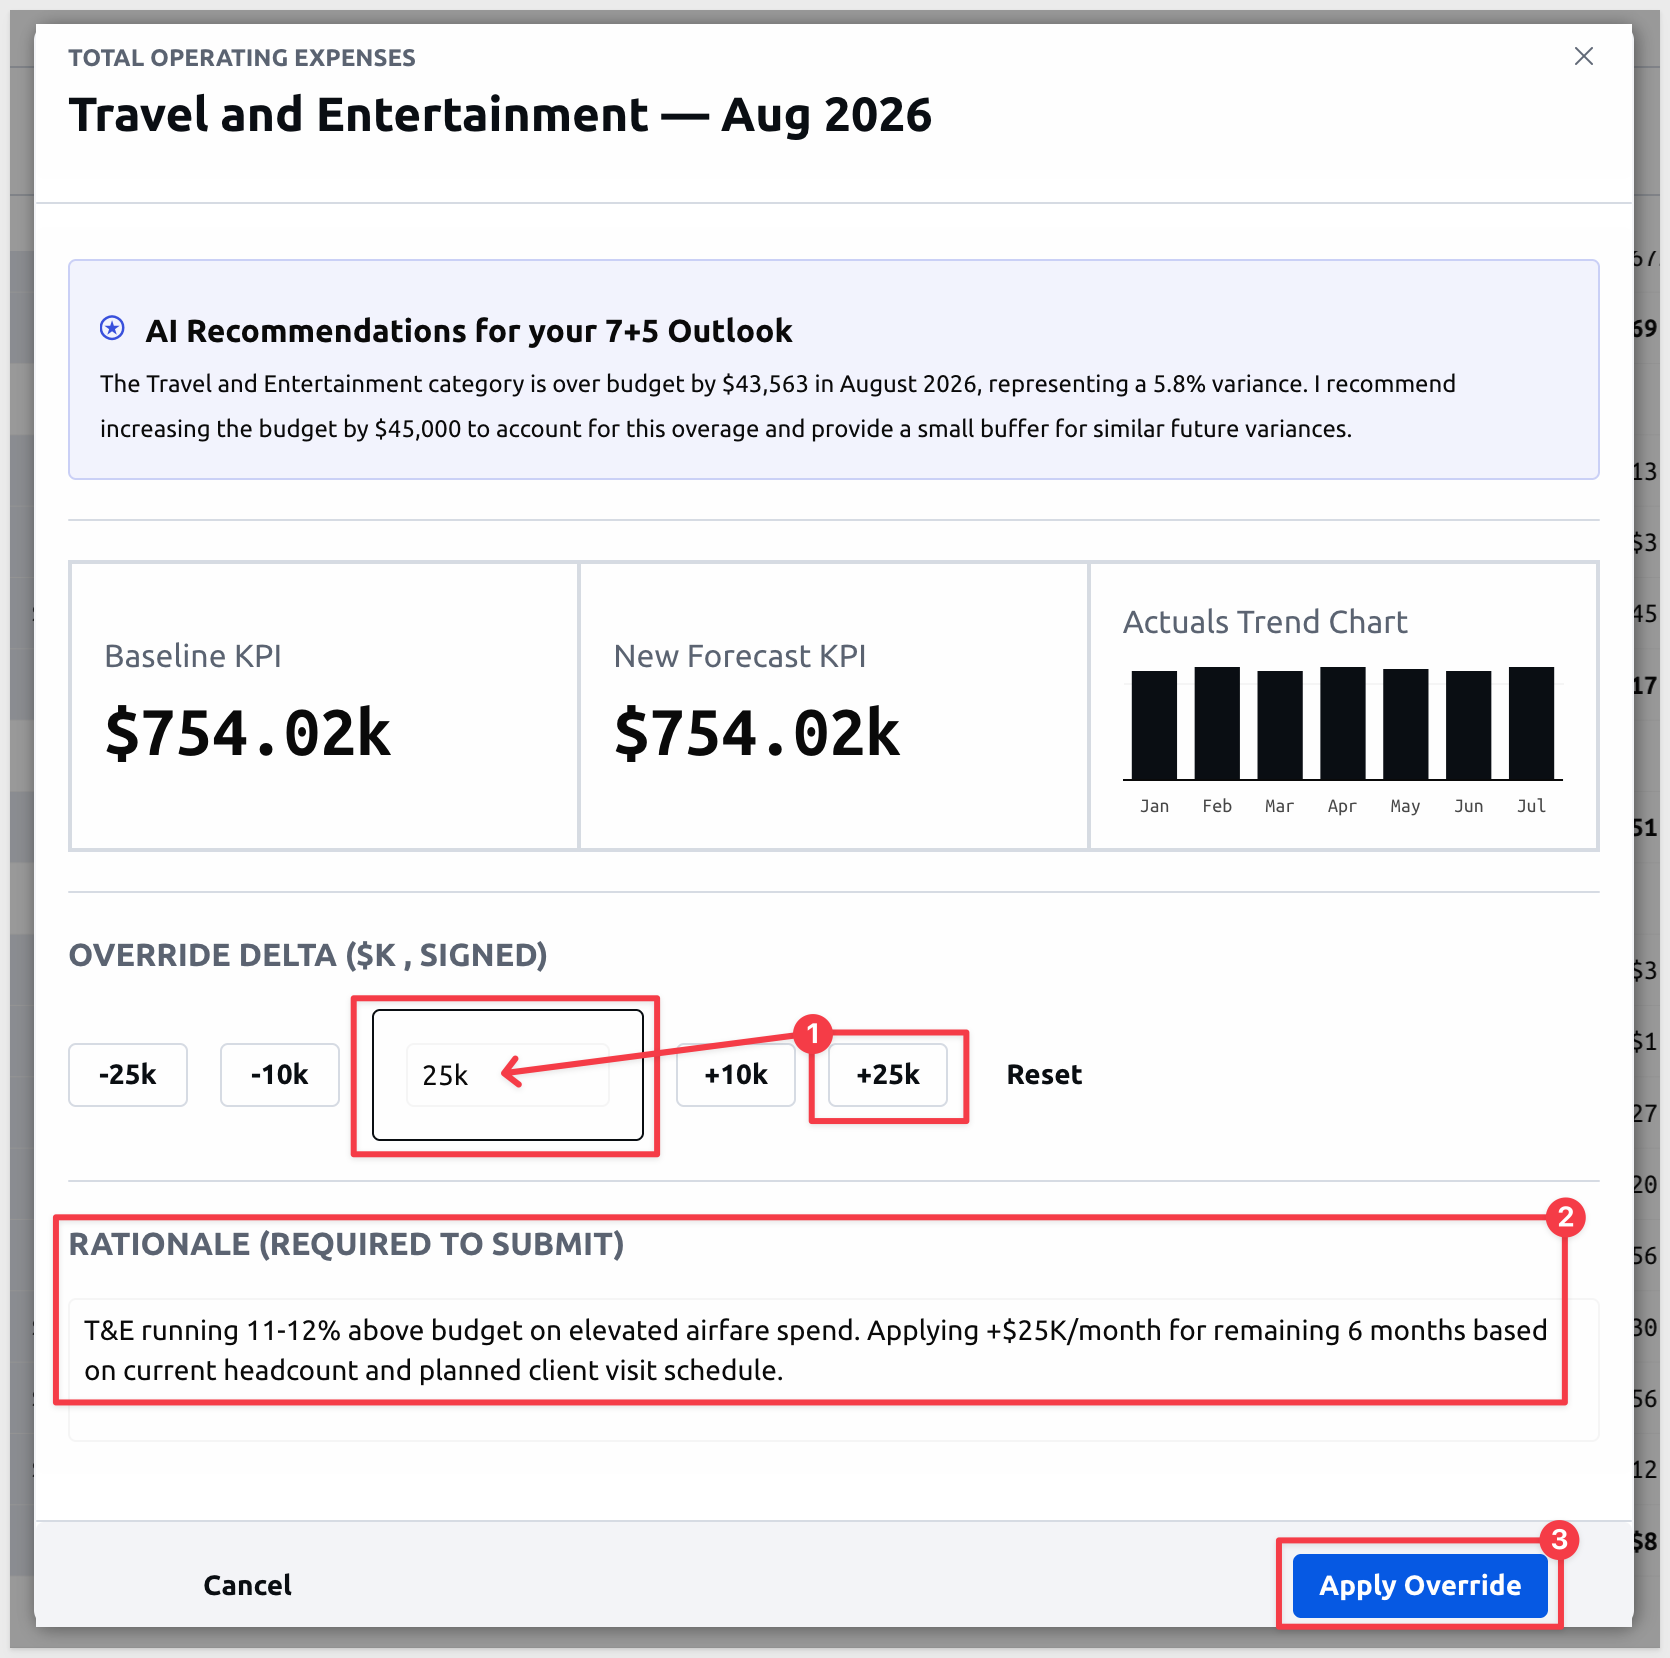
The modal shows:
- The AI recommendation for the scenario
- Baseline KPI and New Forecast KPI — the before and after for that row
- Actuals Trend Chart — the closed-month trend to inform the adjustment
- Override Delta — quick-select buttons (
-25k,-10k,0,+10k,+25k) or type a custom value (signed) - Rationale — required before
Apply Overrideactivates
For Travel and Entertainment, click the 754.02K cell:

select +25k to reflect the elevated spend trend, and enter a rationale:
T&E running 11-12% above budget on elevated airfare spend. Applying +$25K/month for remaining 6 months based on current headcount and planned client visit schedule.
Scroll down and click Apply Override and the modal will close automatically.
The Travel and Entertainment cells for the remaining forecast months turn blue in the pivot:

The Overrides Executed count is incremented:

The edited cell is shown with a colored background:
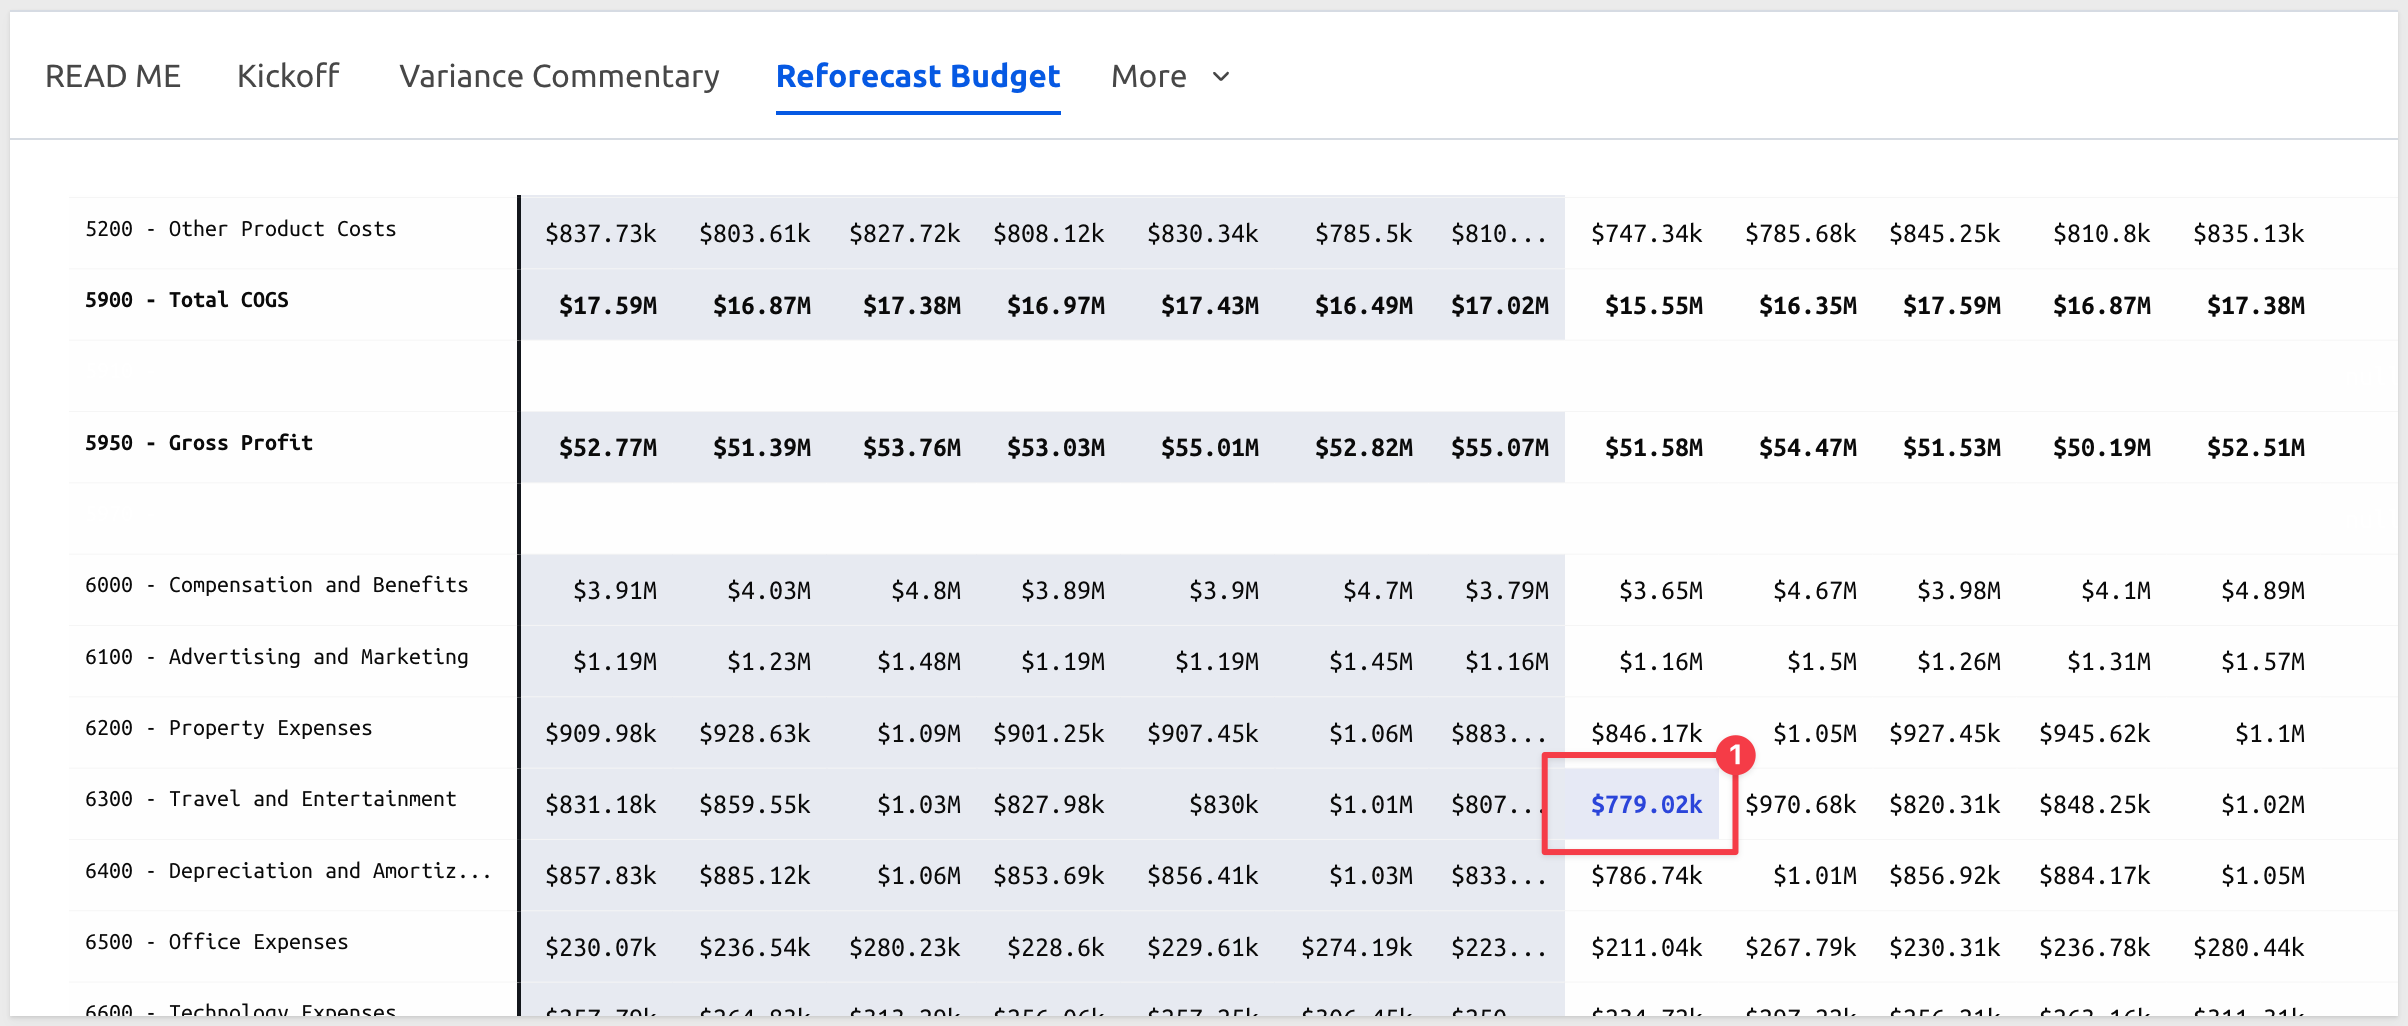
Repeat for any other accounts where the AI recommendation or your analysis suggests adjustment.
When all overrides are in place, click Submit Reforecast:

The 6+6 scenario moves to Executive Signoff with a status of Pending.
WHY IT MATTERS:
Every adjustment requires a rationale before it can be applied — the modal enforces this. The result is a complete, timestamped audit trail of every forecast change, linked to the scenario and visible to anyone who opens the workbook. There is no separate log to maintain.
Once submitted, the 6+6 scenario appears on the Executive Signoff page with a status of Pending. This page is intended for authorized reviewers — executives or budget owners who have the authority to approve the reforecast as the official plan.
Reviewing the Submission
The page header identifies the scenario (6+6), who submitted it, and the submission timestamp — providing full visibility into the approval pipeline before any decision is made.
Below the header, a full-year pivot compares the reforecast against the original budget across all P&L categories on a YTD basis:
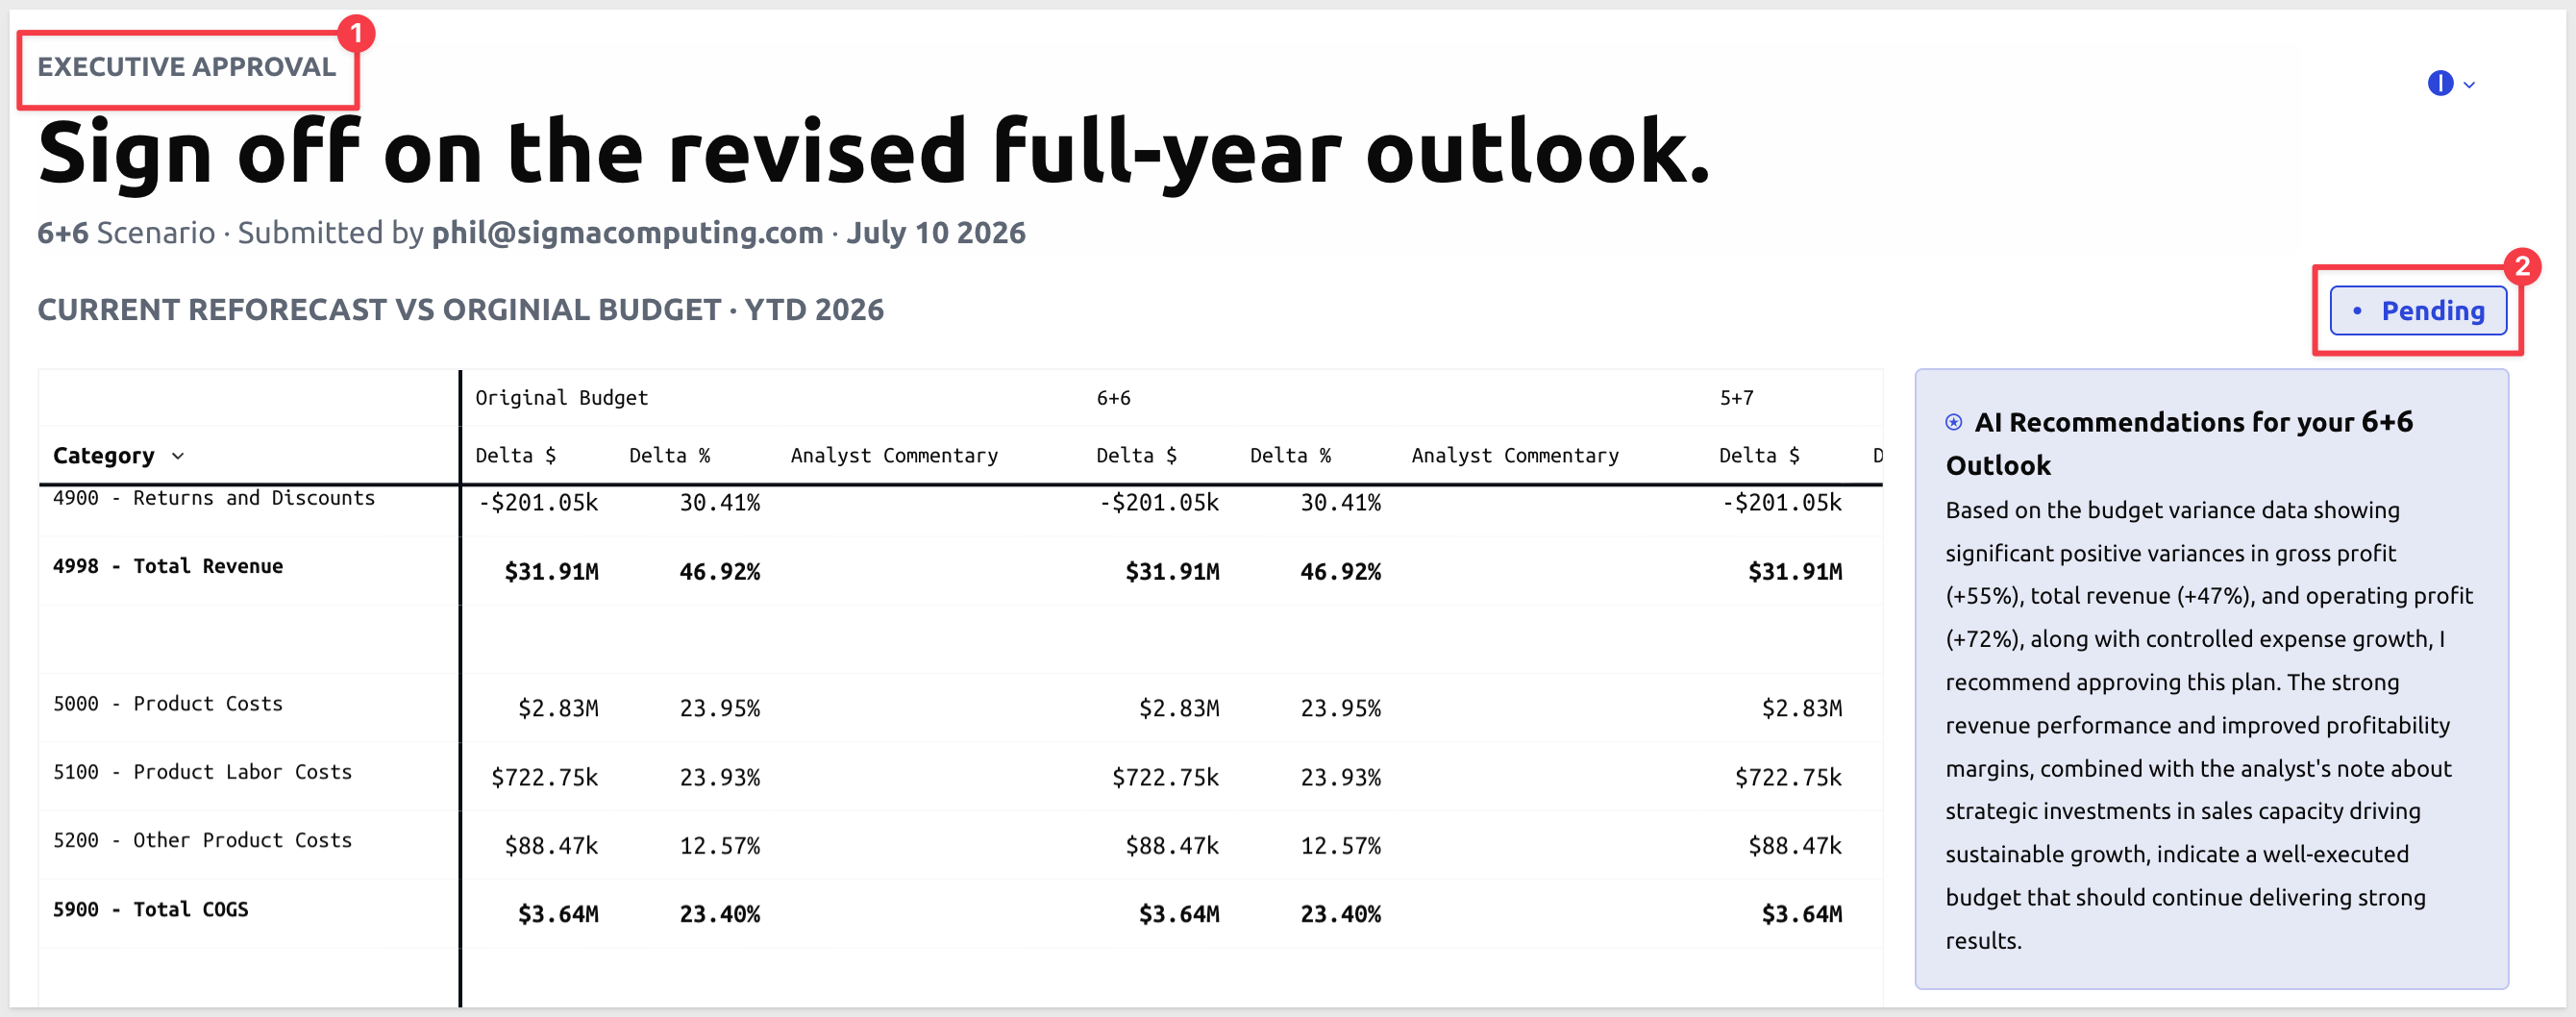
The analyst commentary entered on the Variance Commentary page appears inline in the pivot alongside the delta figures:
If multiple scenarios have been submitted, they appear as side-by-side columns in the pivot, allowing the executive to compare approaches before committing to one.
AI Approval Recommendation
Alongside the pivot, Sigma generates a recommendation framed from the executive's perspective. The model reviews the delta $ and delta % figures and the analyst commentary across the full scenario, then returns a 1–2 sentence read on whether the plan is adequately supported.
The recommendation surfaces the key factors worth weighing — it doesn't make the decision.
Signing Off
The sign-off panel on the right shows the current scenario status and an optional Executive Note text area. Add a note if warranted:
T&E trend confirmed by field team expansion. Approved with the expectation that H2 travel normalizes as onboarding completes.
Click Sign Off to officially approve the 6+6 scenario. It is designated as the current baseline moving forward. The planning cycle closes, and the next period begins.
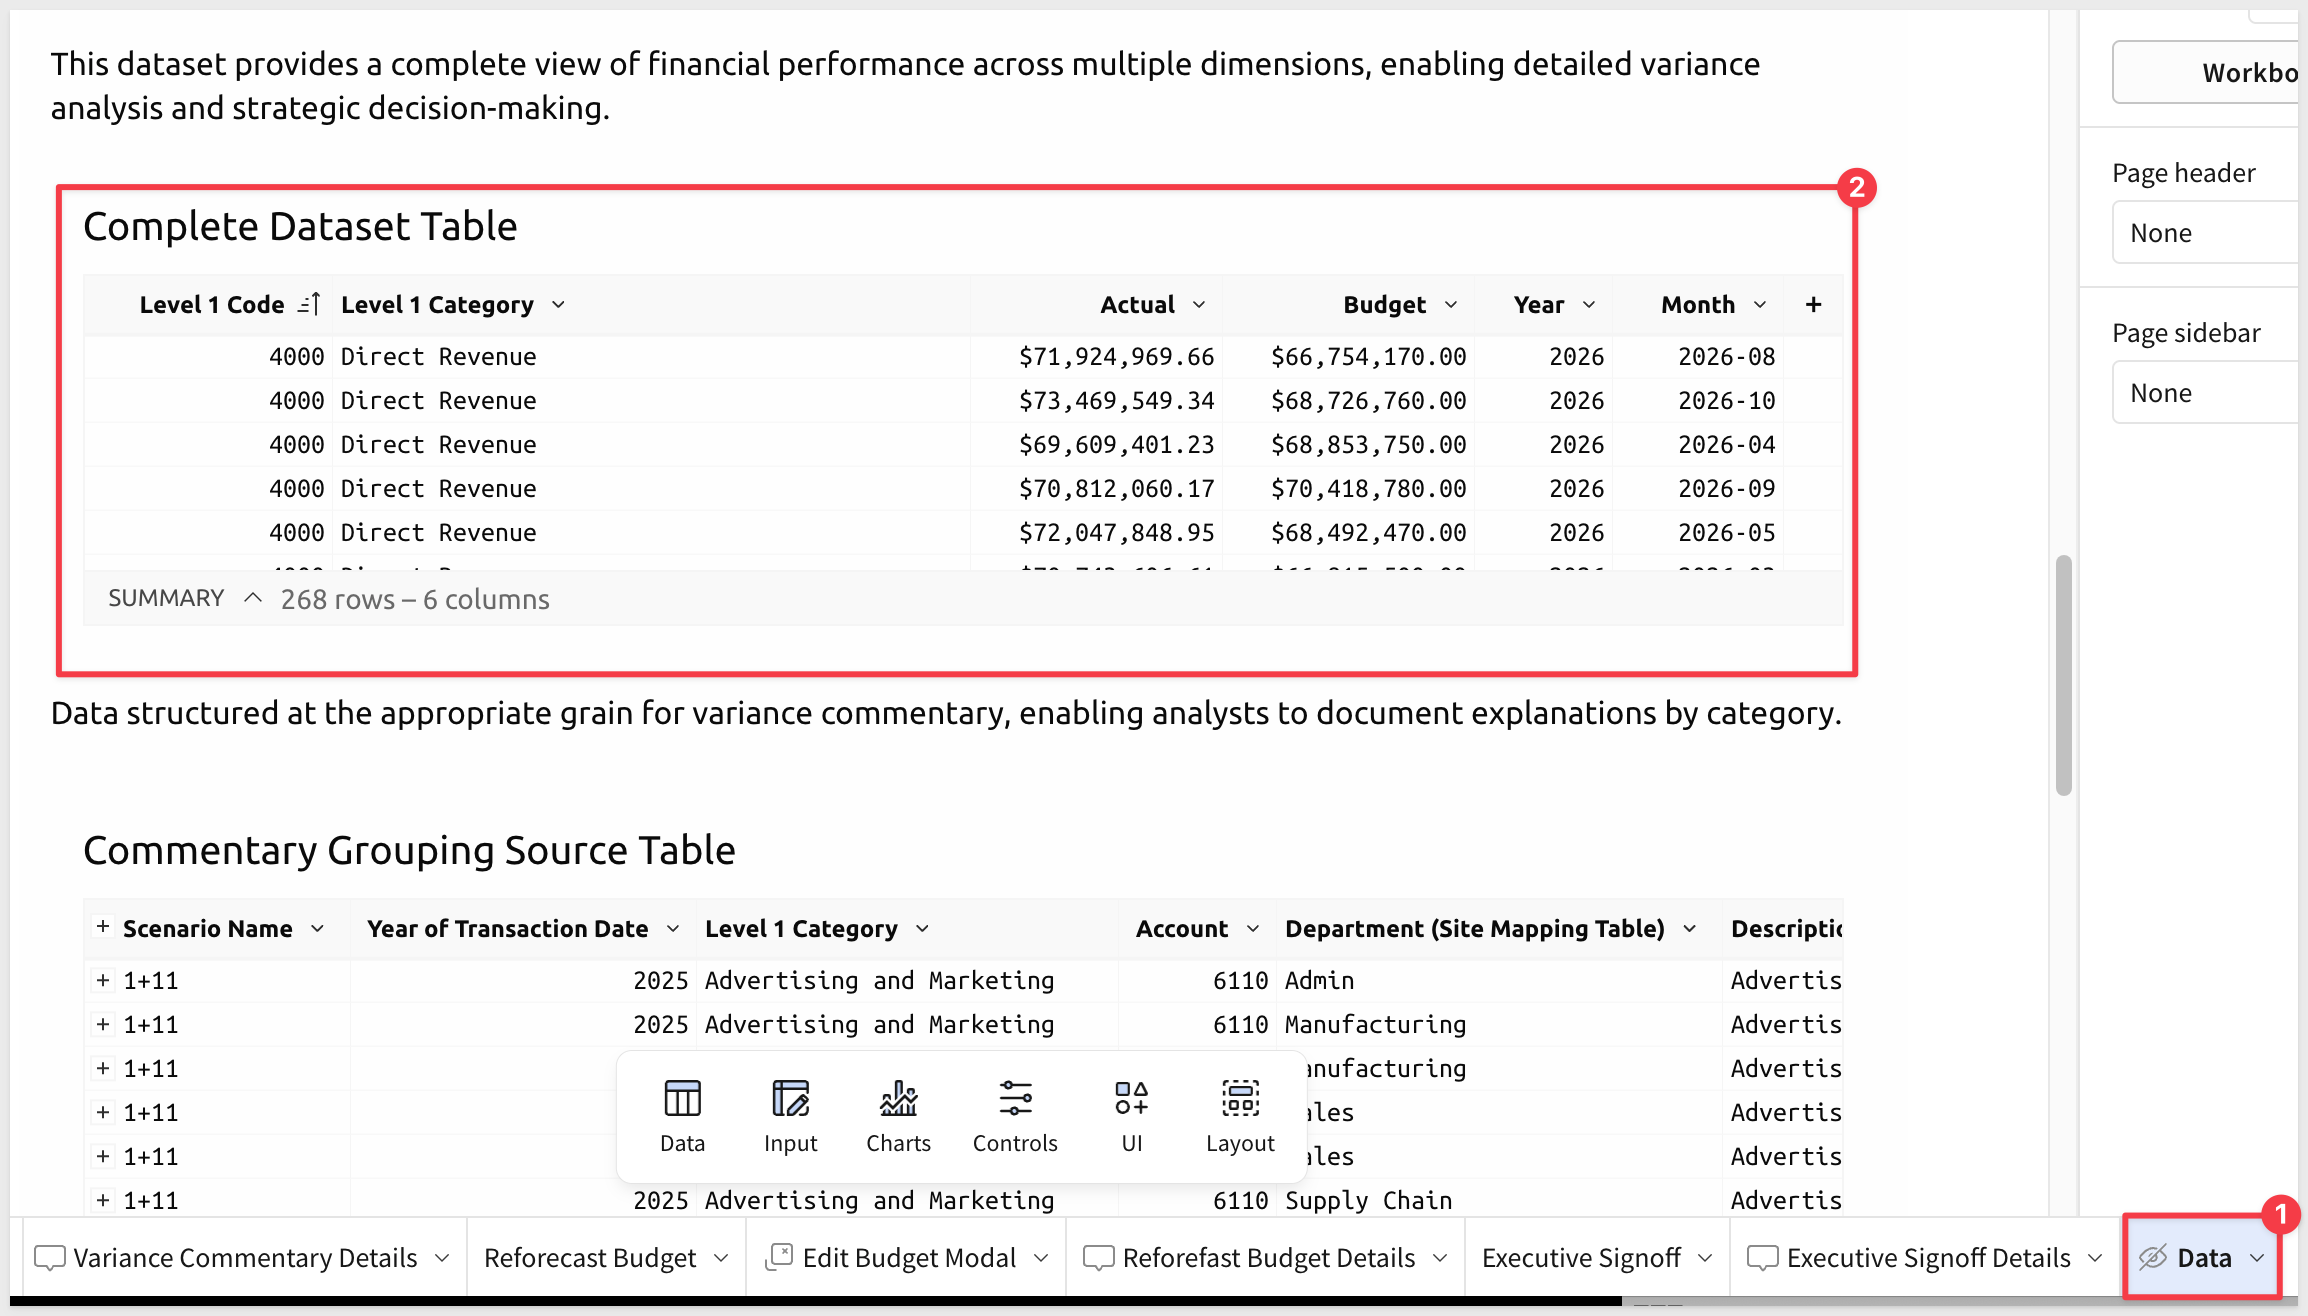
Understanding the data architecture helps you adapt the app to your own data or apply its patterns to other workbooks. All source and input tables are on the hidden Data page — switch to edit mode and unhide it to explore the architecture directly.
Data Sources
The app connects to two warehouse tables in Snowflake's sample PLUGS_ELECTRONICS_FINANCIALS schema:
COMPLETE_FINANCIALS— transaction-level financial data with aScenariocolumn that distinguishesActualfromBudgetrows. This is the primary source for all variance calculations.ACCOUNT_HIERARCHY— account codes, Level 1 categories (e.g., Direct Revenue, Compensation and Benefits), and P&L section groupings (Revenue, Cost of Goods Sold, Operating Expenses).
Three additional input tables extend the warehouse data:
Site Mapping Table— maps product area or location values from the warehouse to departments, sites, and countries for geographic filteringCustom Account Hierarchy Rows Table— lets you define additional account category codes not present in the warehouse hierarchySubmitted Scenarios Table— tracks every named scenario with its status, owner, and executive notes
The Data Pipeline
The app uses Sigma's transpose feature to calculate financial statement subtotals (Gross Profit, Operating Profit) that don't exist as individual rows in the warehouse:
- Group by Section — transactions are grouped by P&L section (Revenue, Cost of Goods Sold, Operating Expenses) and time period, summing Actual and Budget separately.
- Row-to-column transpose — the three sections become column values, enabling calculated fields:
Gross Profit = Revenue - COGS,Operating Profit = Gross Profit - Operating Expenses. - Column-to-row transpose — the calculated subtotals are converted back to rows and unioned with the detail-level account data to form a single financial statement source.
This pipeline runs for both actuals and budget amounts in parallel, then the two are unioned into Complete Dataset Table — the final source for all pivot tables in the app:
The Scenario and Override Architecture
Each named scenario is created by adding a row to Submitted Scenarios Table. The app then cross-joins that scenario against every row of Complete Dataset Table, creating a full copy of the budget data for each scenario in Base Data for Pivot Overrides Table.
Base Data for Pivot Overrides Table is a linked input table — it inherits all warehouse rows and adds three editable columns:
Column | Type | Purpose |
Adjustment | Number | Dollar change to the budget for this cell |
Adjustment Reason | Text | Required rationale for the override |
Override? | Checkbox | Marks the row as intentionally adjusted |
The effective budget for each cell is Base Budget + Adjustment (falling back to Base Budget when no override exists). The pivot tables on the Reforecast Budget and Executive Signoff pages read from this table, so every override is reflected immediately.
Inline AI
The AI recommendations on the Reforecast Budget and Executive Signoff pages use Sigma's CallText function to call an AI model inline — no external service or separate integration required:
CallText("ai_complete", "claude-4-sonnet", "[system prompt] + scenario data")
The function assembles the prompt from live workbook values — category names, actuals, budgeted amounts, and analyst commentary — and returns a recommendation directly into a text element on the page. The AI runs within Sigma's governed environment, subject to your organization's AI configuration and audit logging.
WHY IT MATTERS:CallText brings AI analysis to the point of decision without requiring a separate tool or export step. The recommendation is generated from the same data the analyst and executive are already looking at — and it's governed by the same permissions, audit logs, and access controls that apply to the rest of the workbook.
The app ships connected to Plugs Electronics sample data. Connecting it to your own financial data requires pointing the warehouse sources to your tables and configuring the supporting input tables to match your account structure.
Warehouse Table Requirements
The app expects two warehouse tables. Your data should conform to the following schema or be transformed to match it:
Financial transactions table (replaces COMPLETE_FINANCIALS):
Column | Type | Description |
Account | Text | Account code |
Description Account Hierarchy | Text | Account description |
Transaction Date | Date | Transaction date |
Scenario | Text |
|
Amount | Number | Transaction amount |
Product Area | Text | Location or business unit identifier |
Region | Text | Geographic region |
Department | Text | Department name |
Account hierarchy table (replaces ACCOUNT_HIERARCHY):
Column | Type | Description |
Account | Text | Account code (joins to financial transactions) |
Level 1 Code | Number | Numeric P&L category code |
Level 1 Category | Text | Category name (e.g., |
Section | Text | P&L section: |
Reconnecting the Sources
In the workbook's Data page (switch to edit mode and unhide it), locate Complete Financials Table and Account Hierarchy Table. Use the element panel to reconnect each to your warehouse tables.
Configuring the Input Tables
After reconnecting the warehouse sources, configure the three supporting input tables on the Data page:
Site Mapping Table — populate with your organization's location-to-department mappings. Each row maps a Product Area value from the financial table to a Department, Site, and Country.
Custom Account Hierarchy Rows Table — if your chart of accounts includes subtotal rows that aren't in the warehouse (e.g., a custom "Total Gross Profit" row), add them here with their Level 1 Code and Section. The app uses these to insert spacing and subtotal rows into the financial statement view.
Submitted Scenarios Table — the template ships with six pre-built scenarios (1+11 through 6+6) plus Original Budget. When connecting to your own data, replace these with scenario names that match your organization's planning cadence. The scenario name selected on the Variance Commentary page becomes the Active Scenario on the Reforecast Budget page, so names should be meaningful to analysts and executives alike.
Validating the Connection
After reconnecting, open the Kickoff page in view mode. If the headline metric and period cards show numbers, the data pipeline is working. If they show errors or blanks, check that the Scenario column in your financial table uses the exact values "Actual" and "Budget" — the SumIf formulas throughout the app depend on this exact match.
The Budget Variance Analysis app shows what a governed, end-to-end finance planning workflow looks like when built natively in Sigma. The analyst explains variances, the manager adjusts the forecast, and the executive reviews and approves — all in a single connected workbook, with commentary, overrides, and sign-offs linked automatically across pages.
A few patterns from this app are worth carrying into your own builds:
- Scenario architecture via cross-join —
Submitted Scenarios Tablecross-joined against the base budget creates a full, independent copy of the forecast for each named cycle. Multiple planning scenarios coexist in the workbook without overwriting each other. - Commentary that travels with the data — analyst notes entered on the Variance Commentary page appear automatically on the Executive Signoff page alongside the delta figures. No export, no briefing deck, no risk of stale context reaching the executive.
- Inline AI with
CallText— recommendations on the Reforecast Budget and Executive Signoff pages are generated from live workbook values inside Sigma's governed environment. No external service, no separate API integration to maintain. - Transpose-based P&L pipeline — the row-to-column and column-to-row transpose pattern calculates subtotals like Gross Profit and Operating Profit that don't exist as rows in the warehouse, then reunites them with account-level detail into a single source for all pivot tables.
These patterns apply well beyond finance — anywhere you need named versions of editable data, linked annotations, or AI analysis tied to a specific data context.
Additional Resource Links
Be sure to check out all the latest developments at Sigma's First Friday Feature page!
Help Center Home
Sigma Community
Sigma Blog