Sigma's App Templates are ready-to-use applications built on Sigma's native features and connected to sample data. Each one ships fully functional — you can explore it immediately, learn how it's built by switching to edit mode, and adapt it to your own projects without starting from scratch.
The Project Management app — built on the "Throughline" sample — gives project managers a single place to plan milestones, track execution, resolve blockers, and communicate status to stakeholders. Every page is connected: changes you make on one surface are immediately reflected everywhere else. AI-generated project summaries and blocker analysis surface context automatically, alongside the work.
This QuickStart walks through how the app works as a user, how it's designed under the hood, and how to start managing your own projects with it.
Target Audience
Project managers, operations teams, and program managers evaluating or adopting Sigma for project tracking. Solutions Engineers and technical stakeholders exploring the app as a reference design for input-table-based apps.
Prerequisites
- Access to a Sigma environment.
- The Project Management App Template available in your org — find it under
Templates>App Templates. - Write access enabled on a connection — required for input tables to store projects, milestones, and tickets. See Set up write access
- AI provider configured for your organization — required for AI project summaries and blocker analysis. See Configure AI features for your organization
- Some familiarity with Sigma workbooks is helpful but not required.
What You'll Learn
- How the Project Management app works from project creation through portfolio reporting
- The key design patterns behind the app and why they're built that way
- How to start managing your own projects and team members with it

Open and Save the Template
Navigate to Templates in the left sidebar. The Project Management app appears in the Made by Sigma collection:
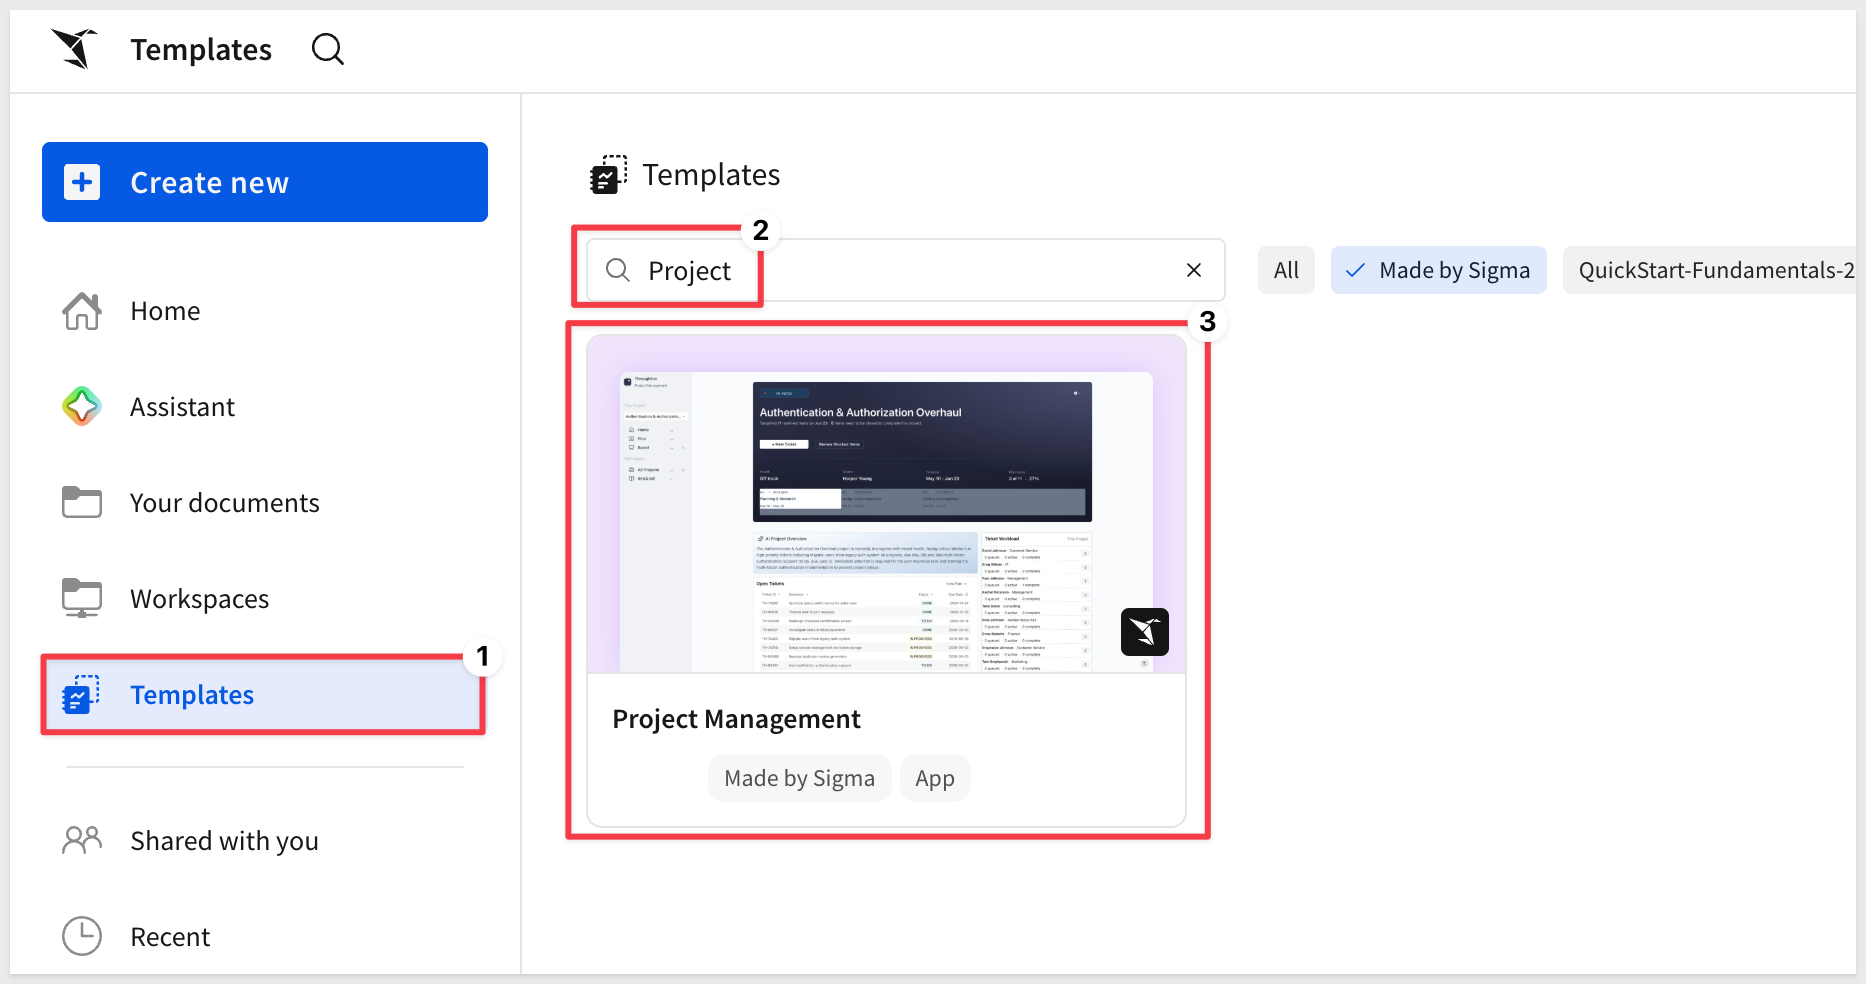
Click the template card to open a preview. Before clicking Use template, confirm the two requirements shown on the detail page are met:
- Write access enabled on a connection — required for input tables to store all project data. See Set up write access
- AI provider set up in your organization — required for the AI summaries on Home and Ticket Details. See Configure AI features for your organization
Once both are in place, click Use template. Sigma creates a personal copy in your workspace that you can explore, edit, and populate with your own data without affecting the original template.
Click Save as and give the new workbook a name:
Project Management
README Page
The app opens on its README page — an introduction built directly into the workbook that orients new users without requiring any external documentation:
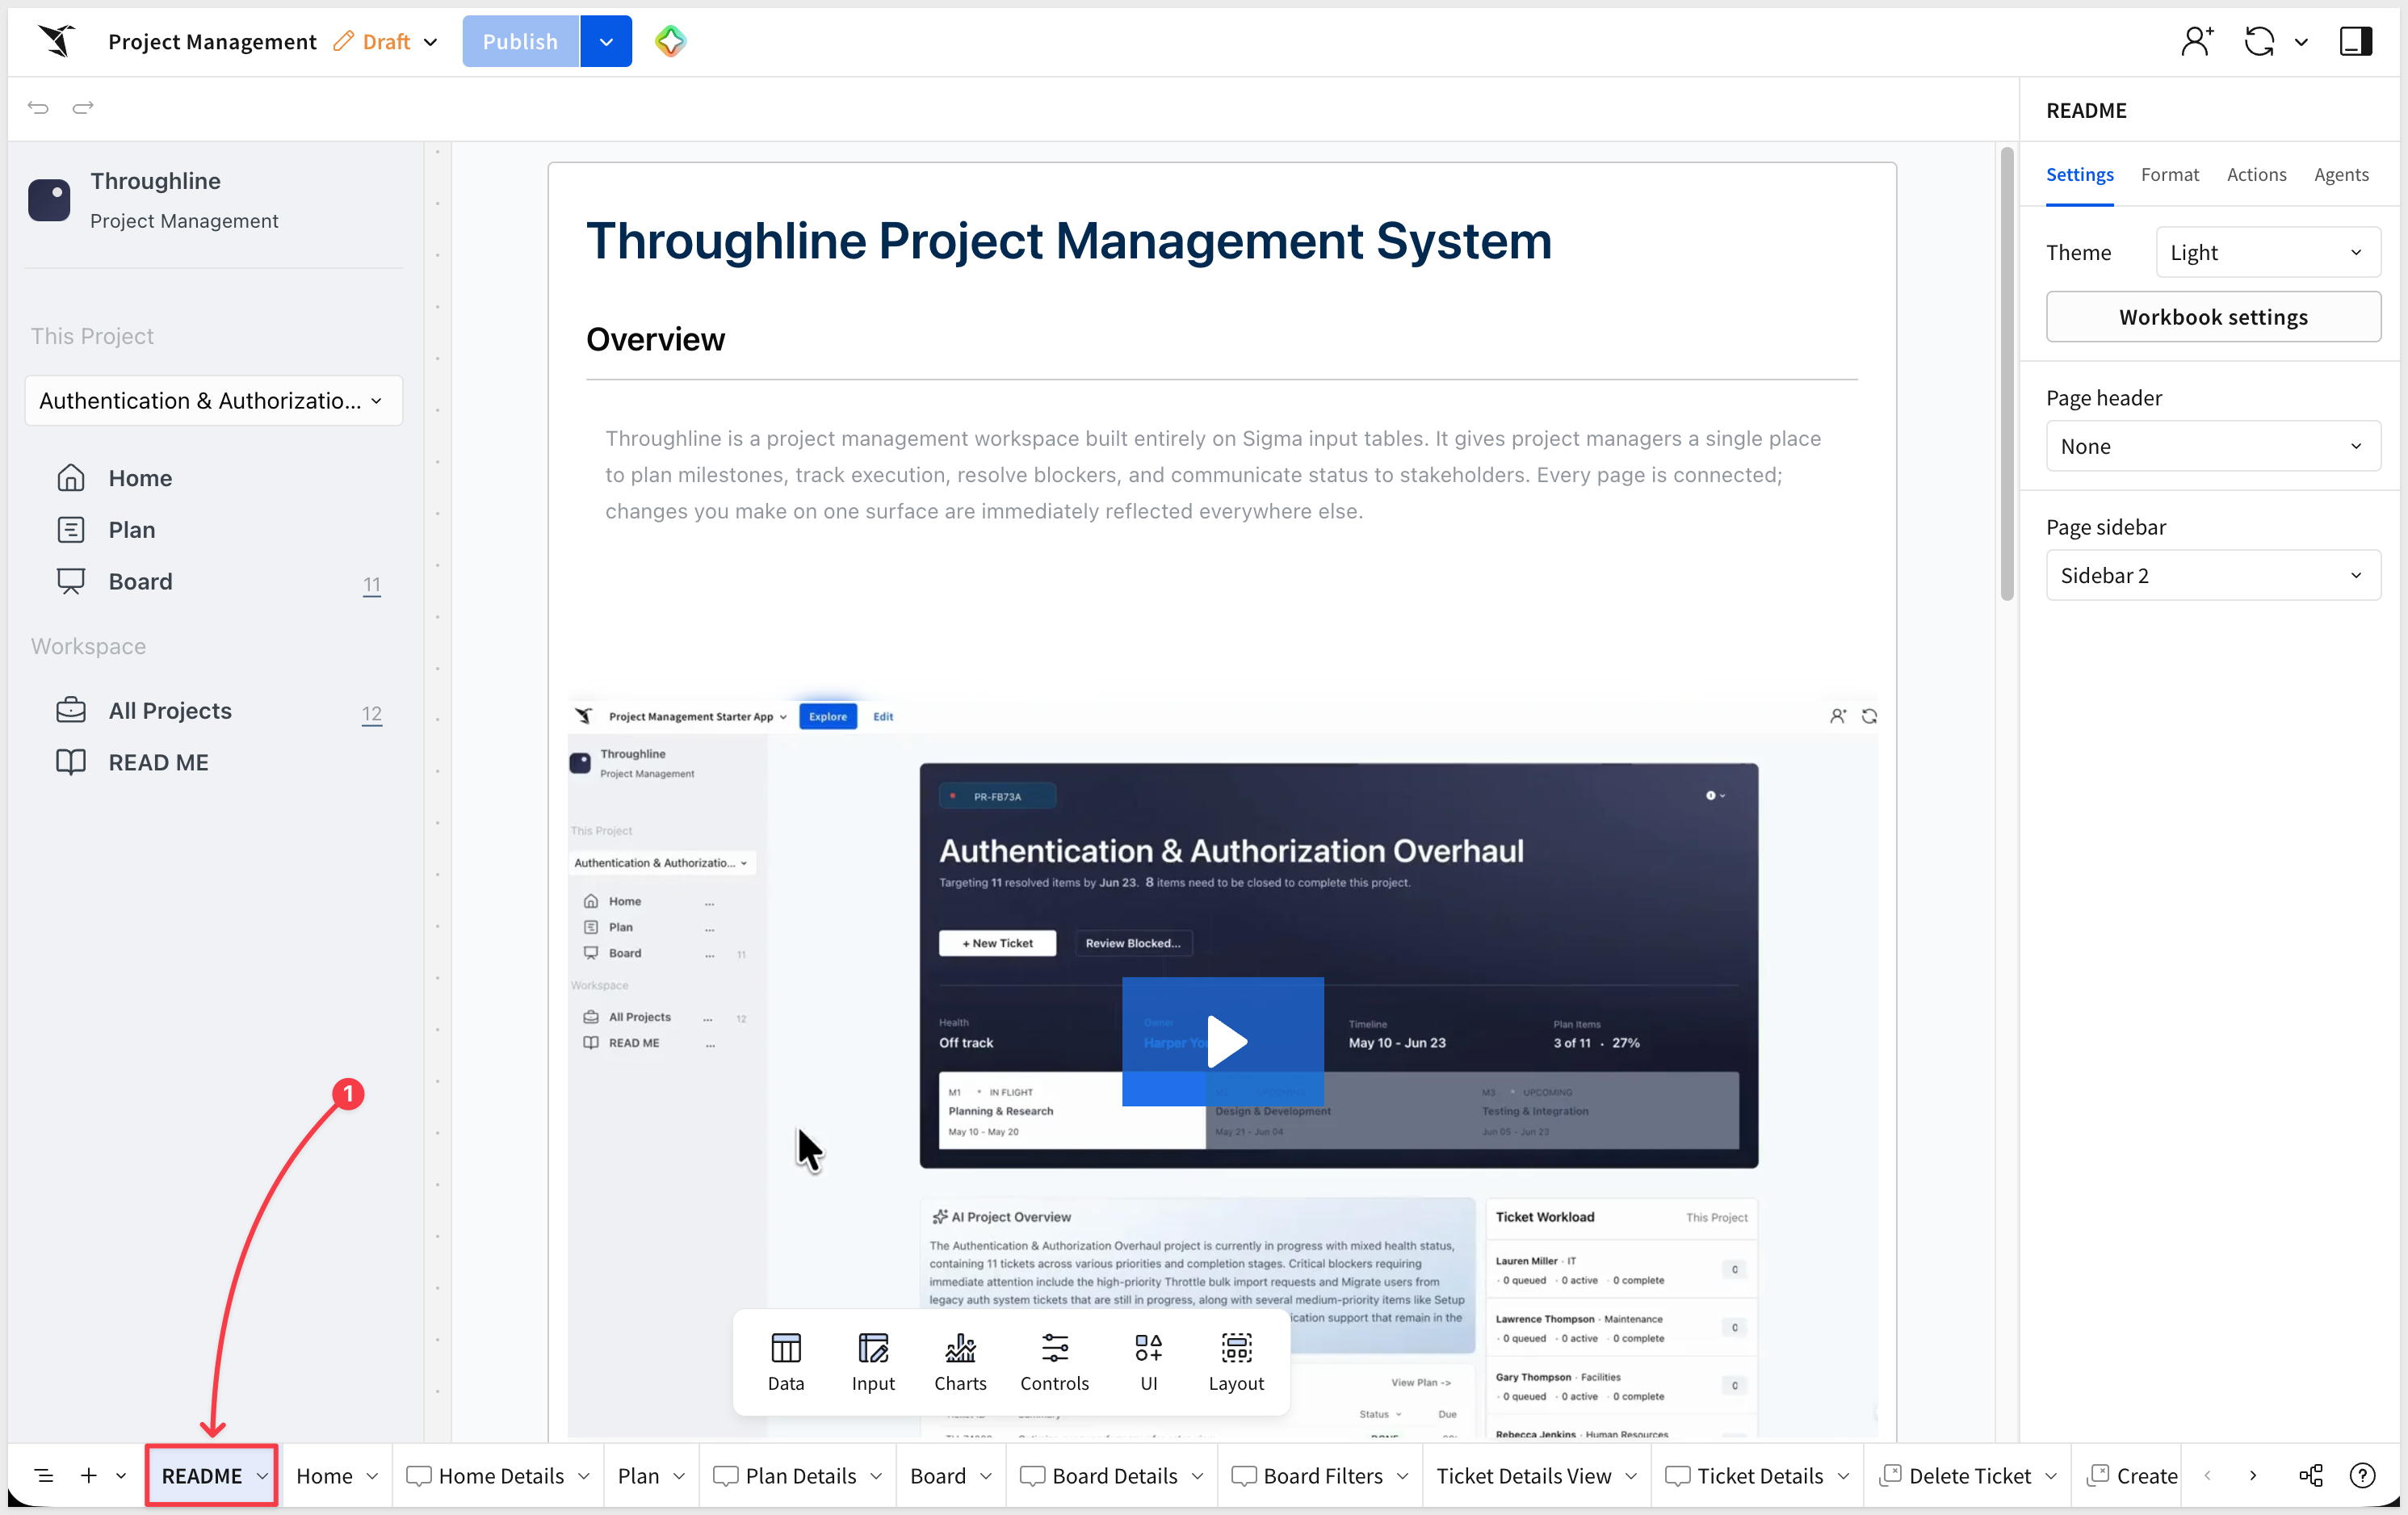
The README includes a short demo video walking through the core workflow, a five-step getting-started guide, and a map of the app's pages. Read through it before diving in — it describes what each page does and the sequence to follow:
- Create your project
- Define milestones
- Add plan items
- Execute on the board
- Review and communicate
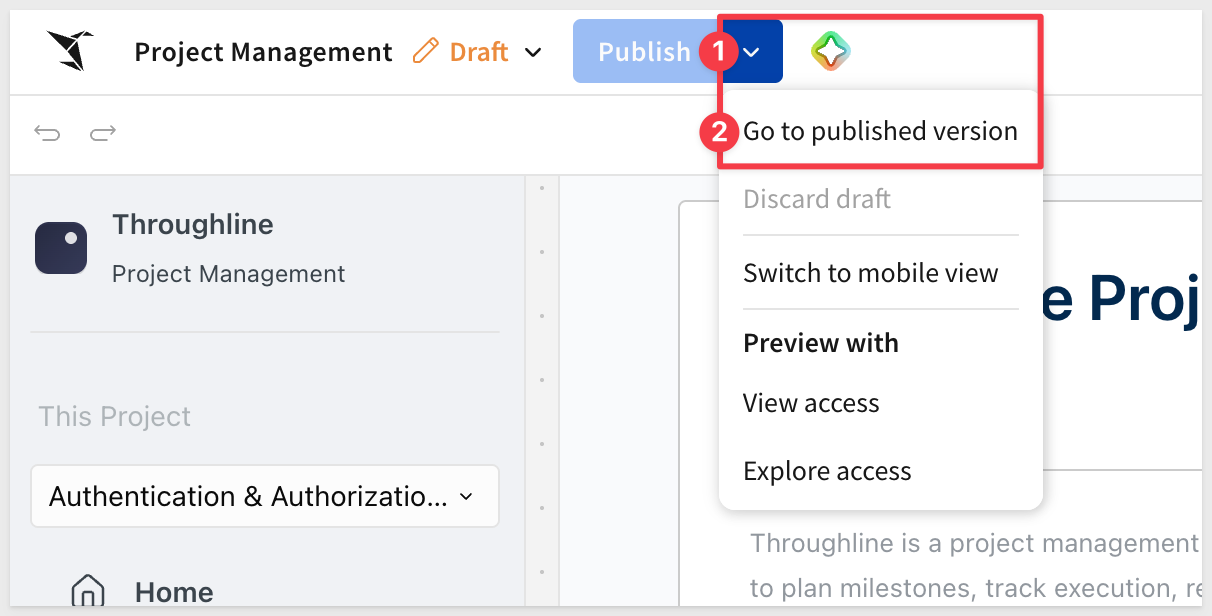
Place the workbook into Published mode:
Home Page
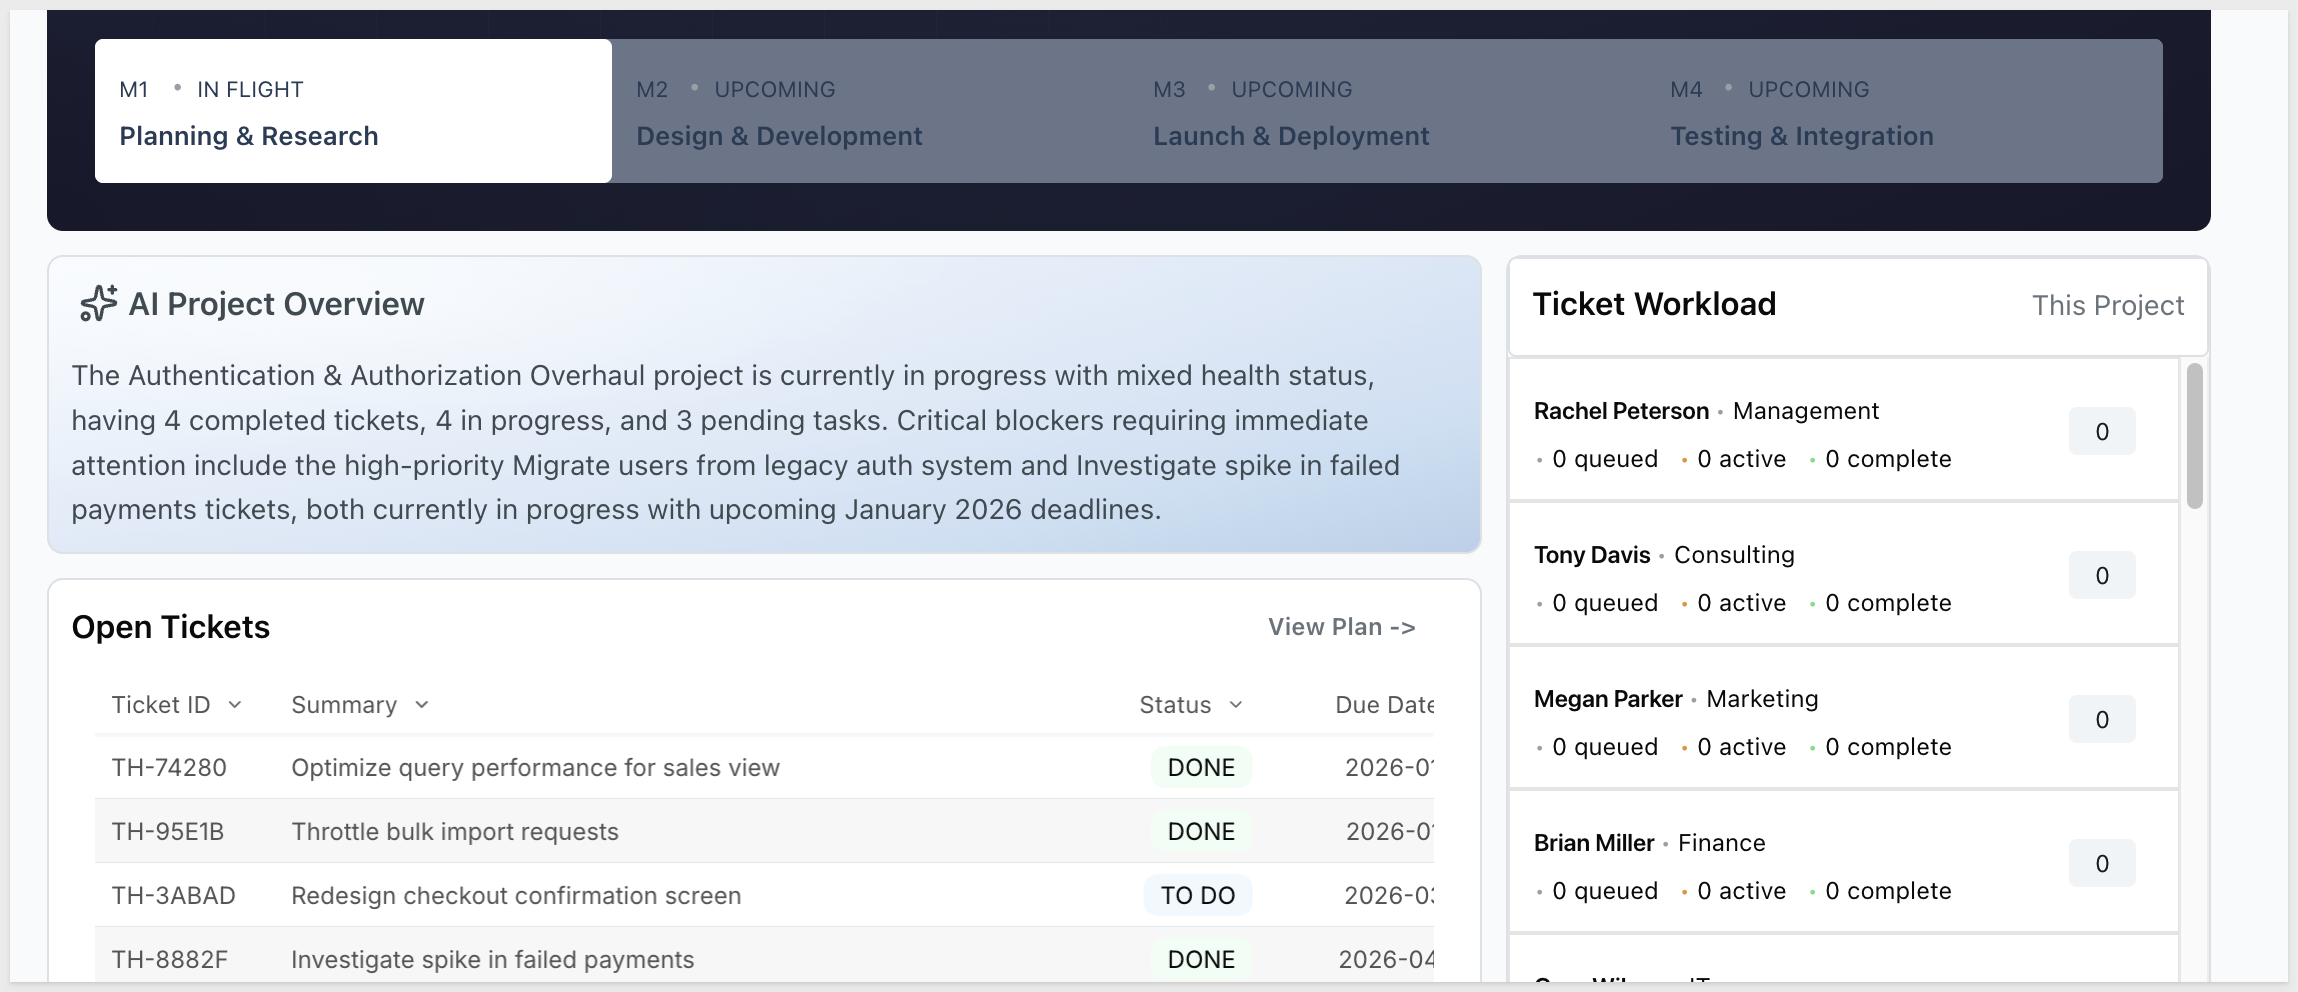
The Home page is the app's front door for an individual project. Select a project from the sidebar to load it. The hero section shows the project name, health status, owner, timeline, and overall plan item completion at a glance:
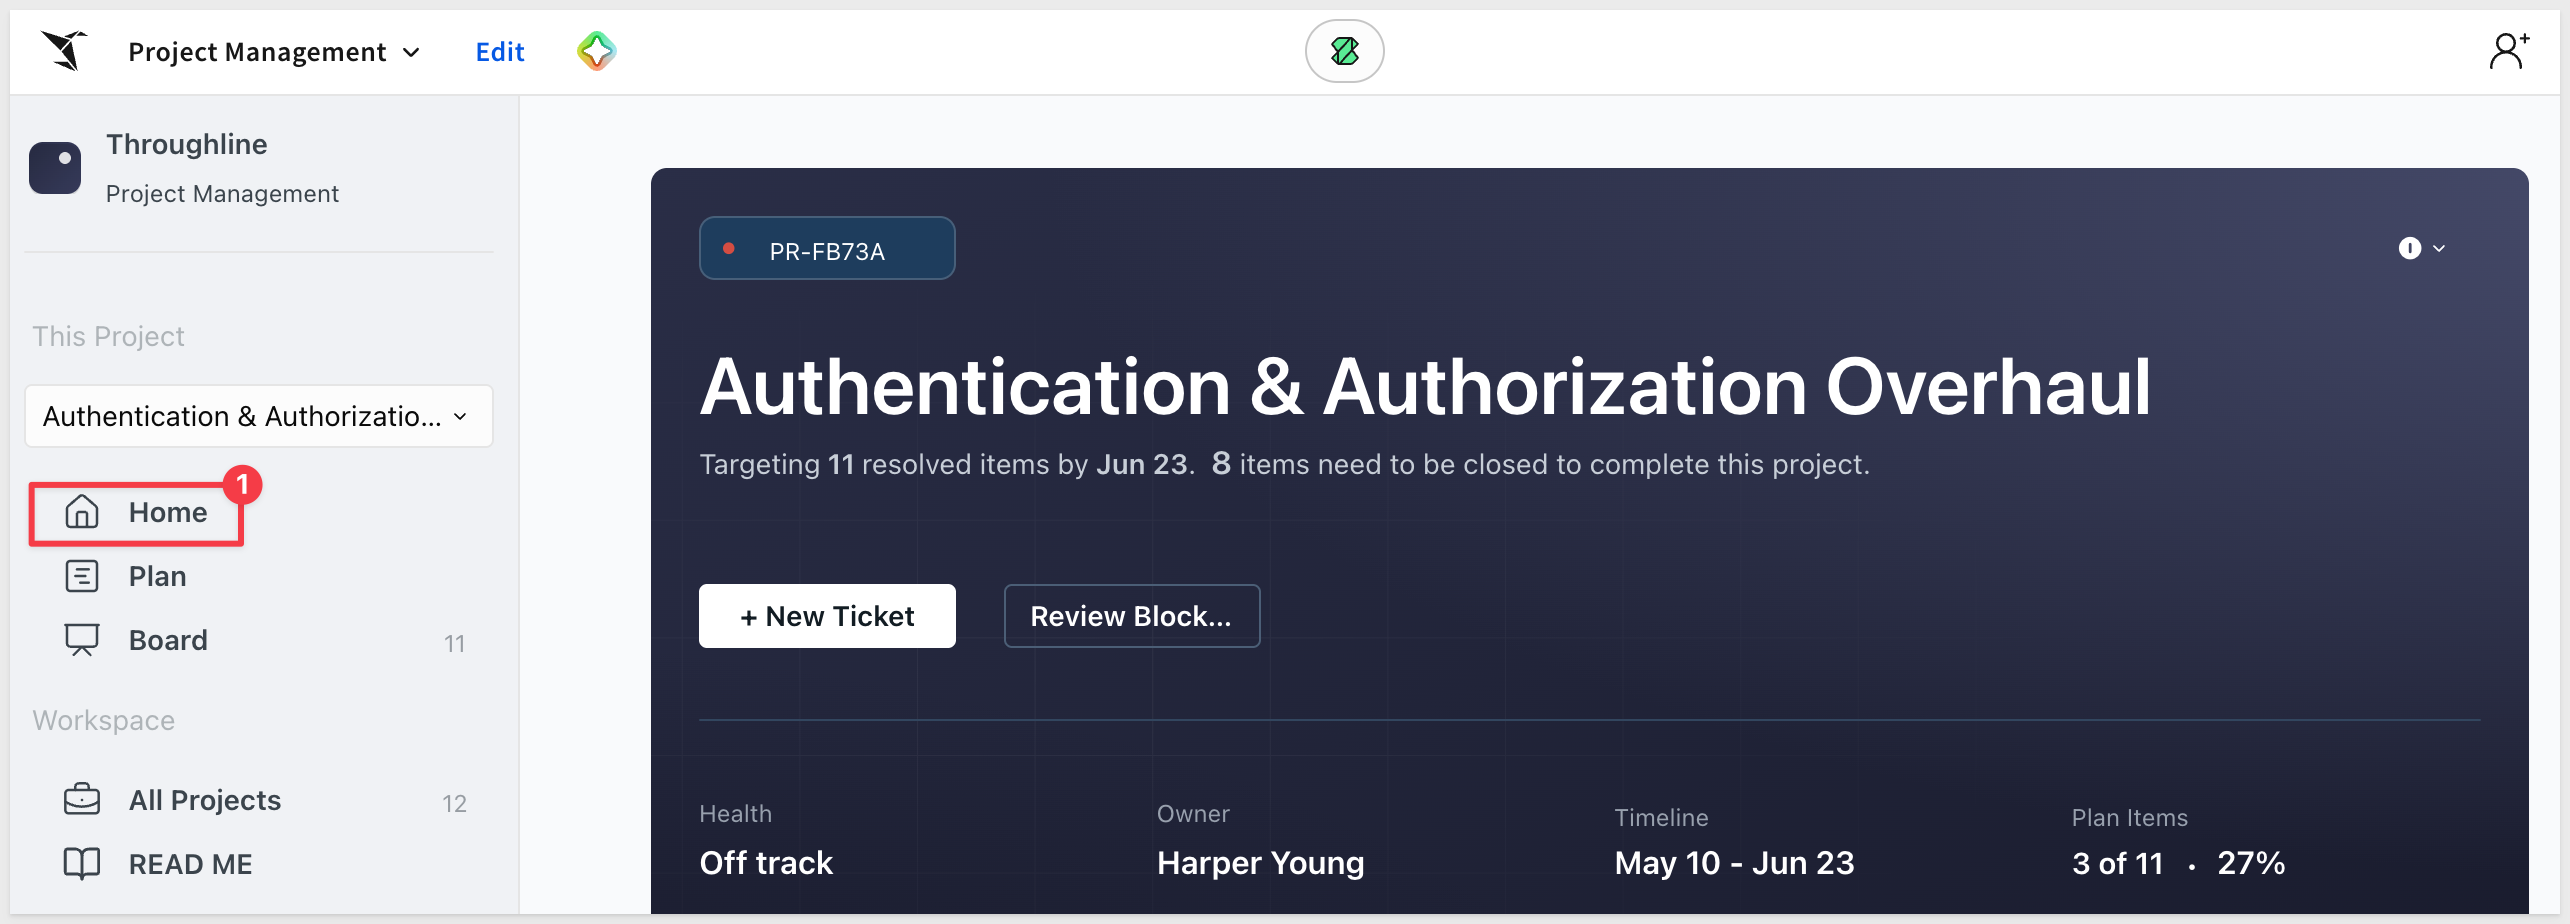
Below the hero, the page breaks into four areas:
- Milestone progress strip — each milestone shows its name, date range, and status. The strip reflects the full sequence of milestones for the selected project.
- AI Project Overview — a one-to-two sentence AI-generated summary of the project's current state, including health, active blockers, and urgent items. The prompt is driven by a
CallText()formula — covered in Under the Hood. - Ticket Workload — a per-team-member breakdown showing queued, active, and completed tickets for this project.
- Open Tickets table — a sortable list of all non-done tickets, sorted by due date. Click the comment bubble icon on any ticket to navigate to Ticket Details View.
Plan Page
The Plan page organizes the selected project's work by milestone. A summary bar at the top shows the total milestone count alongside how many are done and in-flight:
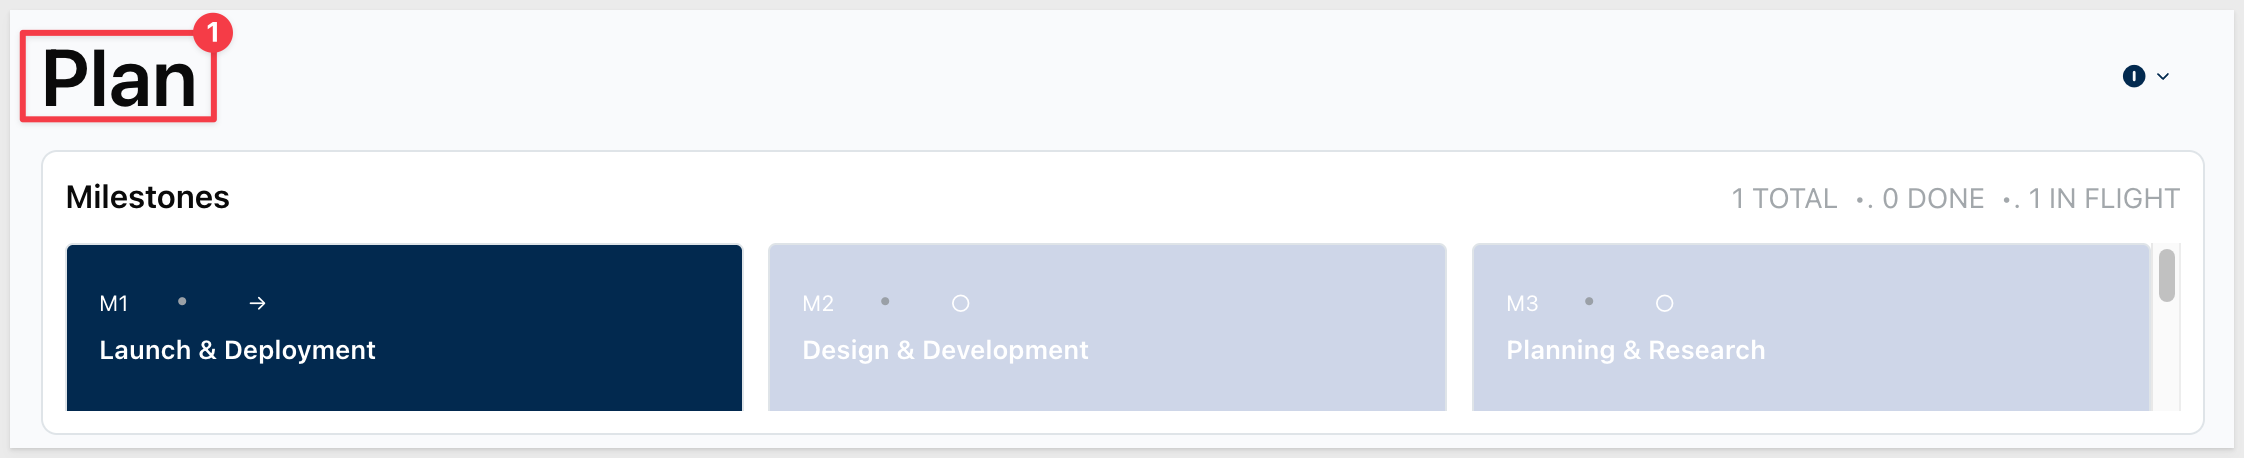
Select any milestone in the left panel to expand it. The detail table shows every plan item under that milestone with its assignee, priority, status, due date, and team. Rows where the status is TO DO or BLOCKER and the due date falls past the milestone end date are highlighted in red — an automatic signal that something is at risk of missing its window.
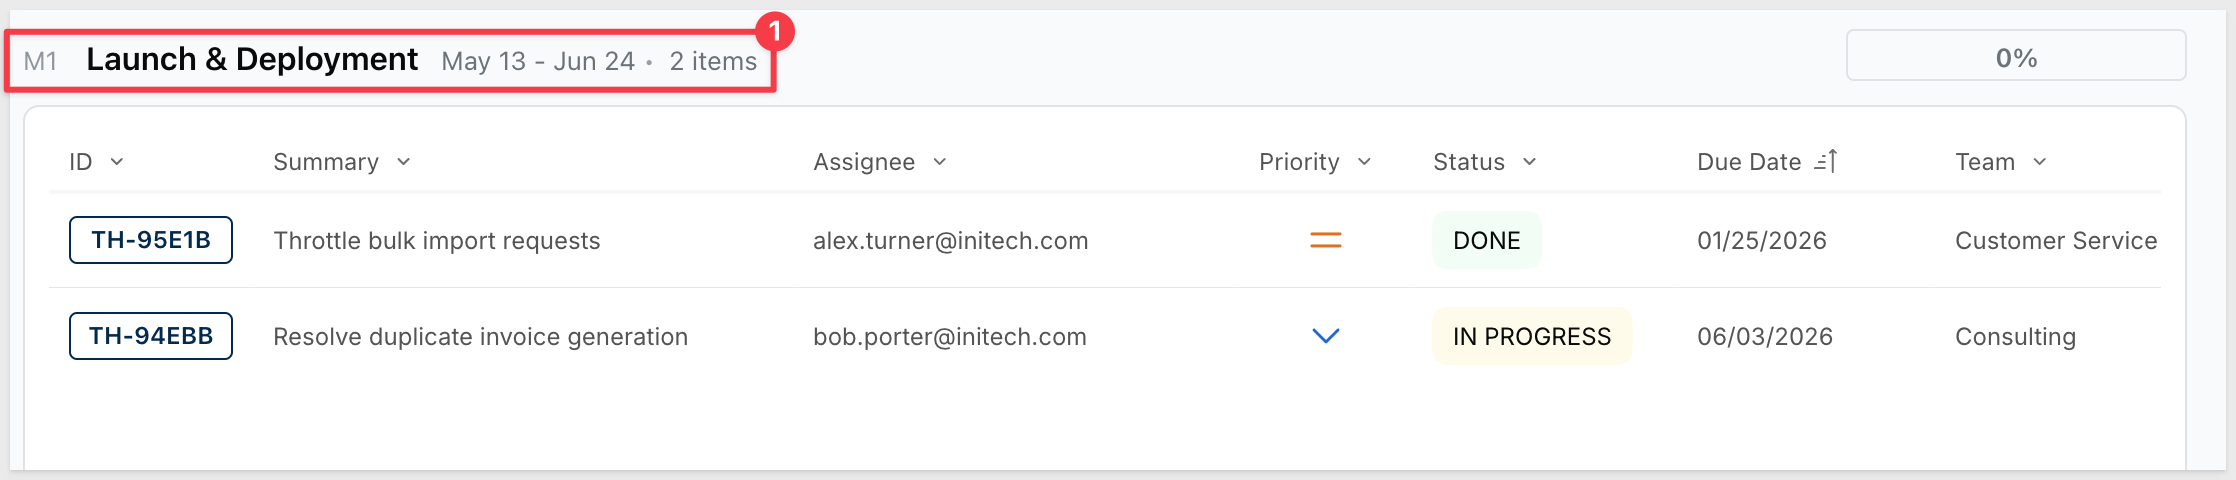
The completion percentage for each milestone is displayed inline and updates as tickets move to DONE on the Board.
Board Page
The Board page is the execution surface. It presents a Kanban view of all tickets in the selected project, organized into four columns:
- To Do — work not yet started
- In Progress — work actively being done
- Blocked — work that can't proceed
- Done — completed work
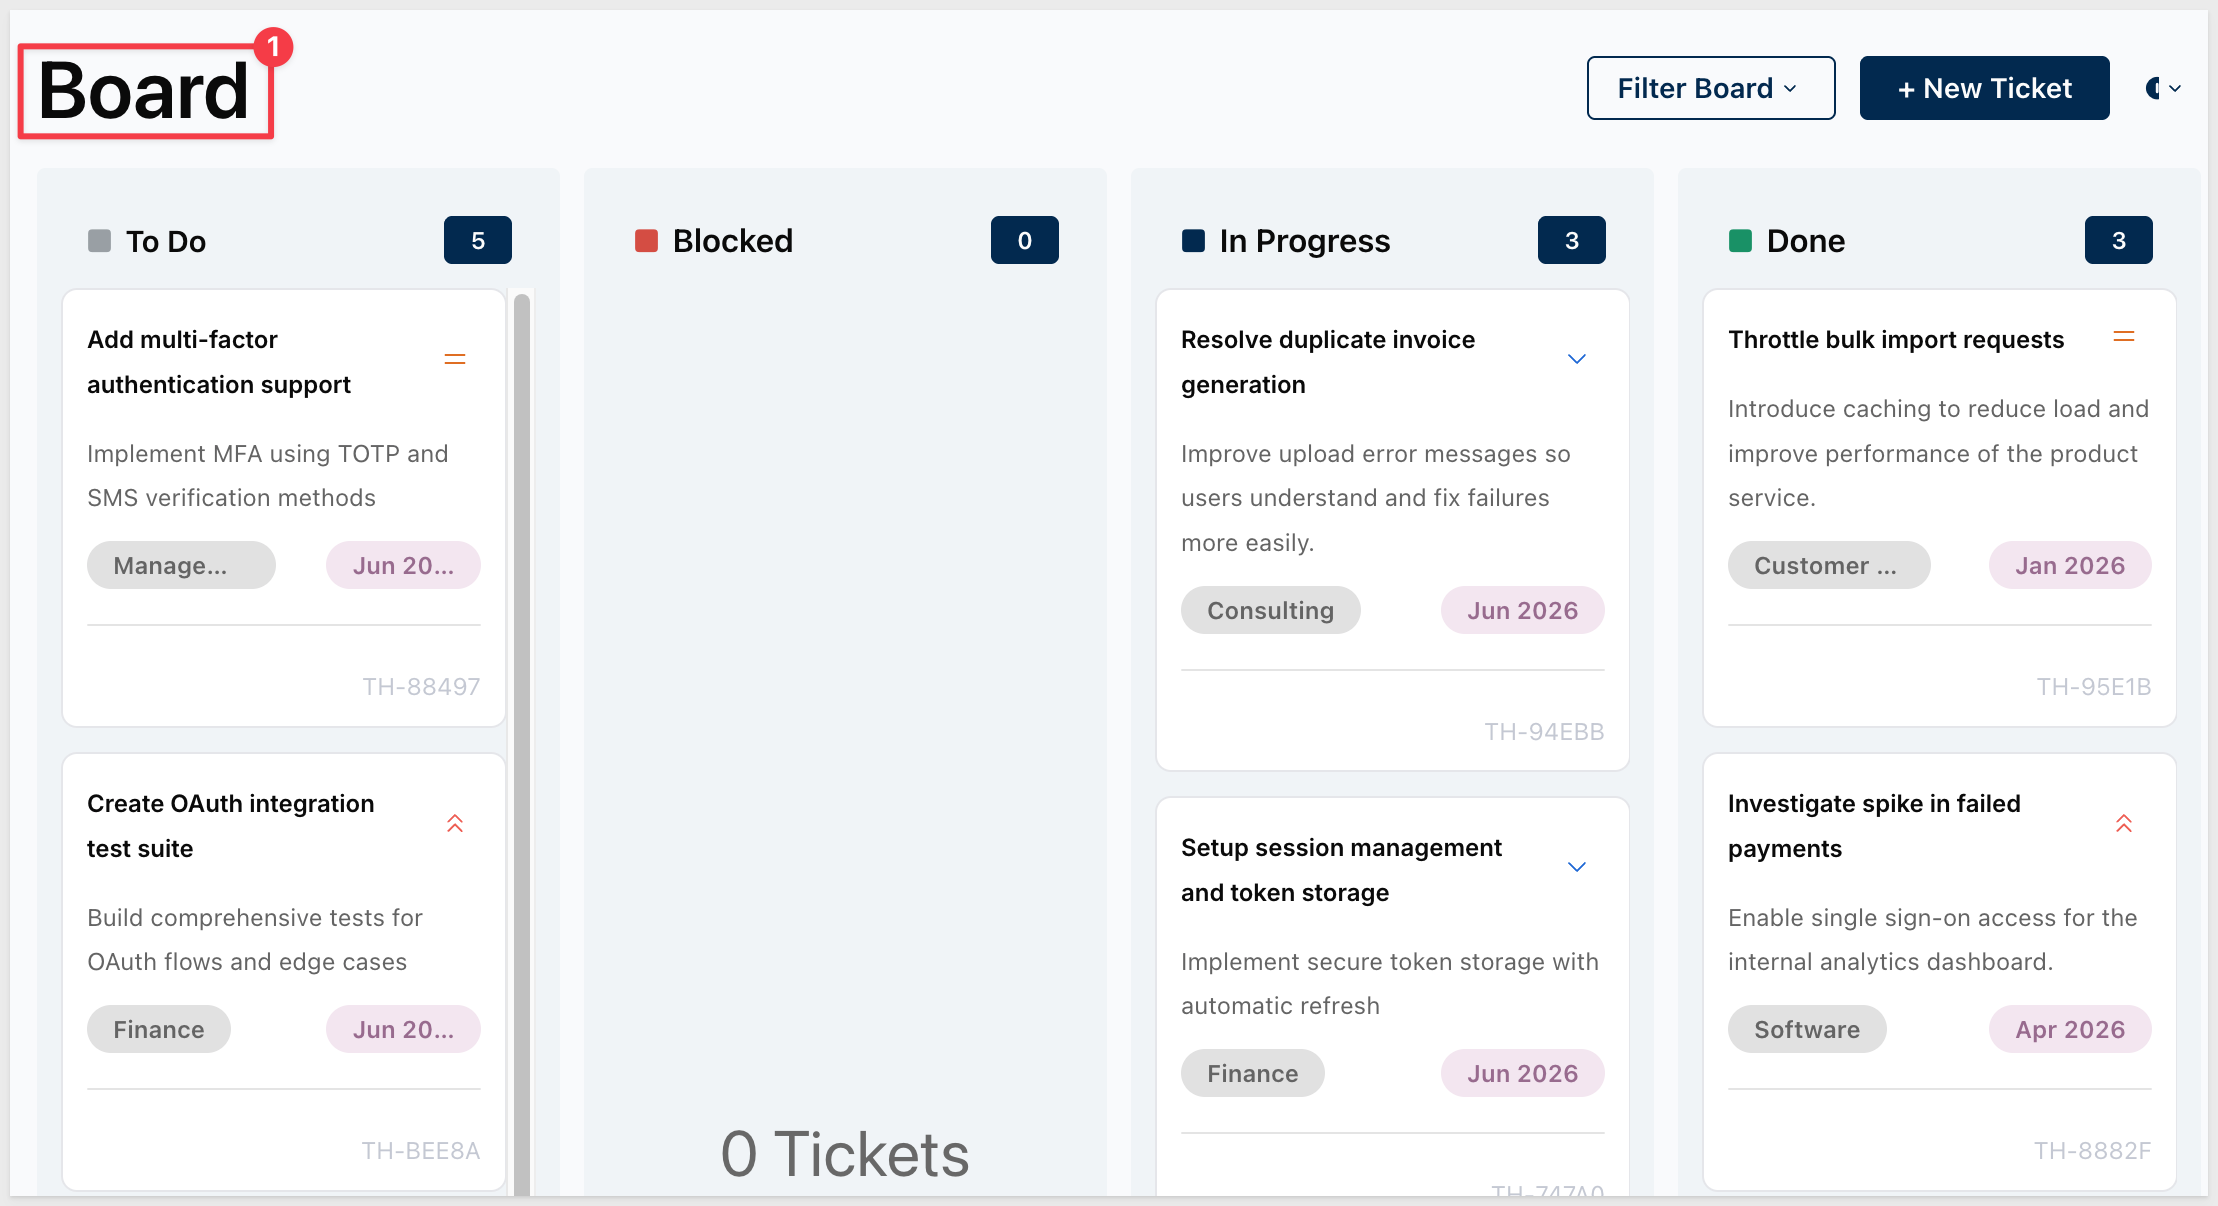
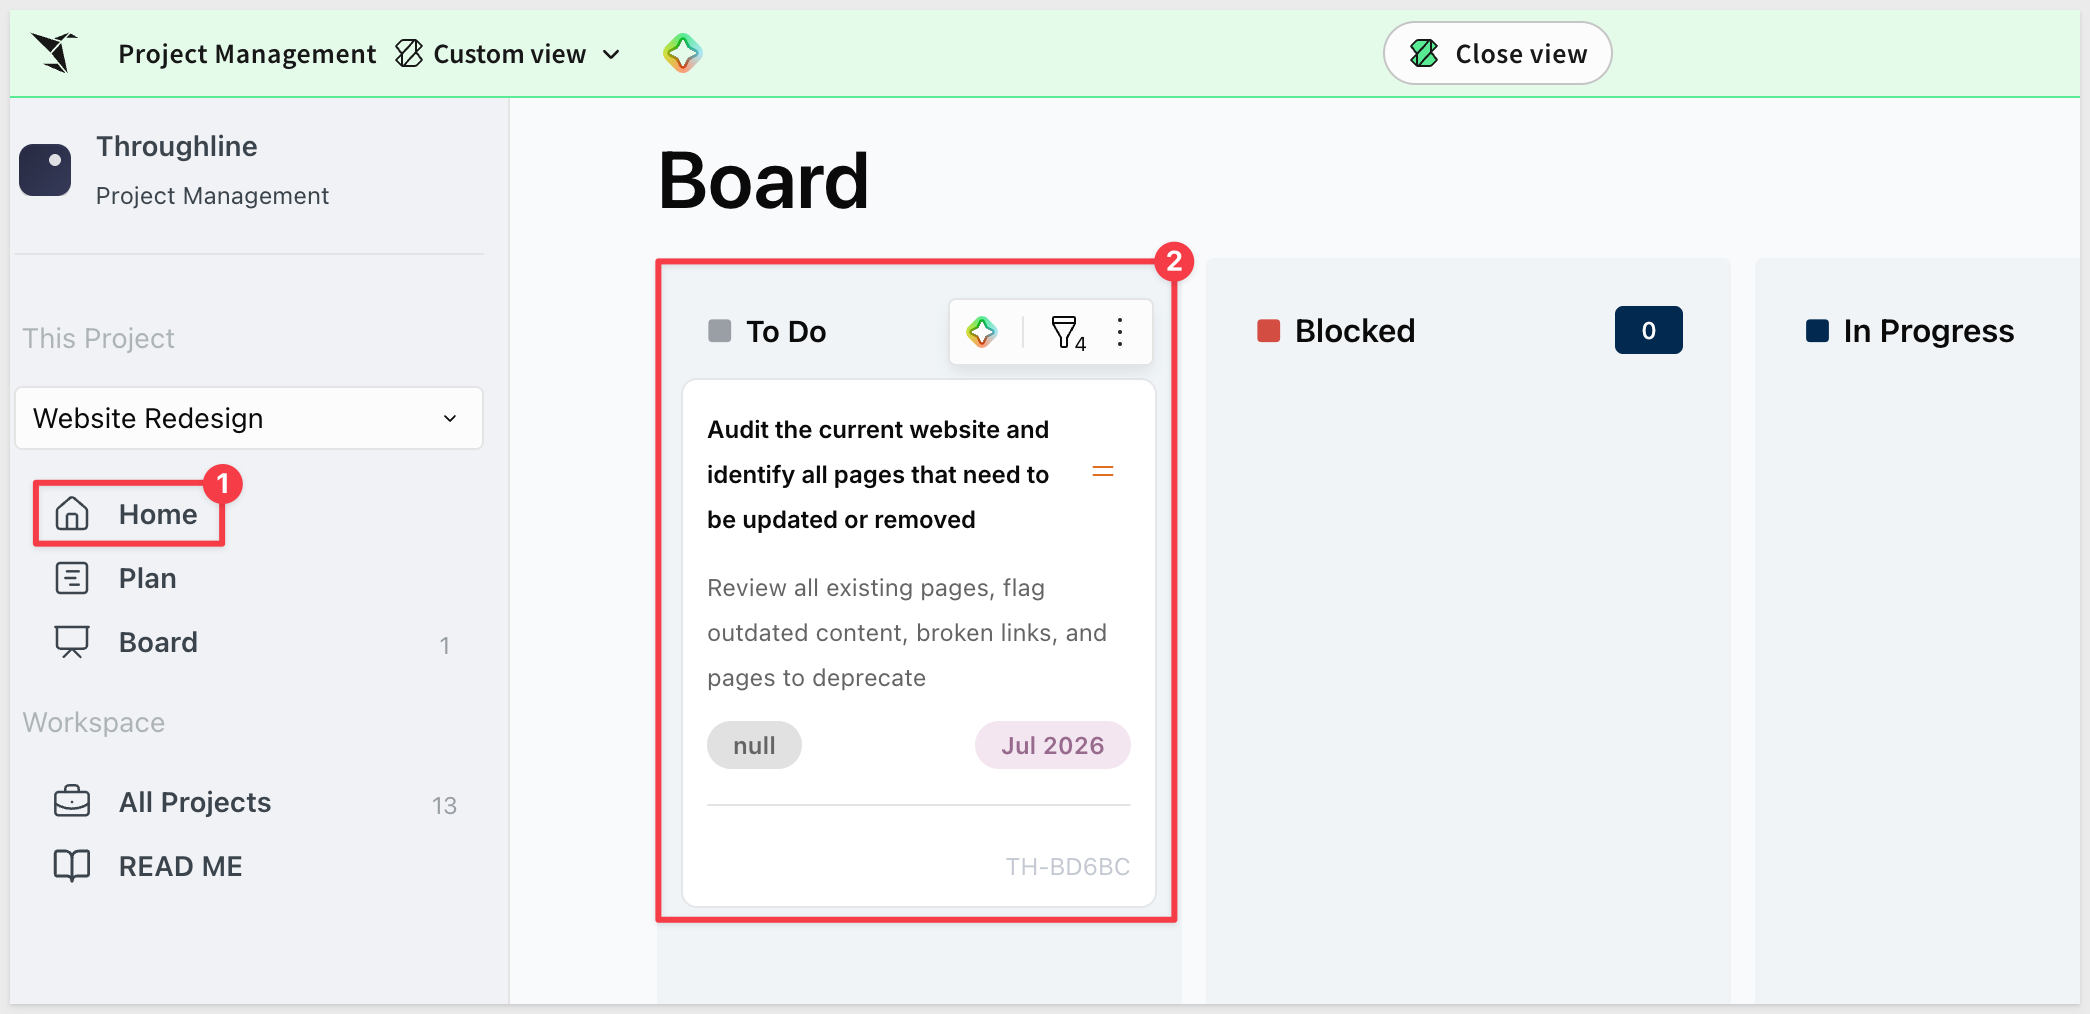
Each card shows the ticket summary, priority icon, description snippet, and abbreviated ticket ID. The Blocked column uses a distinct red header to make impediments visible at a glance.
Move work through statuses by editing the ticket's Status field — either directly on the Board or via the Ticket Details View.
All Projects Page
The All Projects page provides a portfolio view across every active project in the app:
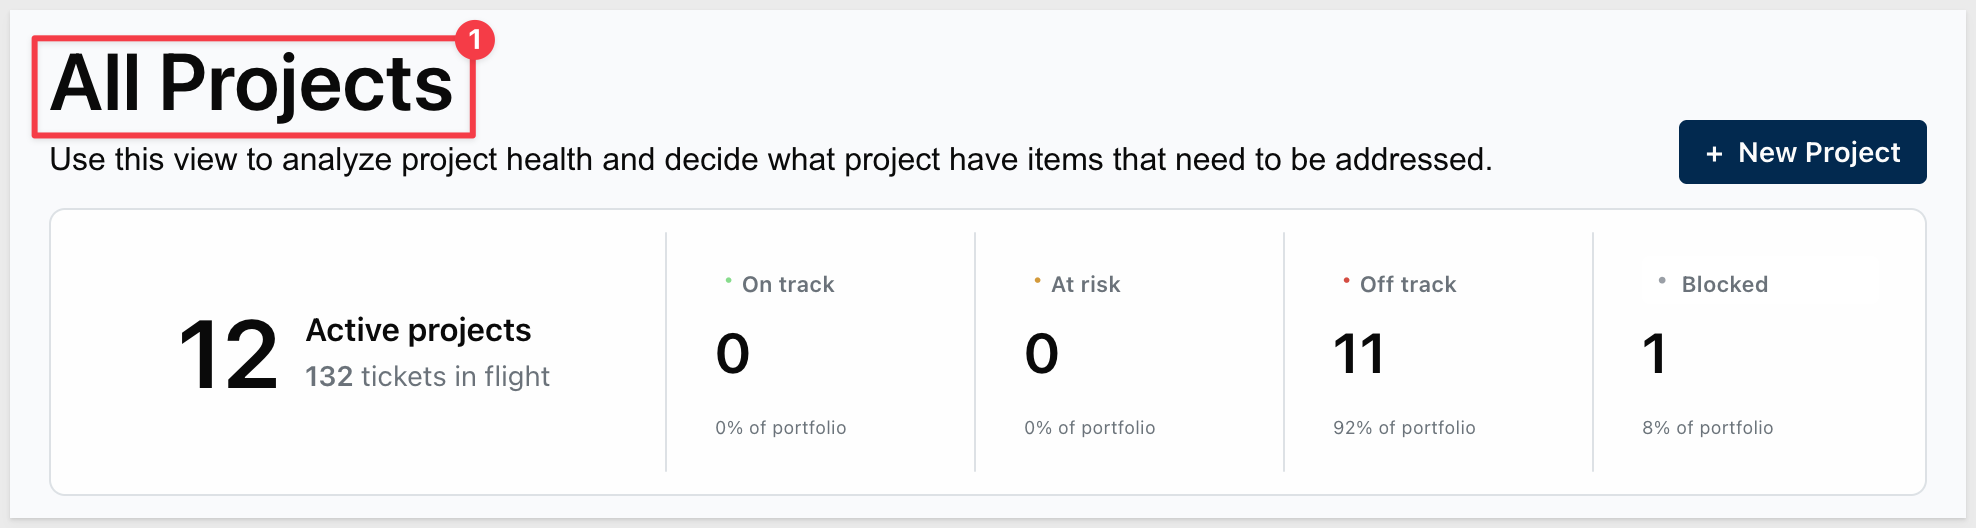
Four summary tiles at the top show portfolio counts by health status: On track, At risk, Off track, and Blocked. A segmented filter below the tiles lets you scope the project cards to a single health category instantly.
Each project card shows:
- Project ID, name, and owner
- Health icon (color-coded to status)
- Days, weeks, or months remaining until the end date
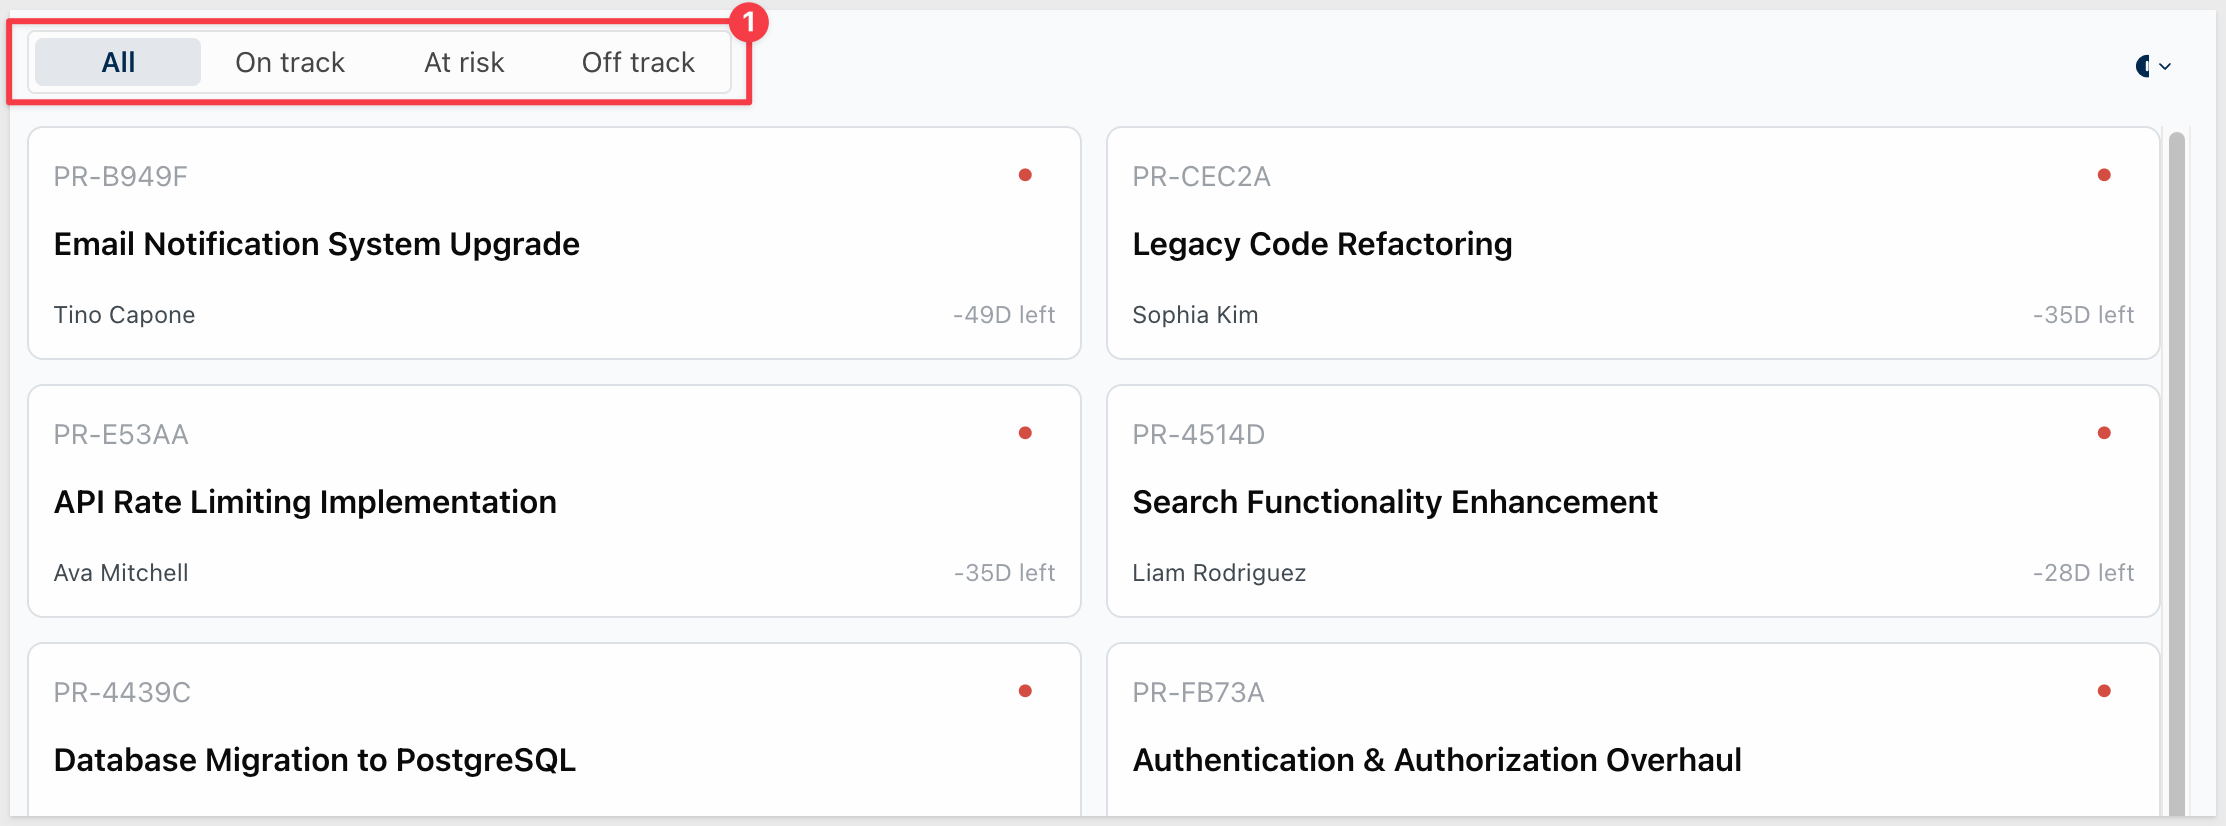
Use this page for cross-project prioritization, leadership reporting, and identifying which projects need immediate attention.
The app uses a three-tier hierarchy: Projects → Milestones → Tickets. Changes at any layer flow through to every page in real time.
Step 1: Create a Project
Navigate to the All Projects page from the sidebar. Click + New Project in the upper right. A modal opens with two fields:
- Project Name — the name that appears across Home, Plan, Board, and the portfolio view
- Timeline — the project's start and end date range
Enter the following values:
Project Name:
Website Redesign
Set the Timeline to a two-month window starting today.
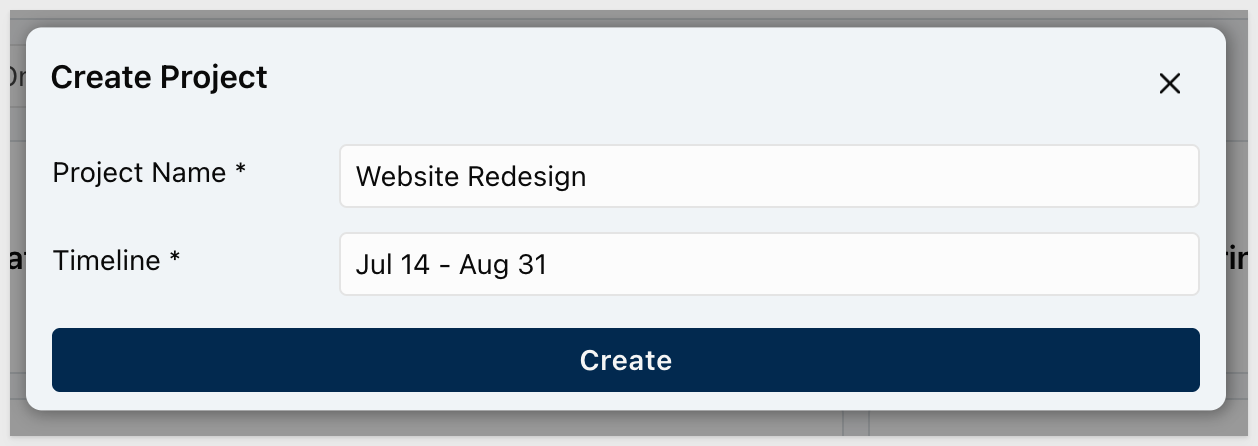
Click Create. The new project card appears in the portfolio.
Click its card to open the project's Home page:
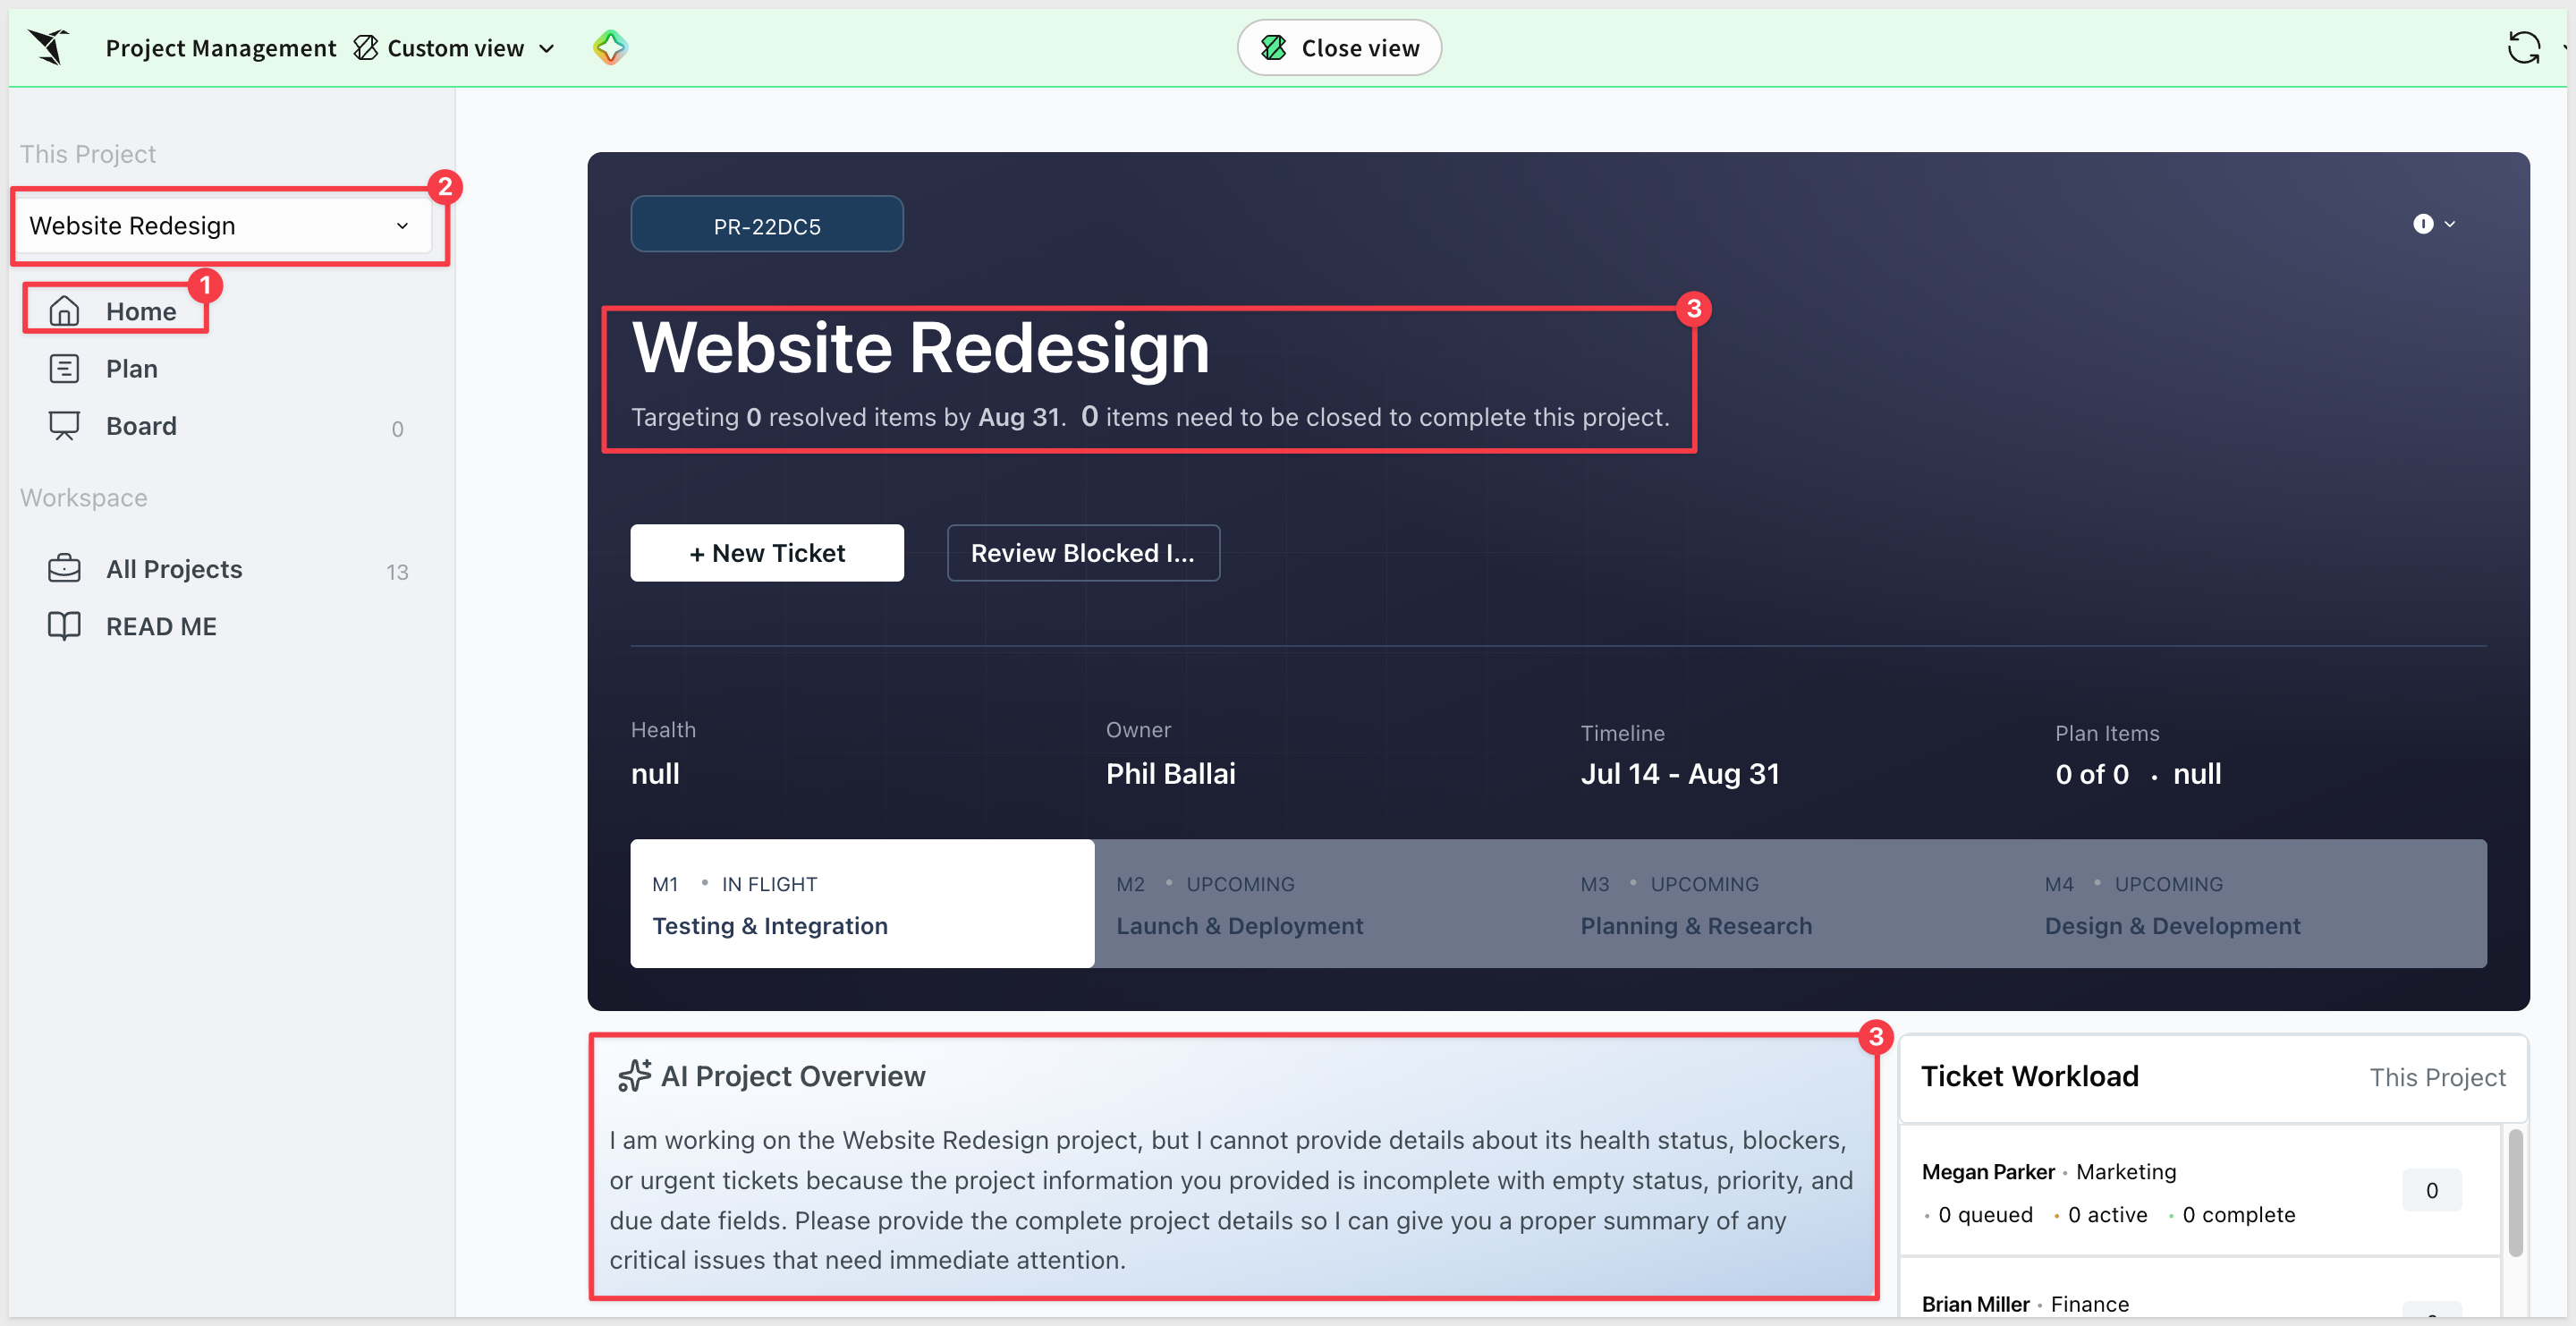
The hero shows the project name, ID, owner, and a + New Ticket button. Because no milestones or tickets exist yet, the milestone strip, Plan Items count, and AI Overview all show empty state — that's expected.
Step 2: Add Plan Items (Tickets)
On the project's Home page, click + New Ticket in the hero. A three-step modal opens:
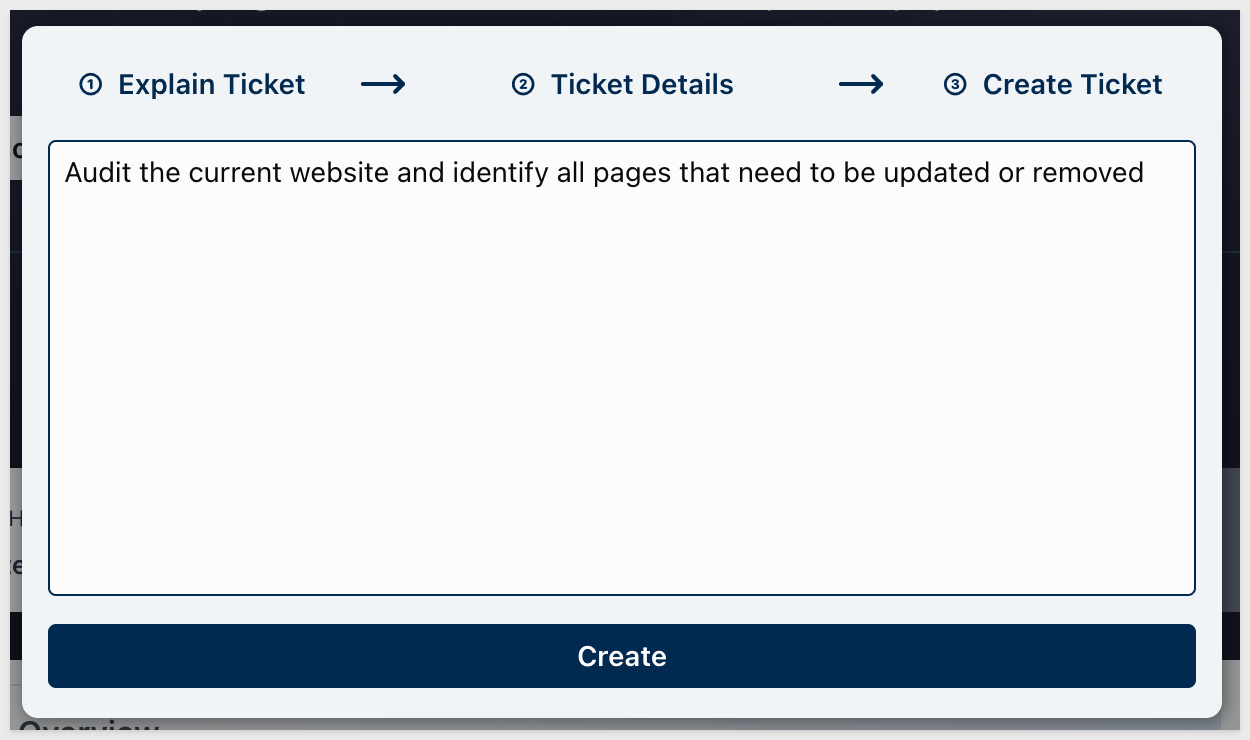
Step 1 — Explain Ticket: Describe the ticket in one sentence. The AI uses this description to search for similar existing tickets before creating anything:
Audit the current website and identify all pages that need to be updated or removed
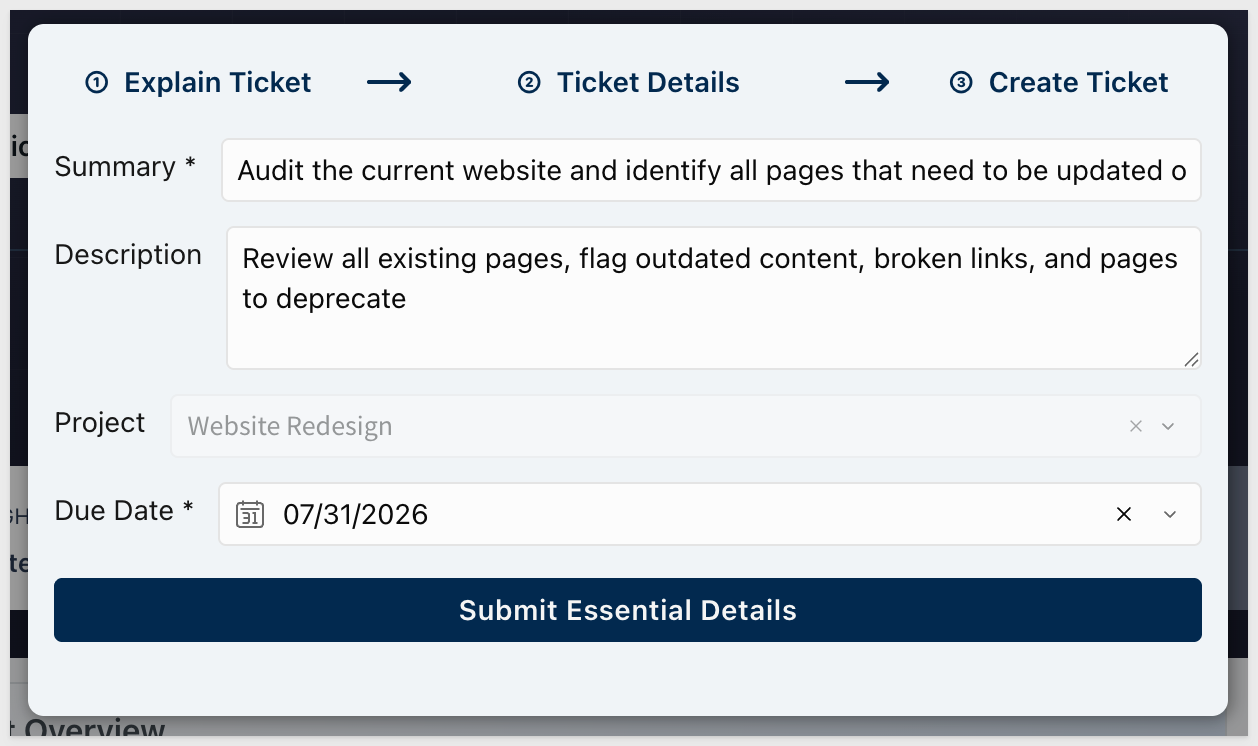
Step 2 — Ticket Details: The modal shows any existing tickets that match your description. If something similar already exists, select it from the dropdown and click Go to Ticket. If there's no match — or this is genuinely new work — click Create New Ticket. The step then shows the essential details form with Summary pre-filled from your description. Add a description and set the due date:
Description:
Review all existing pages, flag outdated content, broken links, and pages to deprecate
Set Due Date to one week from today. Click Submit Essential Details to advance:
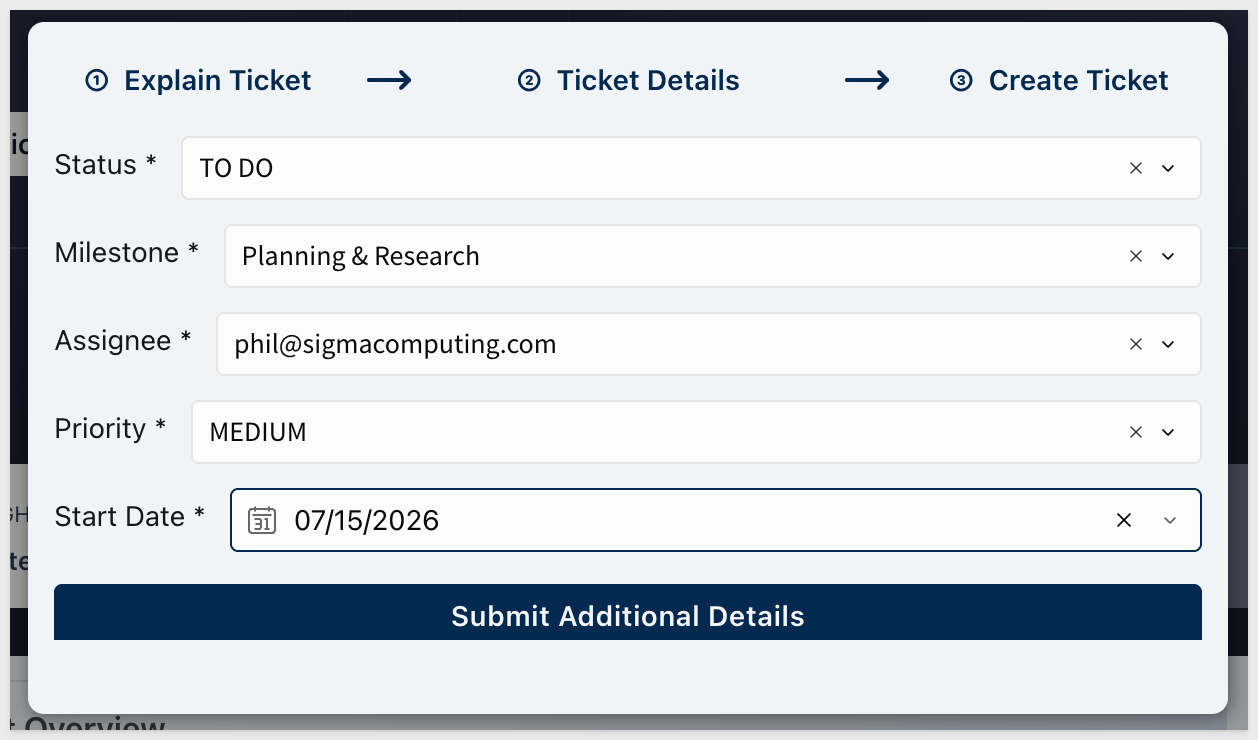
Step 3 — Create Ticket: Fill in the remaining fields. Status defaults to TO DO, Assignee defaults to the logged-in user, and Priority defaults to MEDIUM — adjust as needed. Select the Planning & Research milestone:
Click Submit Additional Details to write the ticket to the input table:
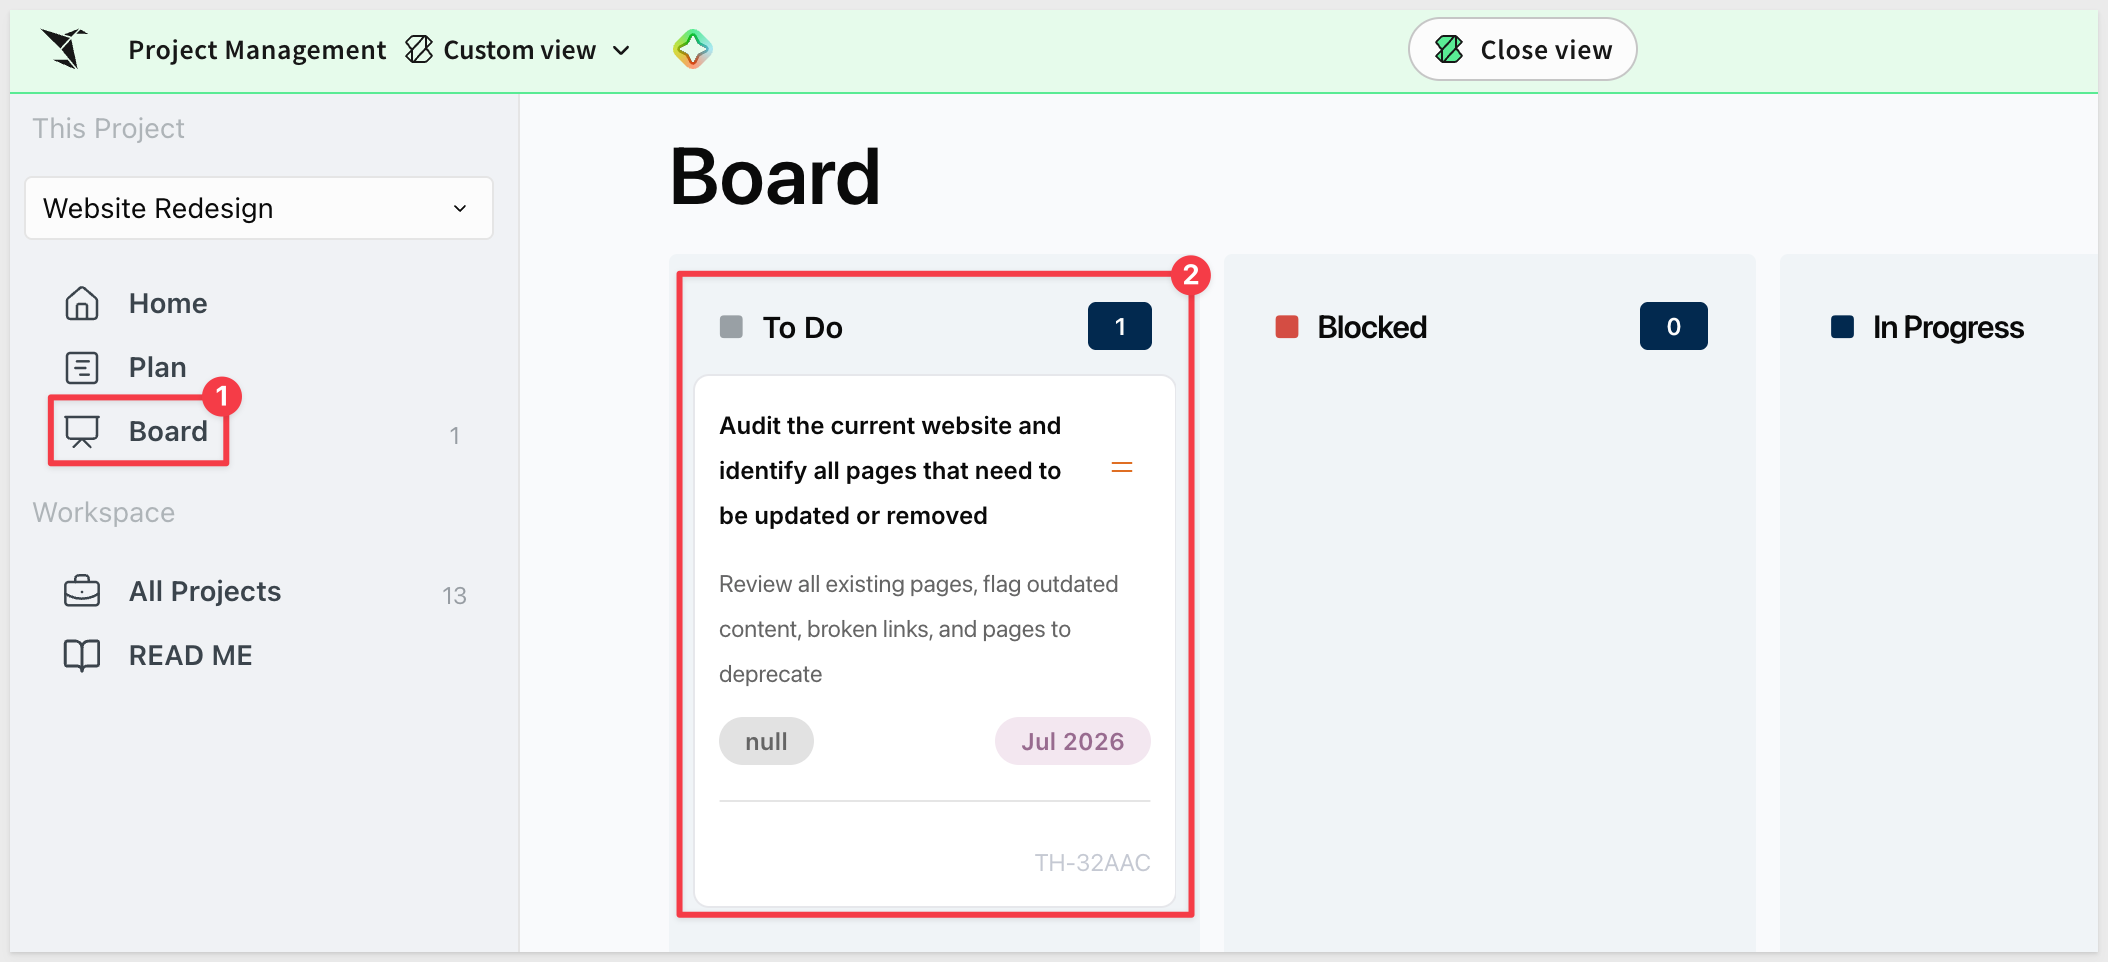
The ticket appears immediately on the Board and in the Plan page under its assigned milestone:
Step 3: Execute on the Board
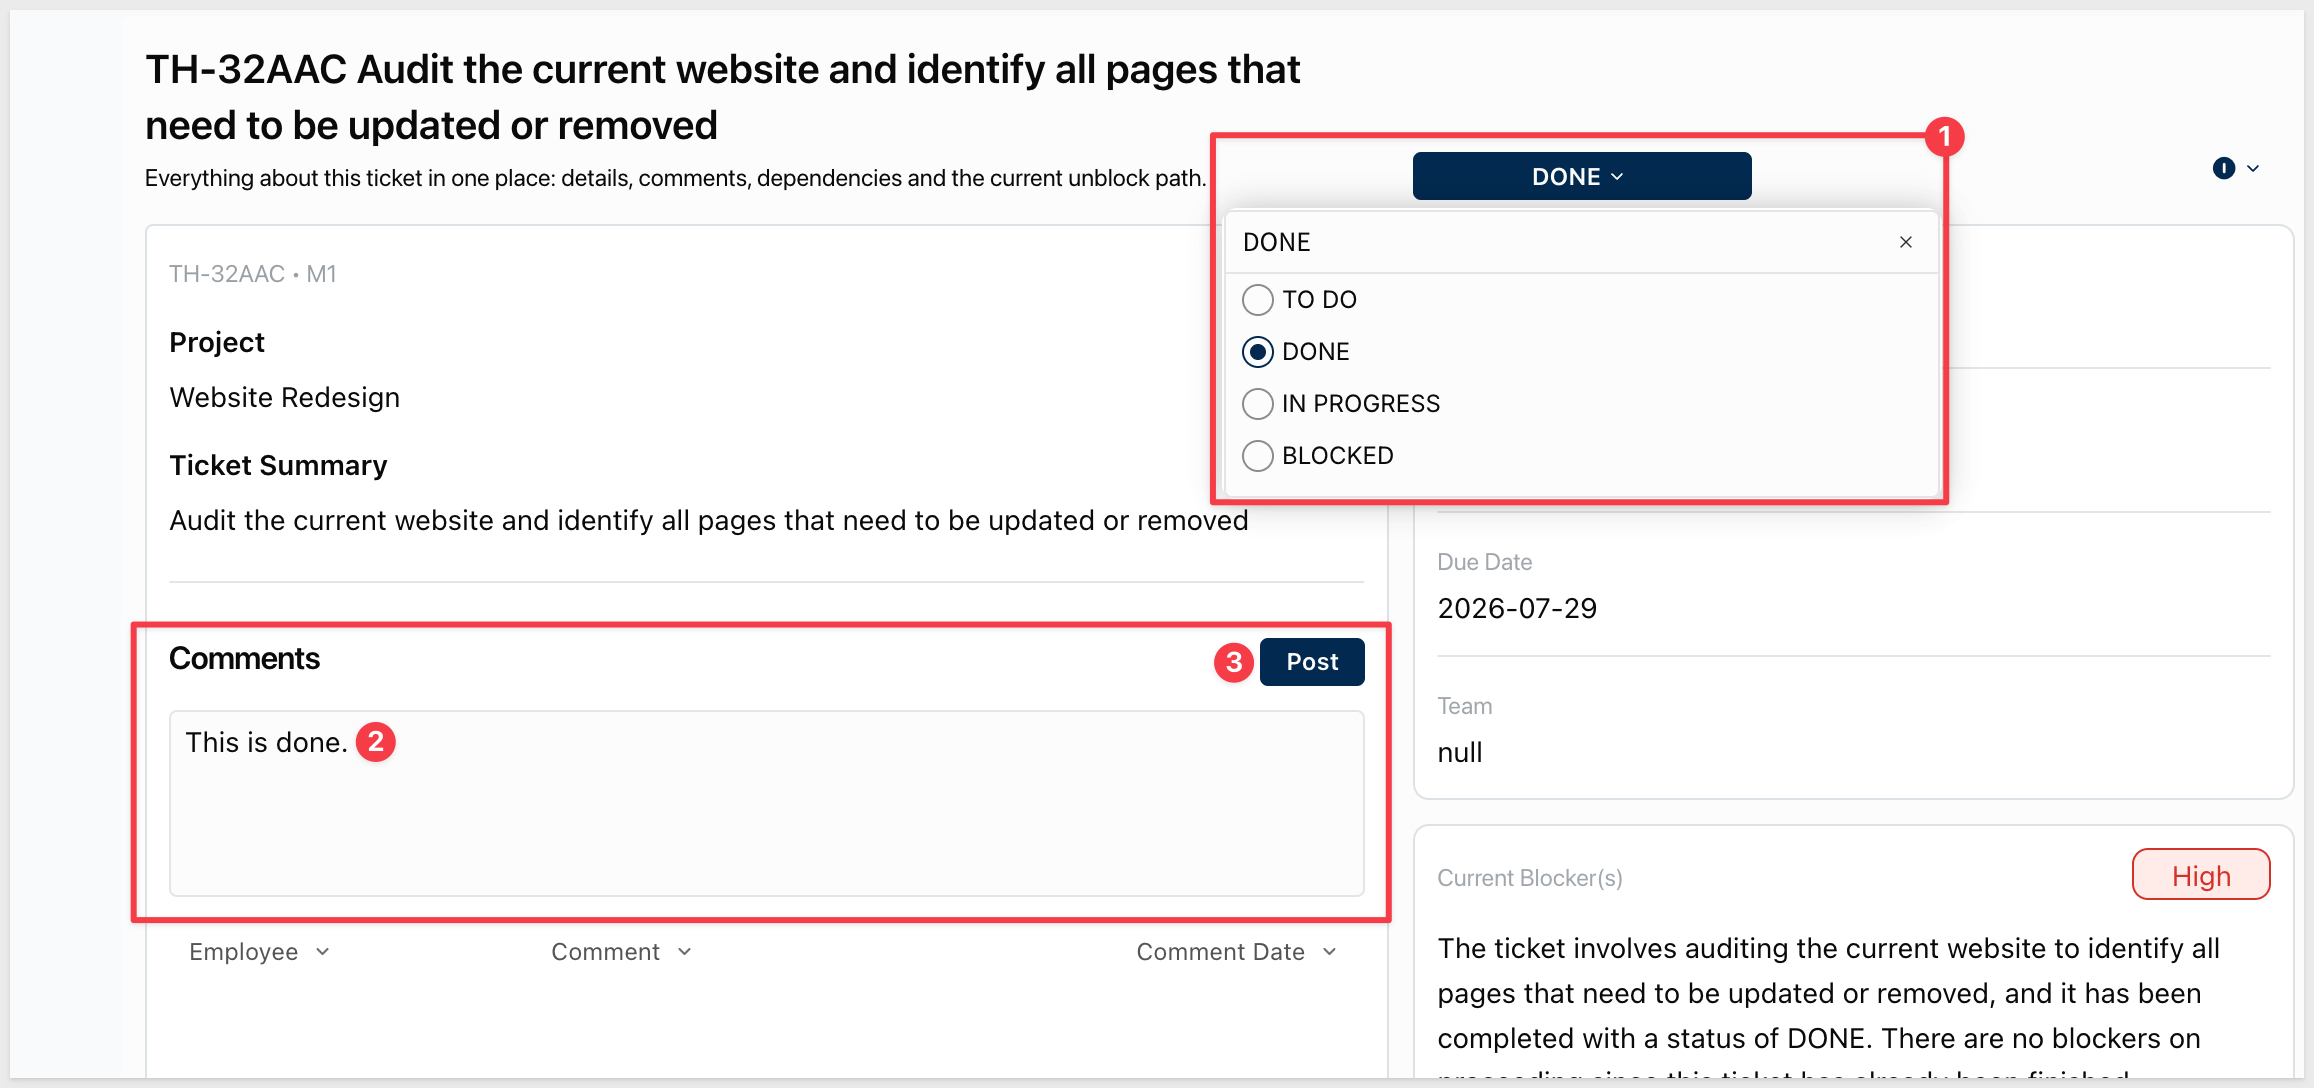
On the Board page, as work progresses, move tickets through statuses — or click the comment bubble on a ticket in the Open Tickets table on Home to open Ticket Details View, where you can update status, log comments, and get an AI-generated blocker analysis.
Click into the one TO DO and see the details and change its status to Done, add a comment and click Post:
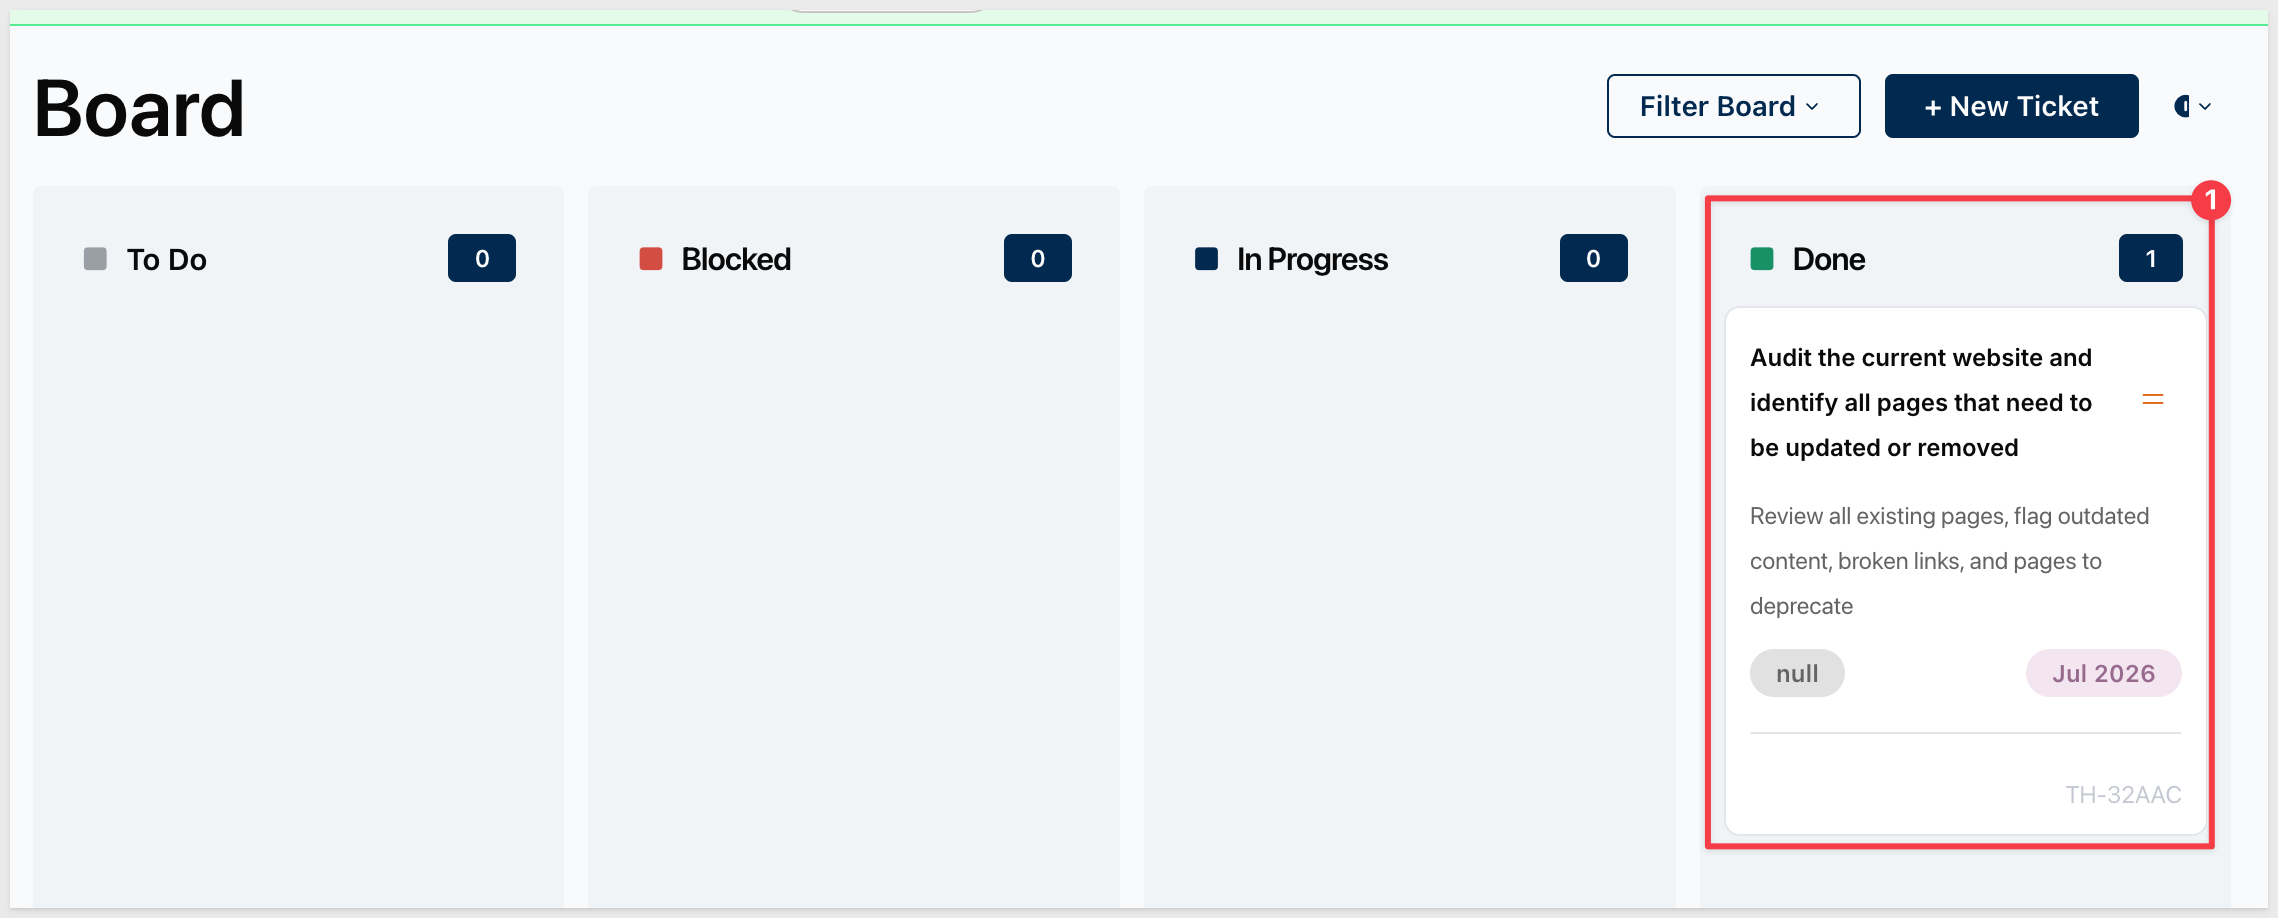
The Board, Home, and Plan pages all reflect status changes in real time. Milestone completion percentages update as tickets move to DONE.
The change is reflected on the Board page:
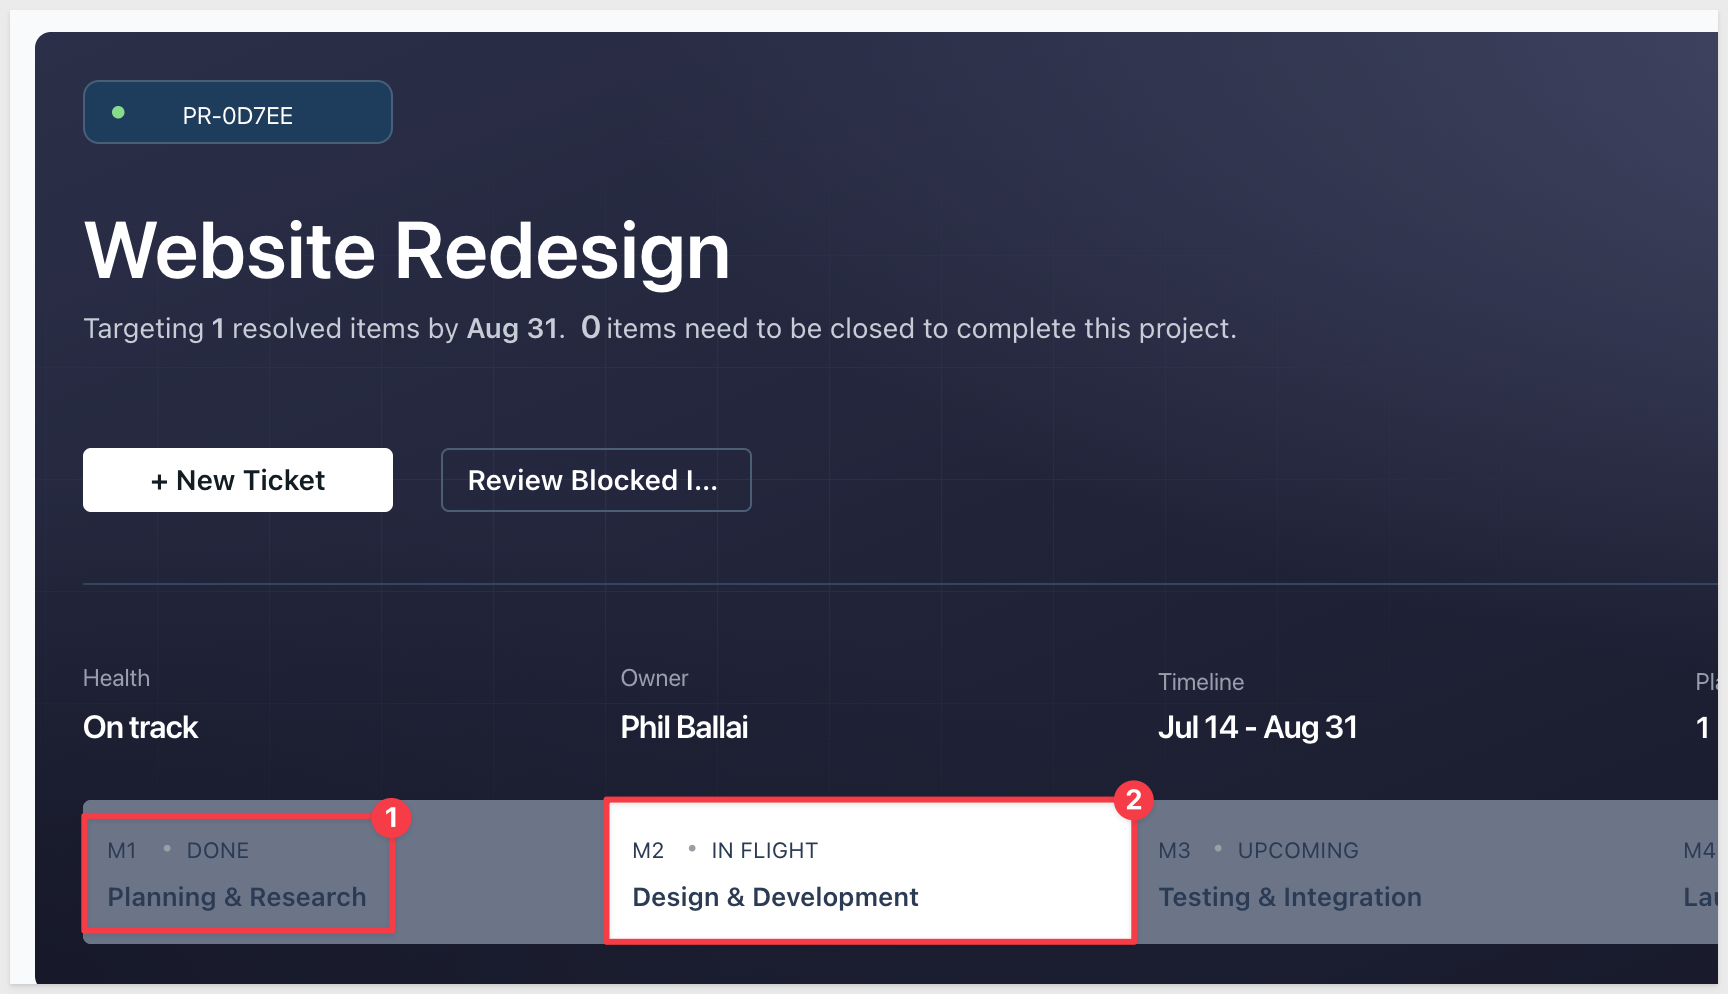
Step 4: Check Project Health on Home
Return to Home and see that the project is now DONE with Planning & Research and is in Design & Development:
The Project Management app includes two AI features, both powered by CallText() formulas embedded directly in workbook elements. Neither requires a separate AI agent or chat interface — the AI runs as part of the page layout.
AI Project Overview
On the Home page, the AI Project Overview panel generates a one-to-two sentence summary of the selected project's current state:
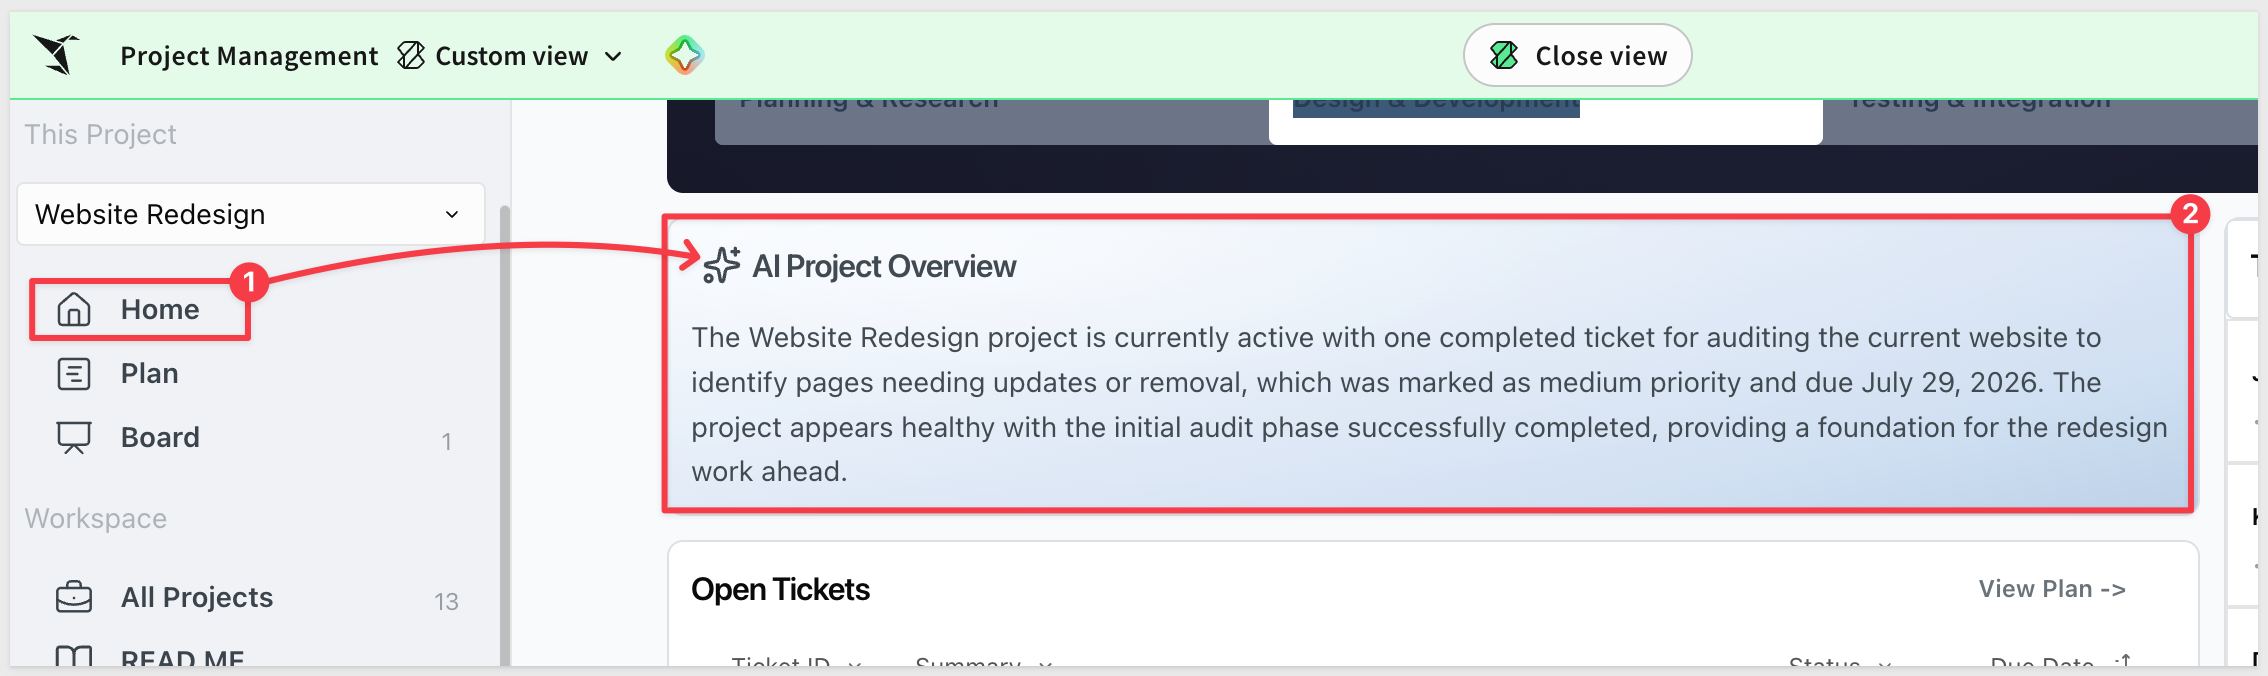
The summary includes:
- Project name and current health status
- Any tickets with blockers or urgent priority
- Overall progress signal
The formula behind it aggregates ticket data — summaries, statuses, priorities, and due dates — and passes them to the model in a single CallText() call. It re-evaluates automatically when the project selection changes.
AI Blocker Analysis
On the Ticket Details View page, selecting a blocked ticket triggers an AI-generated analysis of the blocker:
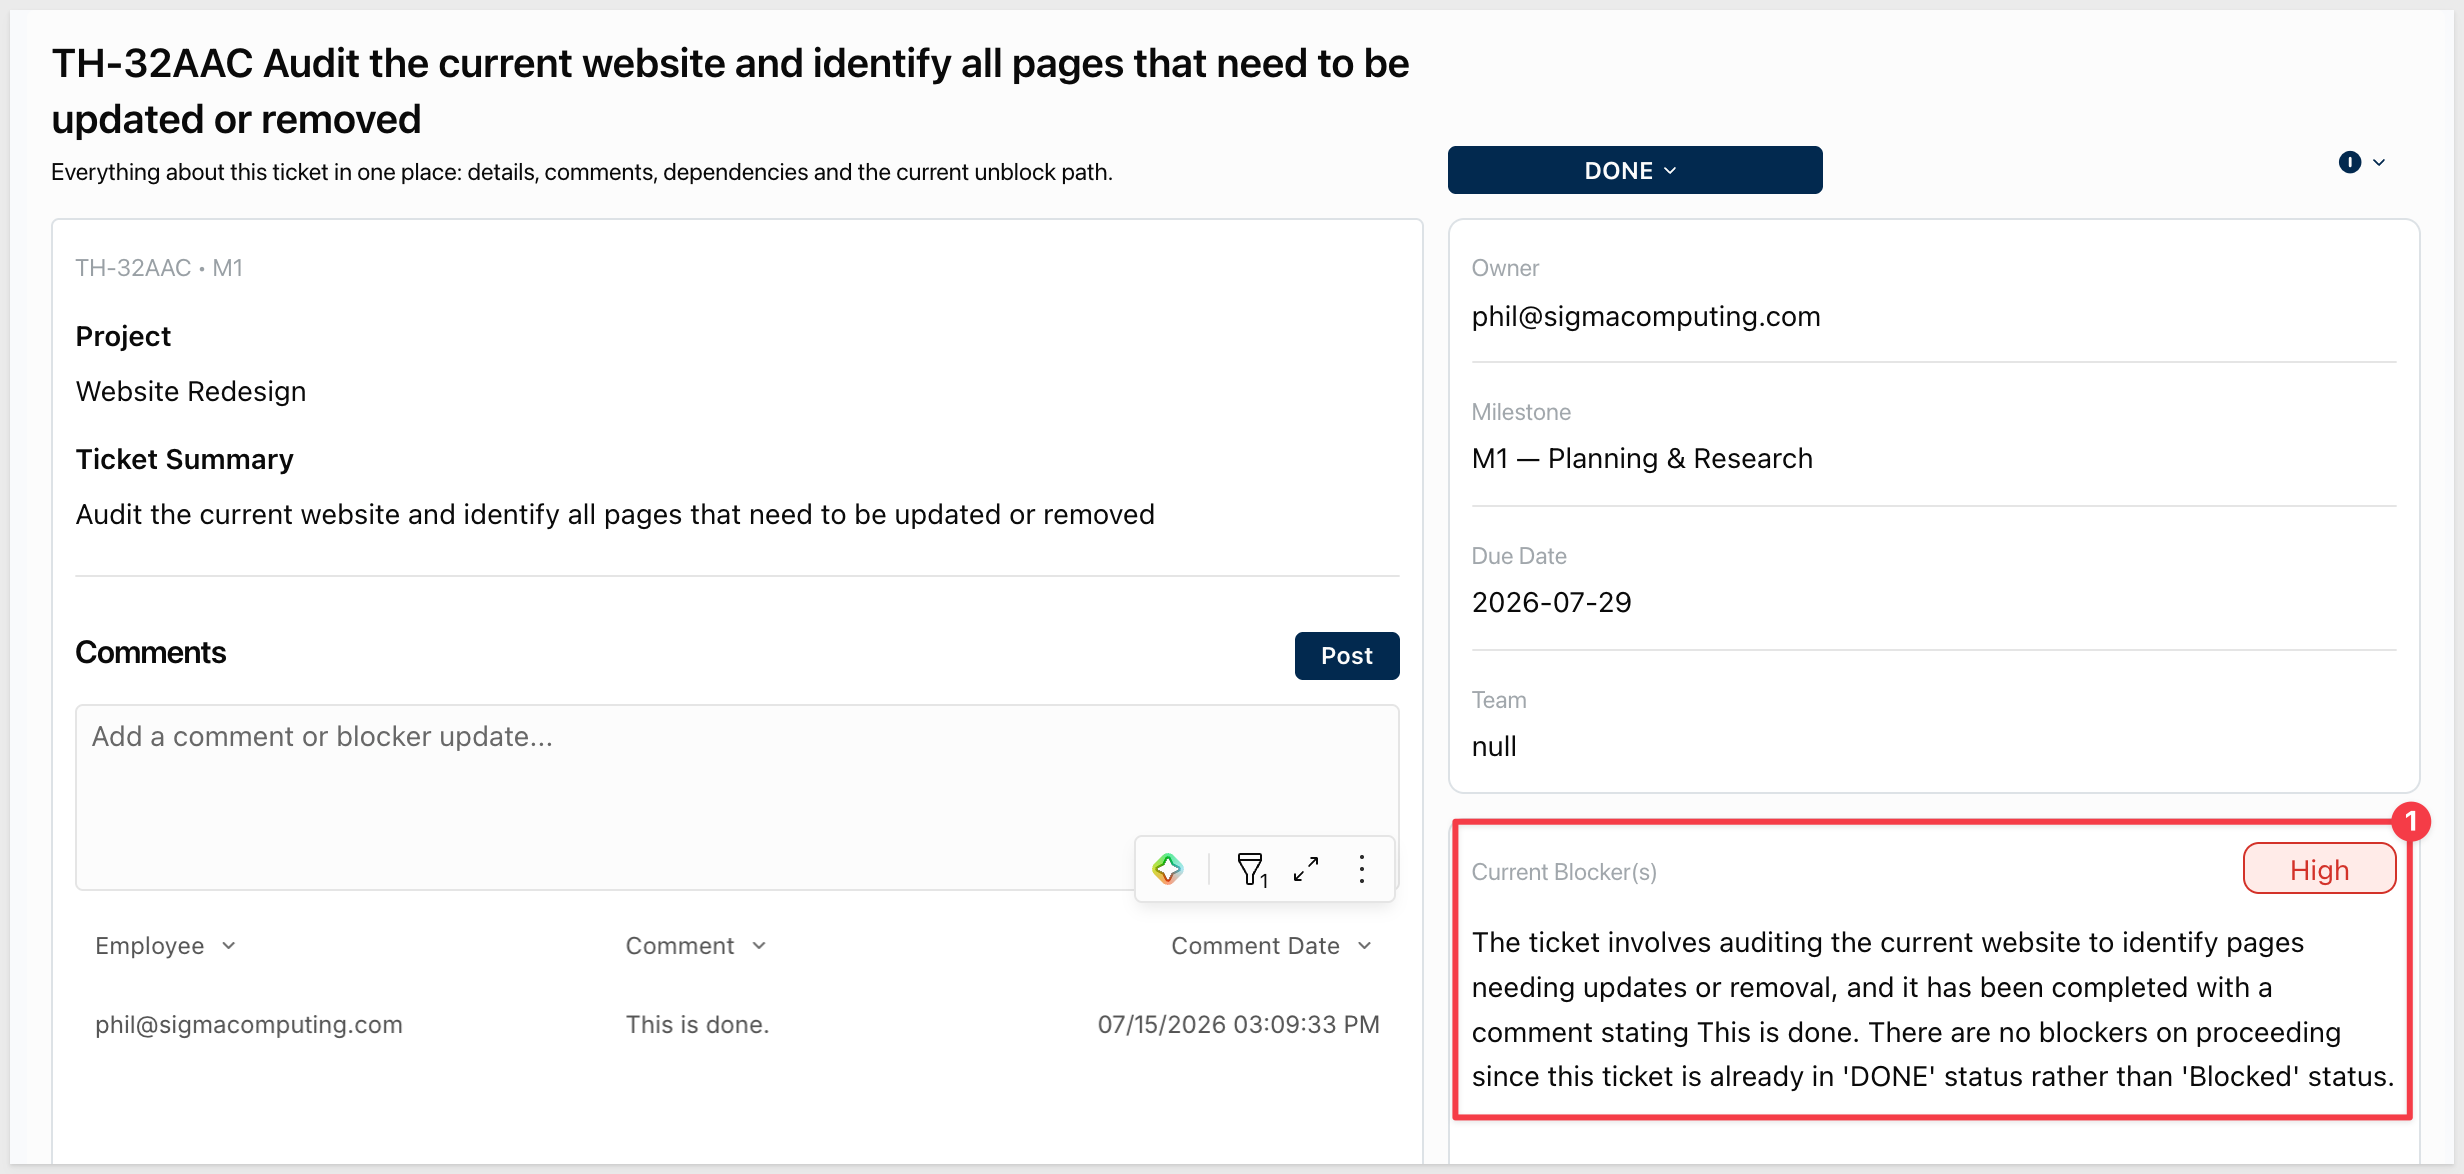
The analysis draws on the ticket's summary, status, priority, due date, and any comments logged against it. It generates a concise, actionable read on the severity and likely resolution path — marked High severity in red when the ticket is in BLOCKED status.
Both summaries update dynamically as the underlying data changes. No manual refresh is needed.
WHY IT MATTERS:
These AI features work within Sigma's existing permissions model — they can only access the data the user can already see, and they generate output on-demand rather than storing it. That keeps AI insight tightly coupled to live project state, which is exactly what operational tracking requires.
Place the workbook in Edit mode.
The Data page contains every backend table that powers the app. It's accessible to anyone with edit access and is self-documenting — each input table is labeled with a description of what it does:
Here's how the pieces fit together.
The Three-Tier Input Table Model
All data in this app lives in input tables — there is no external warehouse data source to query. The hierarchy is:
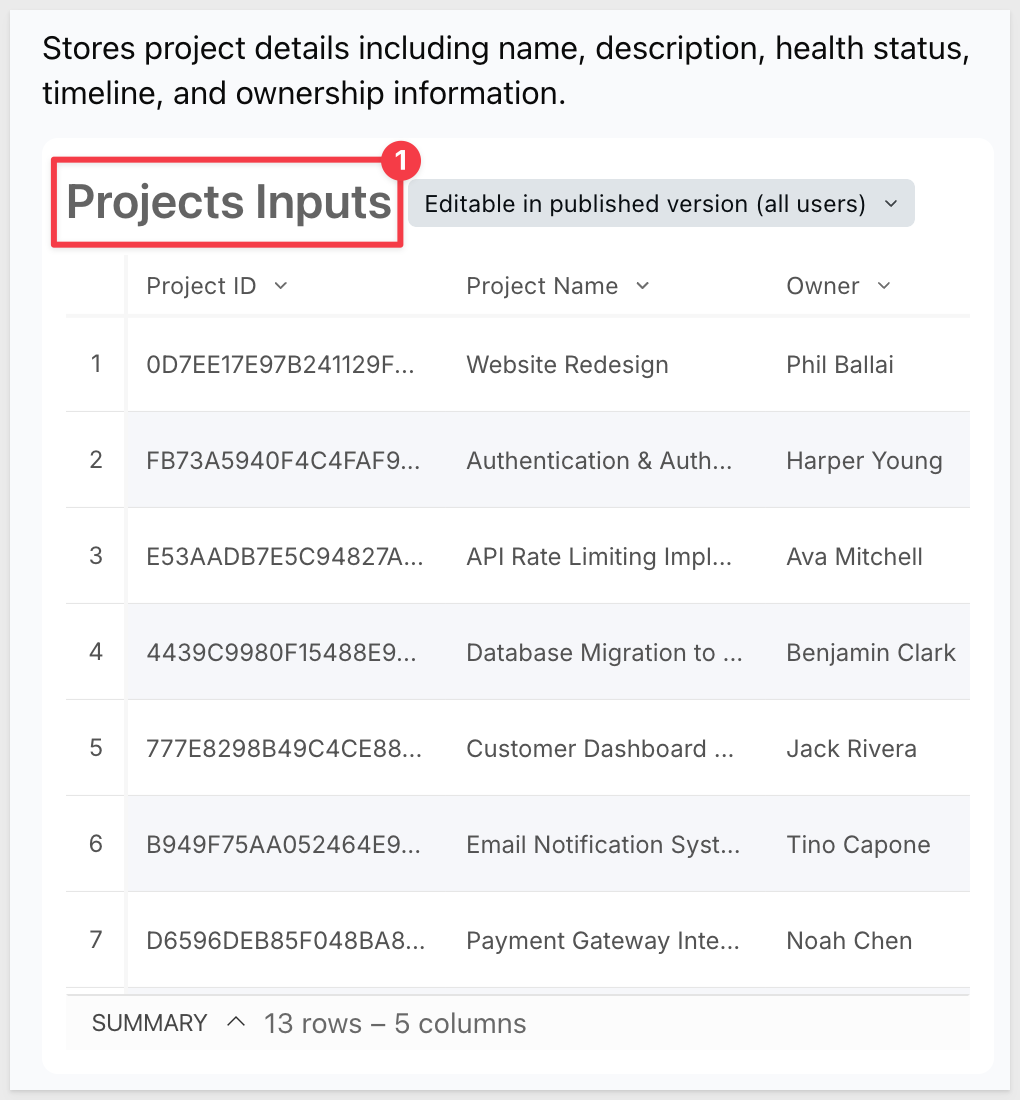
Projects Inputs → stores one row per project with name, owner, goal, and dates.
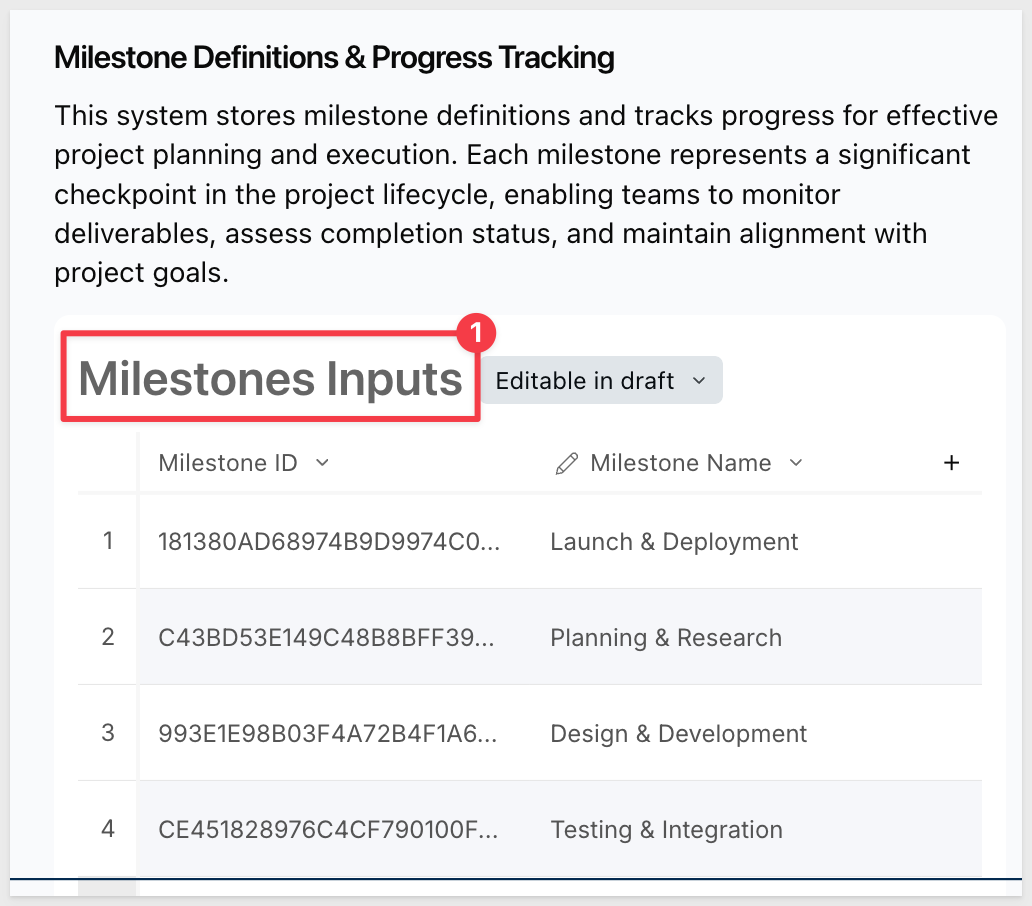
Milestones Inputs → stores one row per milestone, linked to a project via Project ID. Milestones define the phases of a project and their date ranges. Notice that these are editable in Draft mode so that they can be adjusted as needed by the workbook.
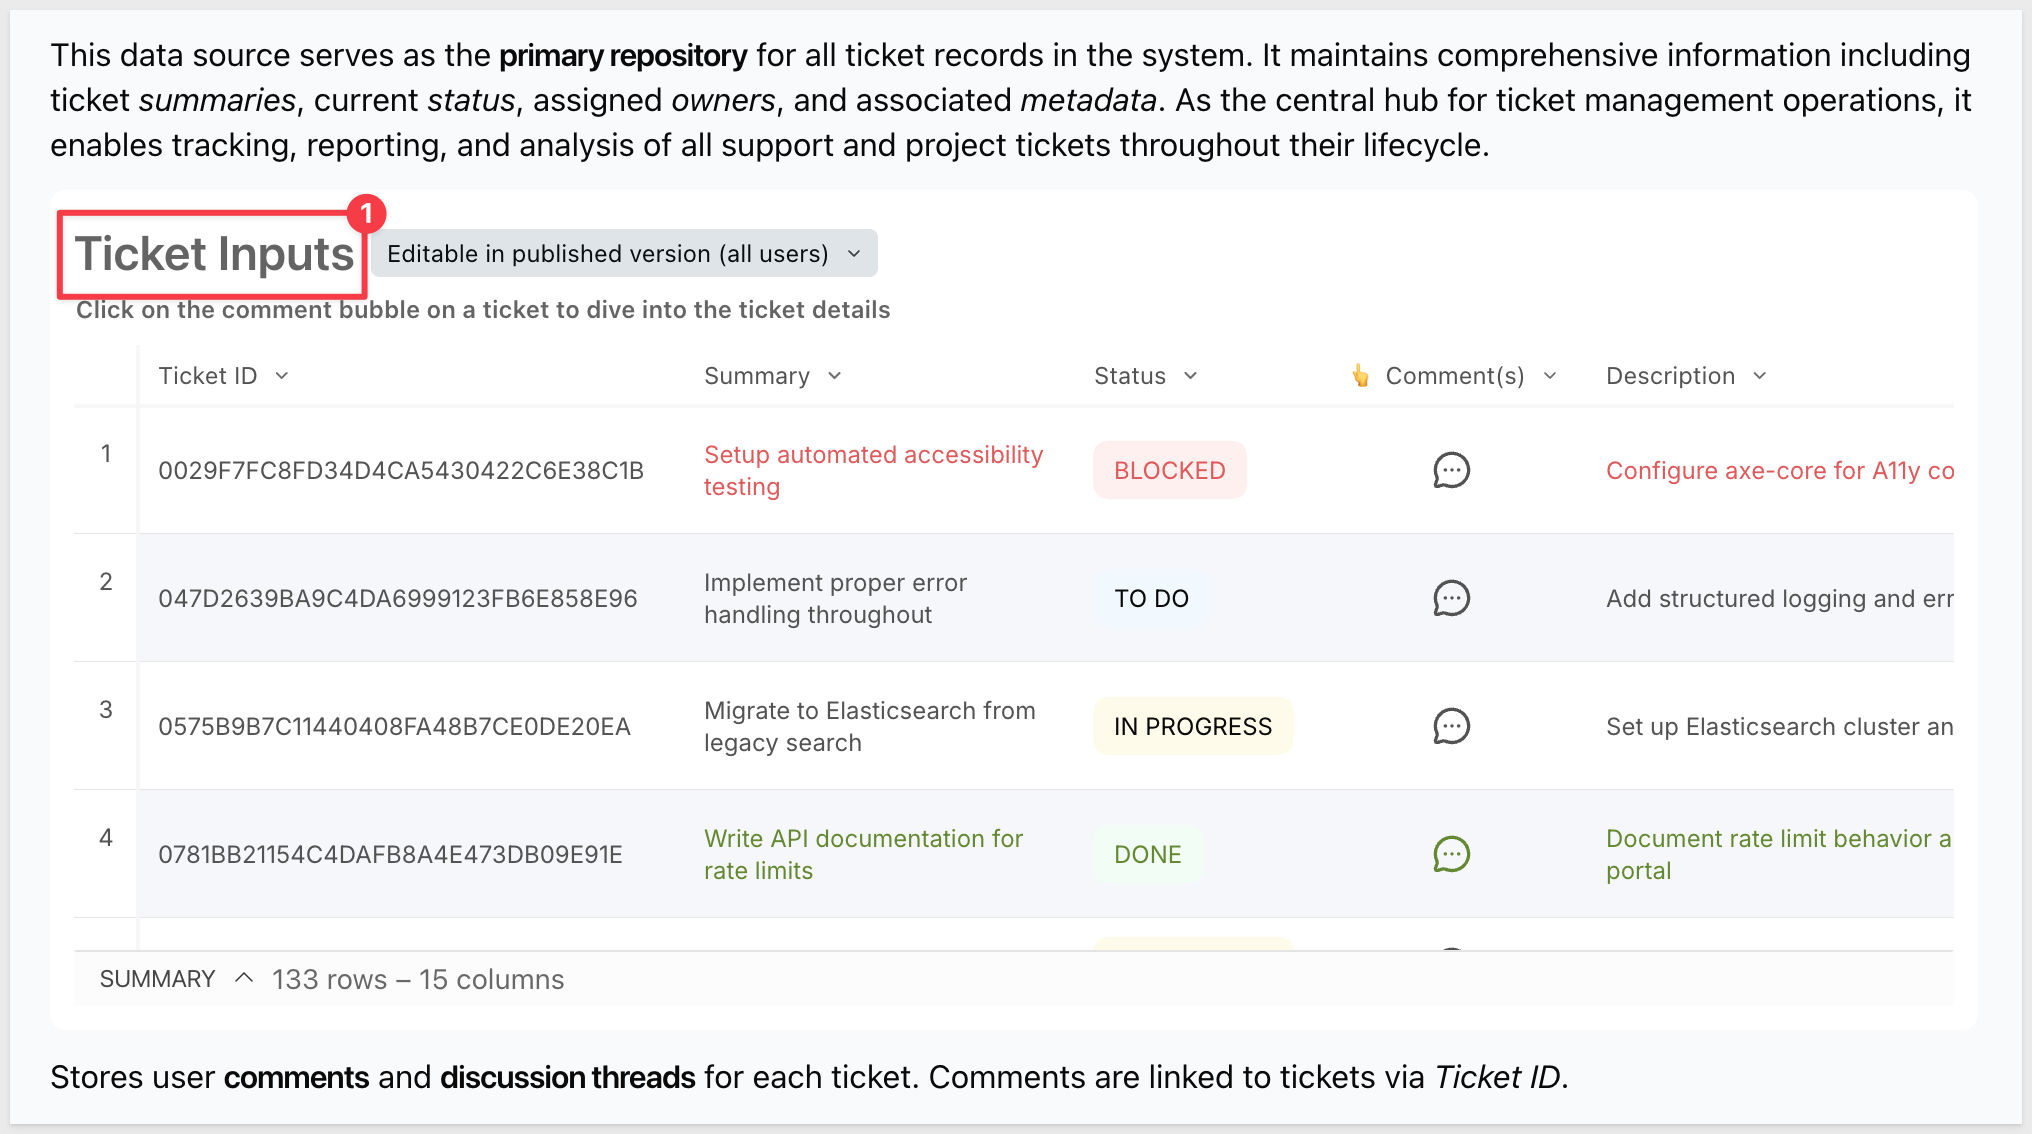
Ticket Inputs → stores one row per ticket (plan item), linked to both a project and a milestone via Project ID and Milestone ID. Tickets carry the full execution detail: summary, status, priority, assignee, due date, and description.
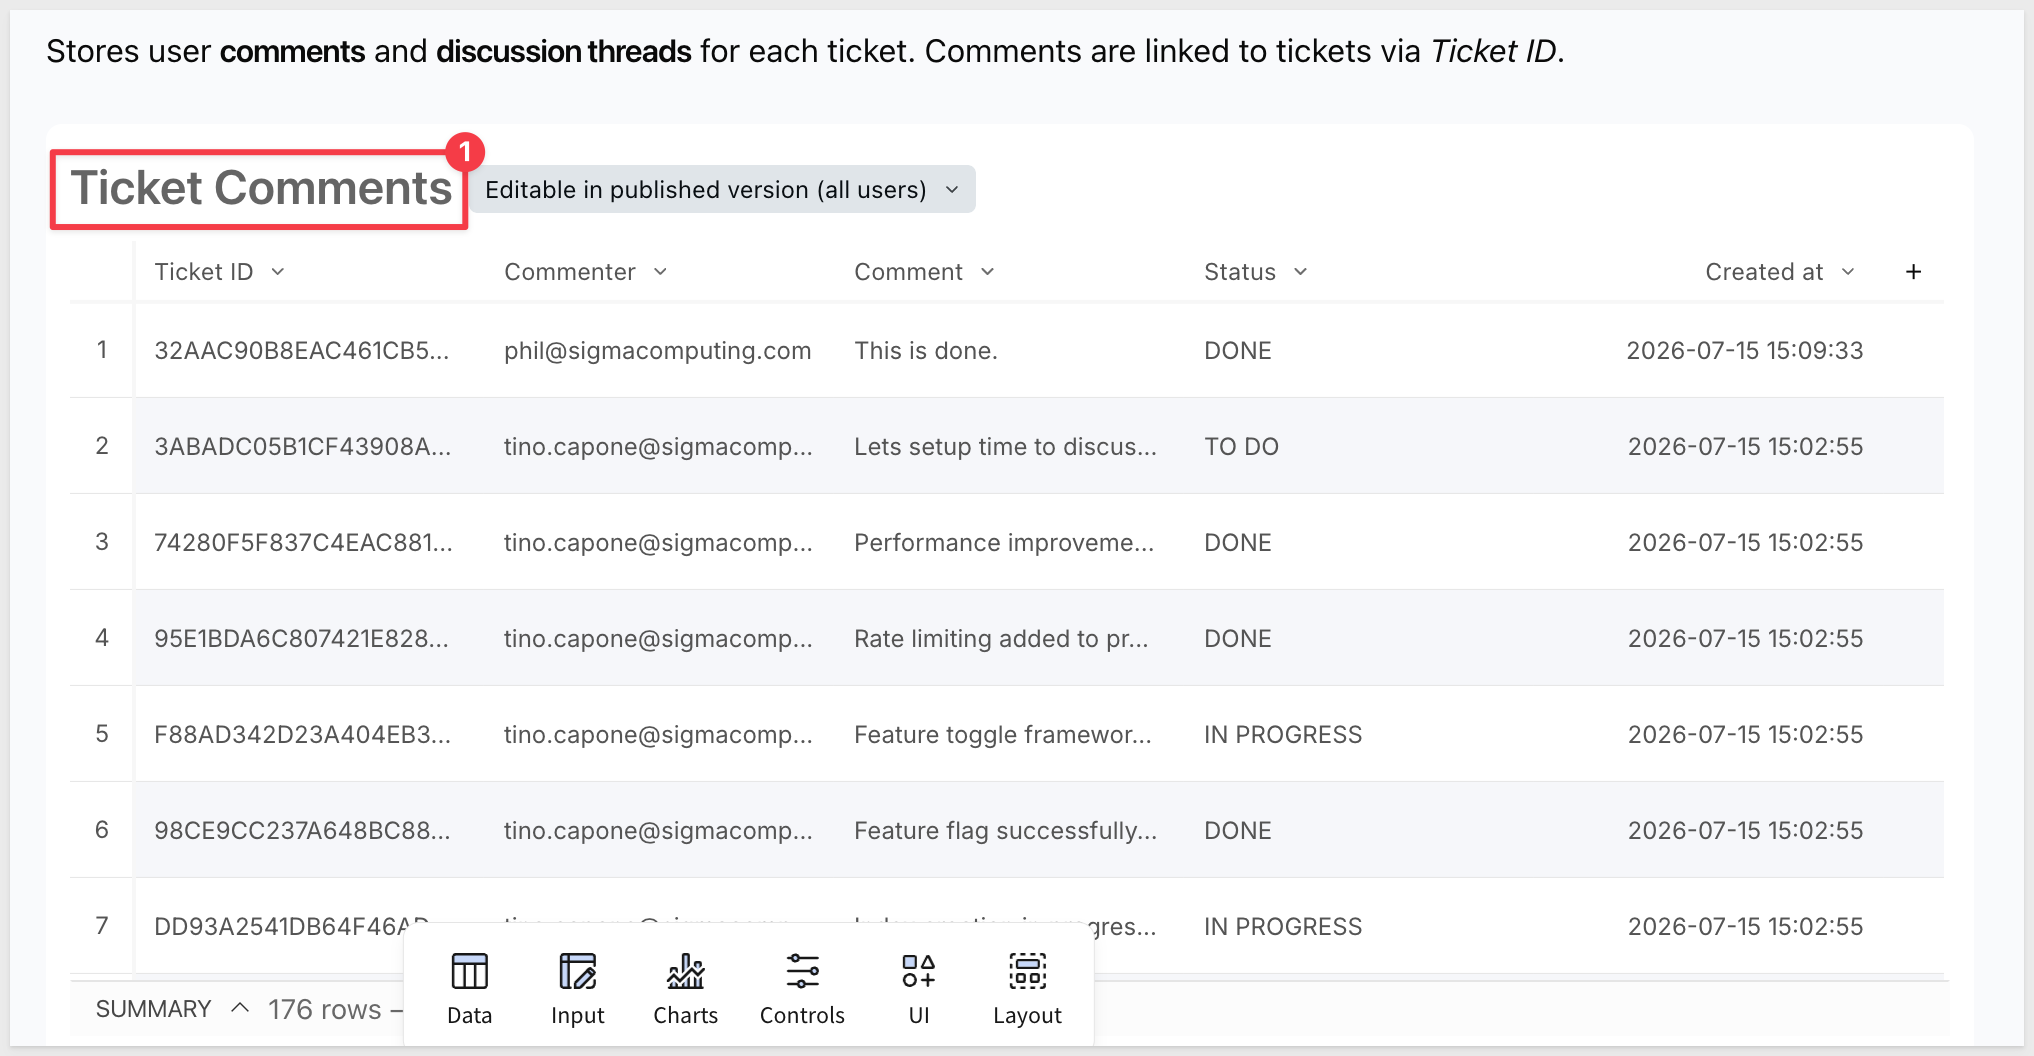
Ticket Comments → stores comments logged against individual tickets from the Ticket Details View.
This hierarchy means you can model any project structure — flat task lists, multi-phase programs, or cross-team portfolios — by varying how many milestones you create and how you assign tickets to them.
Lookup-Derived Fields
Several fields in the app are calculated via Lookup() rather than stored directly:
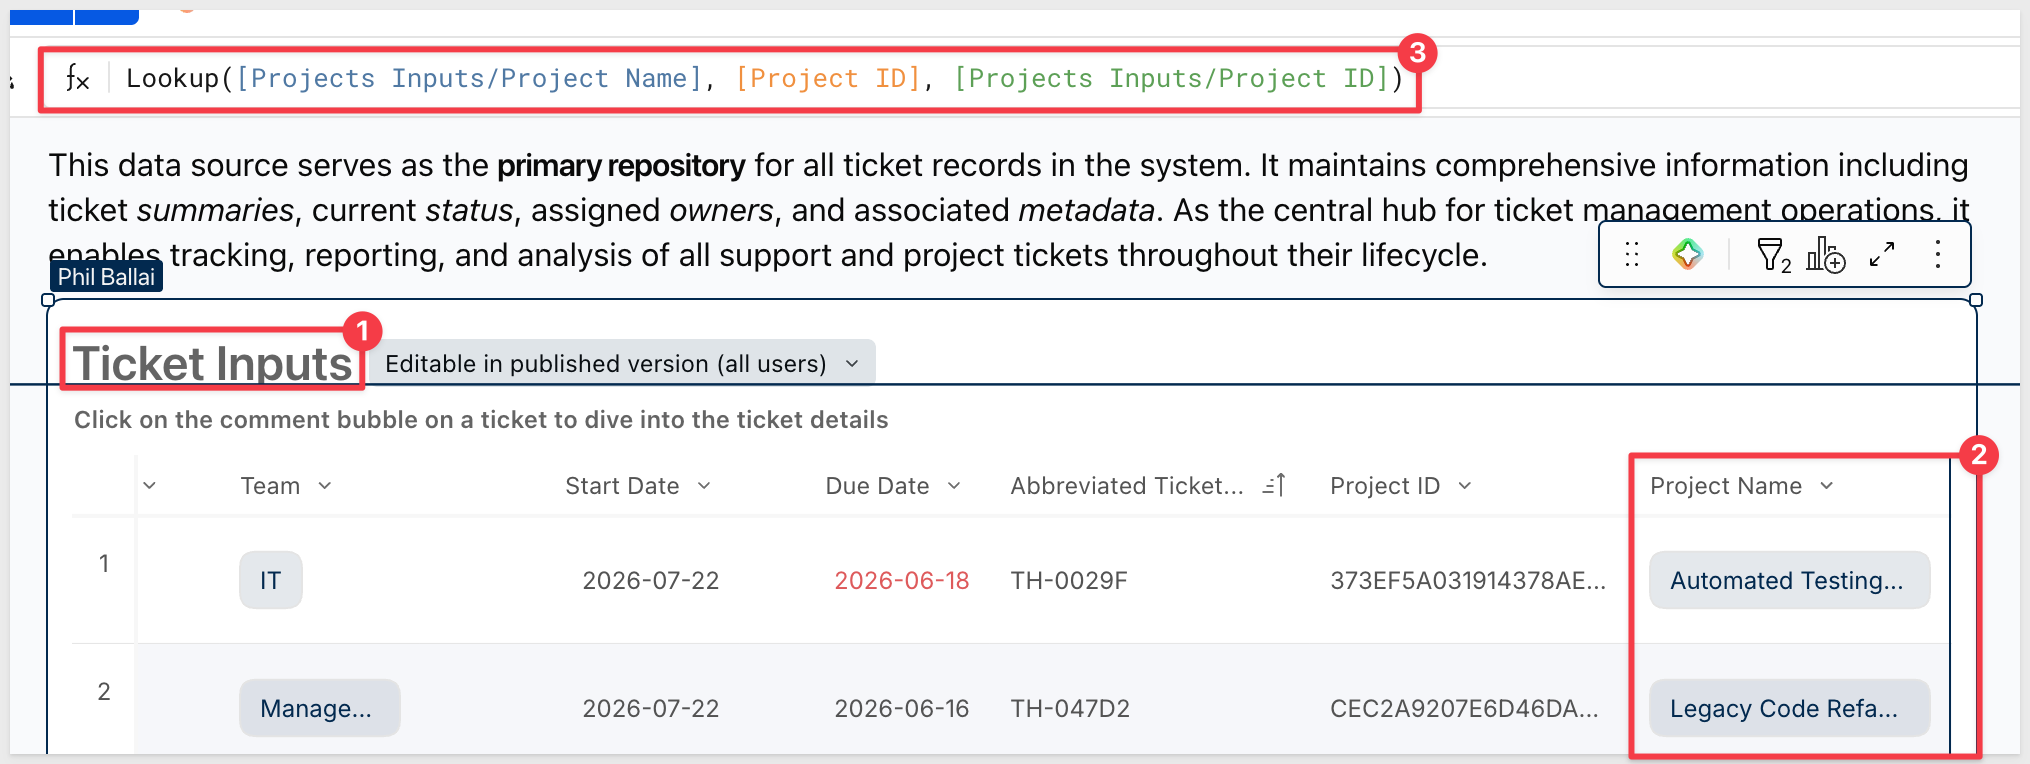
- Project Name on Ticket Inputs is
Lookup([Projects Inputs/Project Name], [Project ID], [Projects Inputs/Project ID])— resolved from the Projects table, never duplicated.
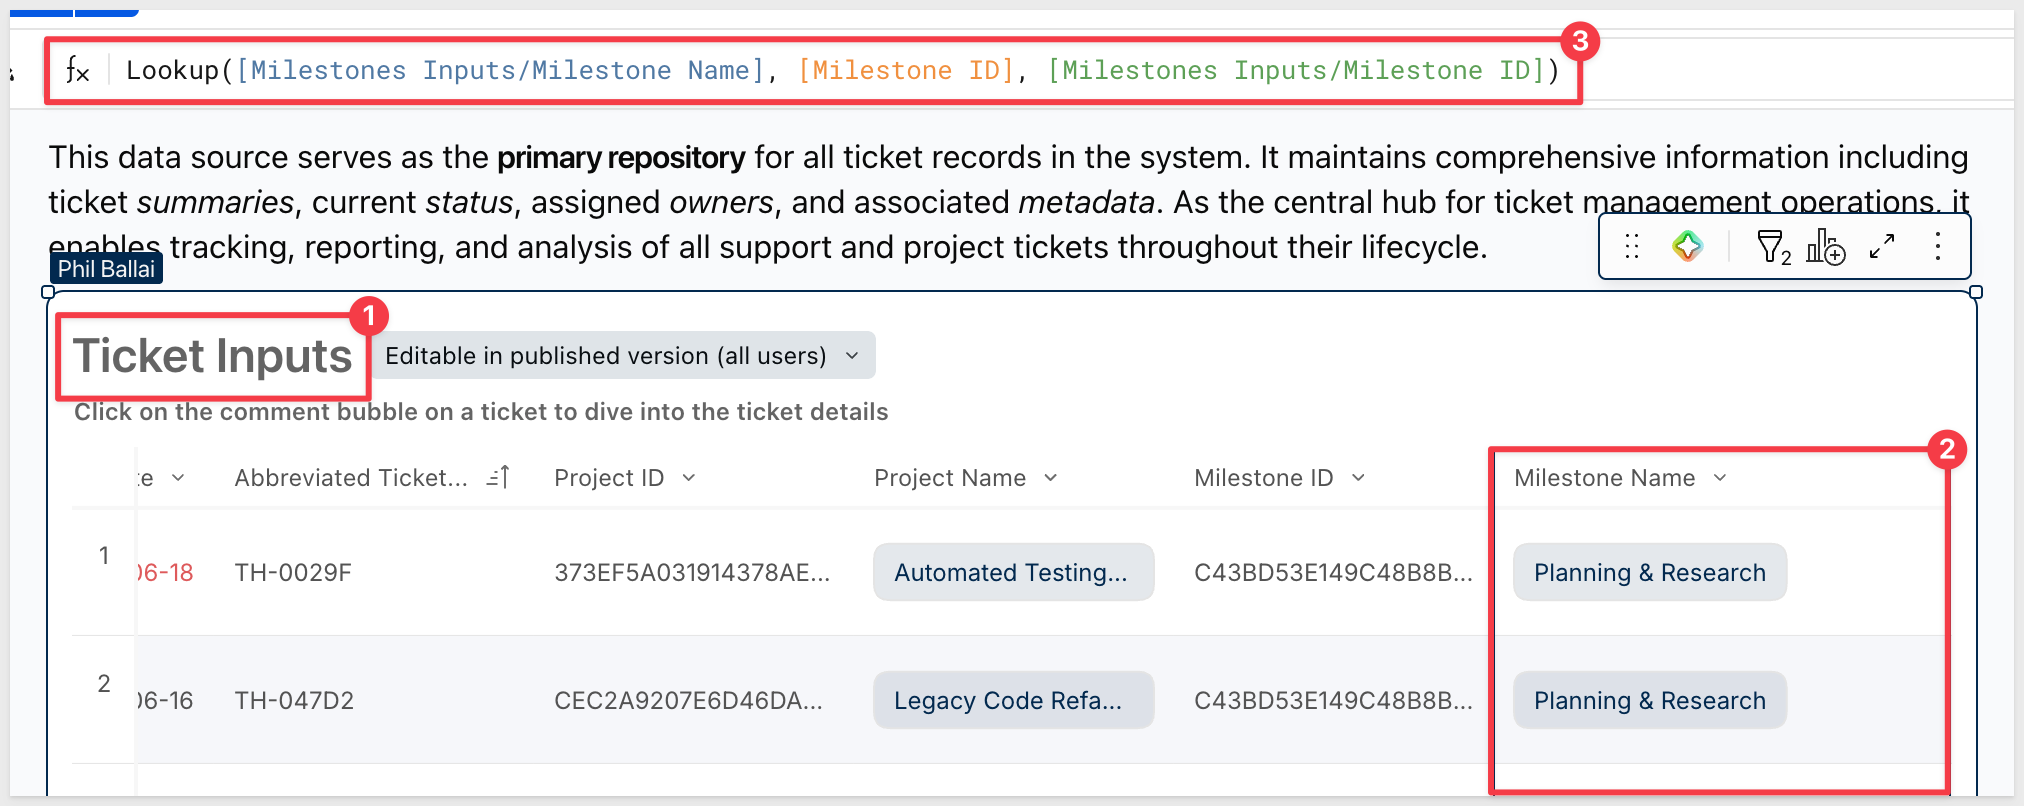
- Milestone Name on Ticket Inputs is similarly resolved from the Milestones table.
- Team on Ticket Inputs is
Lookup([Employees/Contact Job Department], [Assignee], [Employees/Identity User Email])— auto-populated from the Employees table when an assignee email is entered.
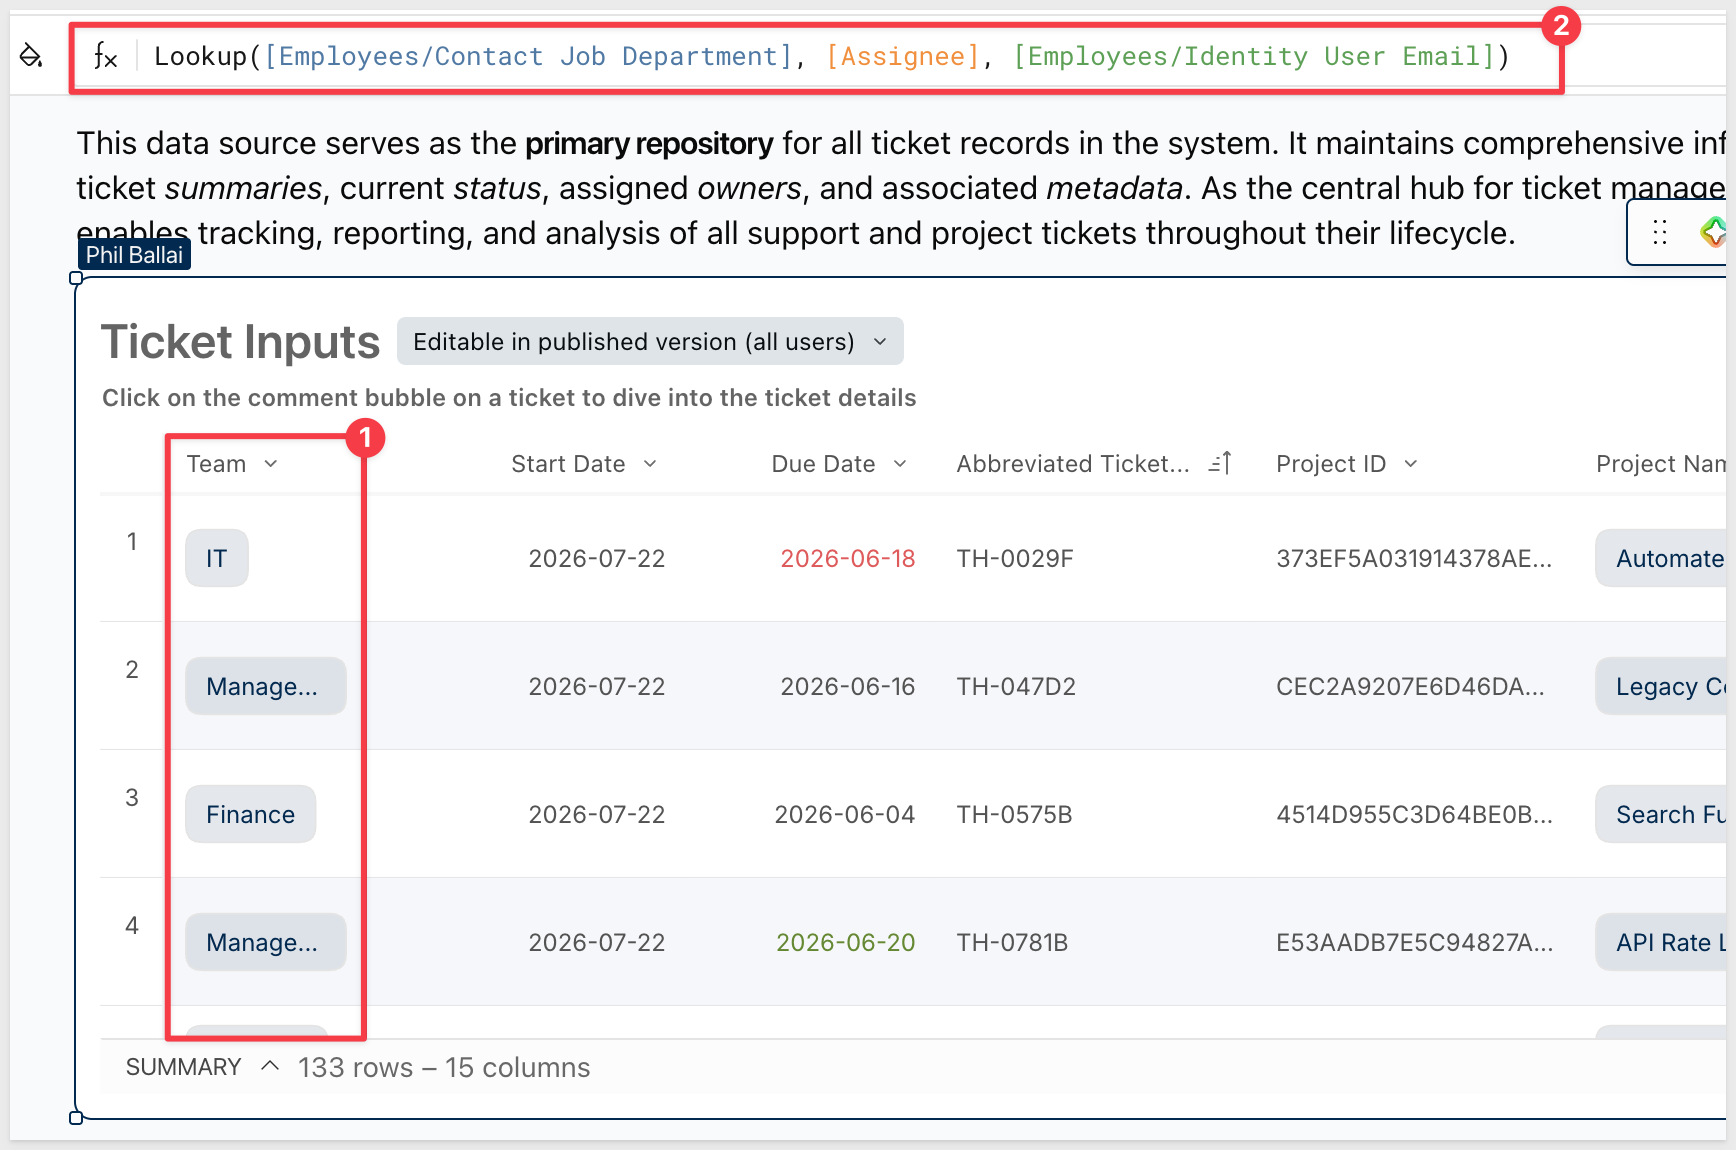
This keeps the input tables narrow — users enter only the foreign key (an ID or email), and the display value is resolved at query time.
WHY IT MATTERS:
Lookup-derived fields prevent the most common failure mode in multi-table apps: denormalized copies of the same value drifting out of sync. If an employee changes departments or a project is renamed, the update propagates everywhere automatically — no manual corrections required.
Priority Icons and Status Pills
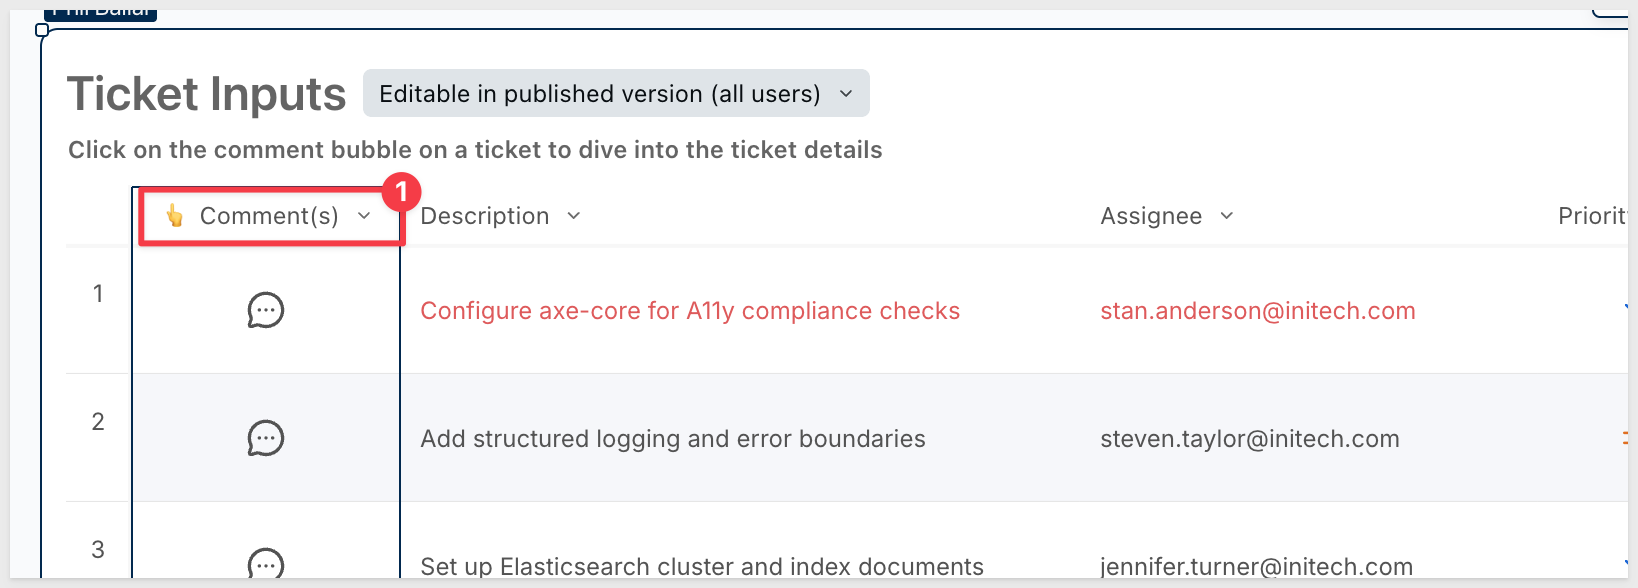
Priority and the Comment(s) column use SVG icons rendered via If() formulas that map a stored text value to a base64-encoded SVG data URI. Priority icons use different Lucide icons and colors per level: blue chevron-down for LOW, orange equal for MEDIUM, red chevrons-up for HIGH. The Comment(s) column swaps between three chat-bubble icons depending on ticket status.
Status takes a different approach — it uses the pills: color-by-option setting on the Ticket Inputs table, which assigns each defined status value (TO DO, IN PROGRESS, DONE, BLOCKED) a distinct background color automatically. No formula required.
Conditional Formatting on the Plan Page
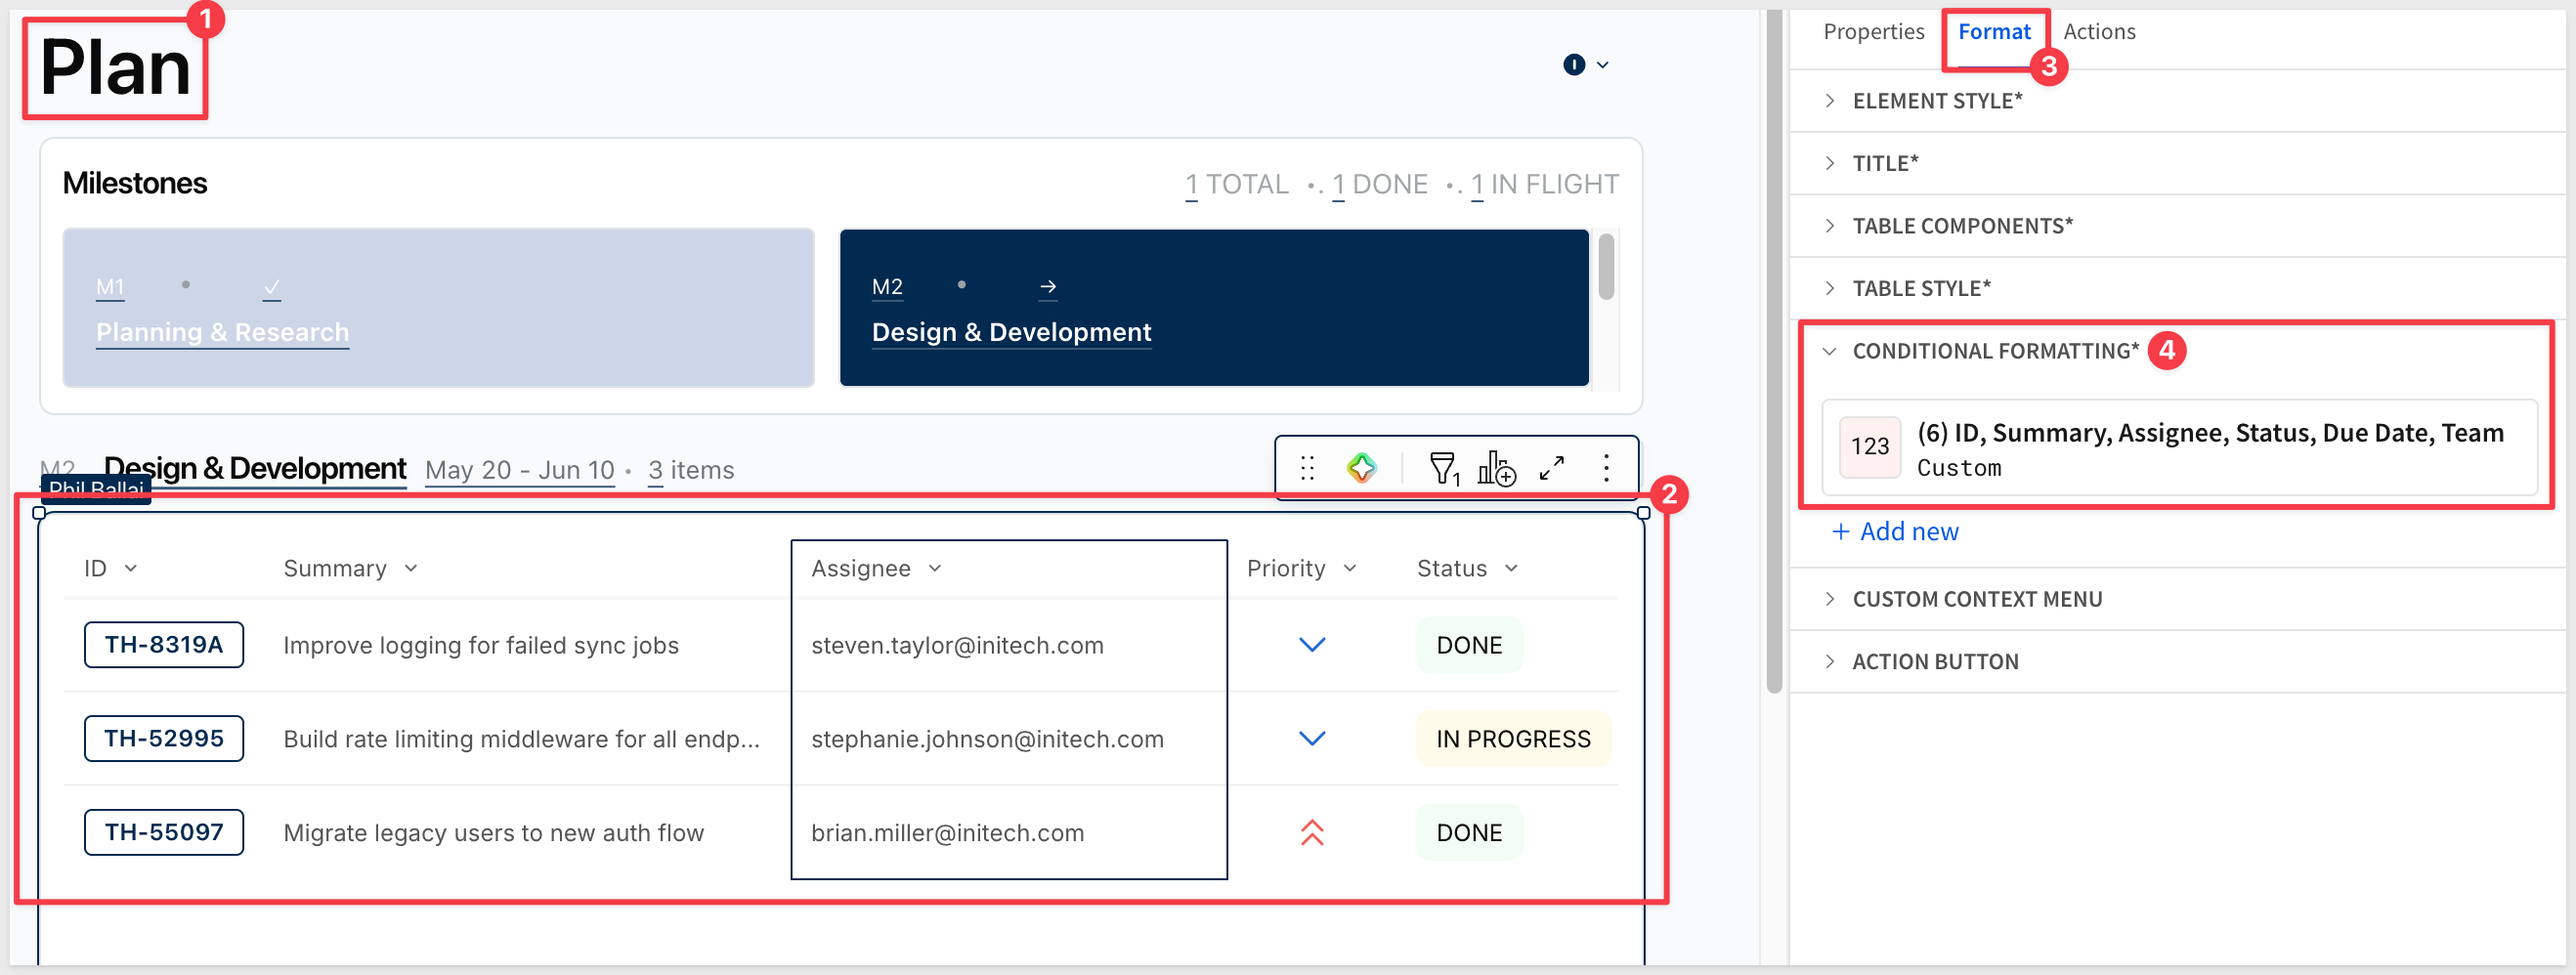
The Plan page applies a conditional row highlight to flag overdue work:
([Status] = "TO DO" or [Status] = "BLOCKER") and [Due Date] > [Selected Milestone Step/End Date]
Any ticket that hasn't started (or is blocked) and whose due date falls past the end of its milestone is highlighted in #FFF1F0 (a light red background). This runs as a built-in conditional format on the Plan table — no formula column or manual filter required.
AI Prompts as Inline Formulas
The Project Management app embeds the AI prompts directly in CallText() formulas within the canvas text elements.
Both prompts follow the same pattern: assemble a structured context string from live ticket data using ListAgg(), pass it to the model, and strip any stray quote characters from the output with Replace():
Replace(
  CallText(
    "ai_complete",
    "claude-4-sonnet",
    "Return your response as exactly 1 or 2 sentences. " &
    "Be decisive in providing a summary of the selected project. " &
    "Provide the project name, health, and any tickets that " &
    "have blockers or are urgent to address. NEVER USE **. " &
    "#PROJECT: "   & [Selected Project/Project Name] &
    "#TICKETS: "   & ListAgg([Selected Project Tickets/Summary]) &
    "#STATUS: "    & ListAgg([Selected Project Tickets/Status]) &
    "#PRIORITY: "  & ListAgg([Selected Project Tickets/Priority]) &
    "#DUE DATE "   & ListAgg(Text([Selected Project Tickets/Due Date]))
  ),
  '"', ""
)
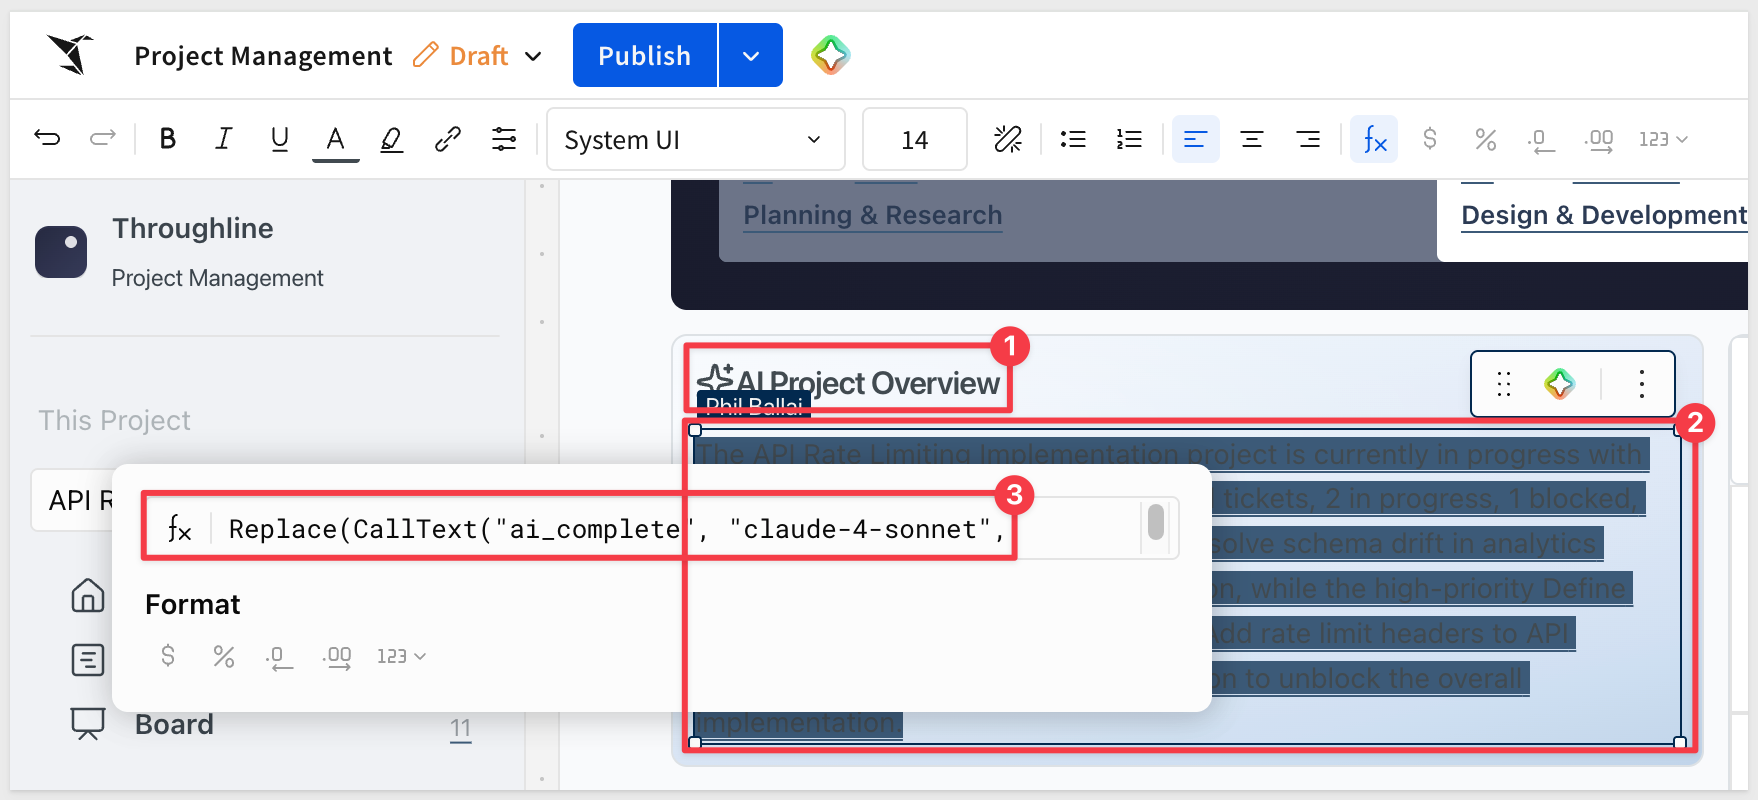
To modify what the AI writes, open the text element in edit mode and update the instruction string directly. The formula is visible and editable for anyone with edit access to the workbook.
For example, clicking the AI Project Overview text box exposes the formula shown above:
Because the Project Management app runs entirely on input tables — with no external warehouse data source — connecting it to your own data is primarily about two things: pointing the input tables to the correct warehouse connection for write-back storage, and loading your existing project data.
Verify the Write-Back Connection
All input tables (Projects, Milestones, Tickets, Comments) write to a Snowflake connection. On the Data page, open any input table and confirm the connection points to a warehouse where your org has write access.
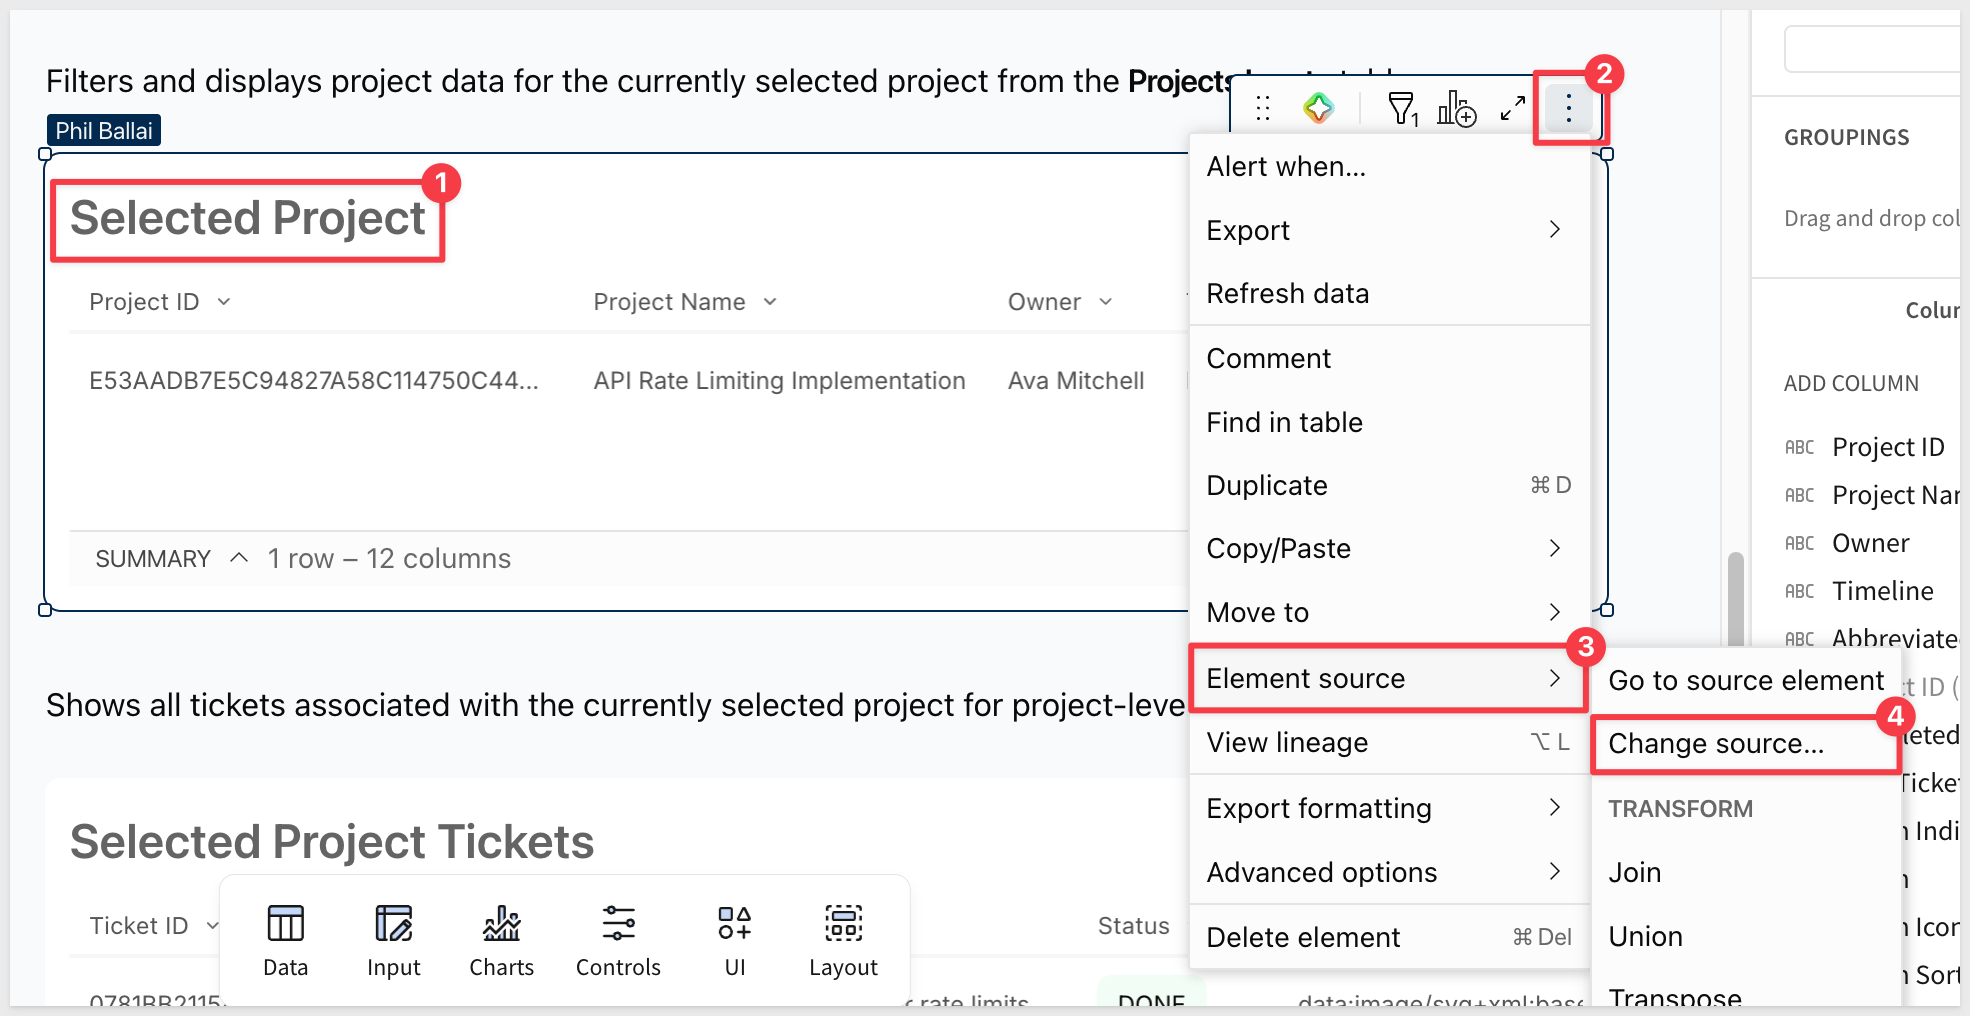
If you need to move the tables to a different connection, use Change source on each input table to update the target:
Update the Employees Table
The Employees table is the only reference table in the app — it's used to auto-populate the Team field on tickets via a Lookup. By default it contains Throughline sample employee data.
To use real org members, replace the Employees table data with your own employee directory. The minimum required columns are:
Column | Description |
Identity User Email | The email address used to log into Sigma |
Org Member Full Name | Display name |
Contact Job Department | Team or department label |
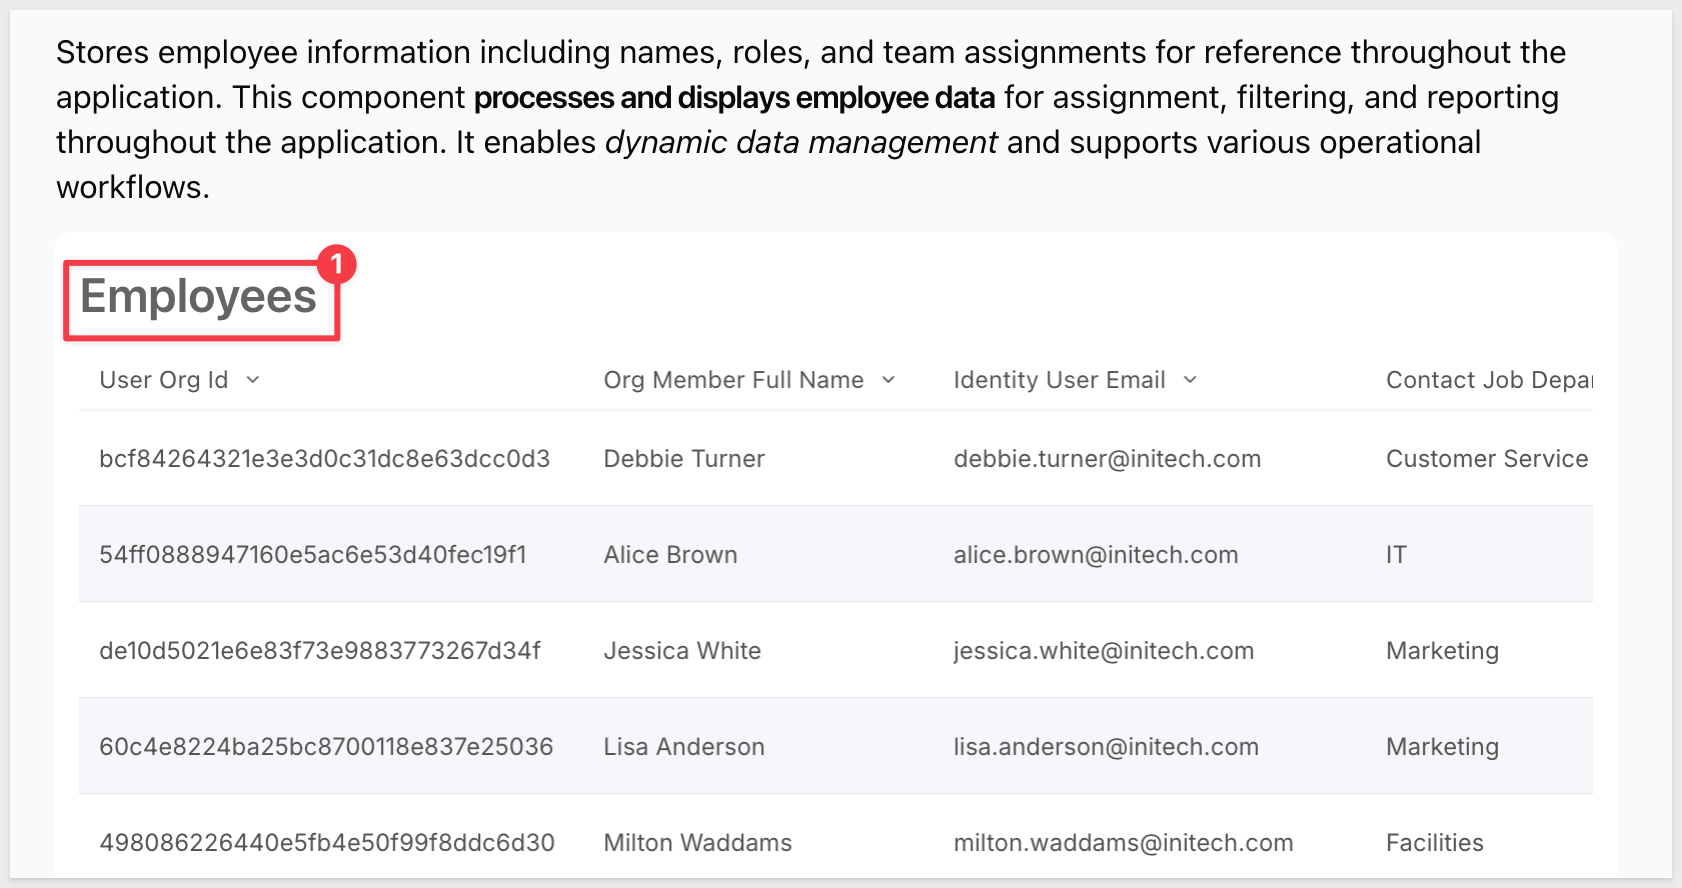
Once updated, any ticket assigned to a real user email will automatically show the correct team in the Team field.
Load Your Existing Projects
If you're migrating from a spreadsheet or another project tracking tool, you can bulk-load data into the input tables by importing rows directly. On any input table, click Edit data and paste structured data from a spreadsheet or export.
Alternatively, start fresh: add your projects, milestones, and first batch of tickets manually using the workflow in Managing a Project. The Throughline sample data can be deleted from the input tables once your own projects are in place.
What Carries Over Automatically
Once the Employees table is updated and your projects are loaded:
- Team fields on all tickets resolve to your actual org departments
- Health status calculations on Home and All Projects run against your project data
- AI Project Overview and Blocker Analysis generate summaries based on your tickets
- The Plan page conditional formatting flags your overdue items automatically
No formula changes are needed — the app is parameterized by the data in the input tables, not hardcoded to the sample content.
The Project Management App Template demonstrates what's possible when Sigma's native input tables are composed into a multi-surface operational workflow. Projects, milestones, and tickets live in three connected input tables — changes on any one propagate to every page in real time. The Kanban board, milestone plan, portfolio view, and ticket detail drill-down all draw from the same source of truth.
The Lookup-derived field pattern — storing only foreign keys and resolving display values at query time — keeps the data model clean and prevents the denormalization drift that plagues spreadsheet-based project tracking. The conditional format on the Plan page surfaces overdue work automatically without any user action.
The AI features follow a pattern worth reusing: assemble live context from the workbook's data using ListAgg(), pass it to a model via CallText(), and surface the result inline as part of the page layout. No separate AI tool or pipeline is needed — the AI operates on the same data the user is already looking at.
These patterns apply broadly to any operational app where structured data entry, multi-level drill-down, and real-time status reporting need to coexist in a single interface.
Additional Resource Links
Blog
Community
Help Center
QuickStarts
Be sure to check out all the latest developments at Sigma's First Friday Feature page!