When designing relational databases, improper relationships between tables can lead to incorrect query results. A common pitfall in data modeling is the Fan Trap. Understanding how fan traps occur and how to prevent them ensures accurate data retrieval and reporting.
A fan trap occurs when a one-to-many relationship is followed by another one-to-many relationship, leading to potential overcounting of values in queries.
In this QuickStart, we will explore a fan trap use case and one way to solve it in Sigma.
For more information on Sigma's product release strategy, see Sigma product releases.
If something is not working as you expect, here is how to contact Sigma support.
Target Audience
The typical audience for this QuickStart includes users of Excel, common Business Intelligence or Reporting tools, and semi-technical users who want to try out or learn Sigma.
Prerequisites
- A computer with a current browser. It does not matter which browser you want to use.
- Access to a Sigma environment. A trial is fine.
- Admin access to a Snowflake environment. A trial is fine.

For this use case, we will use three small CSV files to create a data model in Sigma. This will allow us to see how a fan trap is created and resolved.
This sample data can be used to derive reports and metrics related to baseball games, attendance, food sales, and so on.
The specific metrics we are after include an accurate accounting of sales per area, broken down by product line, and the sales per fan (attendee) for each product line.
After downloading, extract the files from fan_trap.zip to a known location on your computer.
Create a new data model
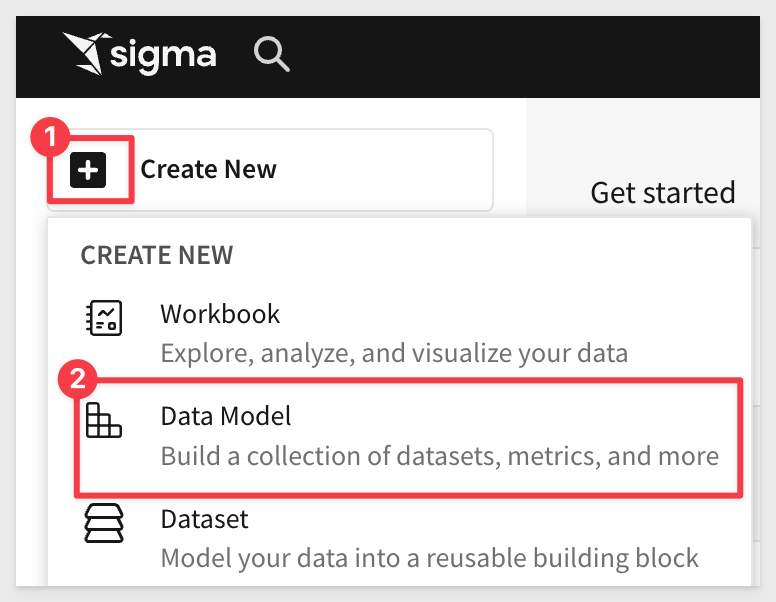
In Sigma, click Create new and select `Data Model:
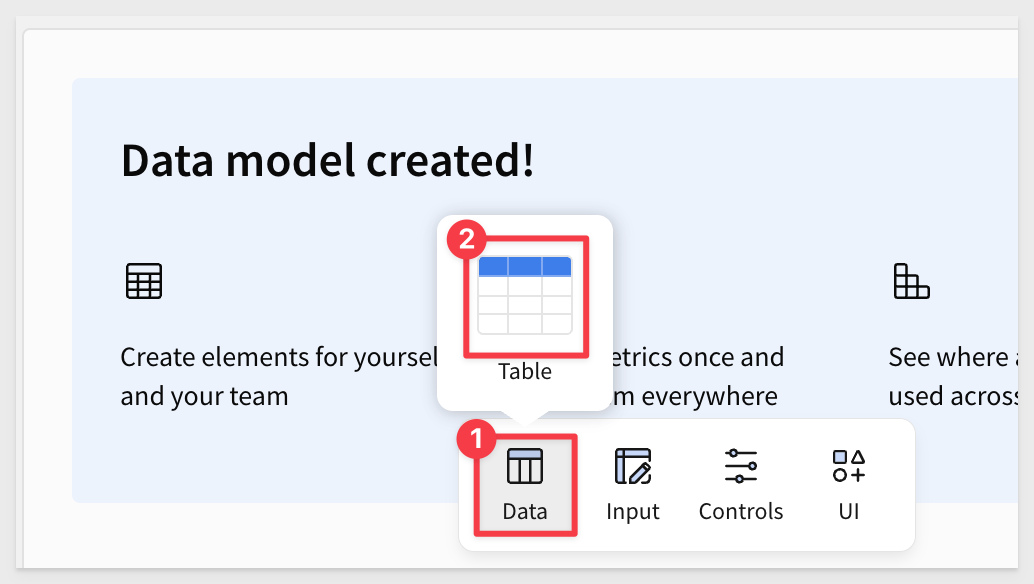
Select Data and then Table from the Element bar:
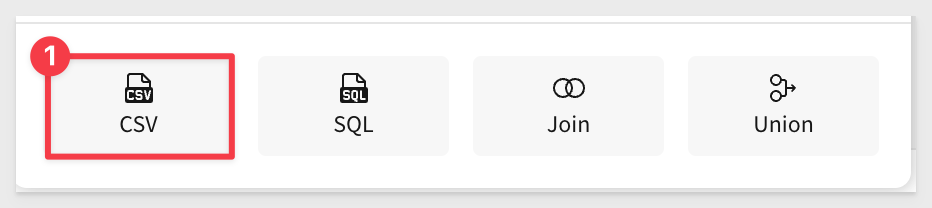
Click Select source > CSV:
For more information, see Connect to Snowflake
Drag and drop the events.csv file onto the Upload CSV page (or use the browse button). Use your Snowflake connection; ACCOUNTADMIN rights is required.
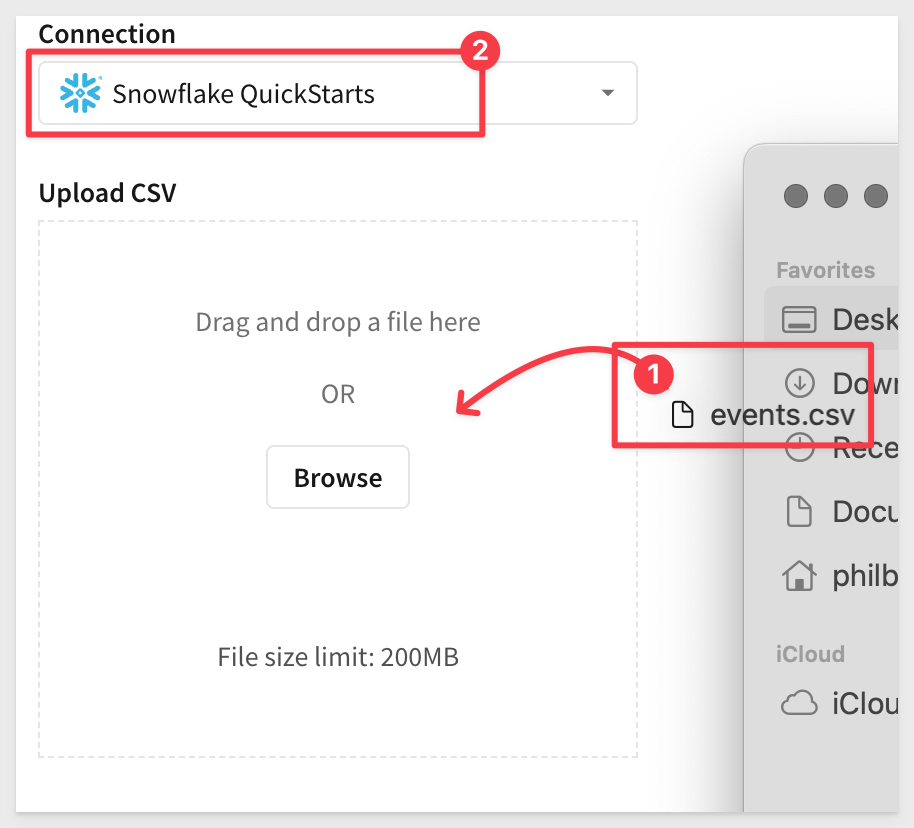
Once imported, Sigma will display the details for this CSV:
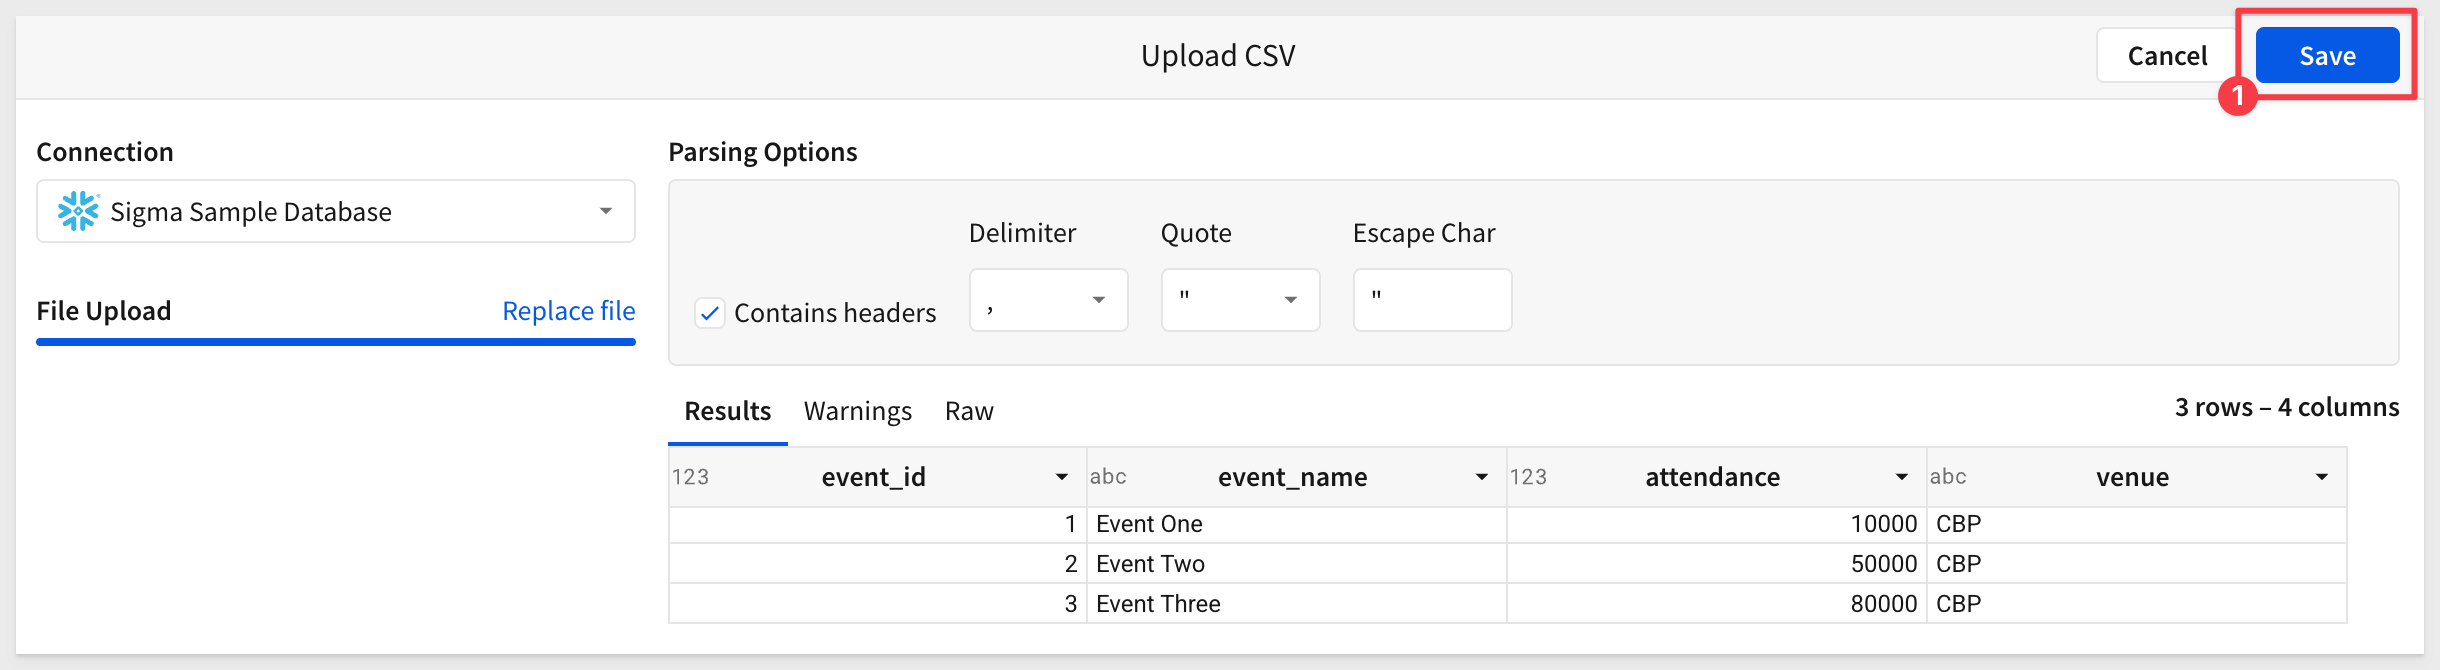
Click Save.
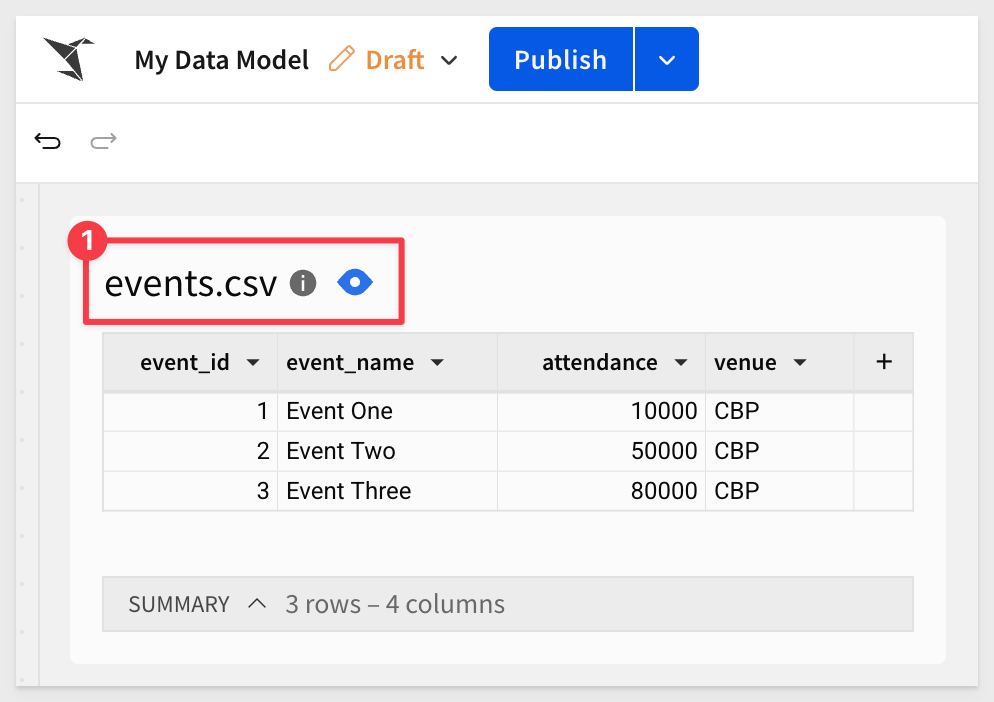
We now have one table on our page, with four columns containing information related to events:
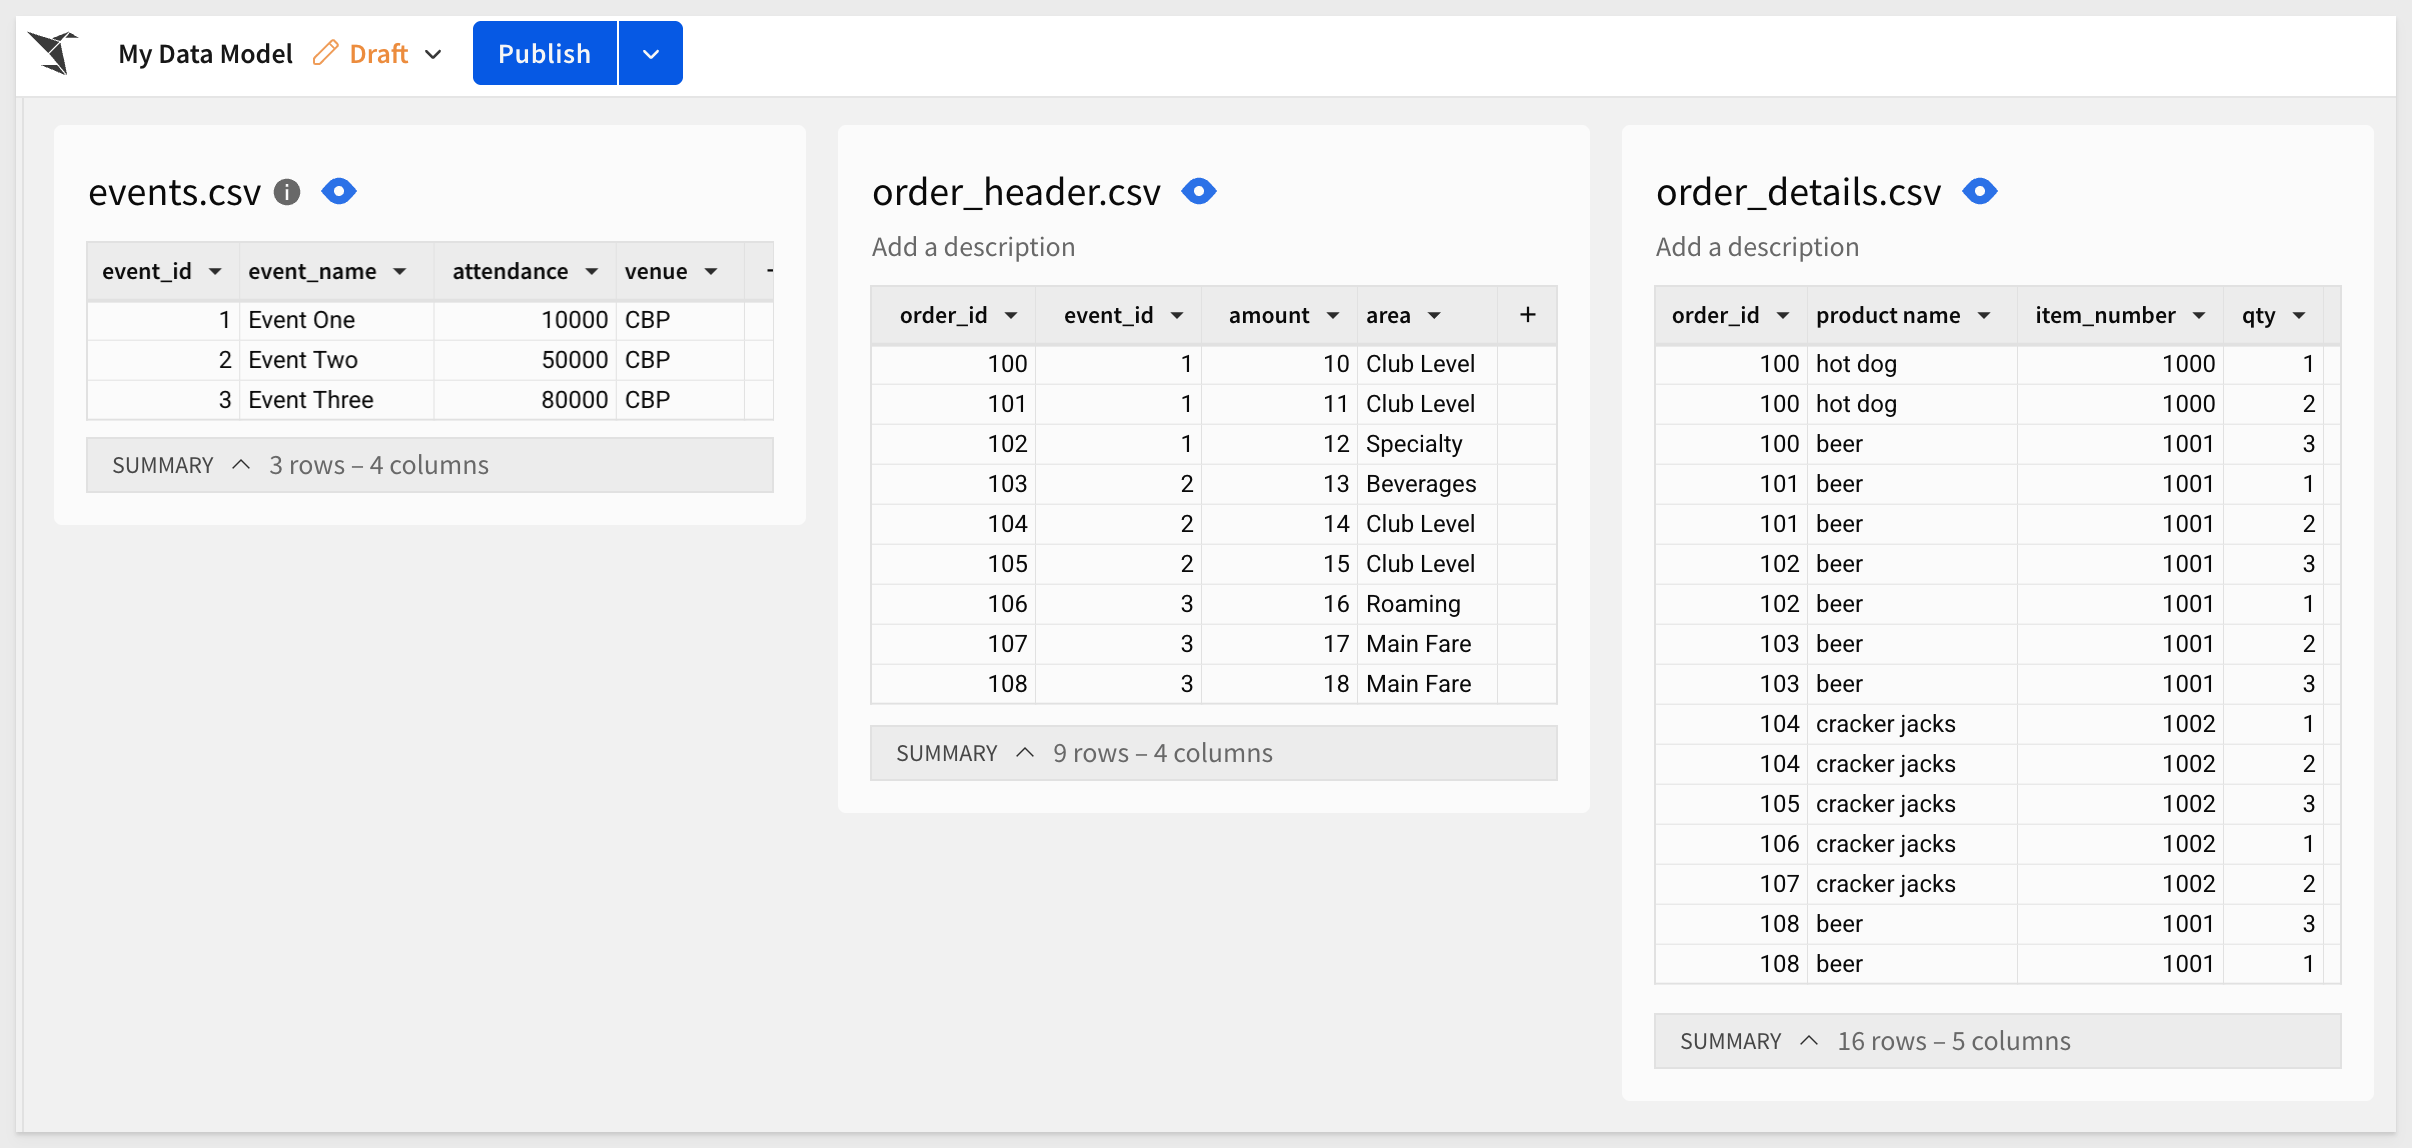
Repeat the same steps for the order header.csv and order details.csv files. Once completed, the page should look like this (after a little rearranging just to make it more readable):
Save the data model as Fan Trap Data Model and click Publish.
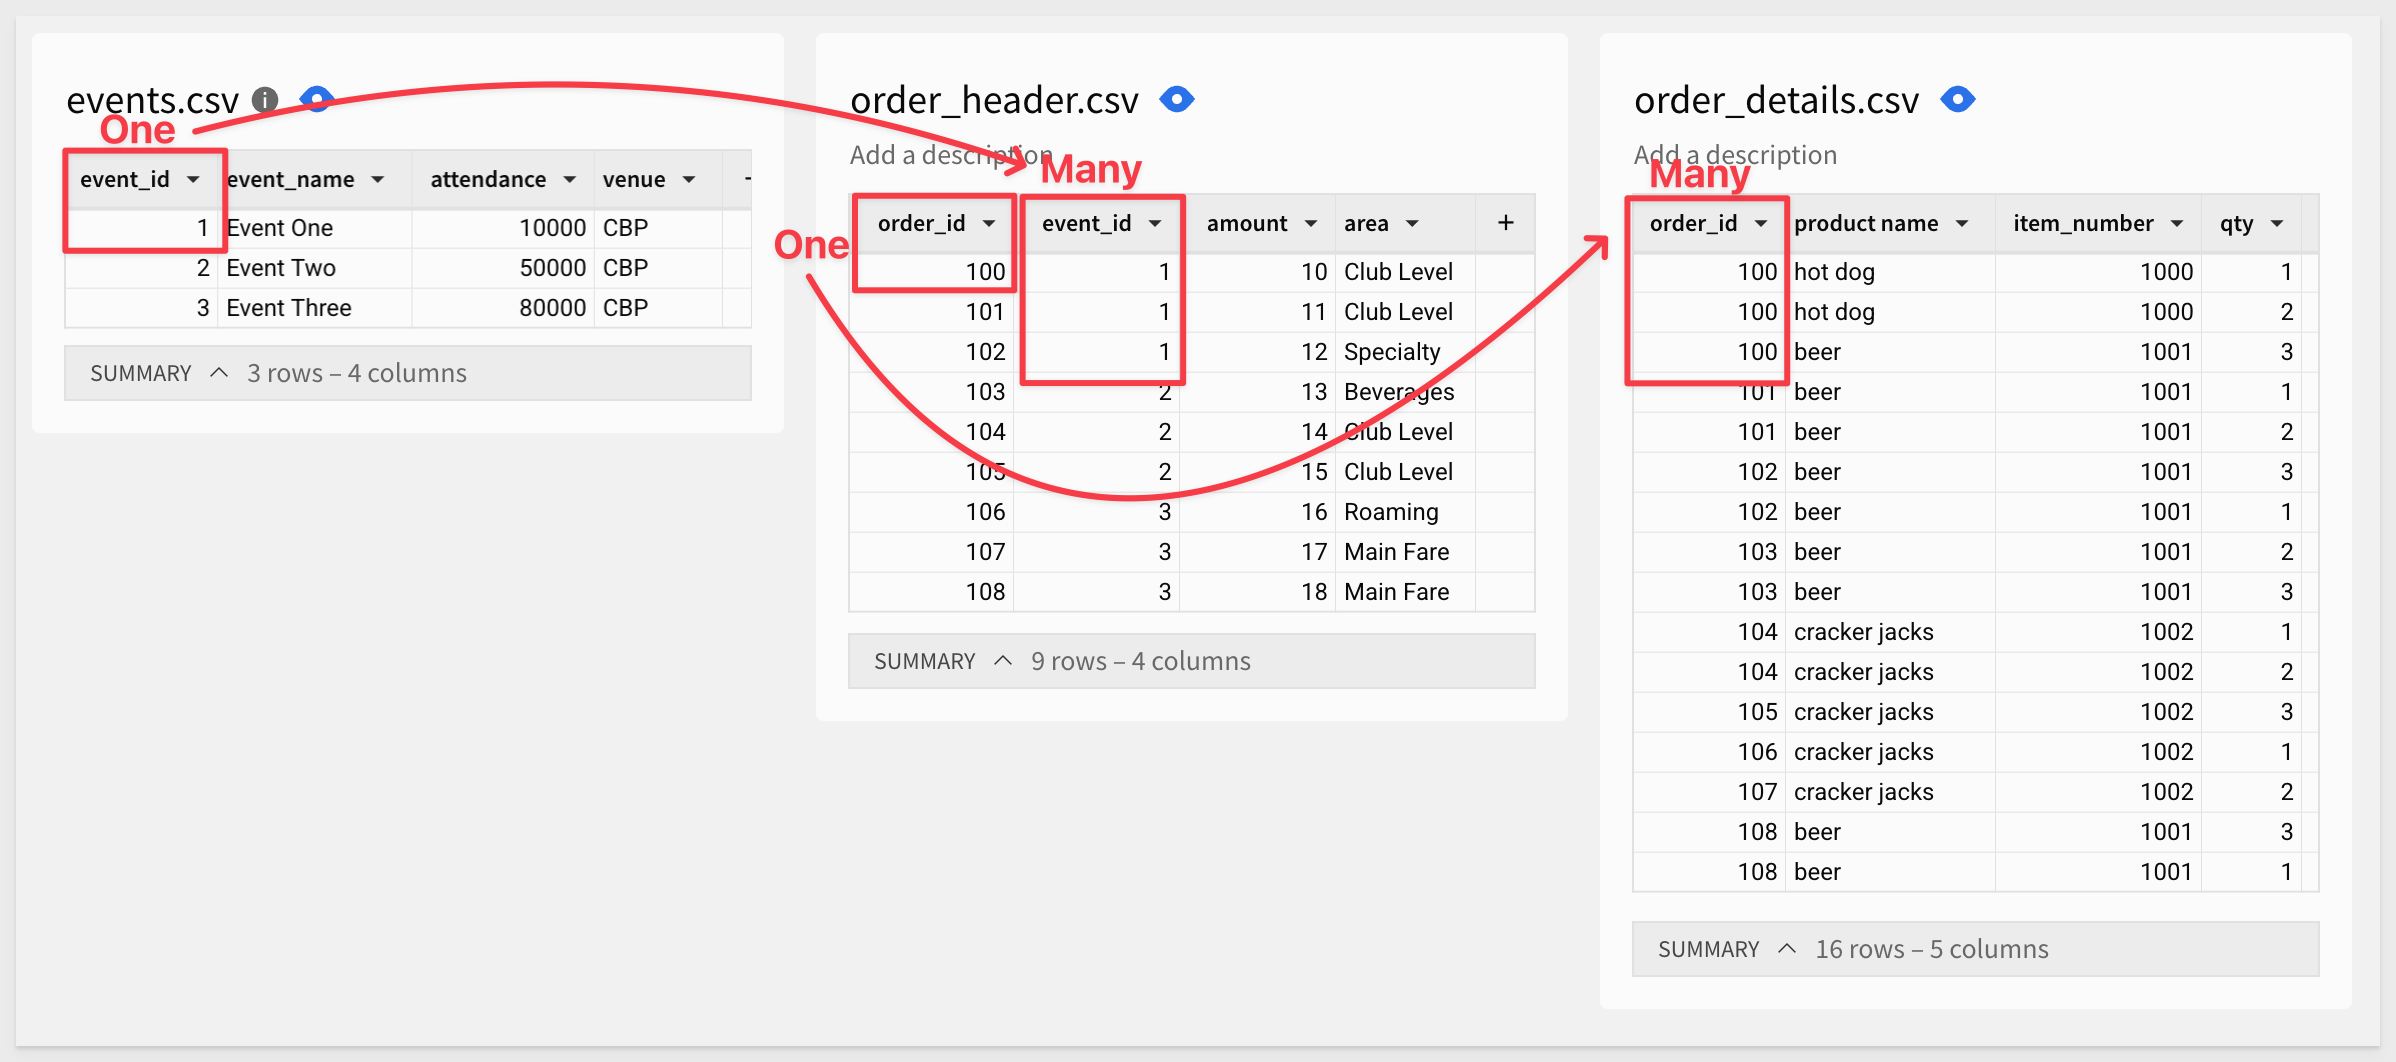
In our sample data, the fan trap may occur because of the relationships between the tables:
1: events (One) → order_header (Many)
- Each event can have multiple orders.
- The amount field in order_header represents total revenue per order.
1: order_header (One) → order_details (Many)
- Each order contains multiple products.
- order_details breaks down the order into individual items with quantity and price.
Let's join the tables and see what happens.
Join the tables
Add a new table using Data > Table from the Element bar.
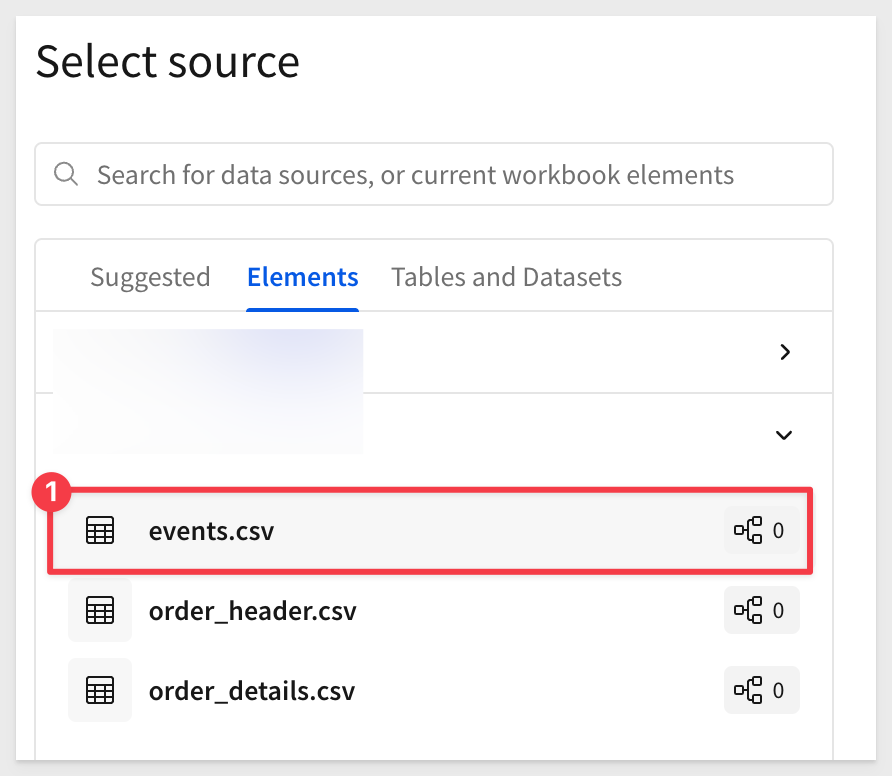
Select Elements and the events.csv. We will take all the columns; click Select:
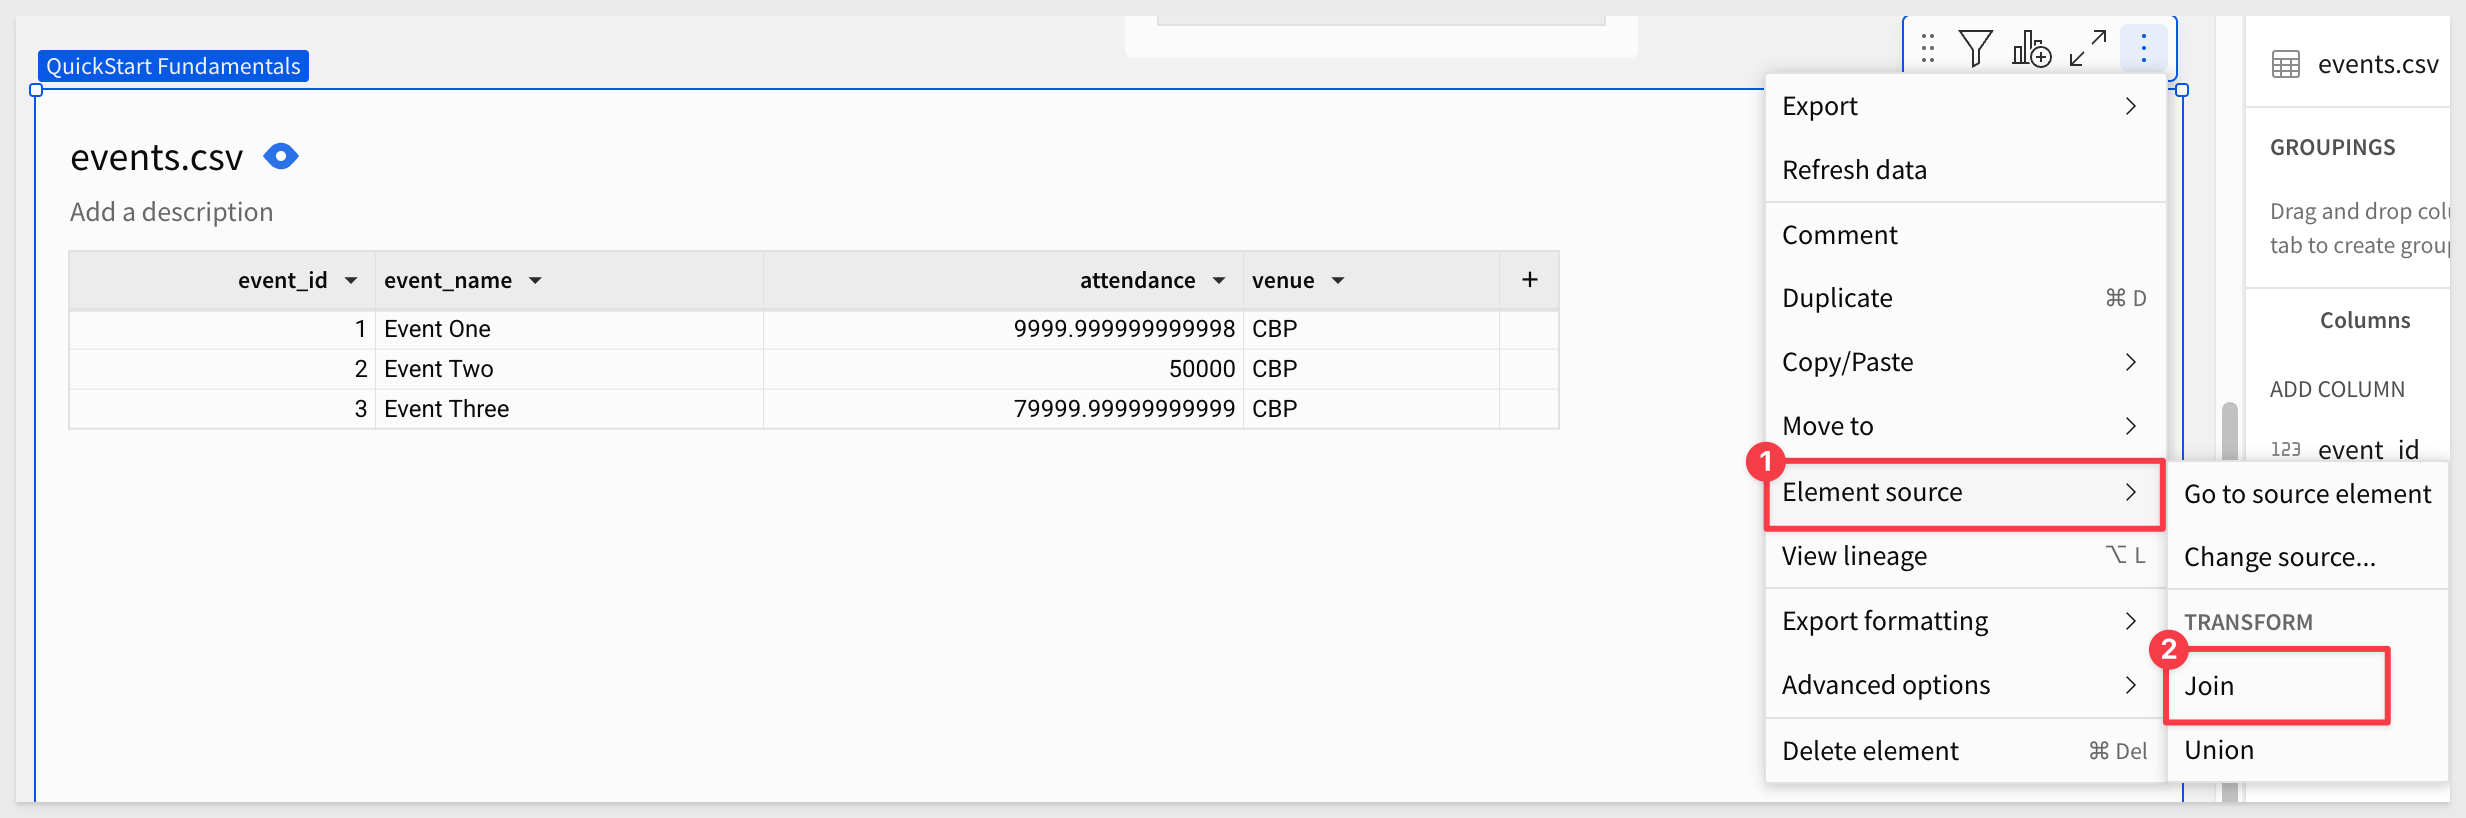
Once the copy of the Events table is added to the page, select Element source > Join from its menu:
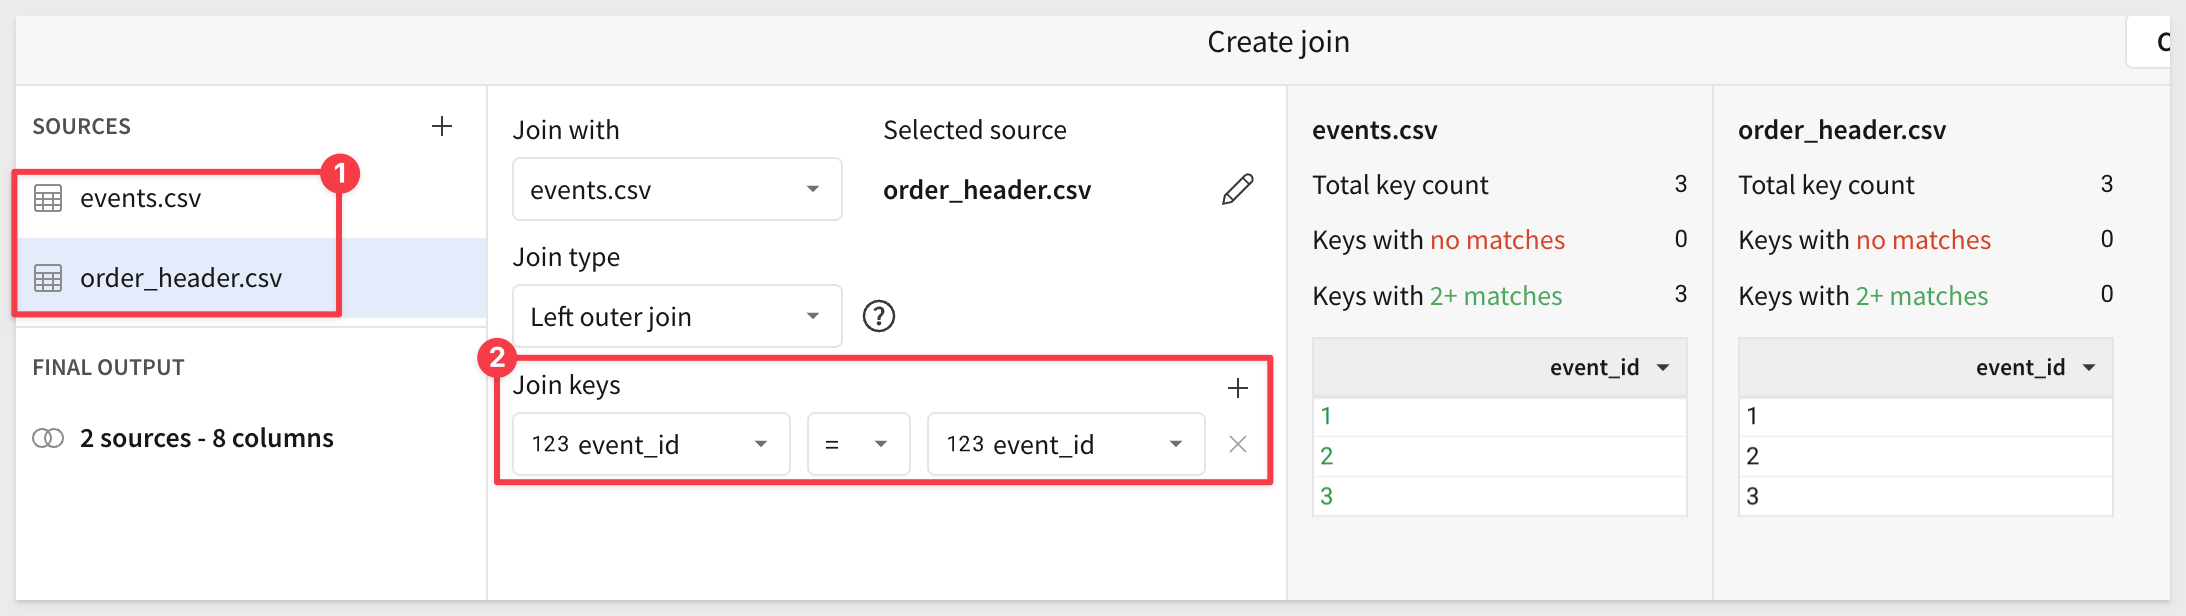
Again, select Elements and the order_header.csv file. Click Select.
Sigma should have created the correct join for us. If not, adjust as shown:
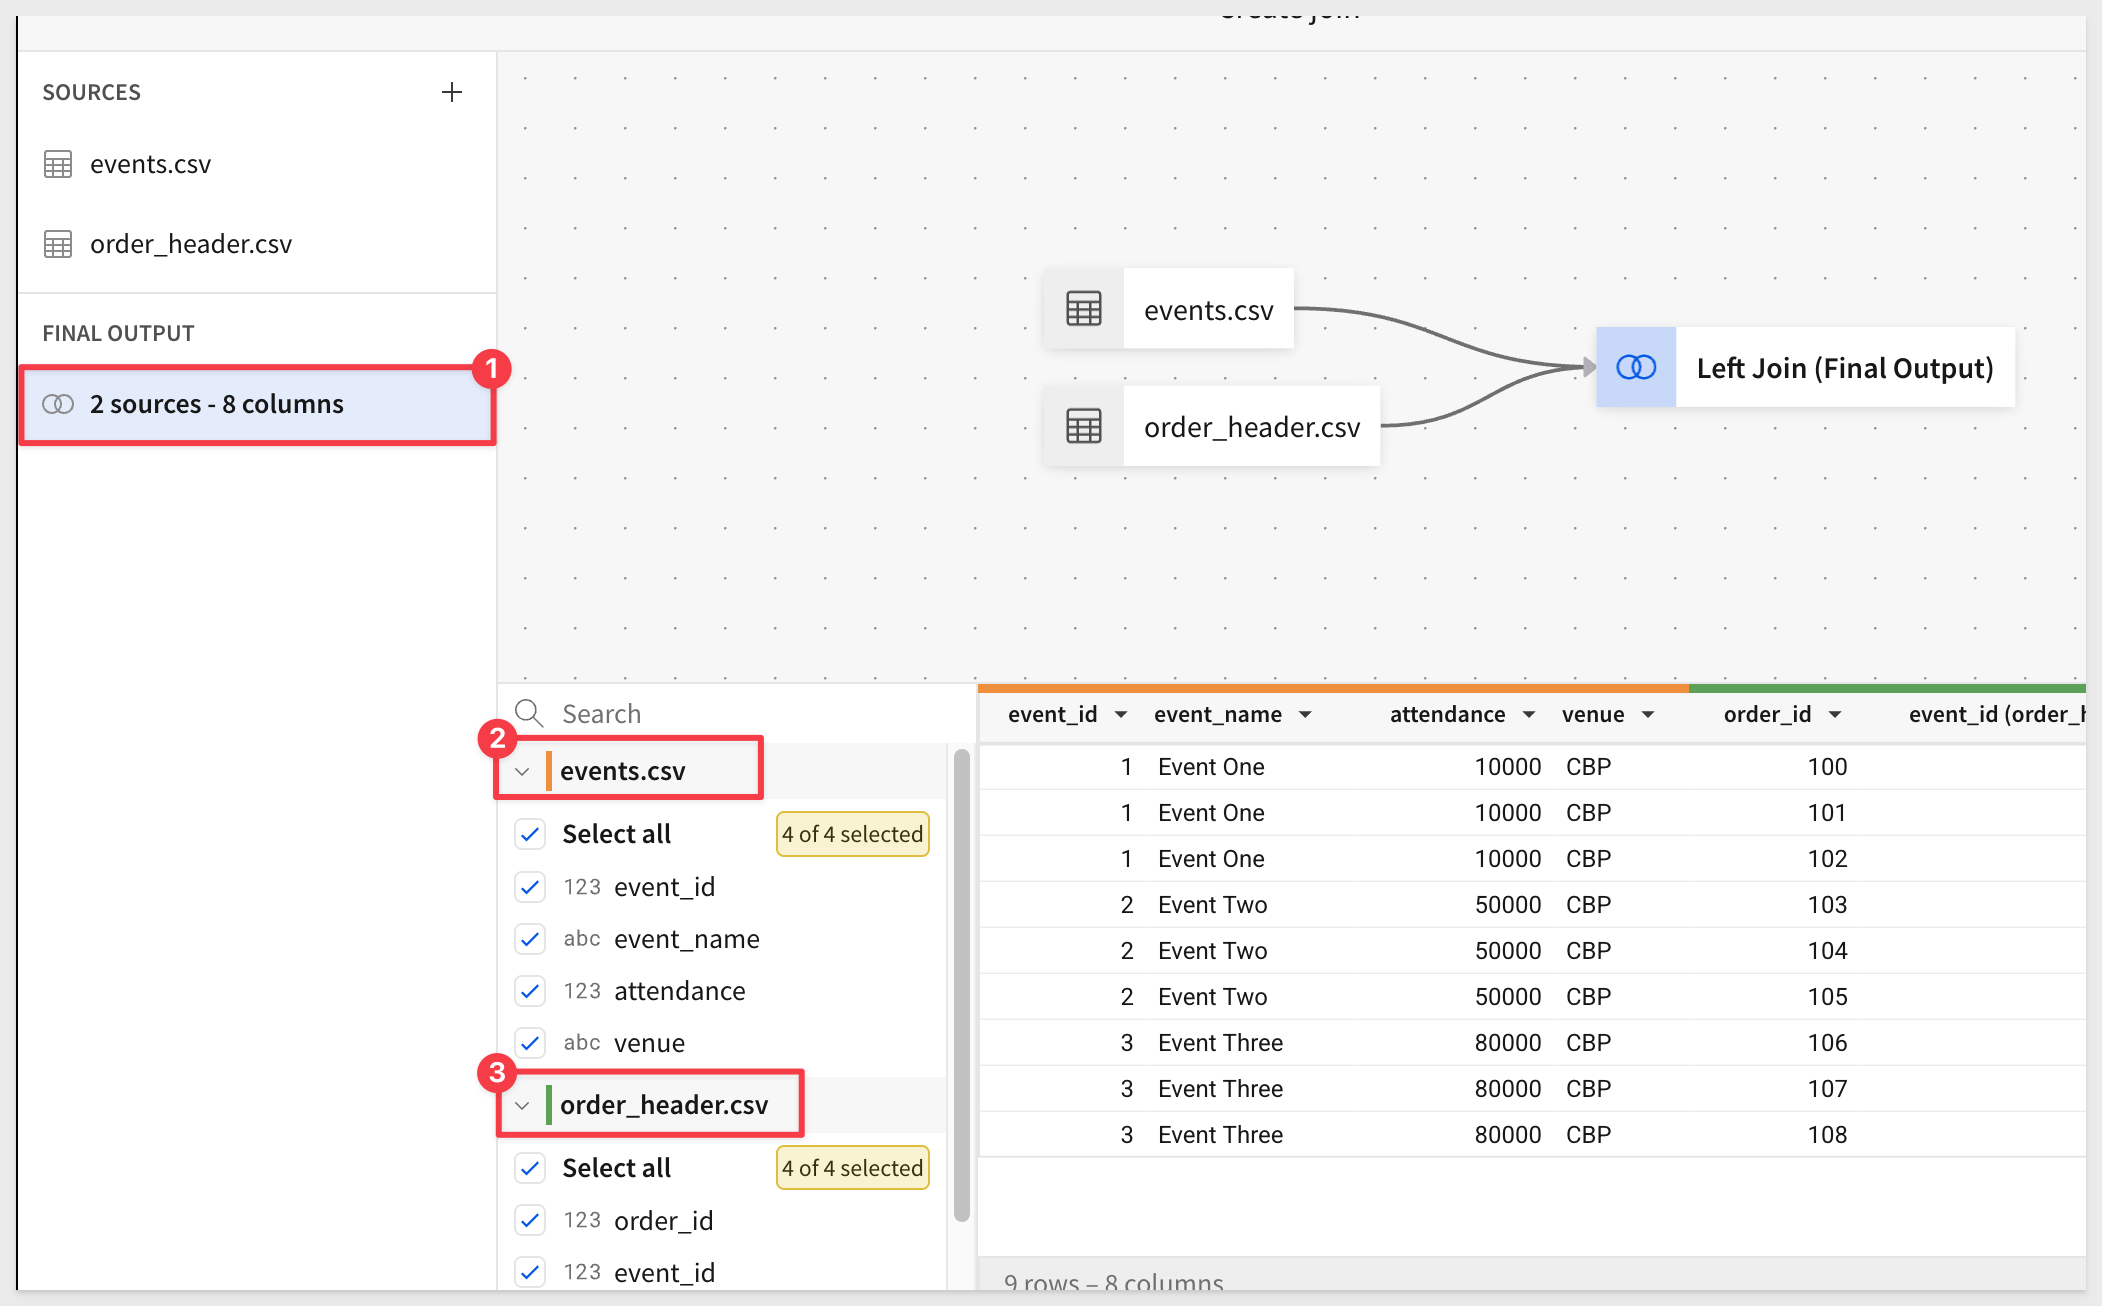
Click Preview output. Sigma shows us the lineage for the join, and we can also adjust which columns are selected (we will take them all):
Click Done. We now have a joined table called events.csv + 1.
Editing a join
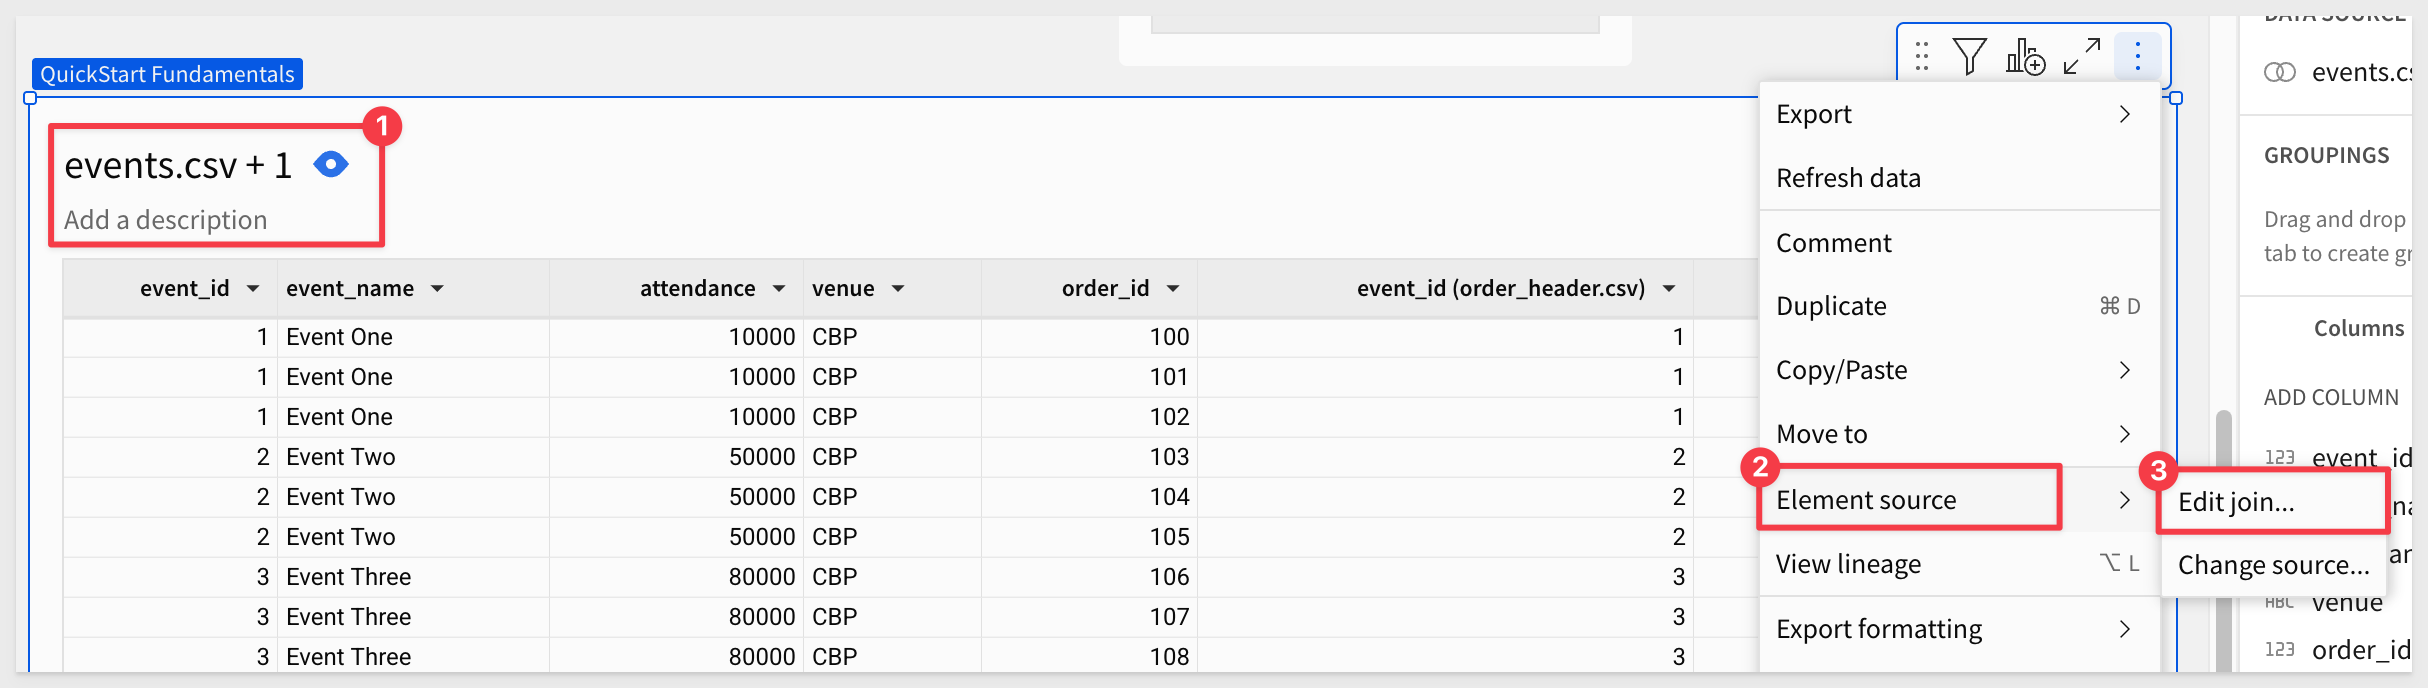
Let's join the order_details table to this table. The process is the same, except this time, we will edit an existing join:
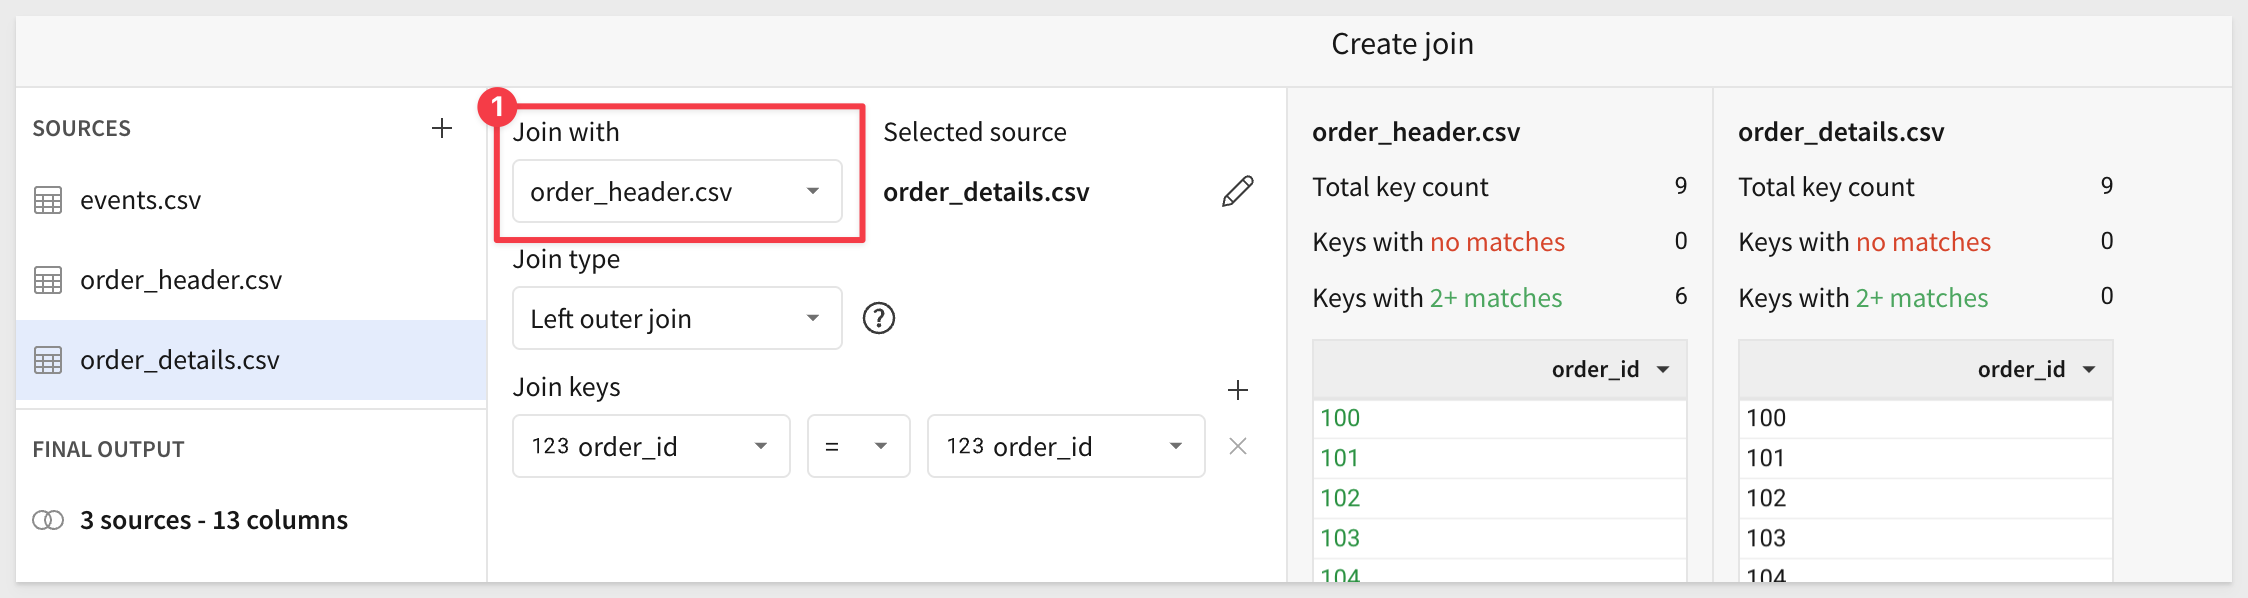
In the Create join UI, click the + icon to add another table, this time selecting order_details.csv from Elements.
Change the Join with to order_header.csv:
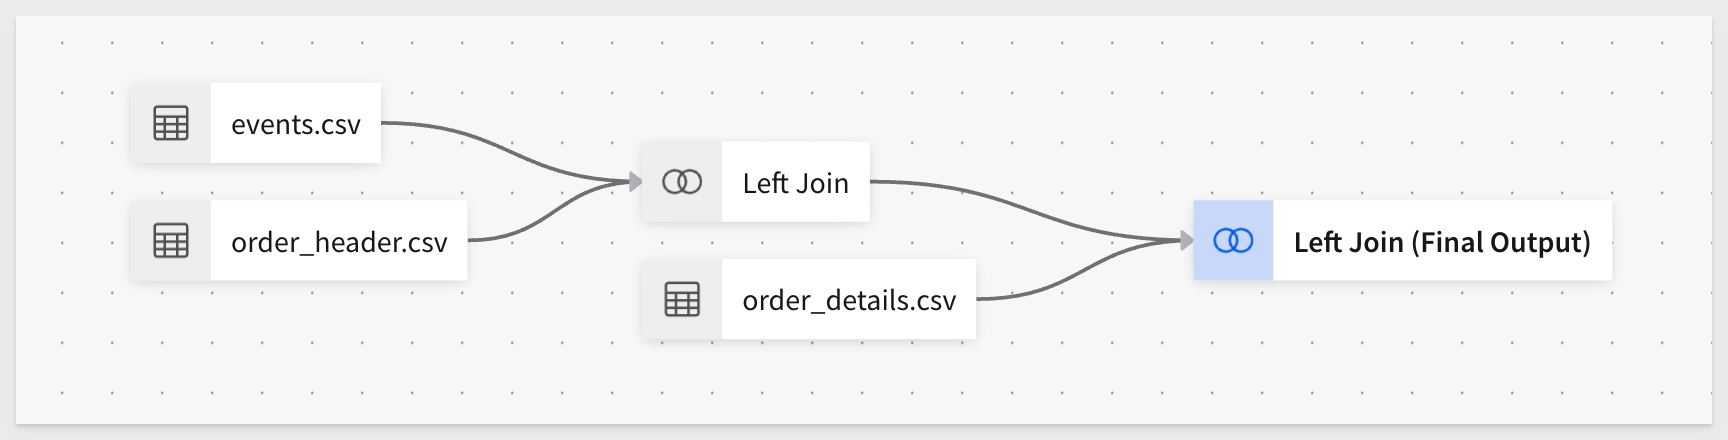
Click Preview output.
The lineage should look like this:
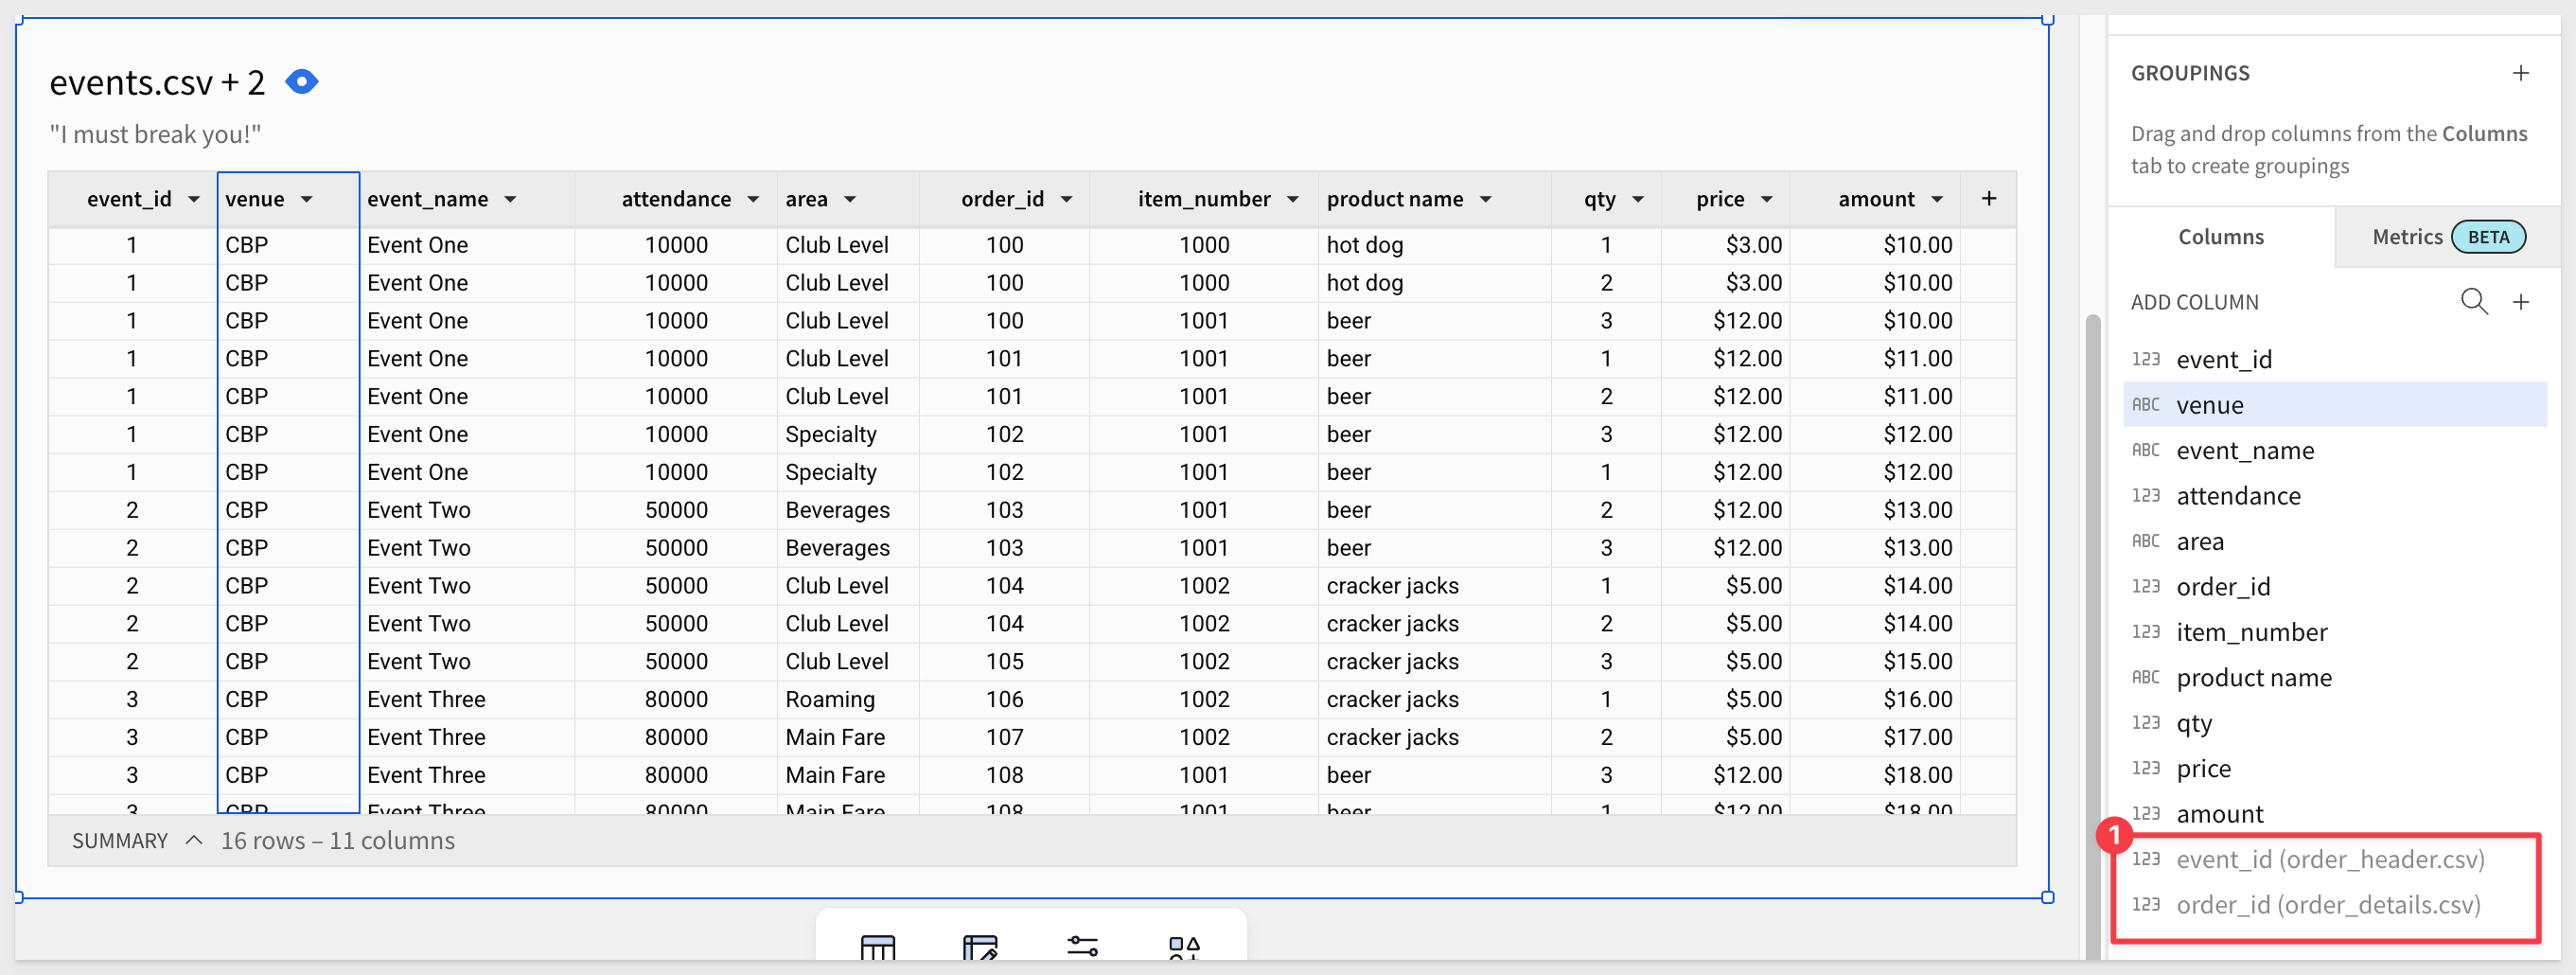
Our joined table is now named events.csv + 2.
After some column formatting, hiding two columns and reordering, it looks like this:
We have created a simple example of a fan trap.
Click Publish.
To make this easier to spot, we can filter the events.csv + 2 table to show only order_id = 100:
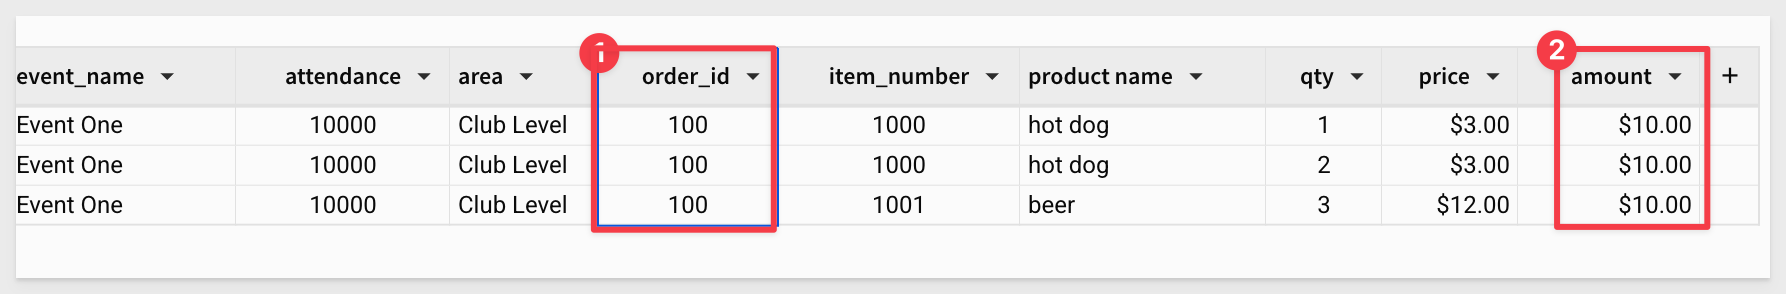
The amount column containing 10 for all rows, is clearly suspicious, especially given that it does not make sense if the calculation should be...
qty * price
... or represent revenue. But we did not have a revenue column to use in the sample data either.
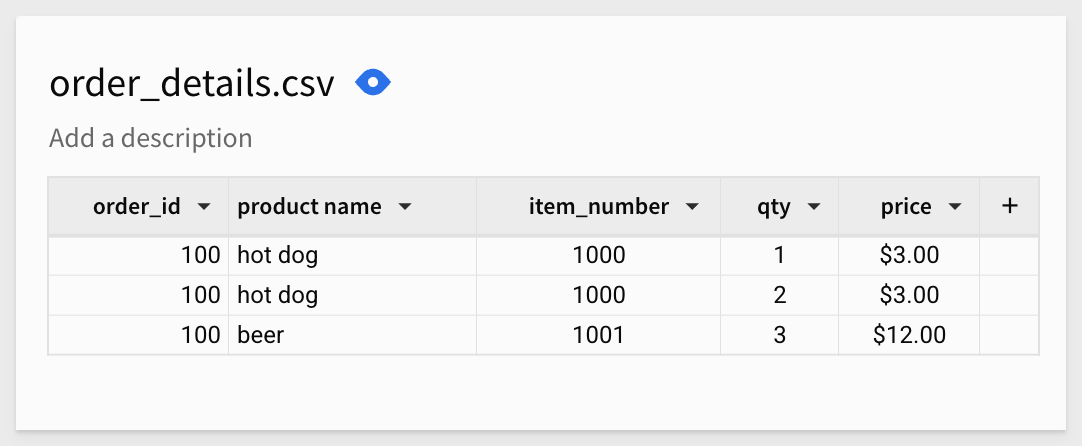
If we filter the order_details.csv table for order_id = 100 we can see that the data looks fine:
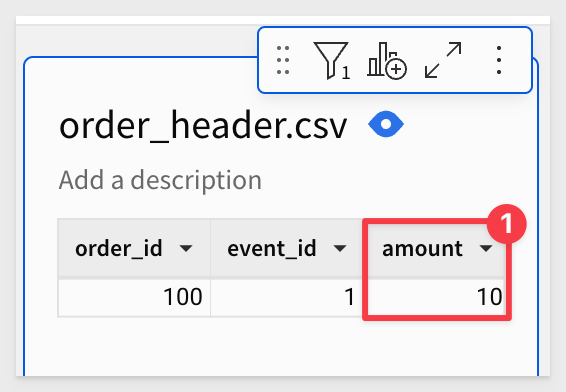
However, if we filter the order_header.csv table for order_id = 100 we can see that the amount is 10 and that is the source of our fan trap issue:
What Went Wrong in the Join?
When we joined order_header to order_details, we introduced a one-to-many relationship.
Each order in order_header can have multiple related products in order_details.
This causes the amount from order_header to be duplicated for every product in the order.
How This Affects the Data
When joined with order_details, each product row inherits the same total amount, which makes it appear that the revenue is much higher than it actually is.
For example, if an order's total amount is $10.00, and that order has three products, the amount appears three times in the joined data. So when we sum the amount column, we incorrectly get:
$10 + $10 + $10 = $30
But the correct total revenue should be calculated as:
SUM(qty * price) per order
...not a repeated sum of the already-totaled amount.
Adjust table visibility and filtering
First, remove the three filters set in the last section.
We want other users to only see the events.csv + 2 table when using this data model.
This is really simple to do; just click the eye icon next to each table's name to disable visibility to other users.
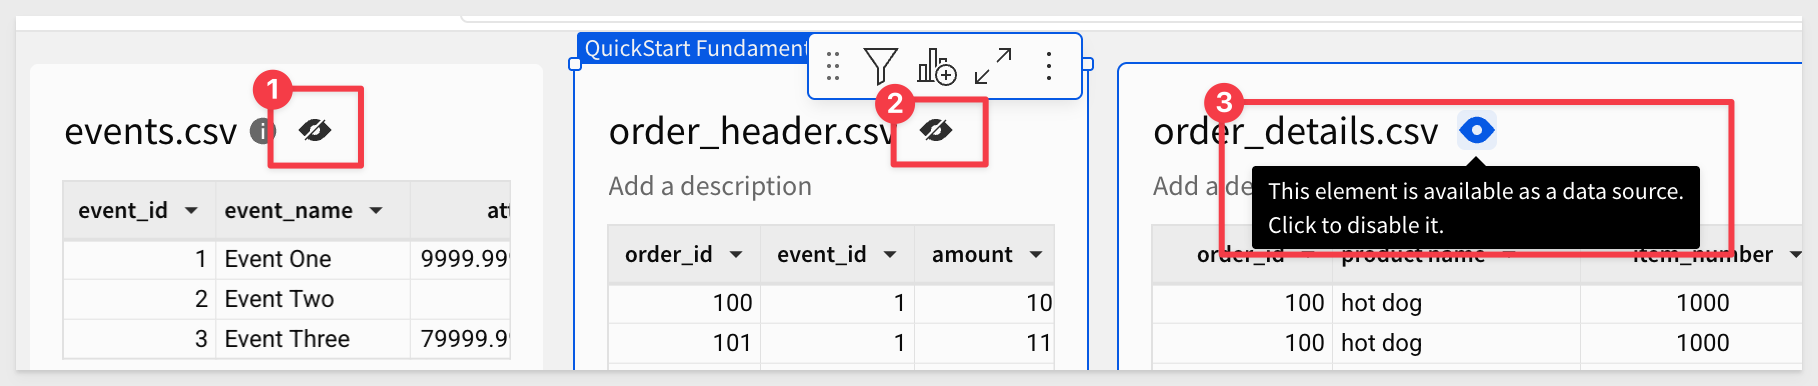
Sigma may warn you; accept that to disable all three and click Publish.
Return to the homepage and create a new workbook.
Add a new Pivot from the Element bar and select the Fan Trap Data Model from the list of available data models. Since it was just created, it should be at the top of the list, but we can also search for it:
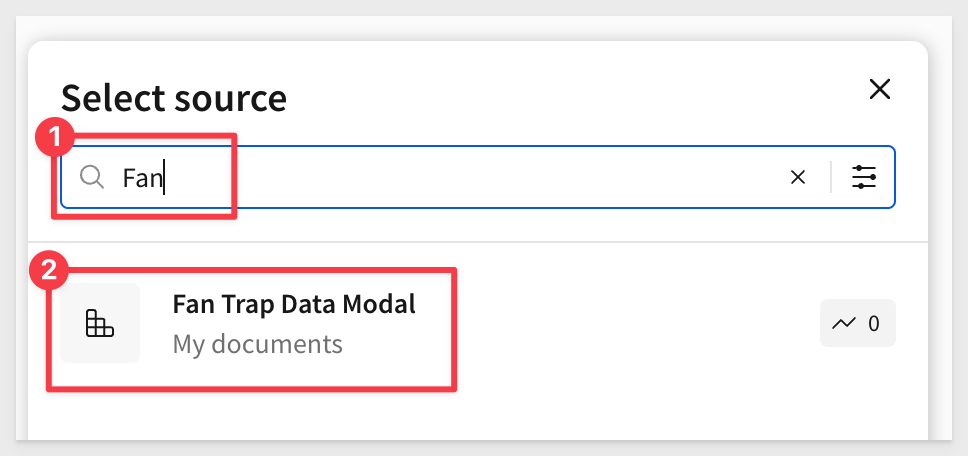
Because table visibility is disabled for the three imported CSV tables, they do not appear in the list:
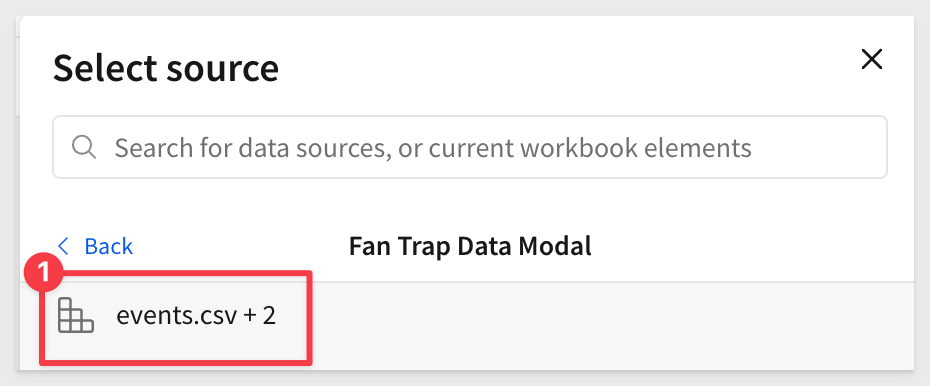
Select the events.csv + 2 table. We now have a pivot to configure.
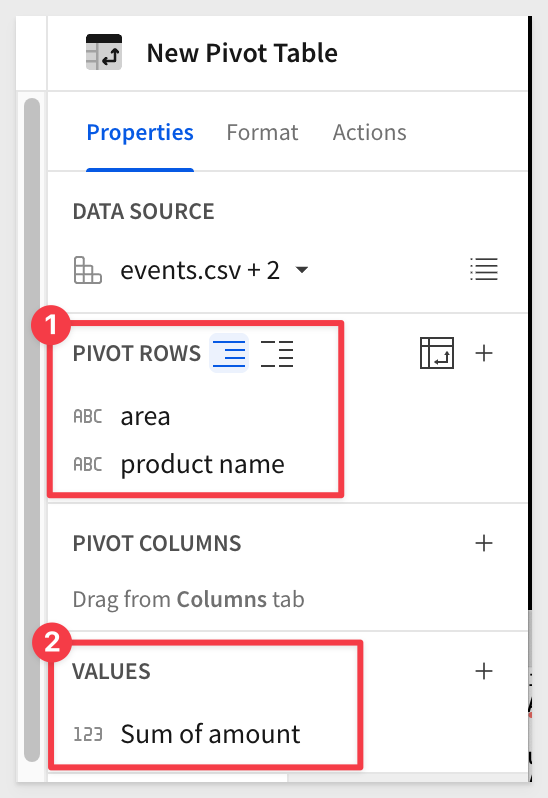
Set the pivot configuration as shown:
Now, we can see that the Total shows $214 but if we add up all the Sum of amount rows, we get a total of 428.
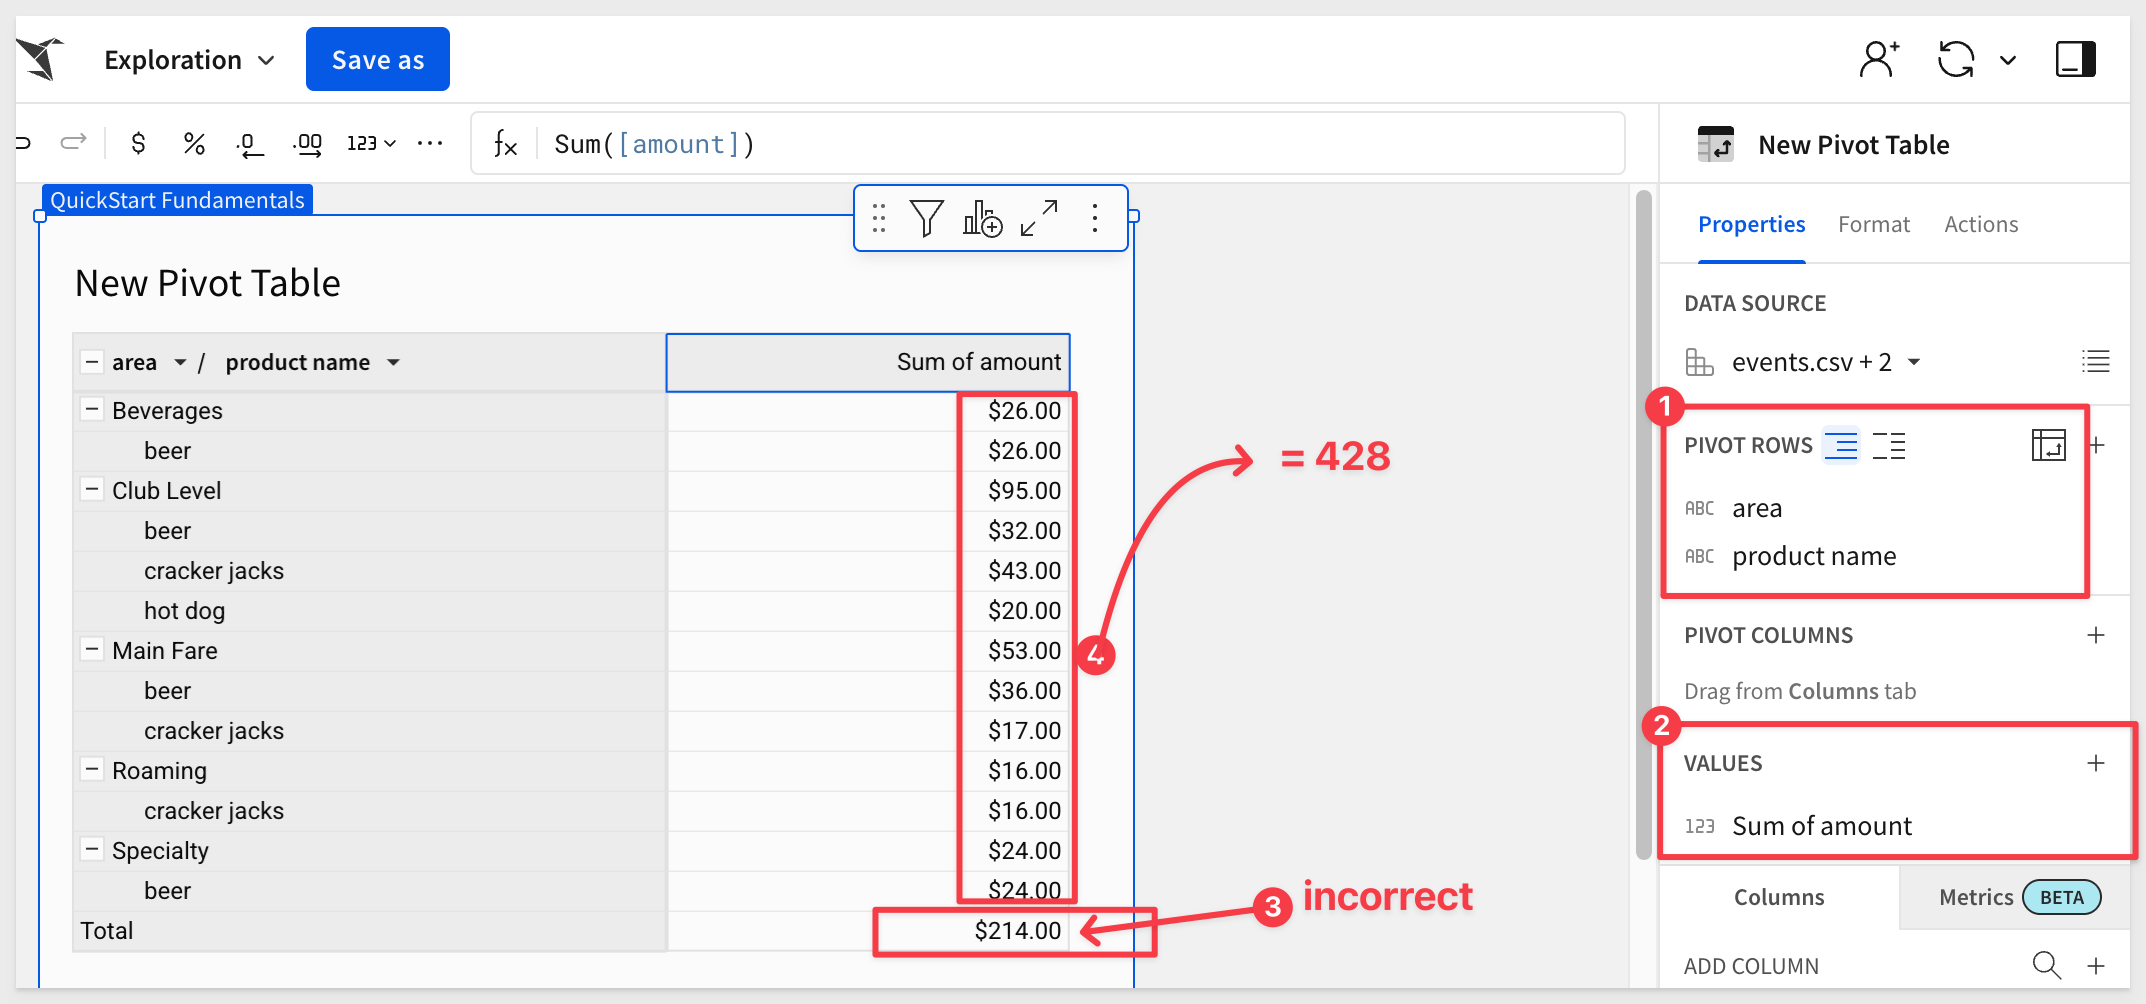
This is how a fan trap can cause real problems, as the issue propagates into downstream reports.
Save the workbook as Fan Trap QuickStart.
We could just resolve this in our data model or workbook, but instead, let's use a solution that is reusable.
Create the Snowflake function
Log into a Snowflake instance with ACCOUNTADMIN permission.
Open a new SQL worksheet and run the following commented script:
-- This will work in Snowflake trials. Adjust for your environment as required.
USE DATABASE SNOWFLAKE_SAMPLE_DATA;
USE SCHEMA TPCH_SF1;
CREATE DATABASE IF NOT EXISTS SIGMA_QUICKSTARTS;
USE DATABASE SIGMA_QUICKSTARTS;
CREATE SCHEMA IF NOT EXISTS CUSTOM_FUNCTIONS;
USE SCHEMA CUSTOM_FUNCTIONS;
------------------------------------------------------------
-- SUM_DISTINCT as AGGREGATE FUNCTION
-- Purpose: Sum values only once per unique key (e.g., order_id)
-- Useful for resolving fan traps where values would otherwise be duplicated in joins.
------------------------------------------------------------
CREATE OR REPLACE AGGREGATE FUNCTION CUSTOM_FUNCTIONS.SumDistinctAgg(id STRING, val FLOAT)
RETURNS FLOAT
LANGUAGE PYTHON
RUNTIME_VERSION=3.9
HANDLER = 'SumDistinct'
AS $$
# Define the class that Snowflake will use to process the aggregation
class SumDistinct:
# Constructor: initialize a dictionary to store unique key-value pairs
def __init__(self):
self._values = {}
# This exposes the current aggregate state (our dictionary) to Snowflake
@property
def aggregate_state(self):
return self._values
# Called for each row: store the value if both key and value are not None
# Overwrites previous value if the same key appears again
def accumulate(self, id, val):
if id is None or val is None:
return
self._values[id] = val
# Called when combining results from parallel executions (e.g., across partitions)
# Merges dictionaries by updating keys with new ones (no deduplication needed here)
def merge(self, other_values):
if other_values:
self._values.update(other_values)
# Called at the end of aggregation: returns the final sum of all distinct values
def finish(self):
return sum(self._values.values()) if self._values else 0.0
$$;
GRANT USAGE ON DATABASE SIGMA_QUICKSTARTS TO ROLE ACCOUNTADMIN;
GRANT USAGE ON SCHEMA SIGMA_QUICKSTARTS.CUSTOM_FUNCTIONS TO ROLE ACCOUNTADMIN;
GRANT USAGE ON FUNCTION SIGMA_QUICKSTARTS.CUSTOM_FUNCTIONS.SUMDISTINCTAGG(STRING, FLOAT) TO ROLE ACCOUNTADMIN;
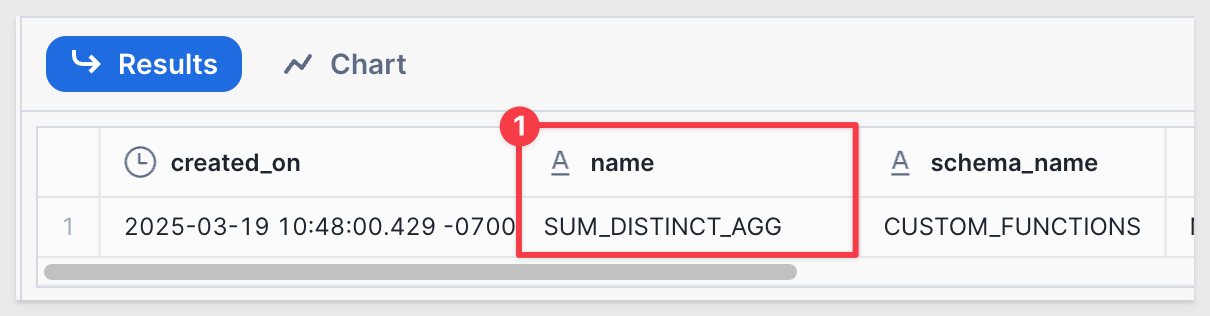
SHOW USER FUNCTIONS IN SCHEMA CUSTOM_FUNCTIONS;
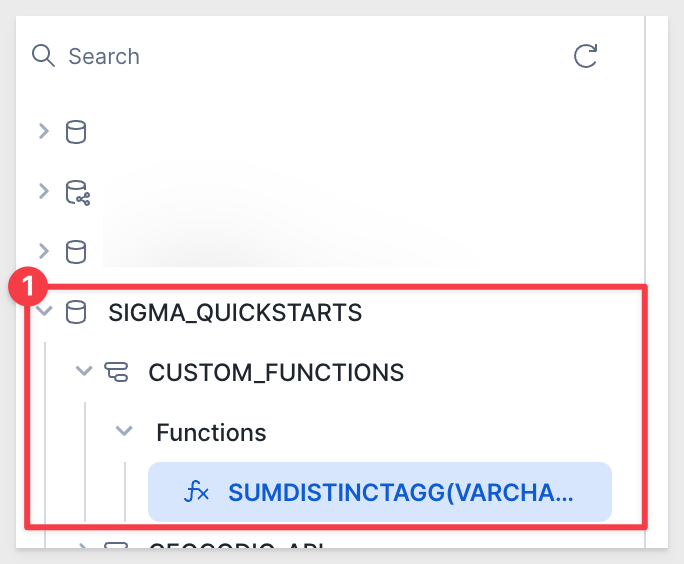
Once complete, the new function will be listed:
This Snowflake script:
- Prevents double counting by ensuring each id only contributes one distinct value.
- Handles large datasets efficiently using Python dictionaries.
- Works with Snowflake's distributed processing (via merge).
- Final result is a deduplicated sum of all values.
Sigma custom function
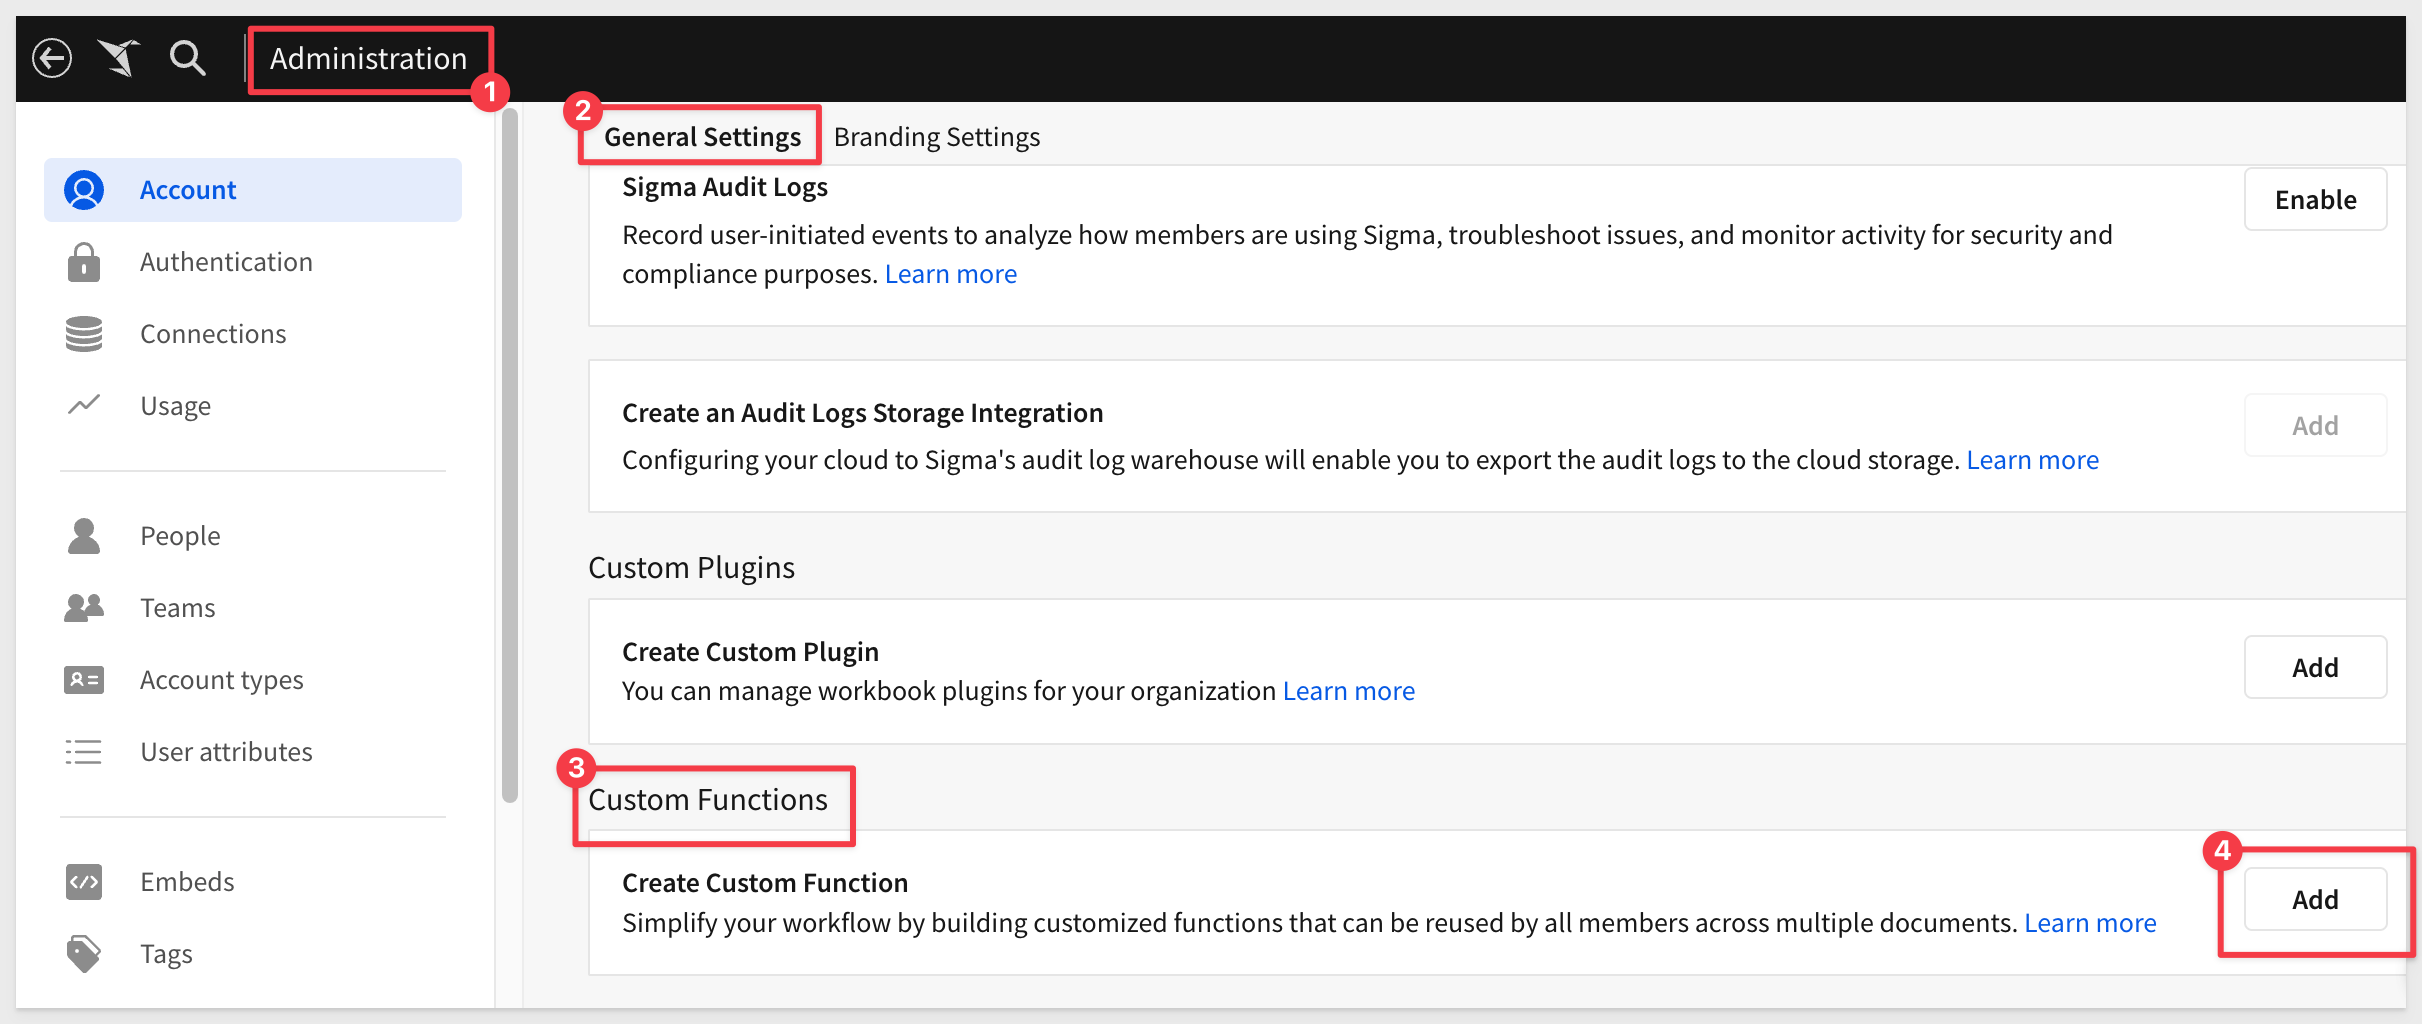
In Sigma, navigate to Administration > General Settings and scroll to the bottom to find Custom Functions. Click Add:
Configure the new custom function as:
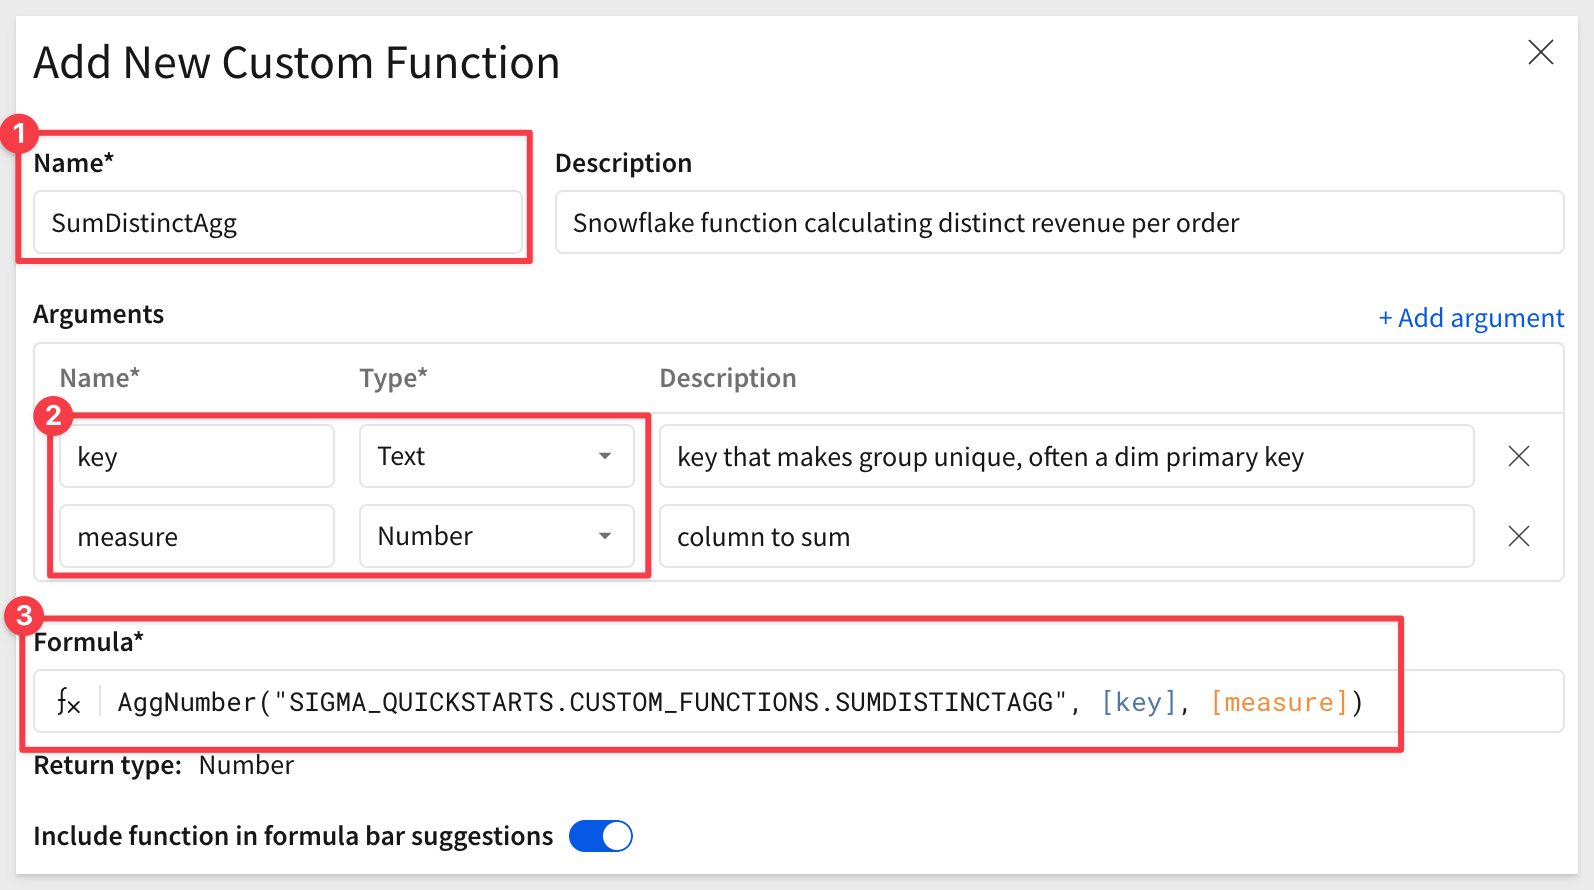
Here are the values to save typing:
Name:        SumDistinctAgg
key          key that makes group unique, often a dim primary key
measure      column to sum
Formula:     AggNumber("SIGMA_QUICKSTARTS.CUSTOM_FUNCTIONS.SUMDISTINCTAGG", [key], [measure])
In the formula, we are taking advantage of Sigma's AggNumber function.
The AggNumber function calls our SUMDISTINCTAGG warehouse aggregate function, passing in the key and measure values.
Click Save.
We want the data model to be the accurate source of information for our use case. With that in mind, we want to add a metric to the data model and not the workbook.
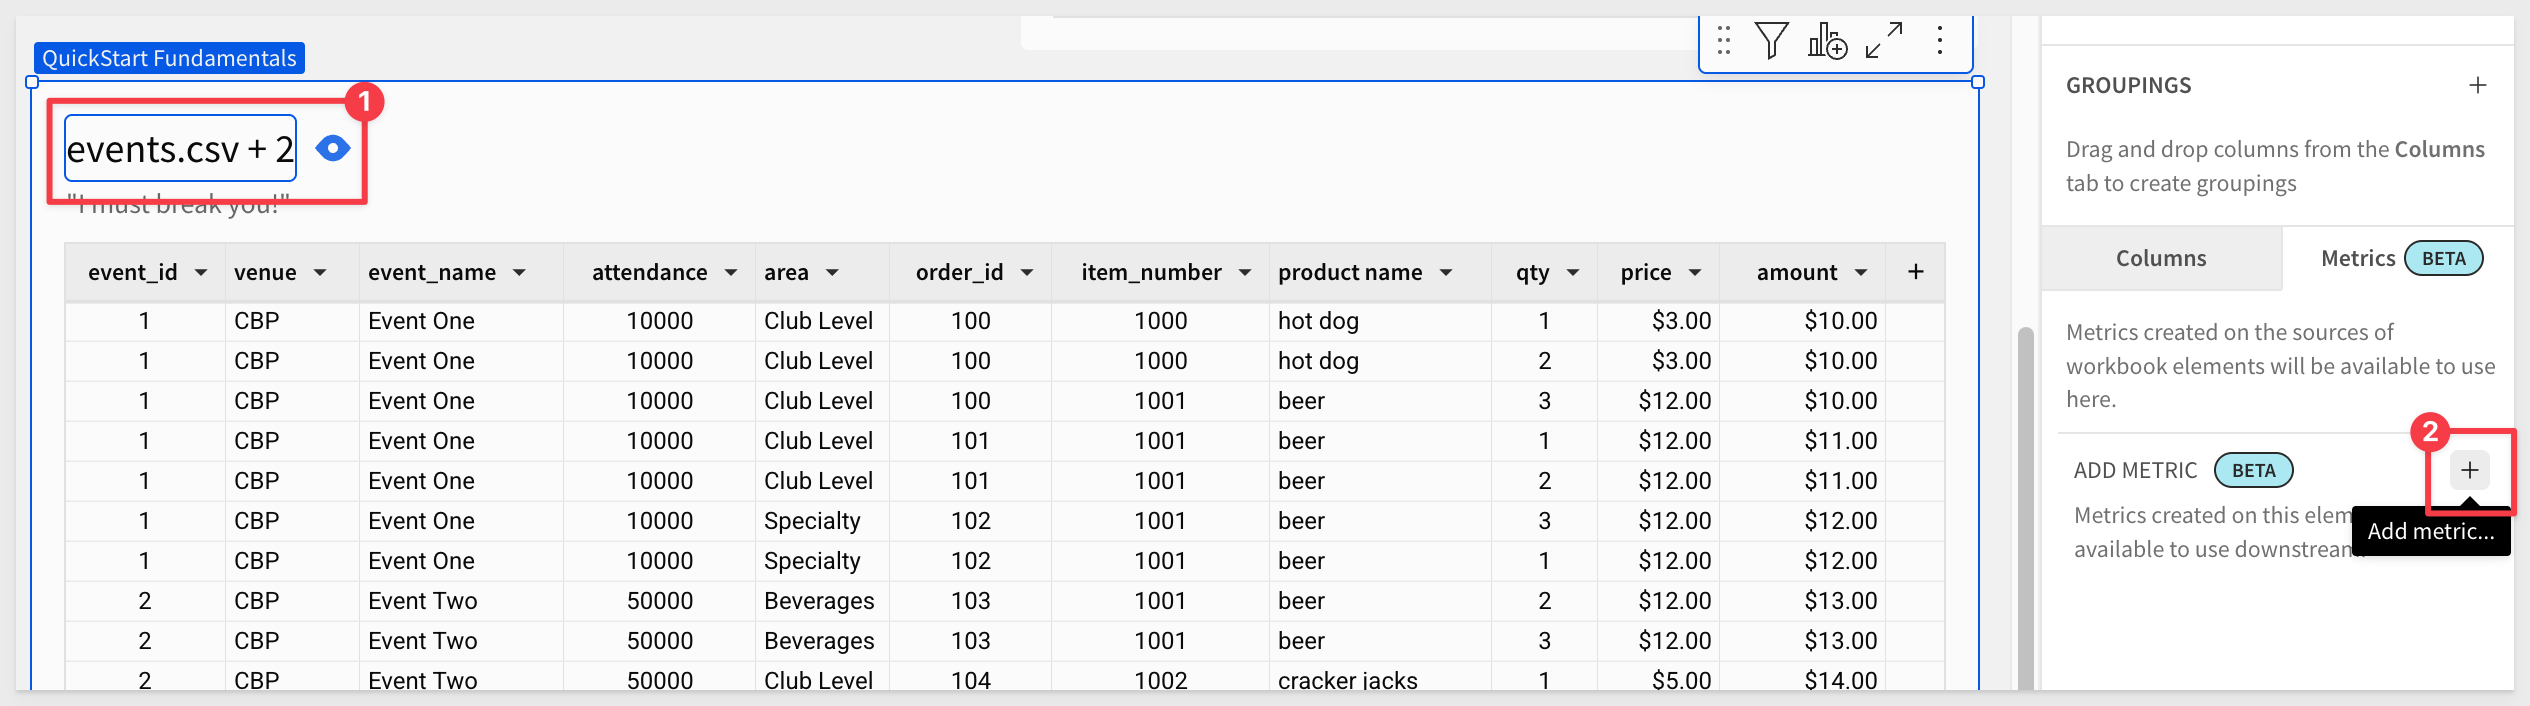
Open the Fan Trap Data Model, click edit and then click on the events.csv + 2 table.
Click Metrics in the Element panel and click + to add a new metric:
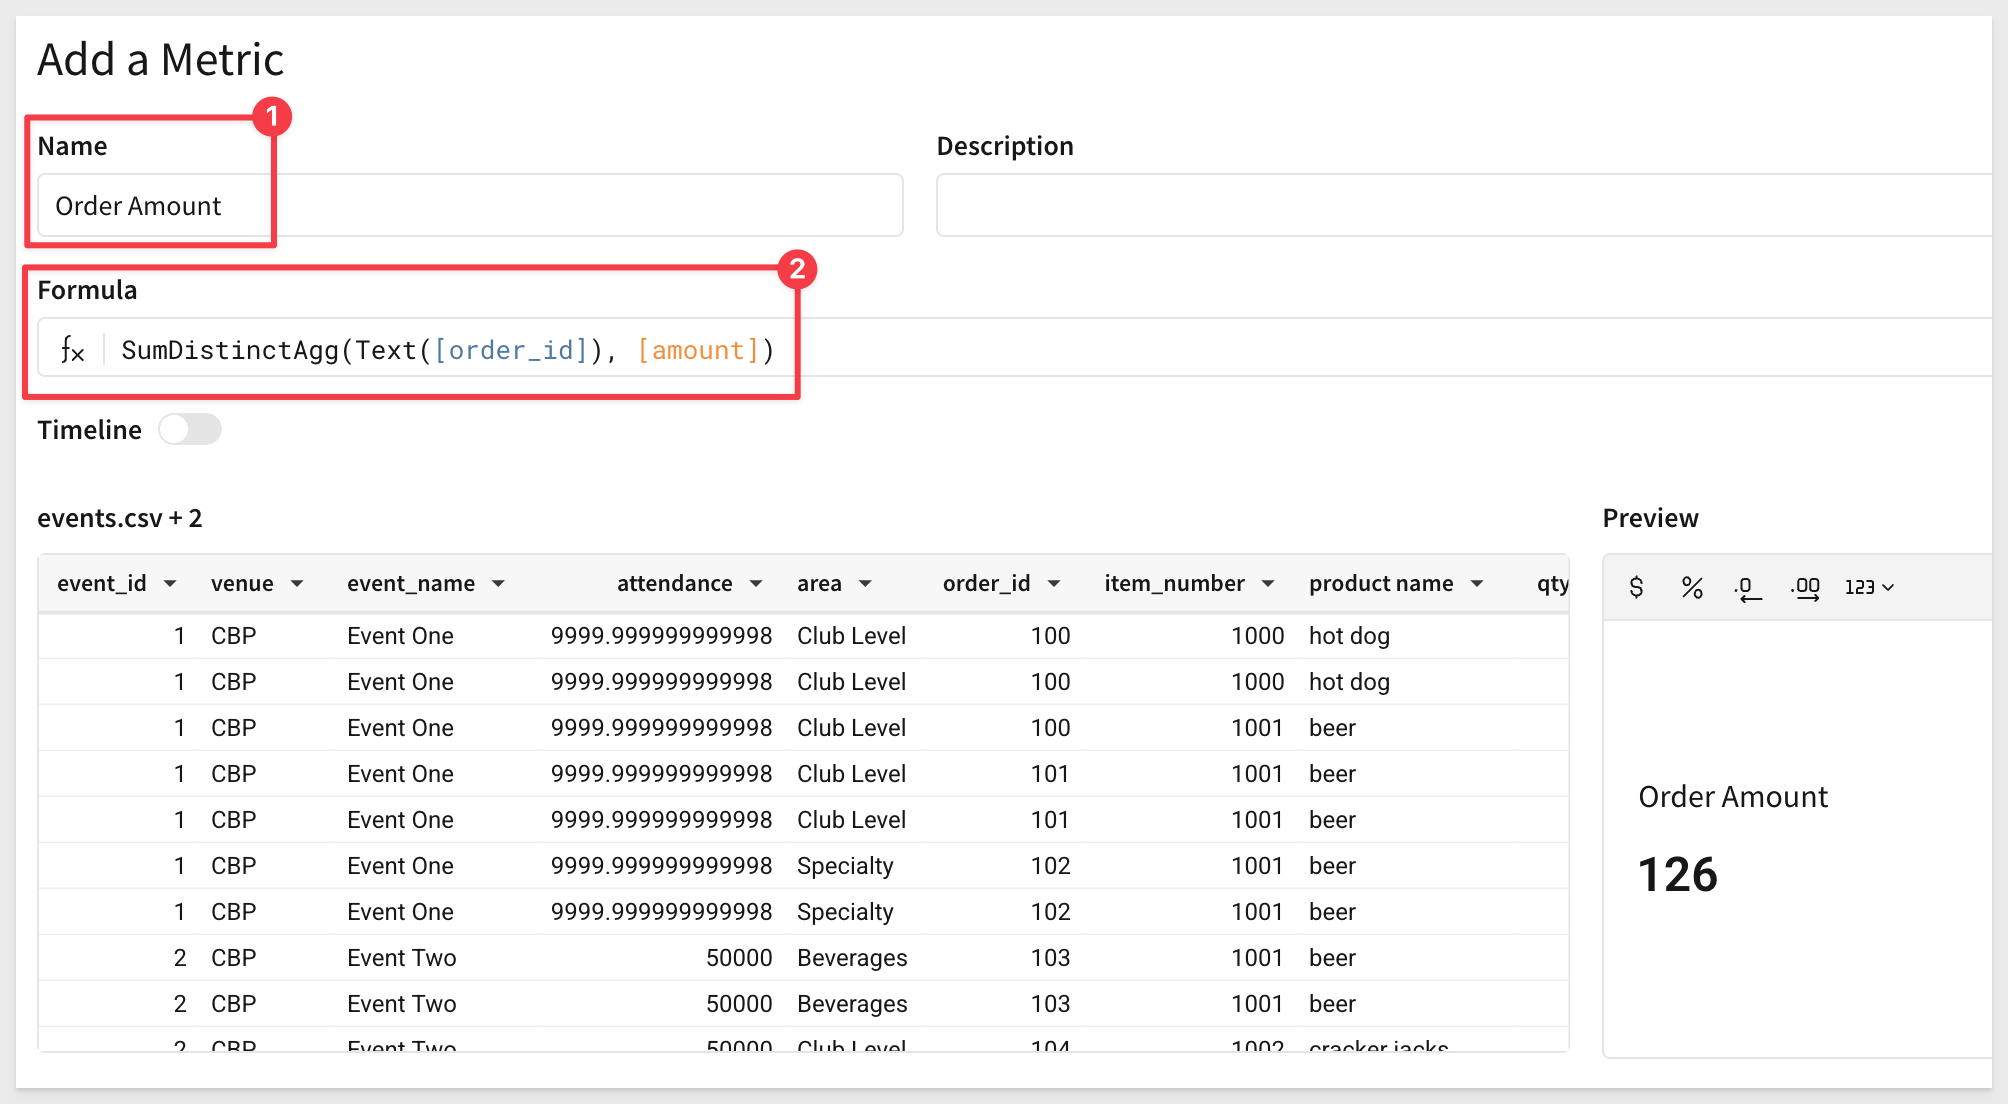
Configure the metric as shown.
Here are the values to save typing:
Name:        Order Amount
Formula:     SumDistinctAgg([order_id], [amount])
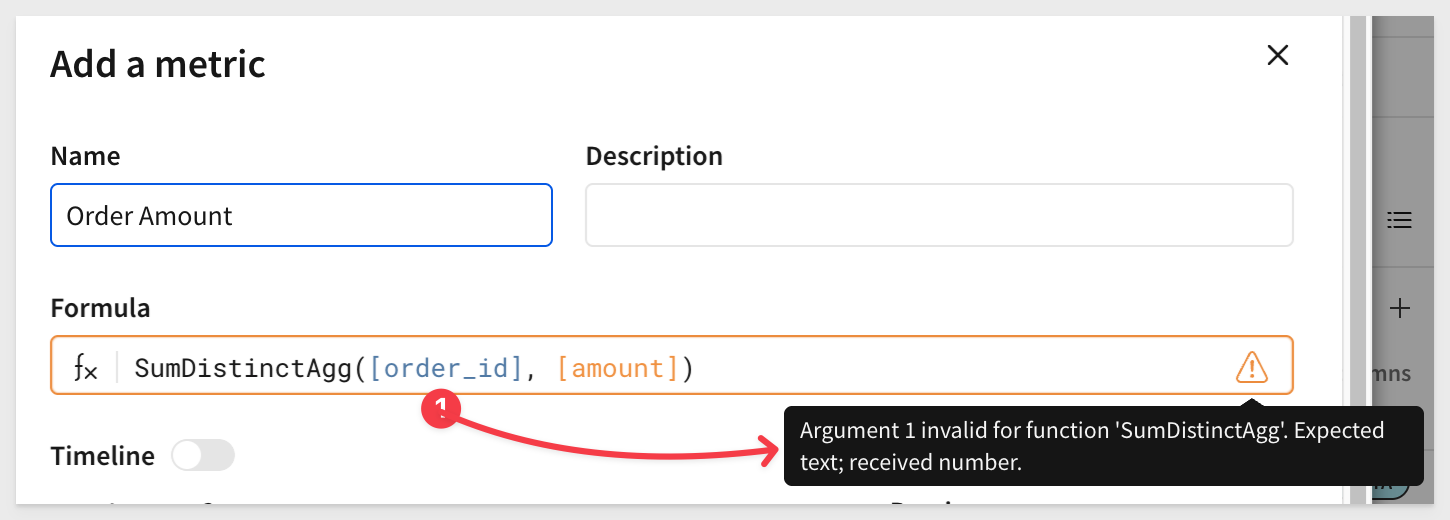
Sigma is warning us about a problem in our formula.
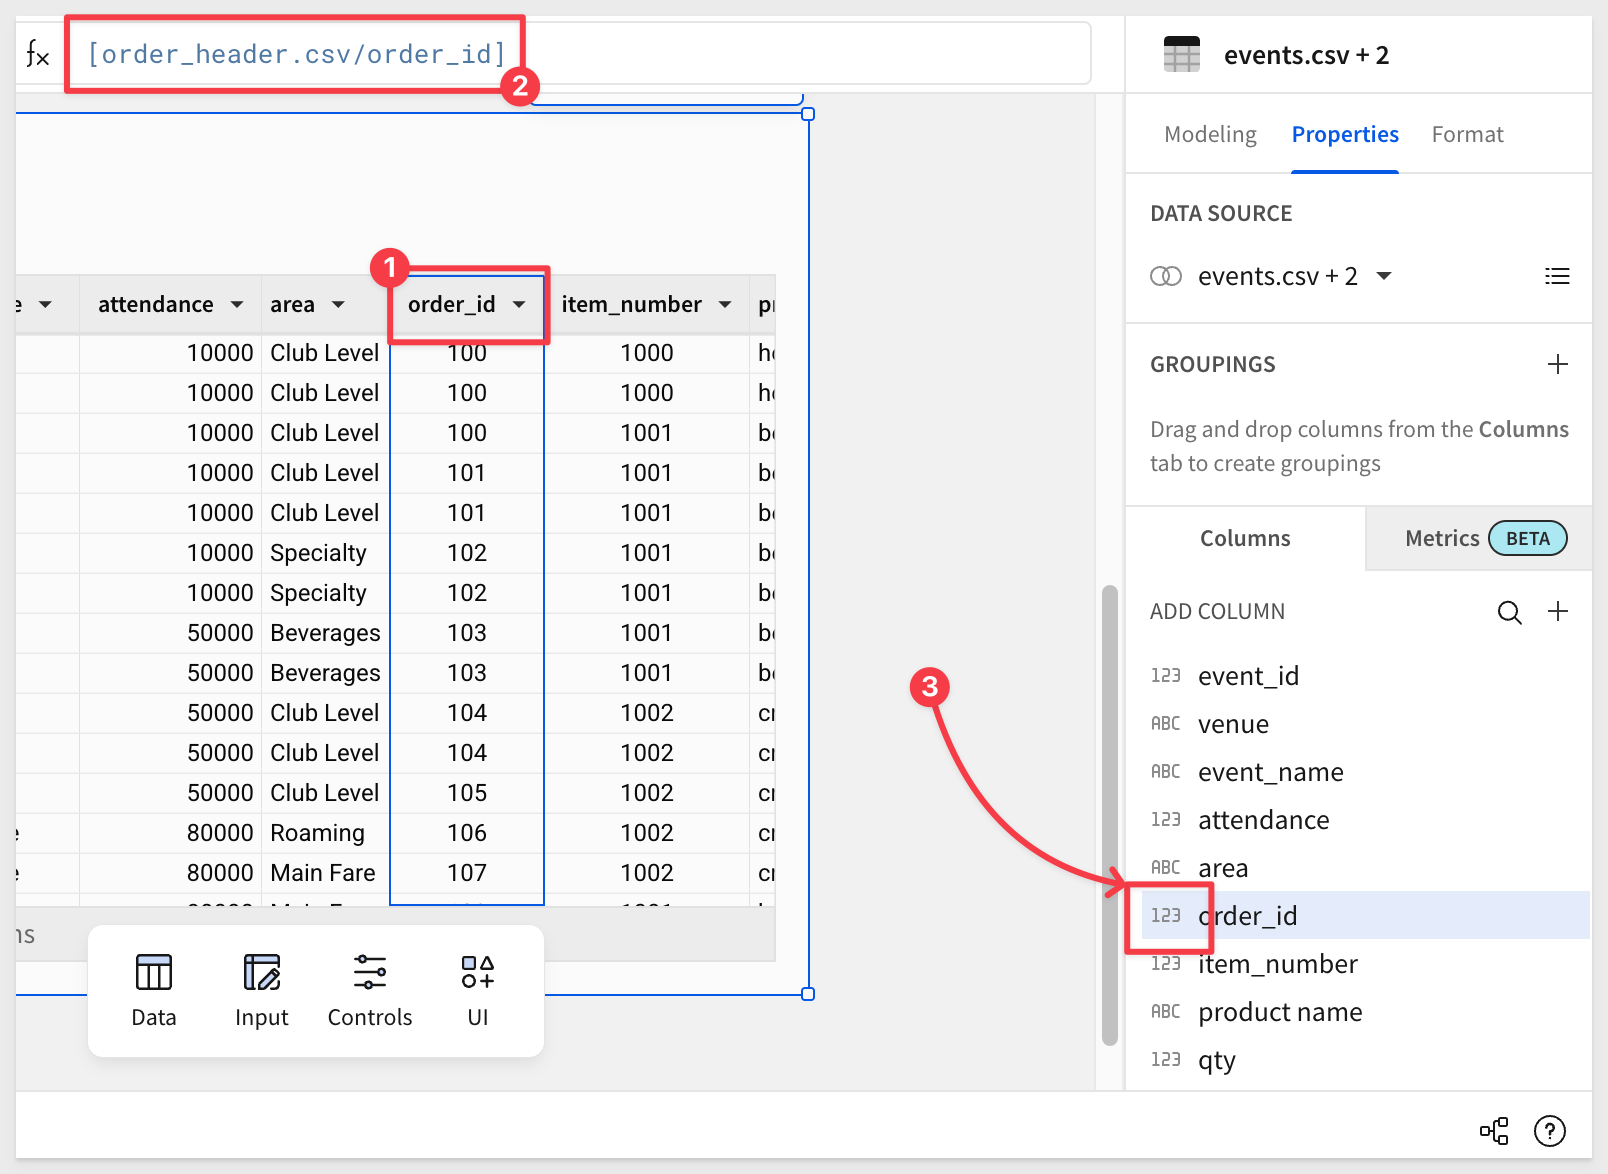
Close the formula editor. A quick check of the order_id column reveals that it is a NUMBER datatype. Our function is expecting TEXT for the key, so this is why the formula warning:
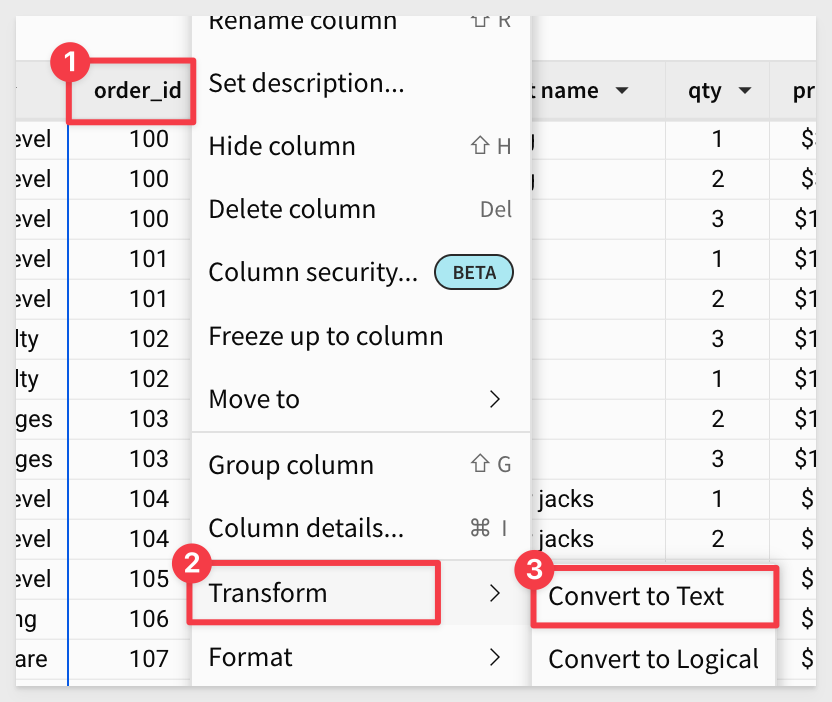
Open the order_id column menu and select Transform > Convert to Text:
Sigma applies a text function to the order_id column. To make the values cleaner, we can also trim any trailing zeros:
Trim(Text([order_header.csv/order_id]))
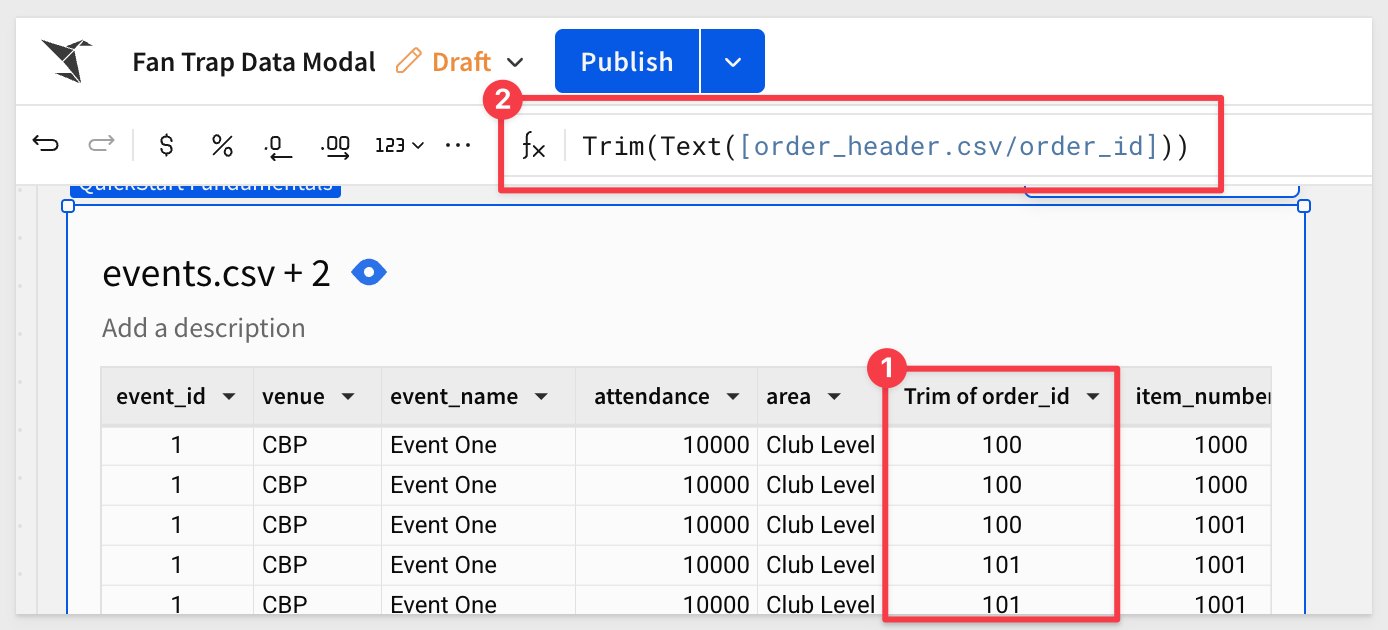
Rename the Trim of order_id back to order_id.
With that solved, go ahead and add the metric to the events.csv + 2 table as before:
Make sure to click Save once the metric is configured.
Click Publish.
Return to the Fan Trap QuickStart workbook and click edit.
We can see the Order Amount metric listed.
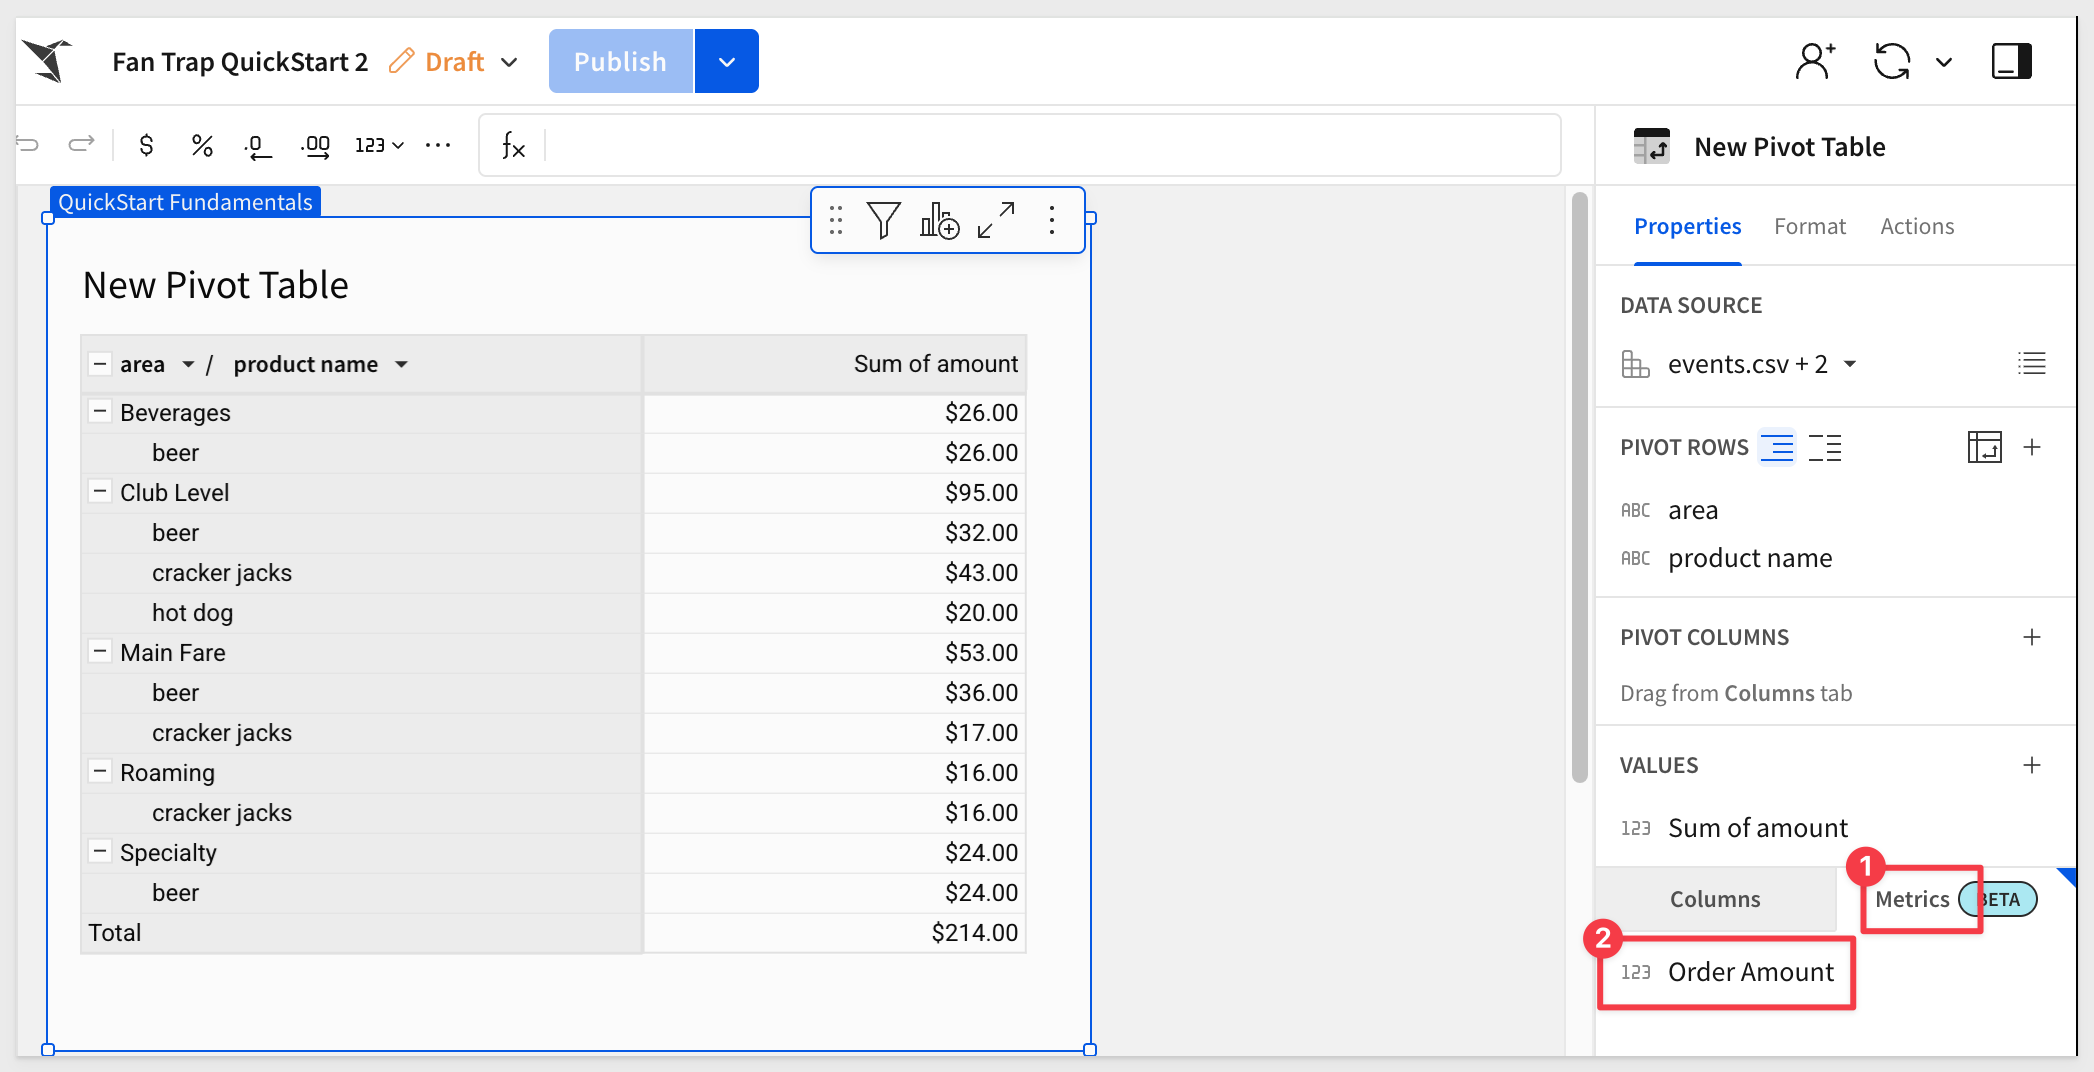
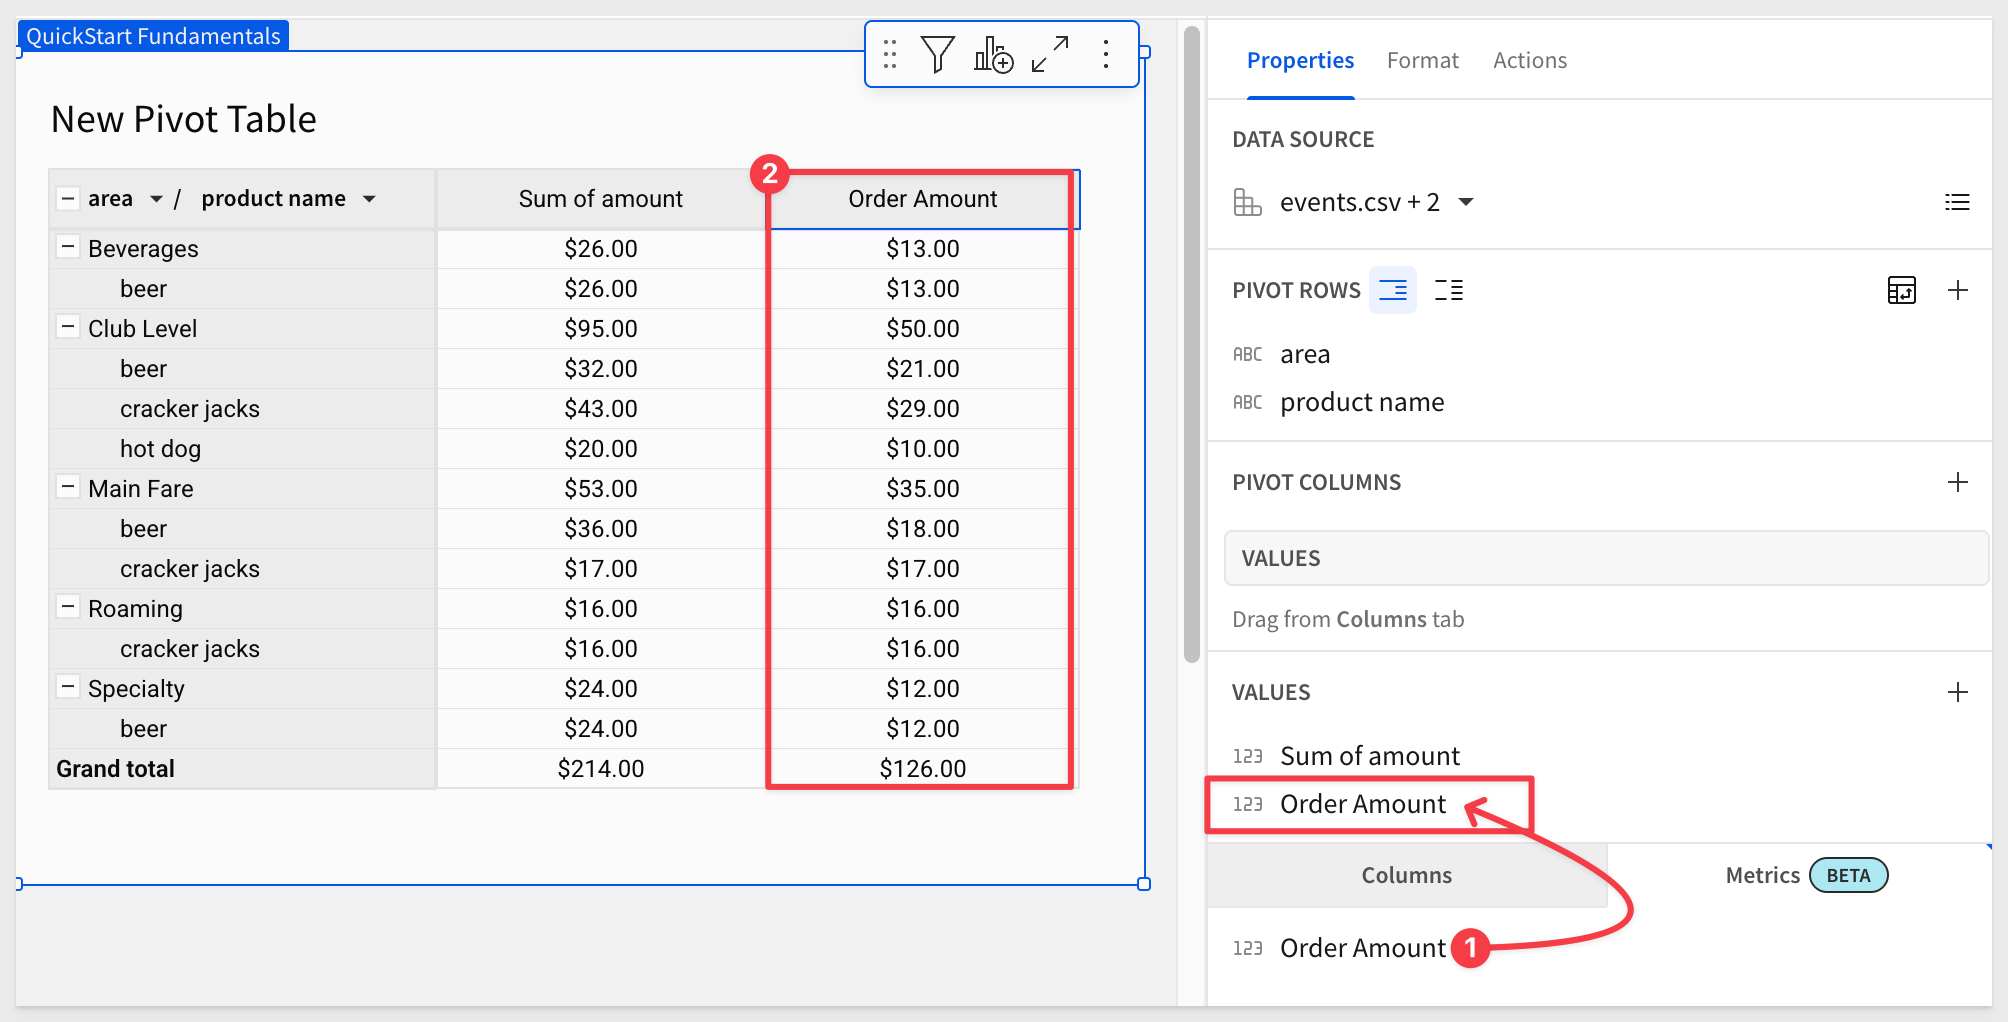
Add the Order Amount metric to the VALUES group. After some column formatting for currency, we can clearly see the differences between the two columns.
Sum of Amount is incorrect while Order Amount is correct and the fan trap is resolved:
Now that we understand how to use custom functions to resolve a fan trap, we can apply this same logic to order important metrics.
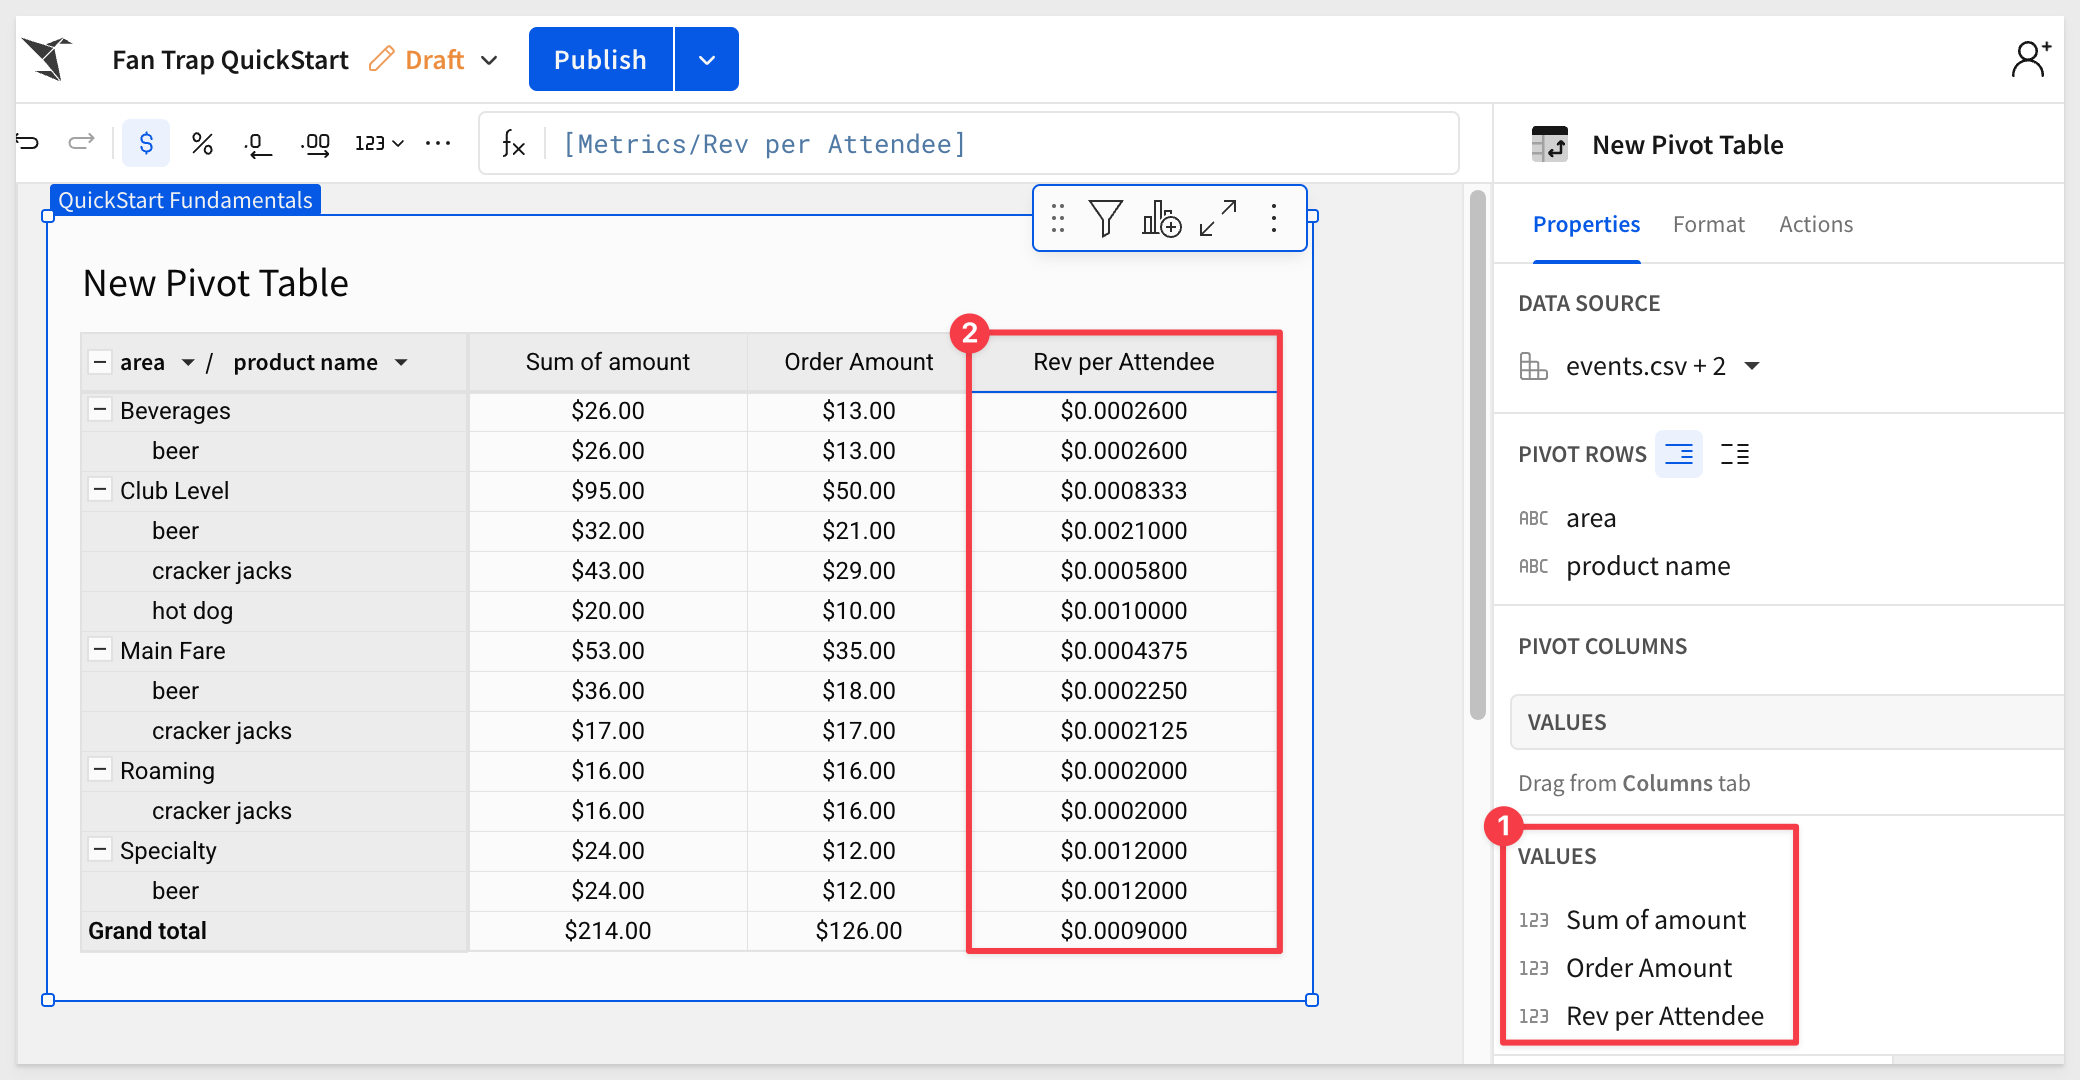
For example, suppose we want to calculate revenue per attendee?
We can create another metric, reusing our existing custom function and simply adjusting for different key/measure values, columns and calculation:
SumDistinctAgg(Text([order_id]), [amount]) / SumDistinctAgg(Text([event_id]), [attendance])
This formula correctly calculates revenue per attendee by dividing:
- Total order amount (ensuring no duplication from multiple products per order).
- Total event attendance (ensuring no duplication from multiple orders per event).
Using this formula avoids issues where multiple joins would otherwise inflate revenue per person. It also allows us to reuse the warehouse function via a Sigma custom function.
To be complete, the result looks like this:
In this QuickStart, we explored how a fan trap can lead to inflated metrics due to unintended duplication in one-to-many joins. We demonstrated how to identify the issue, and then resolved it using a reusable Snowflake UDAF integrated into Sigma as a custom function.
This approach ensures accurate aggregation across complex joins and provides a repeatable solution for other metrics as well. With these tools, you're now equipped to prevent fan traps and build more reliable data models in Sigma.
Additional Resource Links
Blog
Community
Help Center
QuickStarts
Be sure to check out all the latest developments at Sigma's First Friday Feature page!