This QuickStart is part of a series designed to instruct new users on how to use Sigma to explore and analyze data using tables.
We will be working with some common sales data from our fictitious company Plugs Electronics, reusing content we created in the QuickStart "Fundamentals 1: Getting Around".
If you're familiar with traditional spreadsheet tools, such as Excel, you are likely to associate data and formulas with individual cells. While Sigma tables are very spreadsheet-like, data is managed at the column level rather than at the individual cell level. This means actions such as calculations and formatting changes are applied to every cell in a column.
Managing data at the column level ensures consistency and accuracy, preventing common errors across large and ever-growing sets of data.
Prerequisites
- A computer with a current browser. It does not matter which browser you want to use.
- Completion of the QuickStart Fundamentals 1: Getting Around
- Access to your Sigma environment. A Sigma trial environment is acceptable and preferred.
- If have not already, you can sign up for a Sigma Trial here:
For more information on Sigma's product release strategy, see Sigma product releases.
Our starting point is the Plugs Sales workbook created in the Fundamentals 1: Getting Around QuickStart.
In Sigma, open the workbook Fundamentals and place it in edit mode.
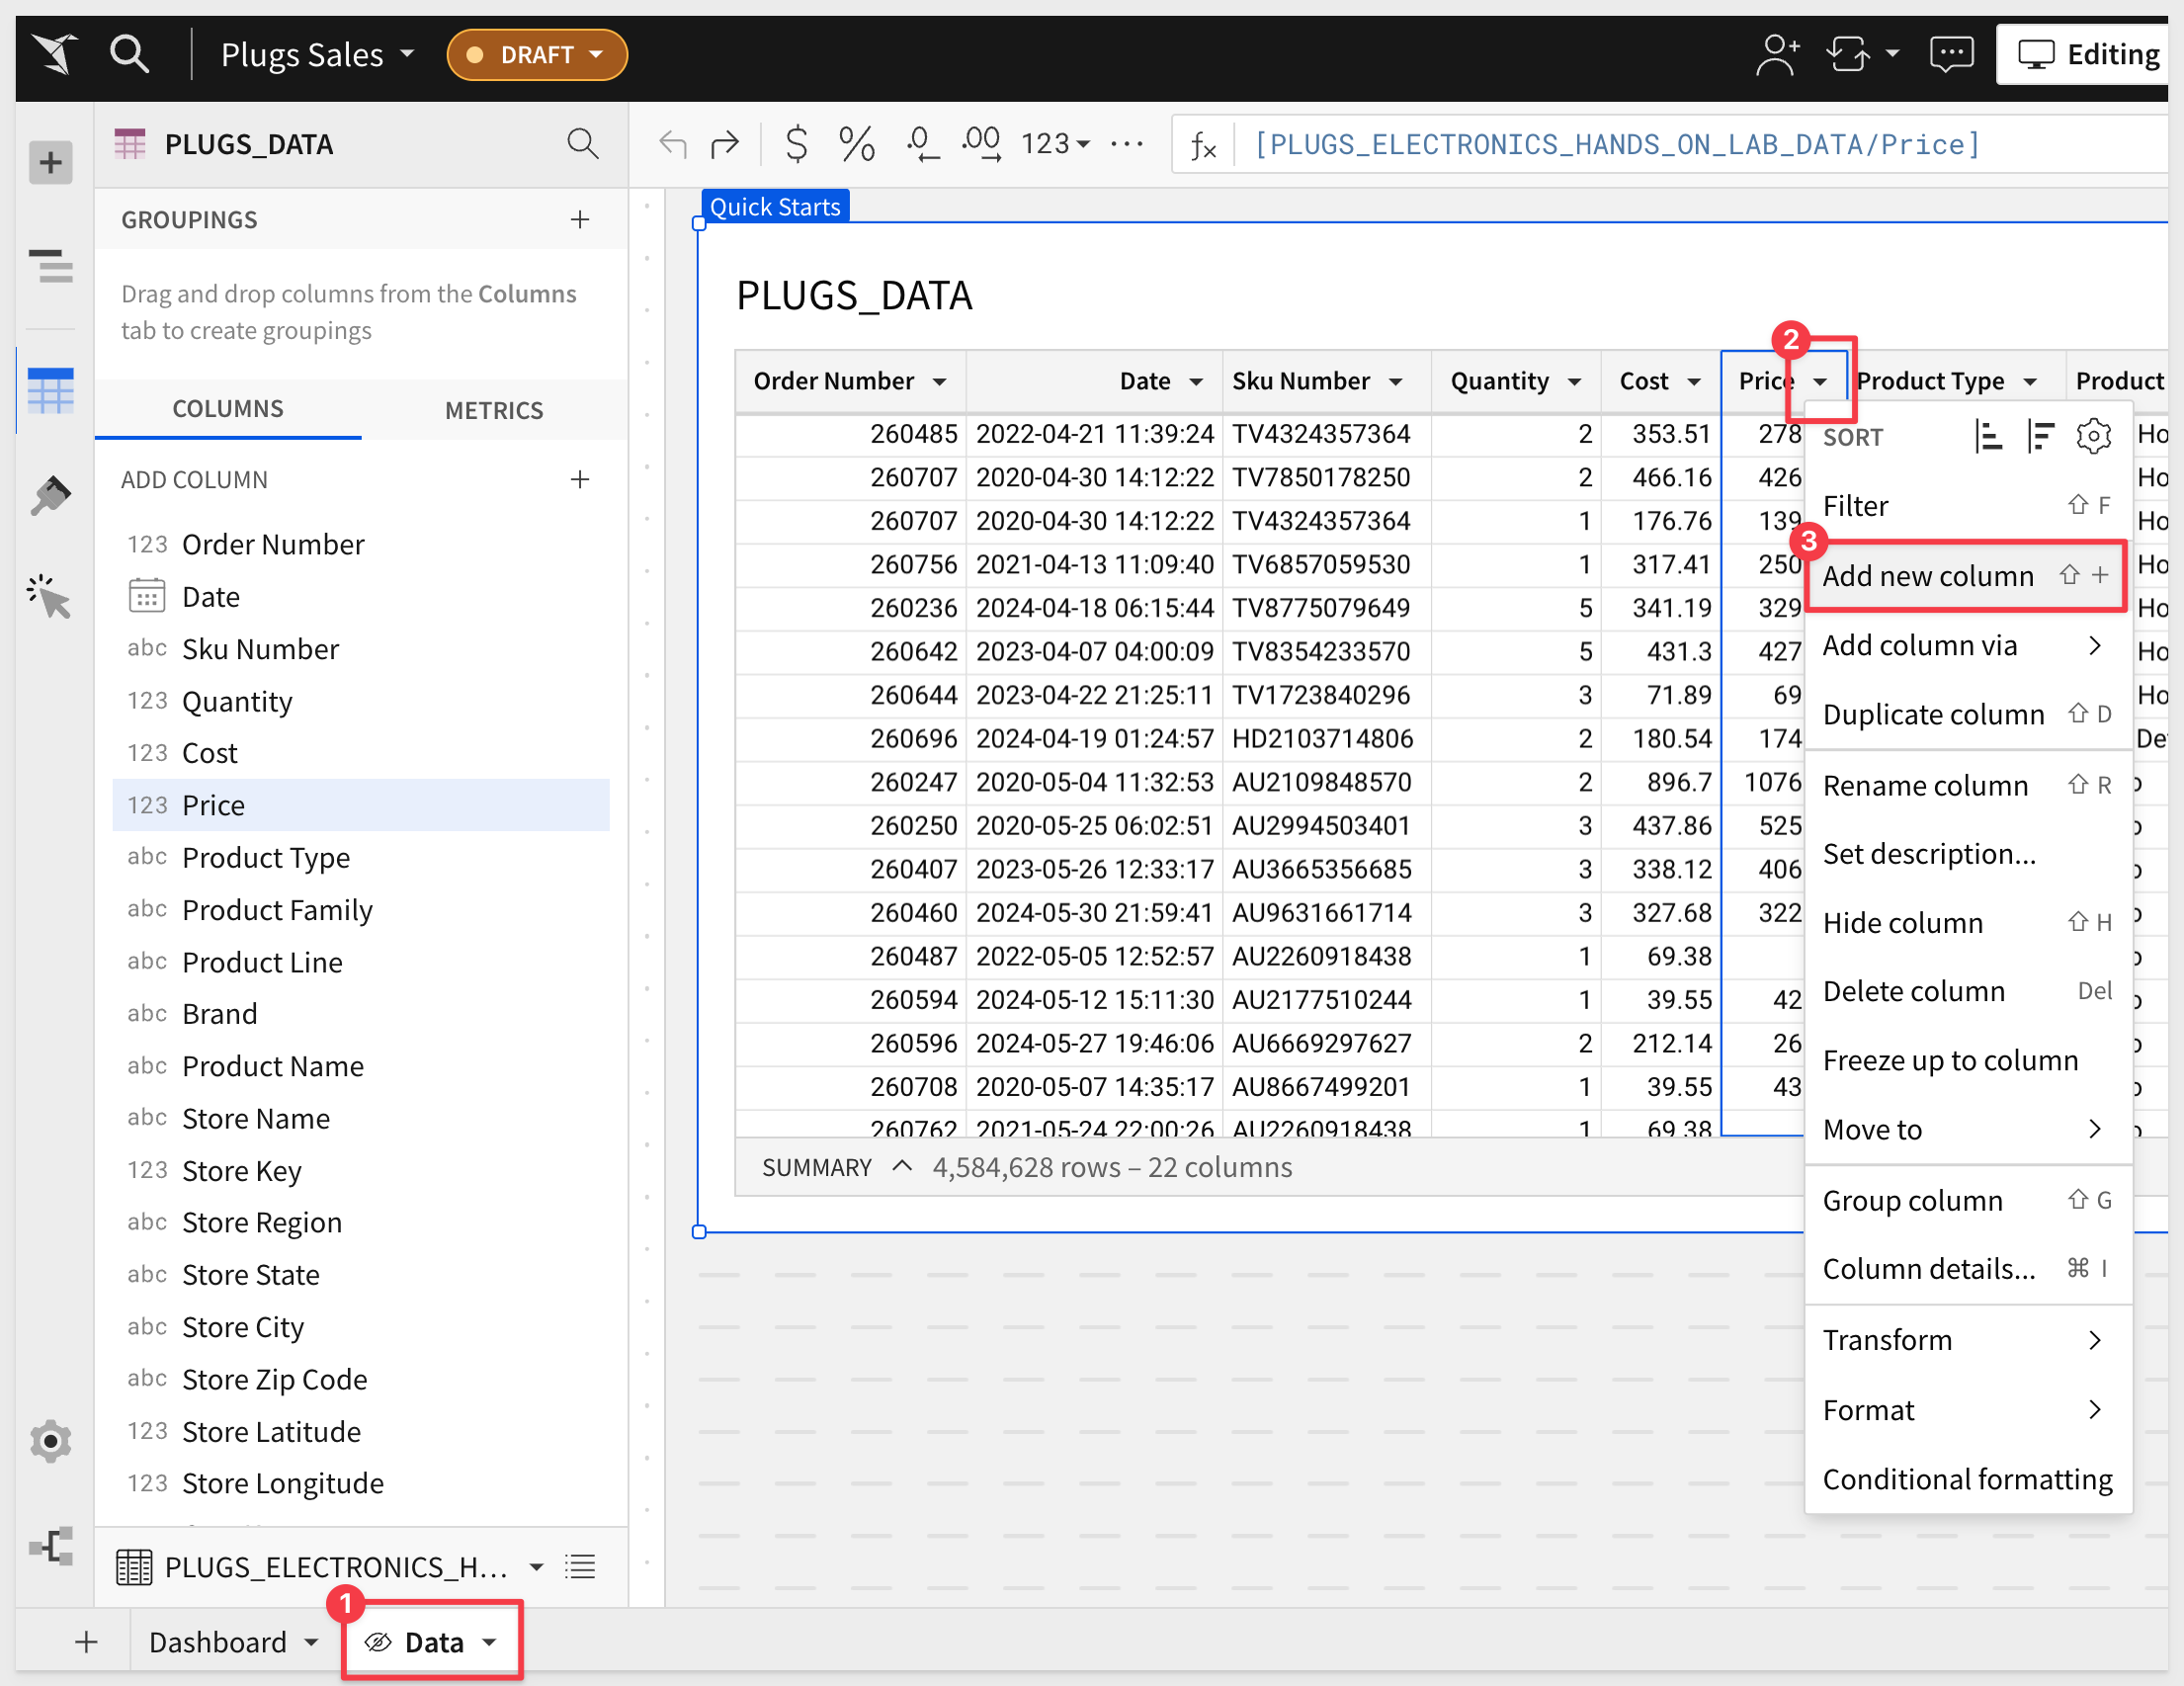
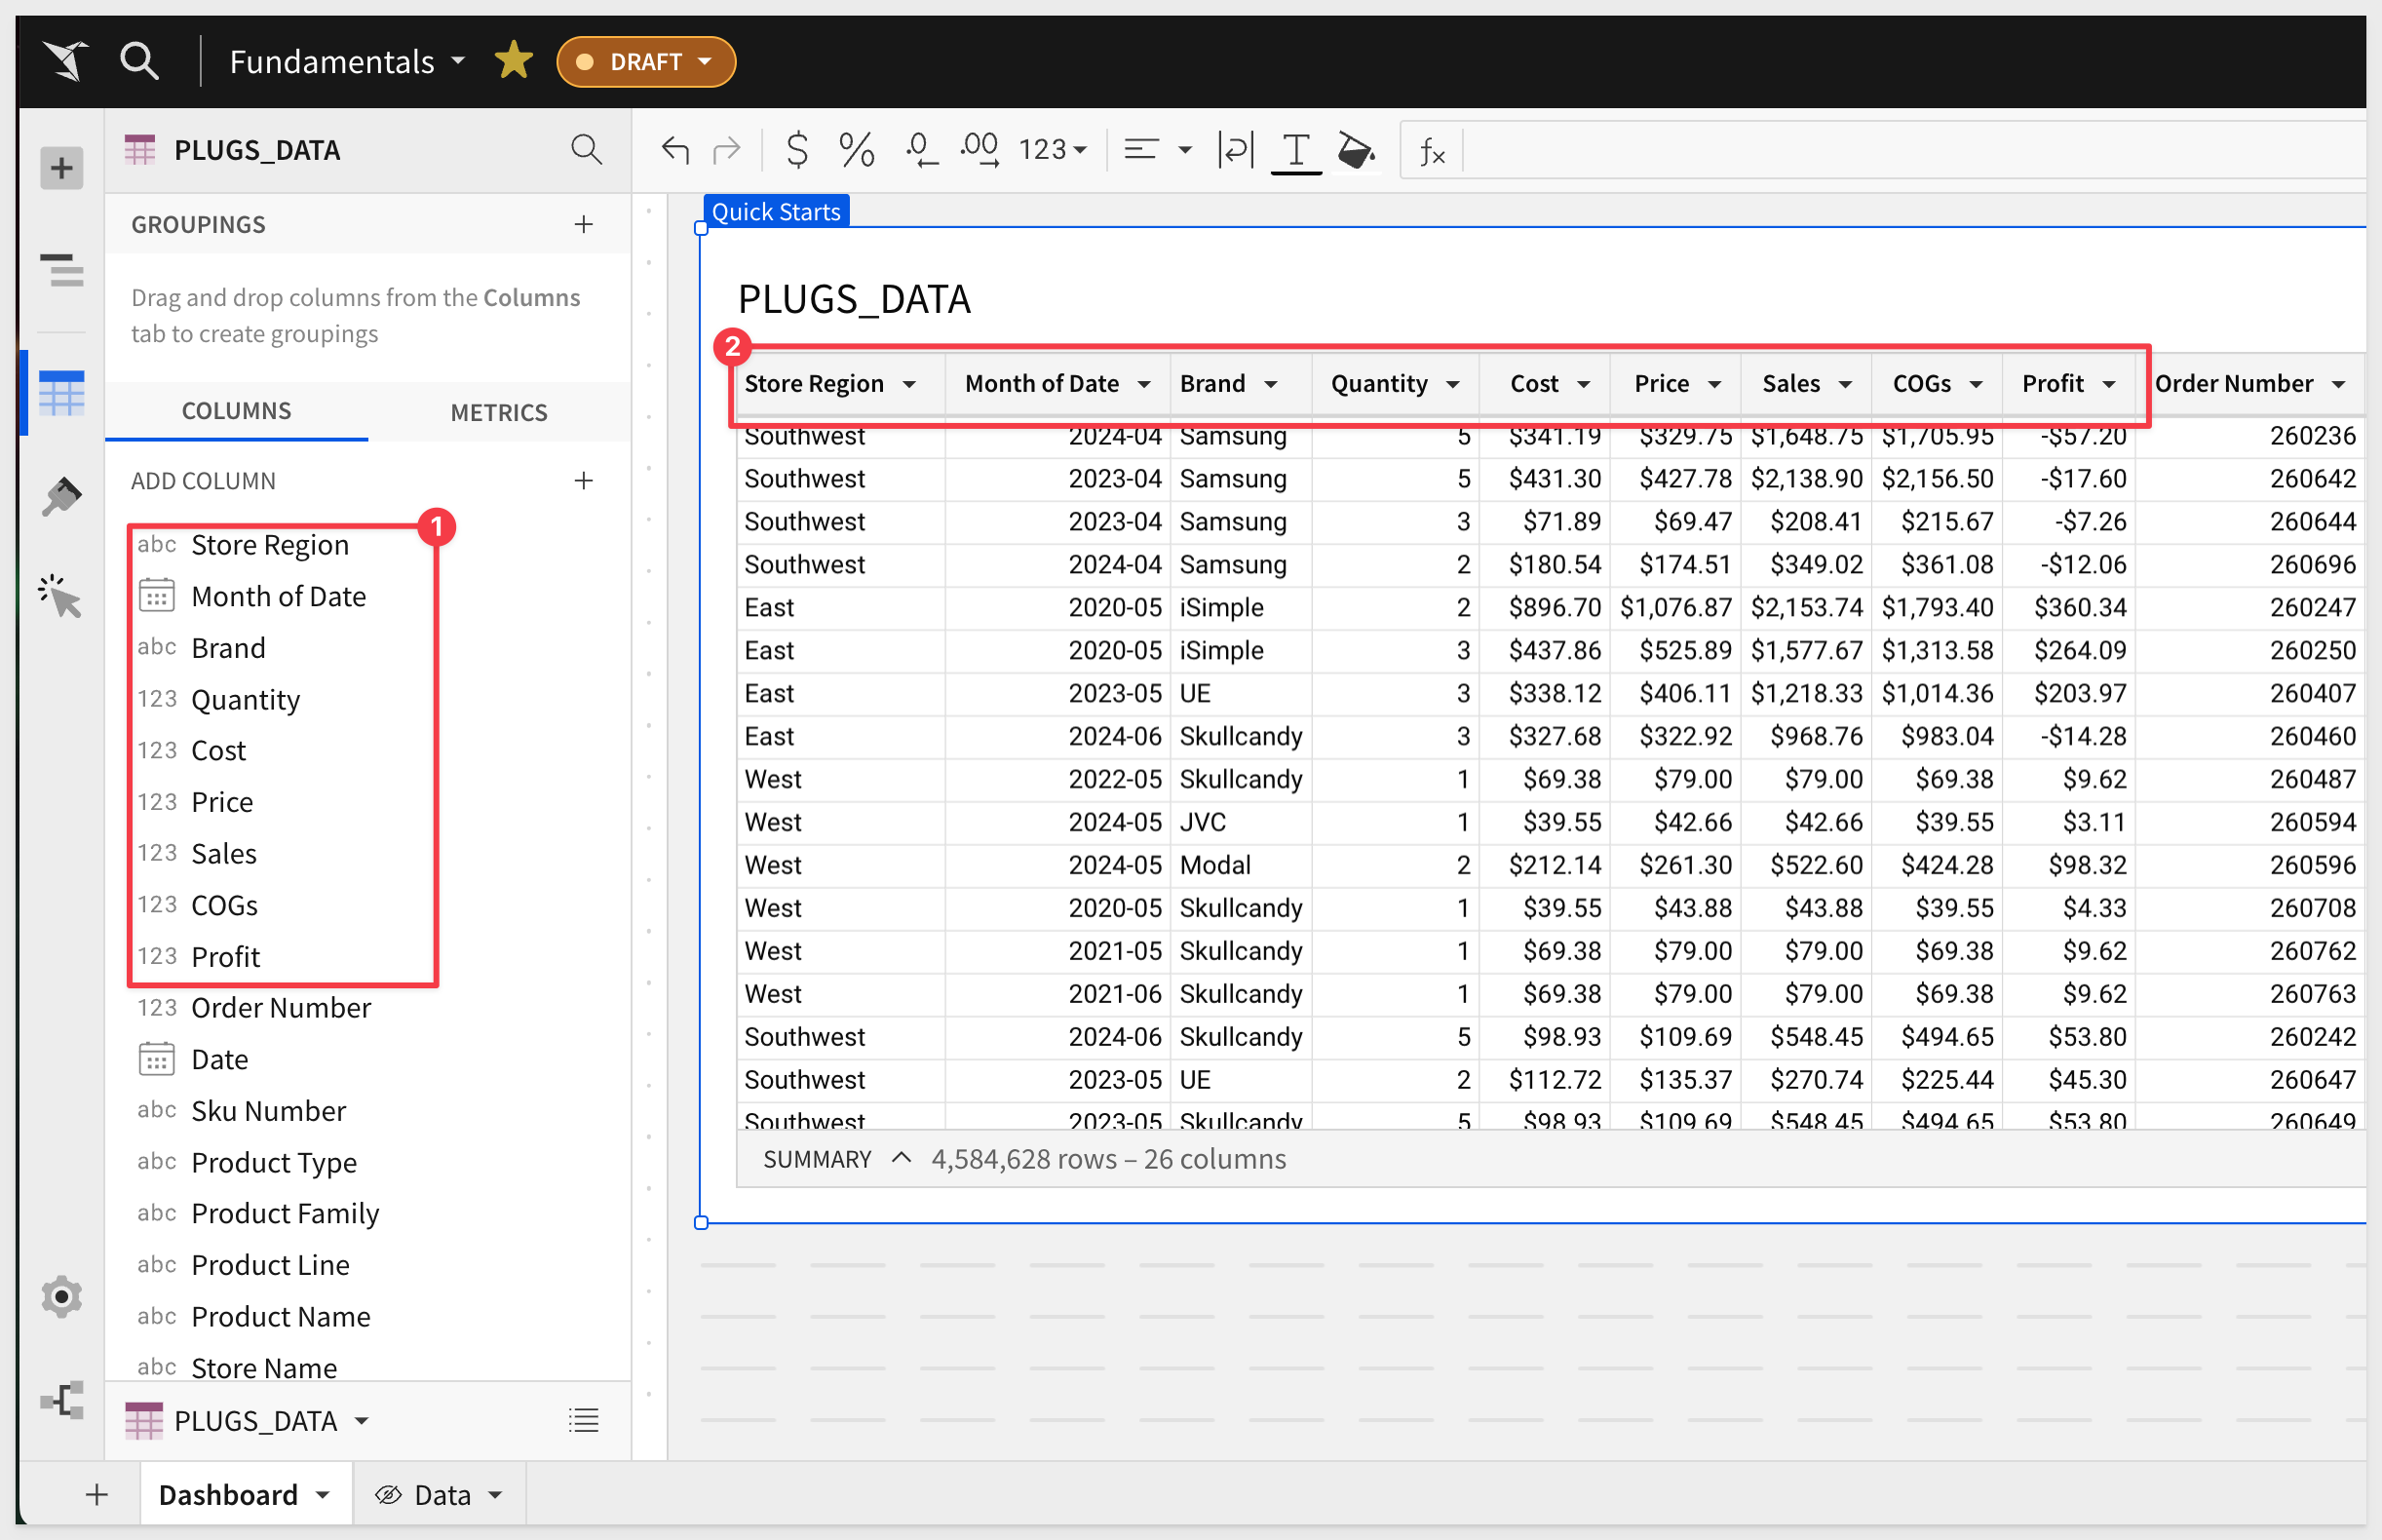
We should still have two pages, Dashboard and Data. Both have the PLUGS_DATA table on it; click to use the Data page.
Our source data in Snowflake does not have a few columns that we want users to have access to.
Instead of users making calculations themselves, we will do that for them, so that we control how the column values are calculated.
The missing columns are Sales, COGs (cost of goods sold) and Profit.
Click the column dropdown from the Price column and select Add new column.
Rename the new column Sales.
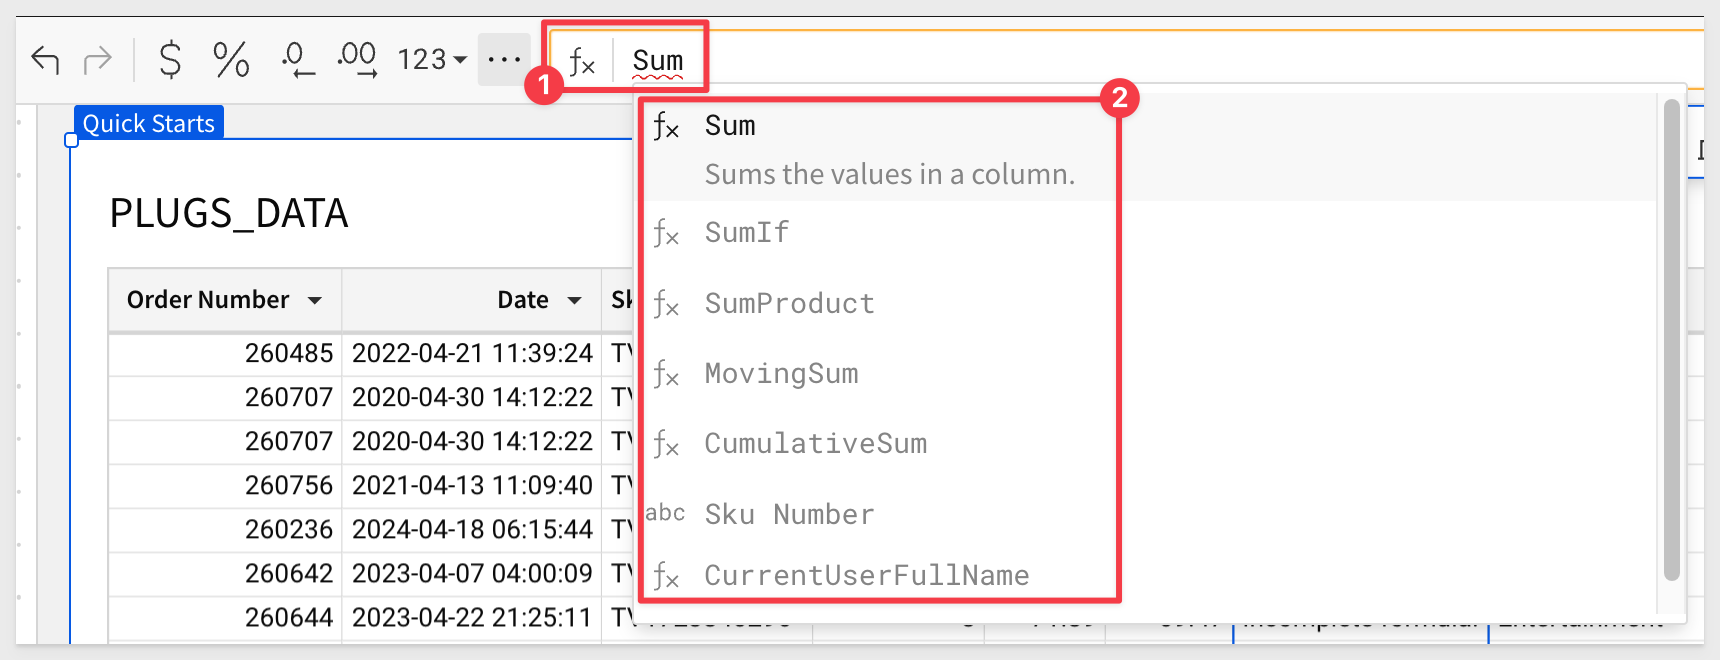
In the function bar, start typing Sum. Sigma tries to provide all the possible functions as you type to save you time:
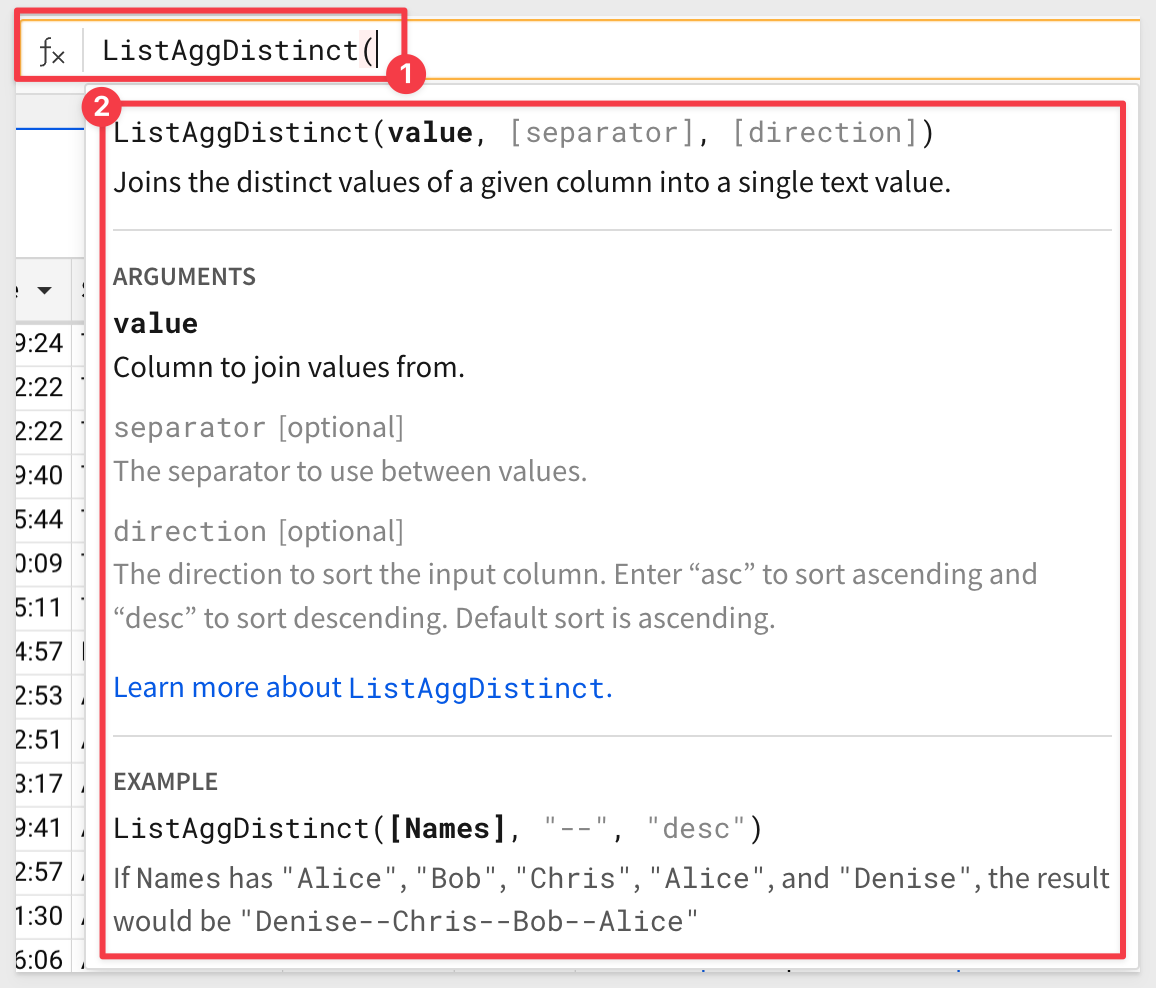
This is a simple example, but when you start typing ListAggD, Sigma displays the list of available functions.
Sigma also provides detailed help on the required syntax for complex functions too:
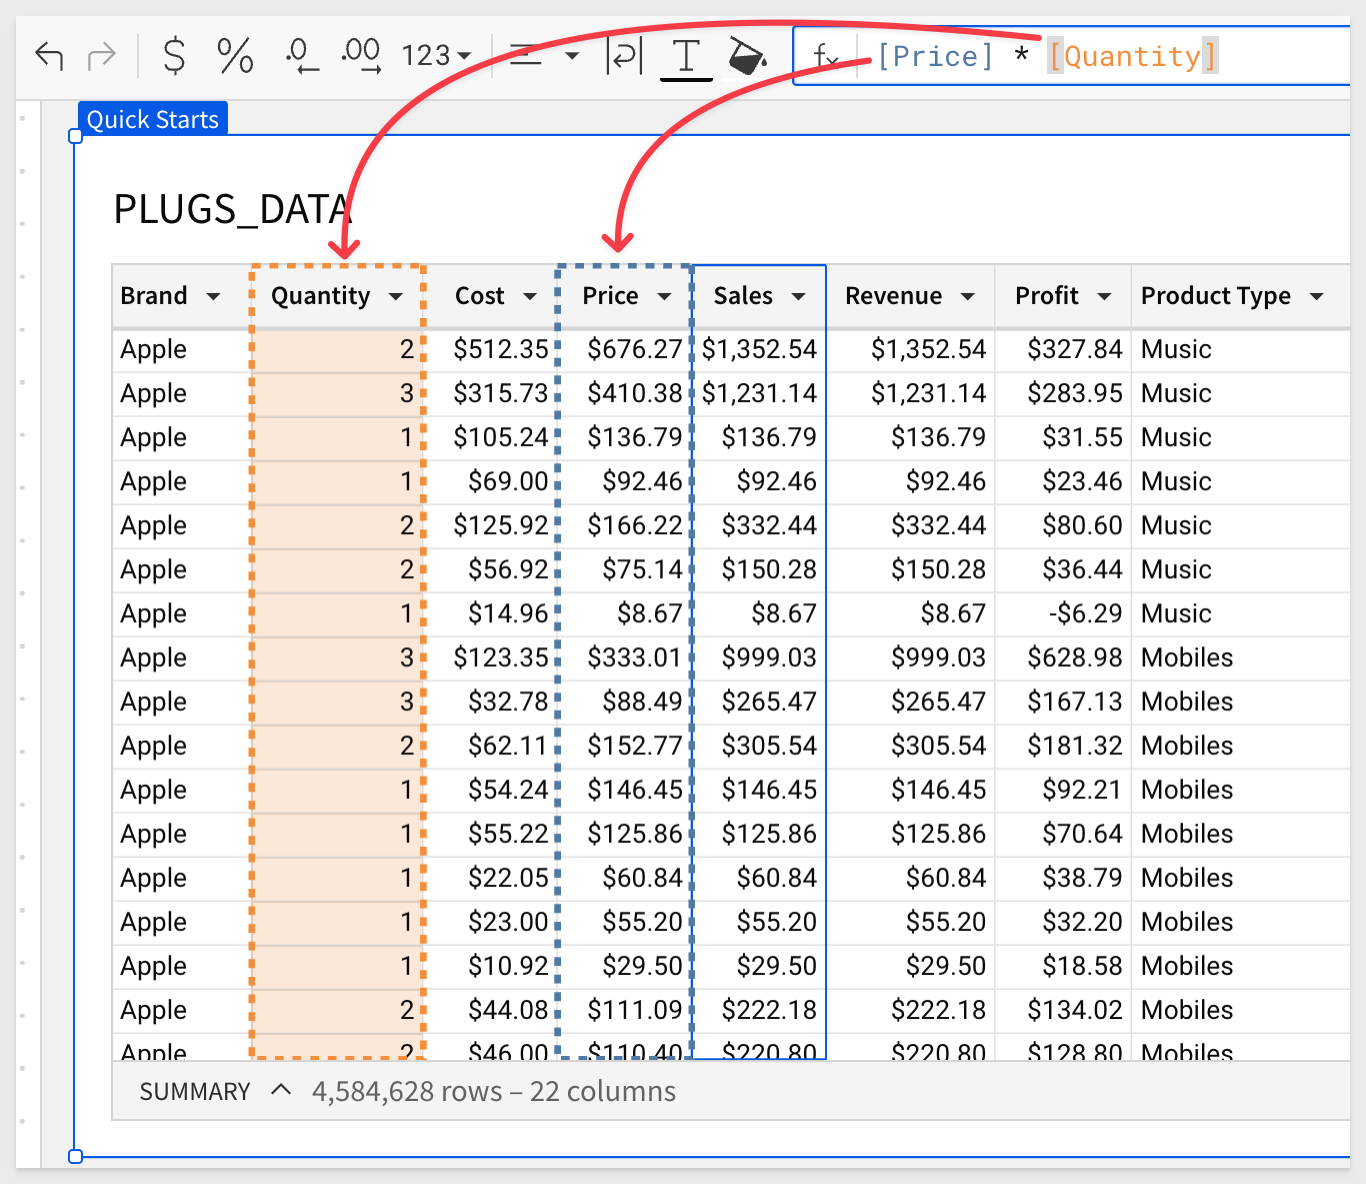
With the Sales column selected, enter the formula:
[Price] * [Quant]
This is an intentional mistake in our formula; Unknown column "Quant"; it does not exist anywhere else in the Workbook. What happened?
Sigma makes you immediately aware the function has a problem:
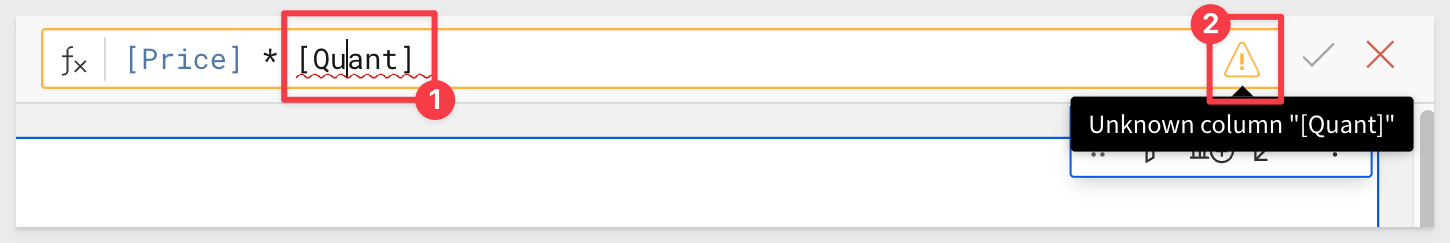
Easy to fix, just adjust the column name to Quantity and click the checkmark at the end of the Function bar. Simple!
Now that we have our Sales, we should be able to calculate our COGs.
You can do this one yourself now:
[Quantity] * [Cost]
Do the same to add the Profit column:
[Sales] - [COGs]
Click the Cost column, hold down the shift key and click the Profit column.
With the five columns all selected, click the $ icon in the toolbar to change them all to currency format:
Click Publish.
Now that we have updated our "source" data in Sigma, click on the Dashboard page and observe what happened to our table.
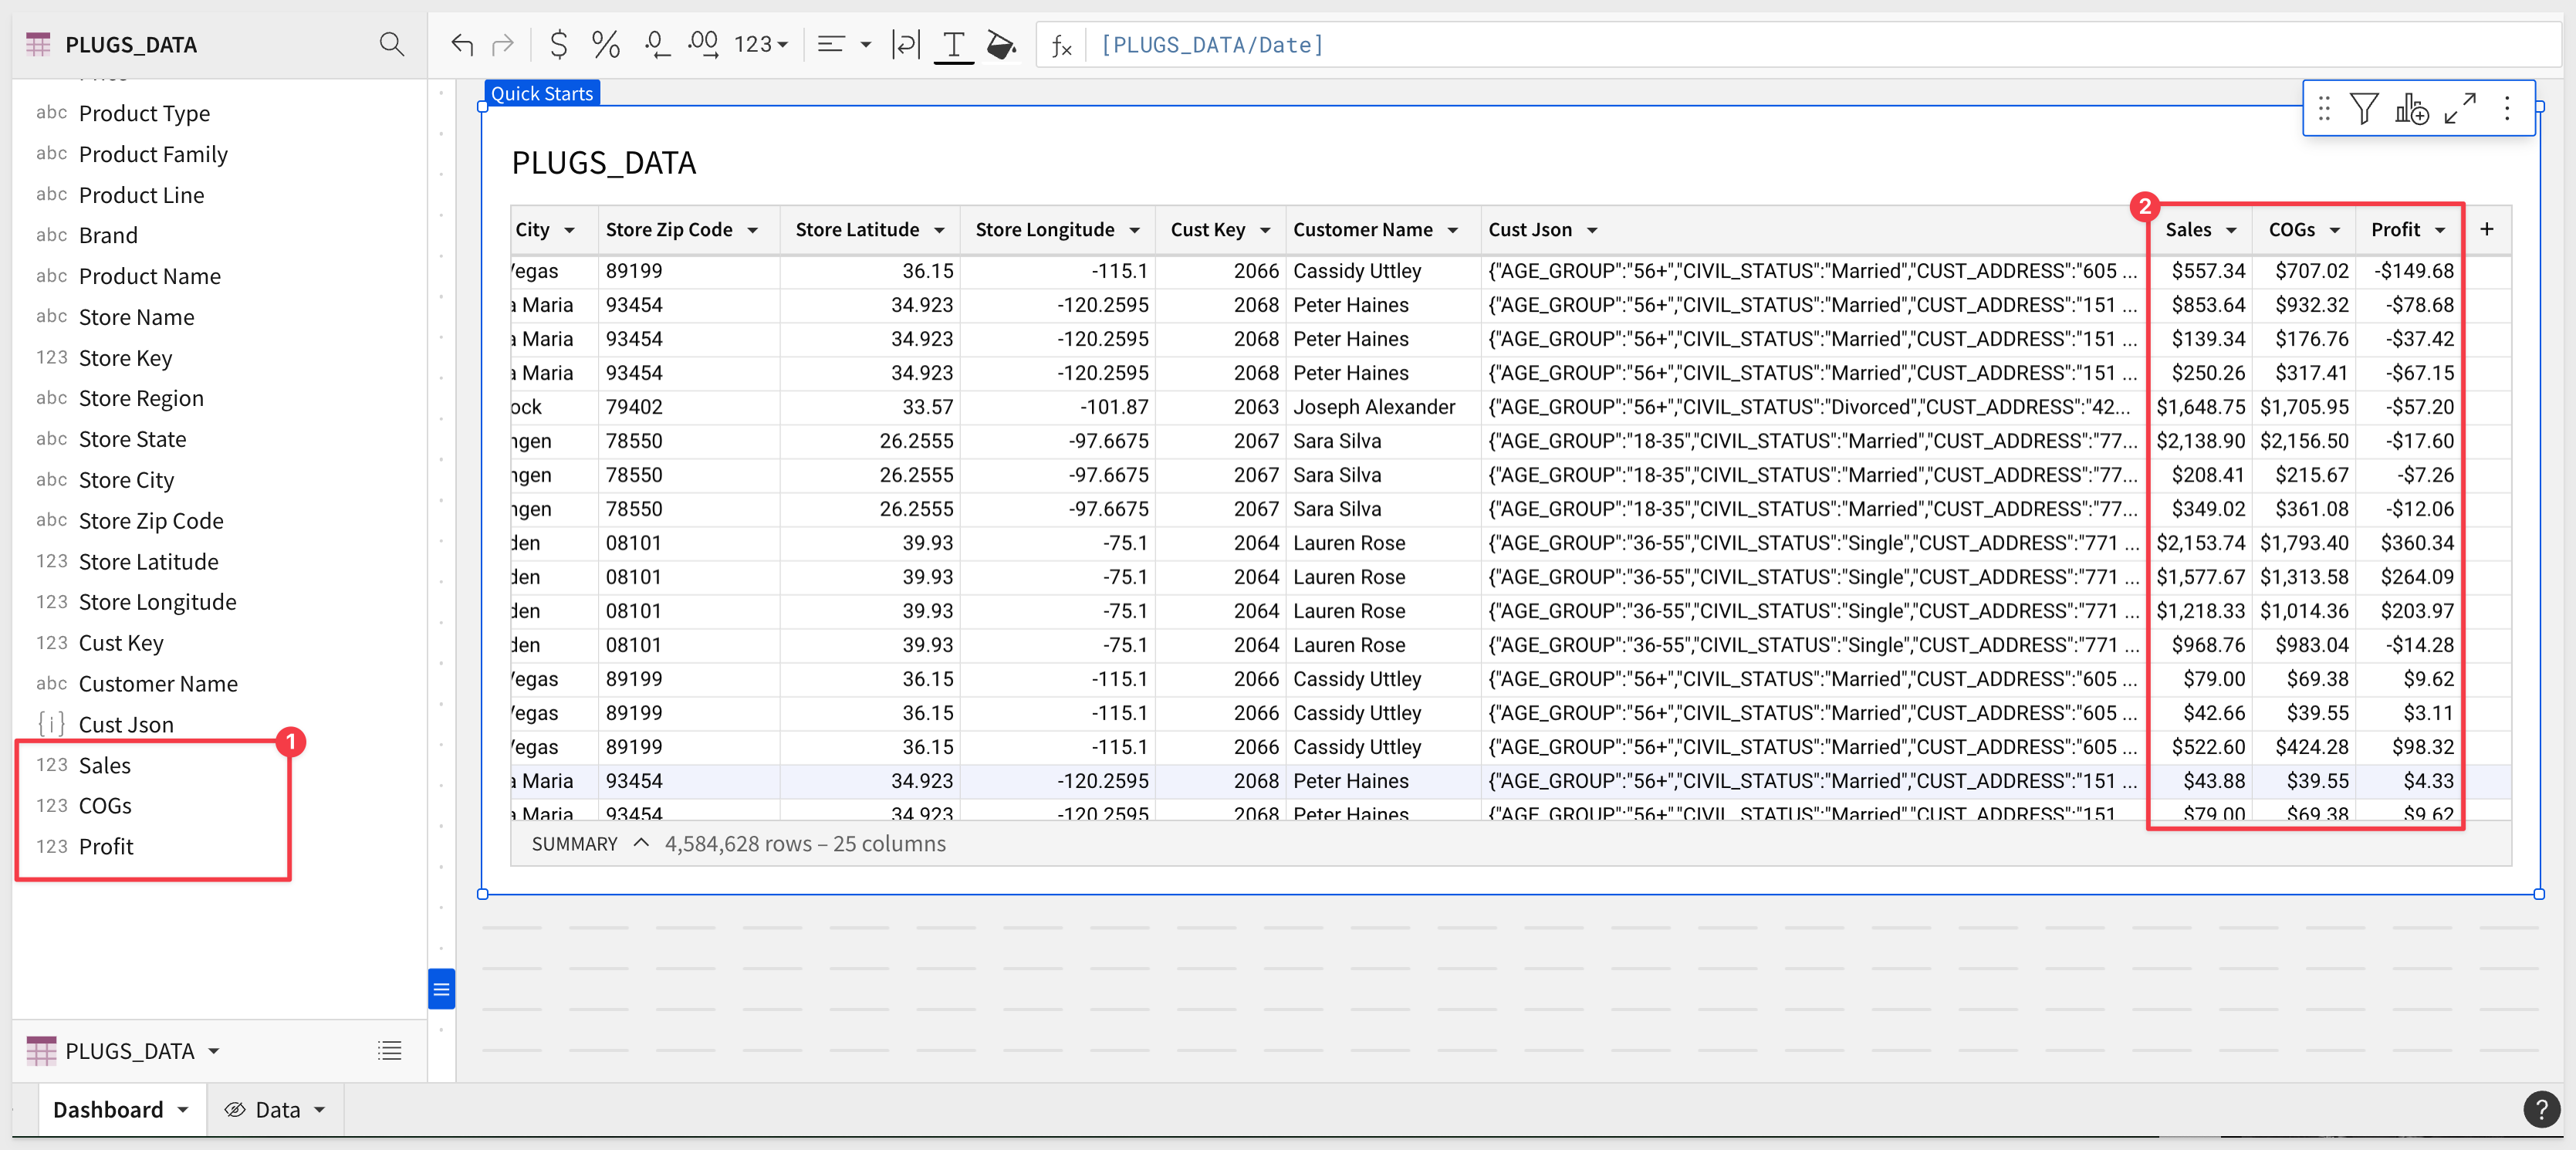
At first glance, it looks the same. Click to select the table. Now we have three new columns at the end of the table (and column listing) available to the user:
This is because the table on the Dashboard page is using data that comes from the Data page.
Simple Date Handling
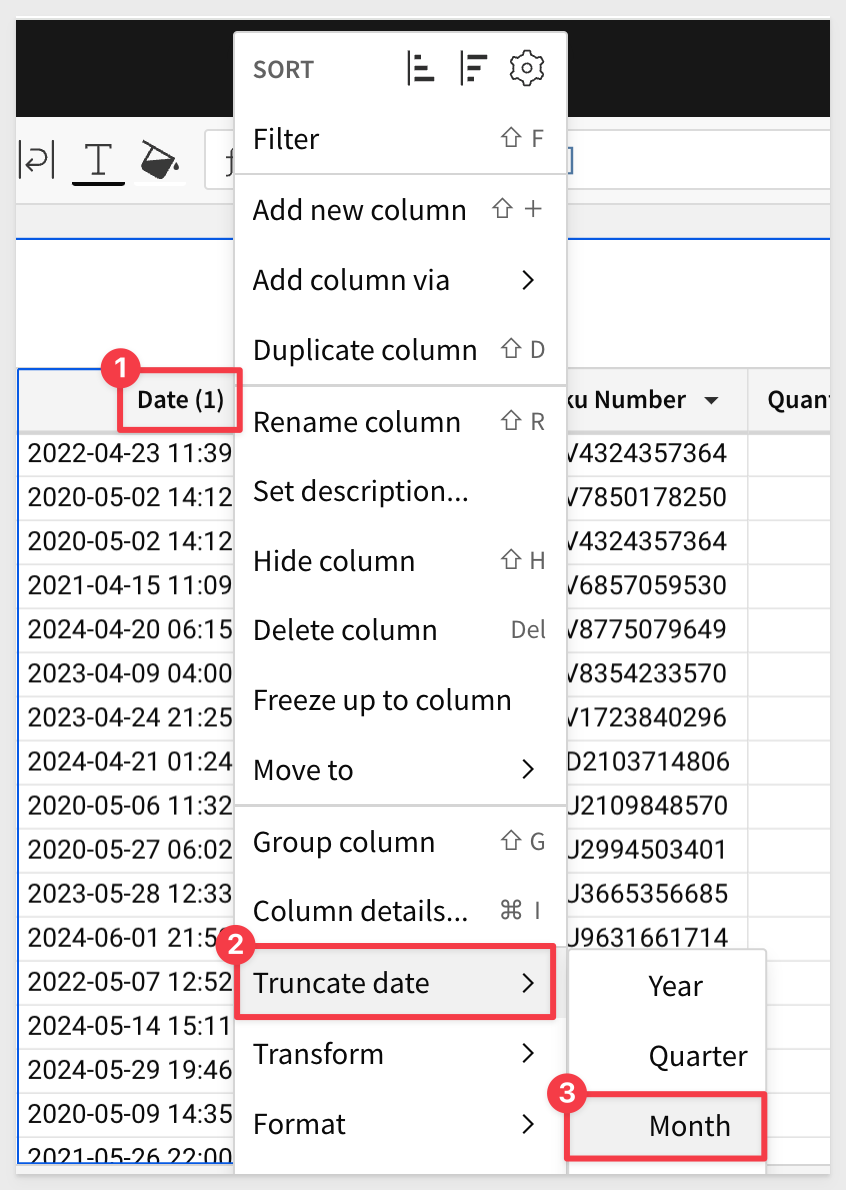
Open the Date column's menu and select Duplicate column:
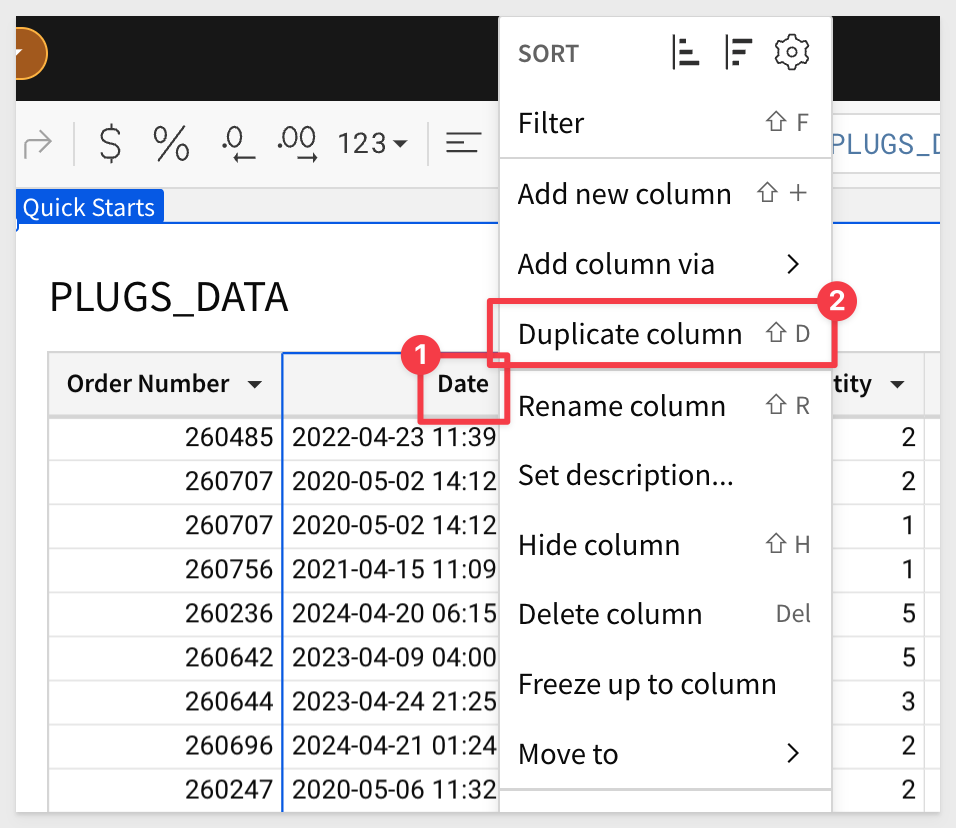
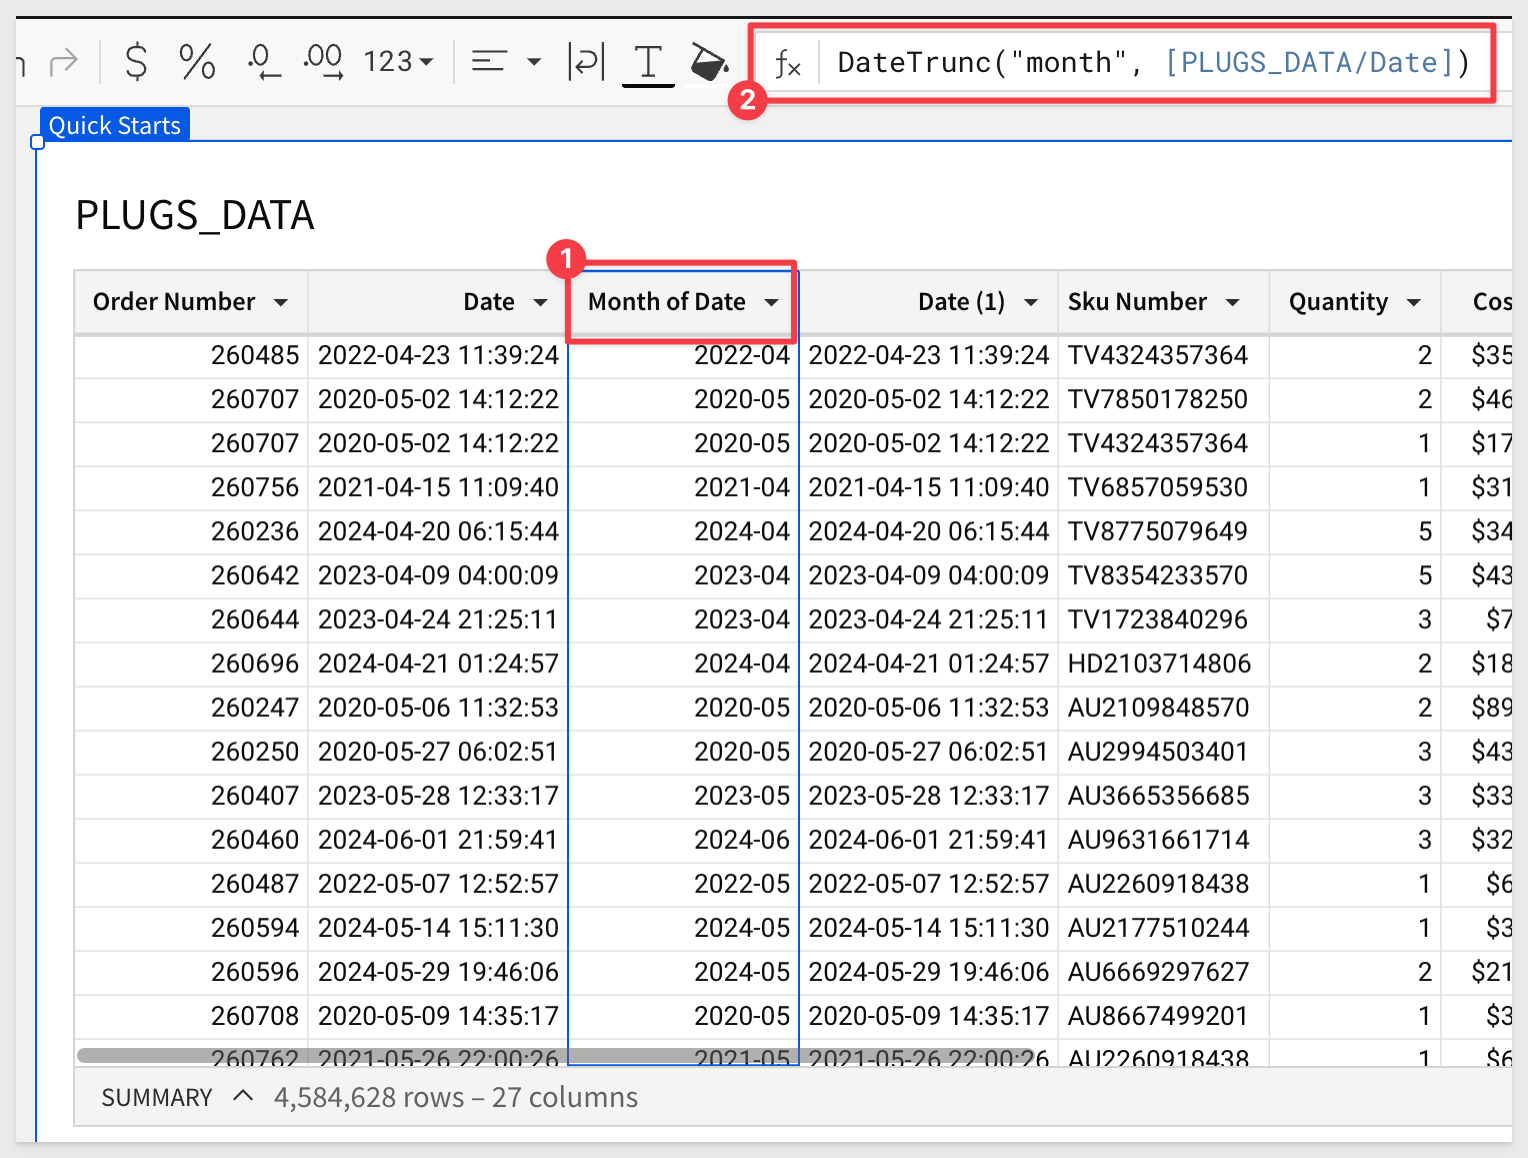
Sigma names the new column Date (1). Open Date (1)'s menu and select Truncate date > Month:
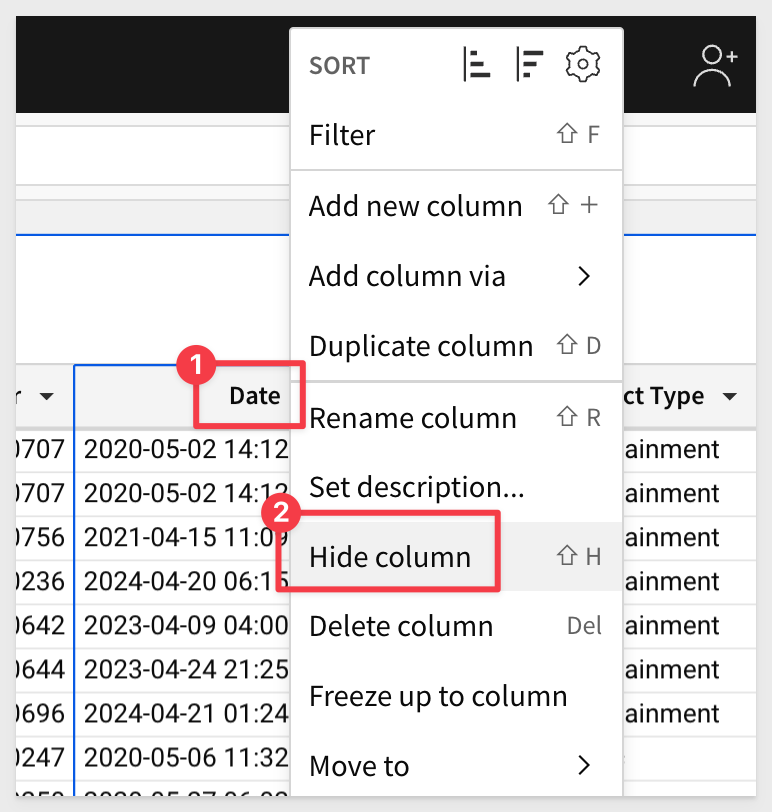
We are not really concerned with the Date column, so lets just hide that:
Reorder the columns.
The final column order will look like this:
Click Publish.
Now that we know the basics, lets look at the common ways tables are used in Sigma.

We are still on the Dashboard page.
There are times when a column has not been made available in the source data. It is still possible for users to add them (assuming they have been granted permission).
We know the profit made for each transaction, but we also are interested to know the Profit Margin percentage on each item.
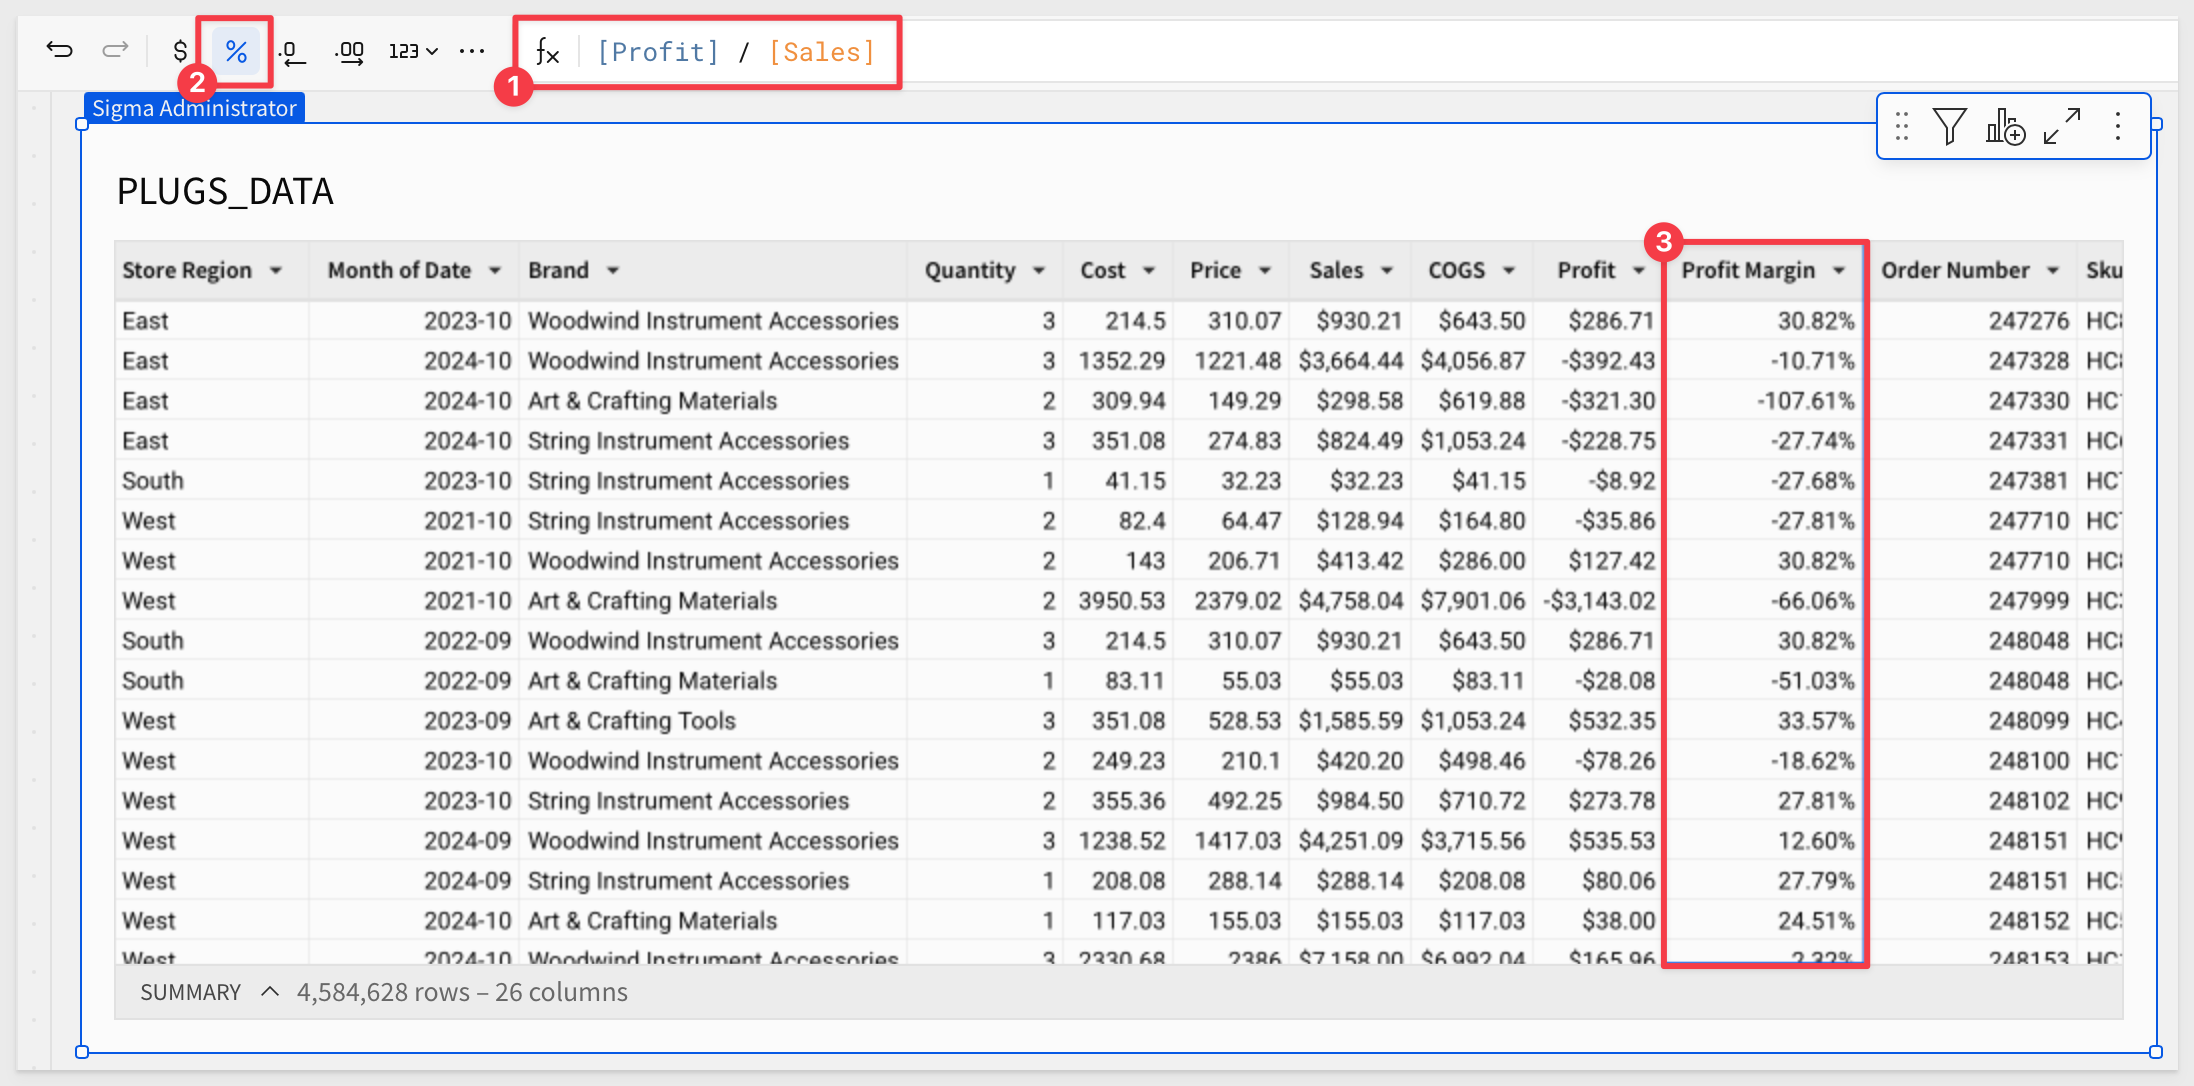
Add a new column (next to Profit), and use the formula:
[Profit] / [Sales]
Rename the column Profit Margin In this case, change the formatting to a %.
Your table should now look similar to this:
Some of these functions have been pretty easy, but Sigma is capable of performing the most commonly used functions available in Excel/Google Sheets or SQL.
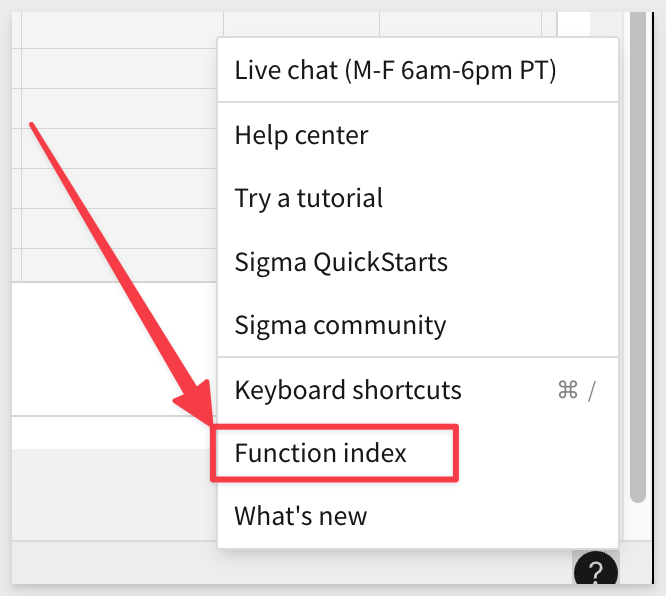
We will get into some more advanced functions later, but you can always check out the complete list by clicking the Help button  in the lower right hand corner and selecting Function Index
Sigma also has the ability to easily filter any type of data.
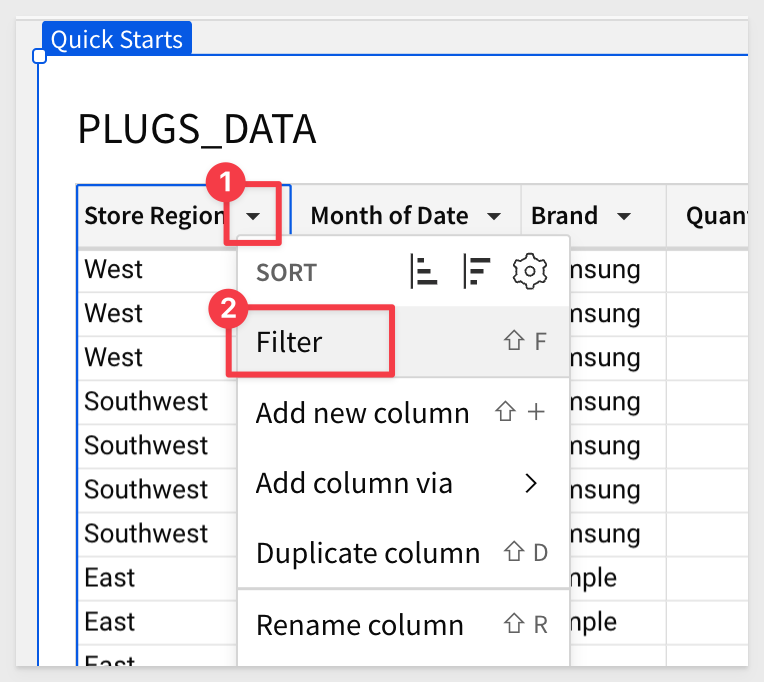
Lets filter for only stores in the East region.
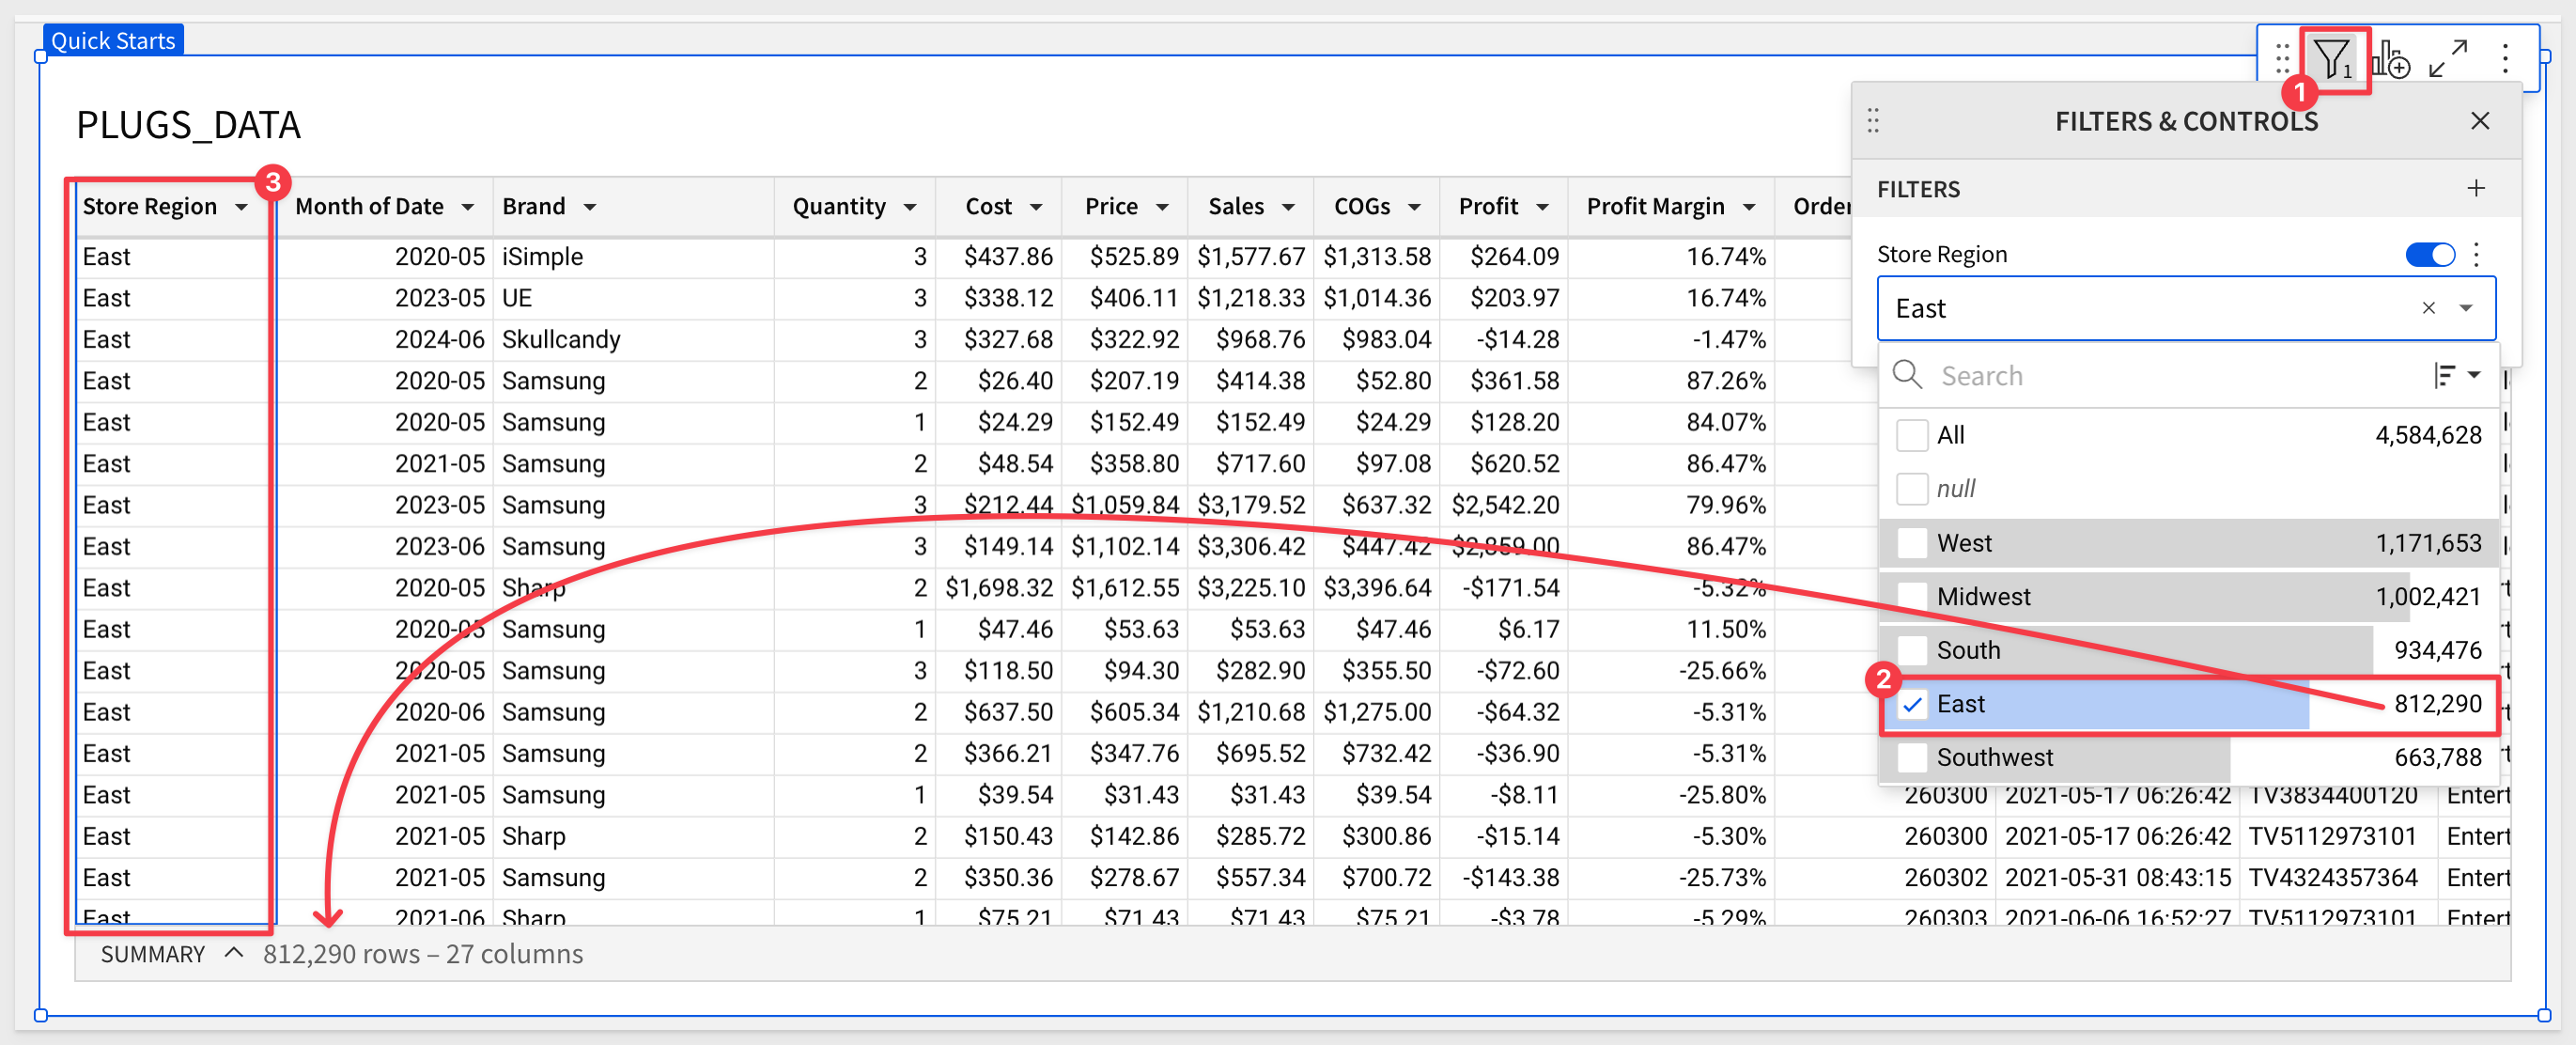
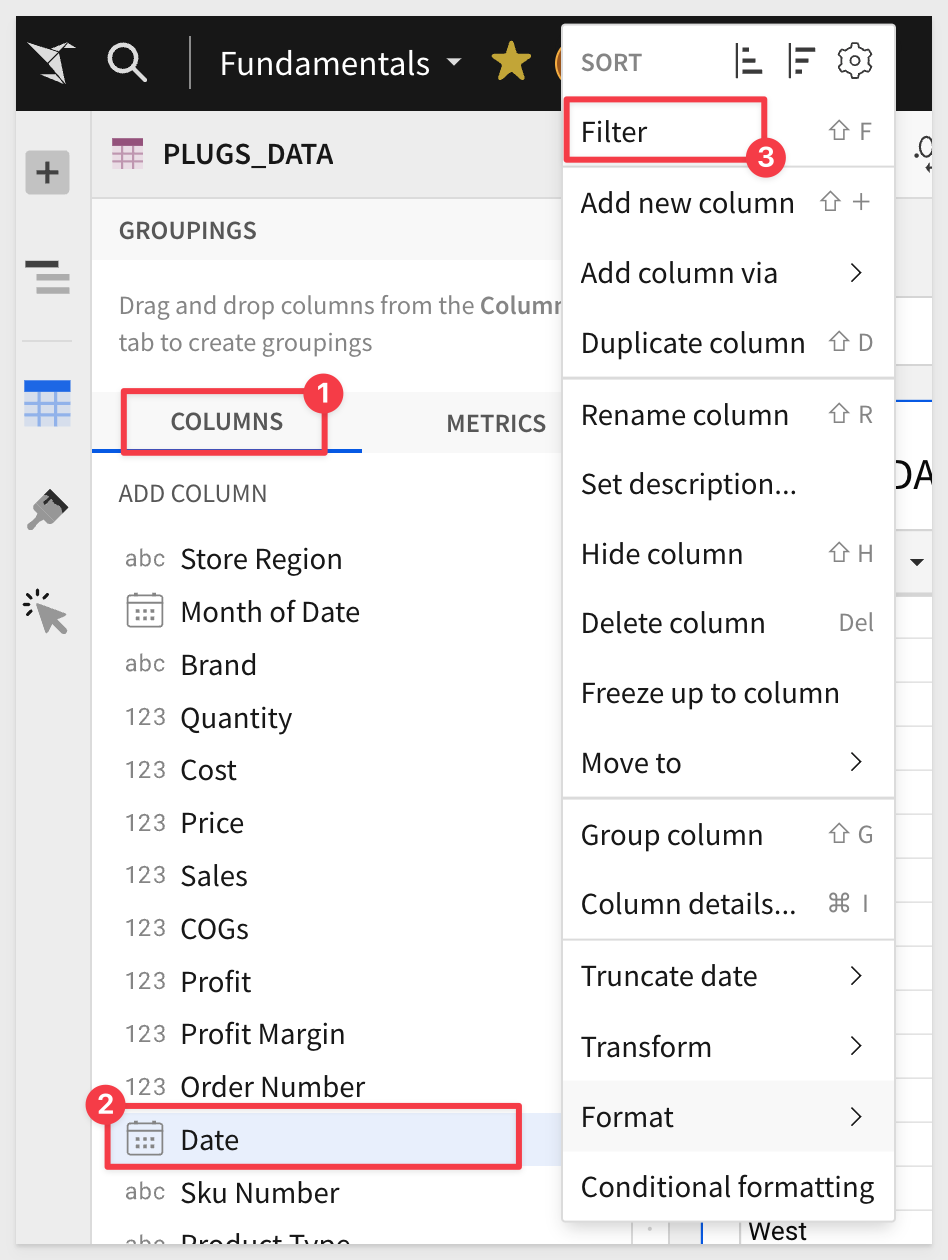
Click on the Store Region column and select Filter:
Notice that a FILTERS & CONTROLS panel opens and it auto-populates with the available distinct list of Store Regions:
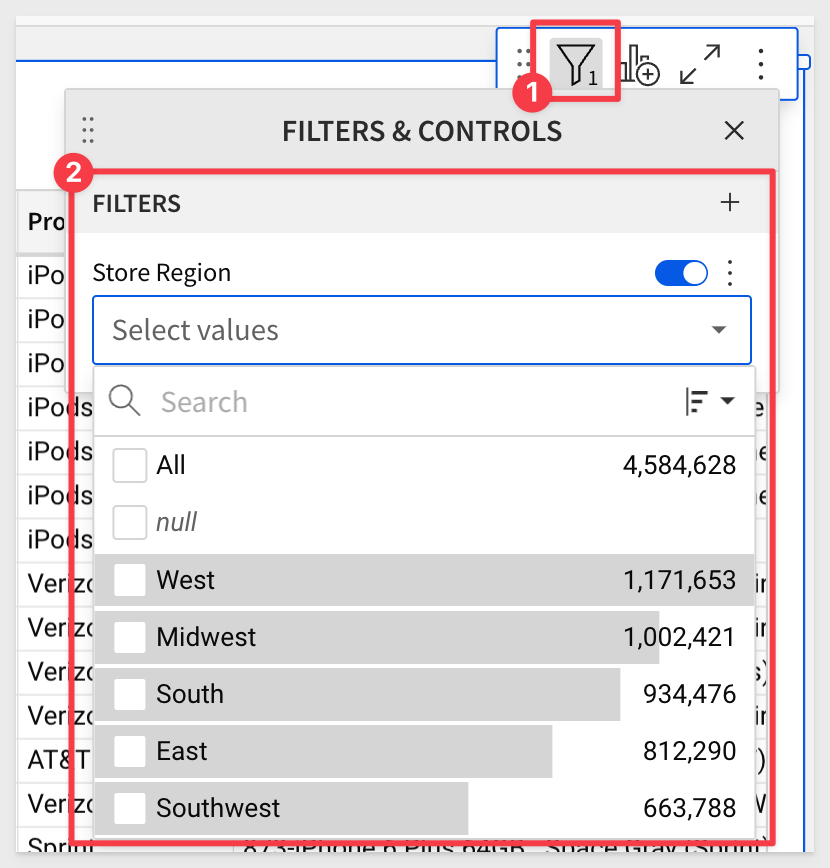
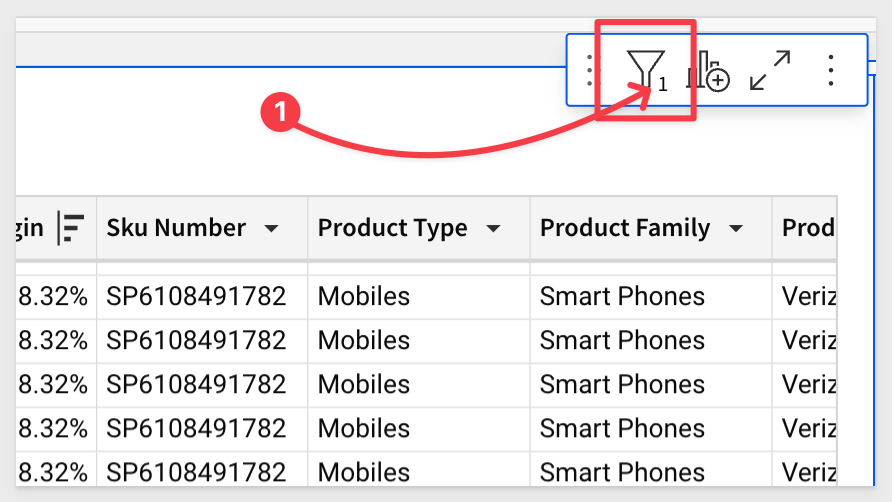
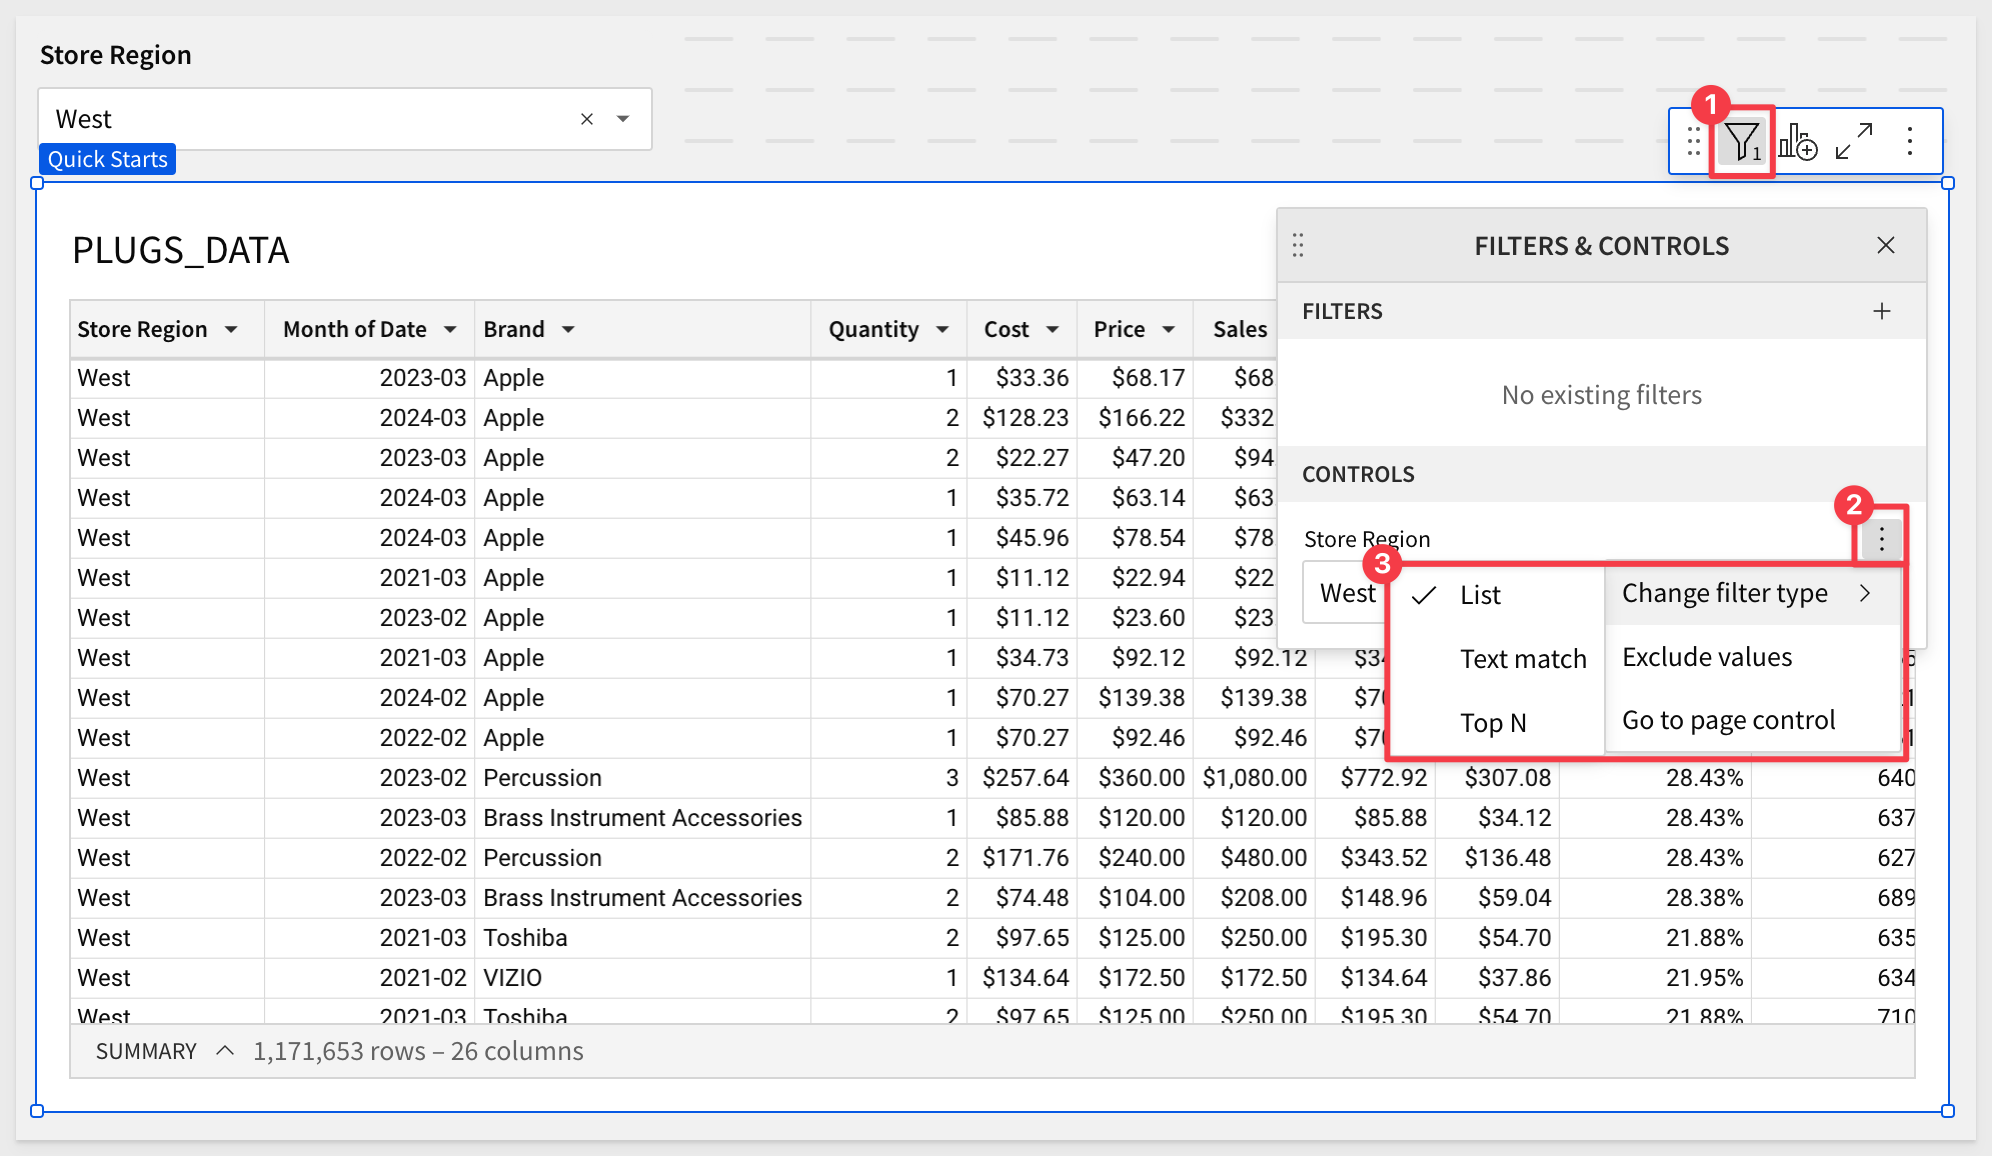
Also notice that there is a small filter icon (#1) with a 1 next to it. This lets you know that the table has a filter set against it. This will come in handy as we work.
Click the checkbox for East and see the table update for just the East region:
Wouldn't it be great if I could just have this filter as as dropdown on the Page? No problem.
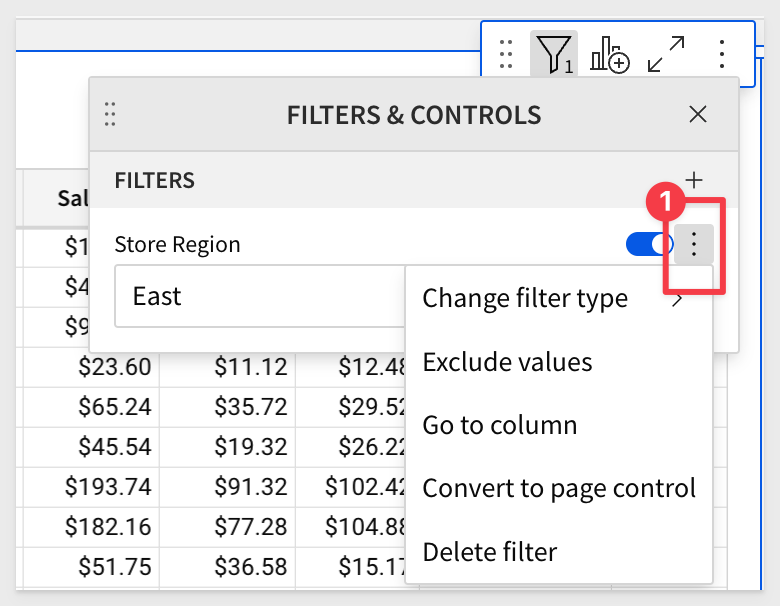
Just click the vertical 3-dots and click Convert to Page Control.
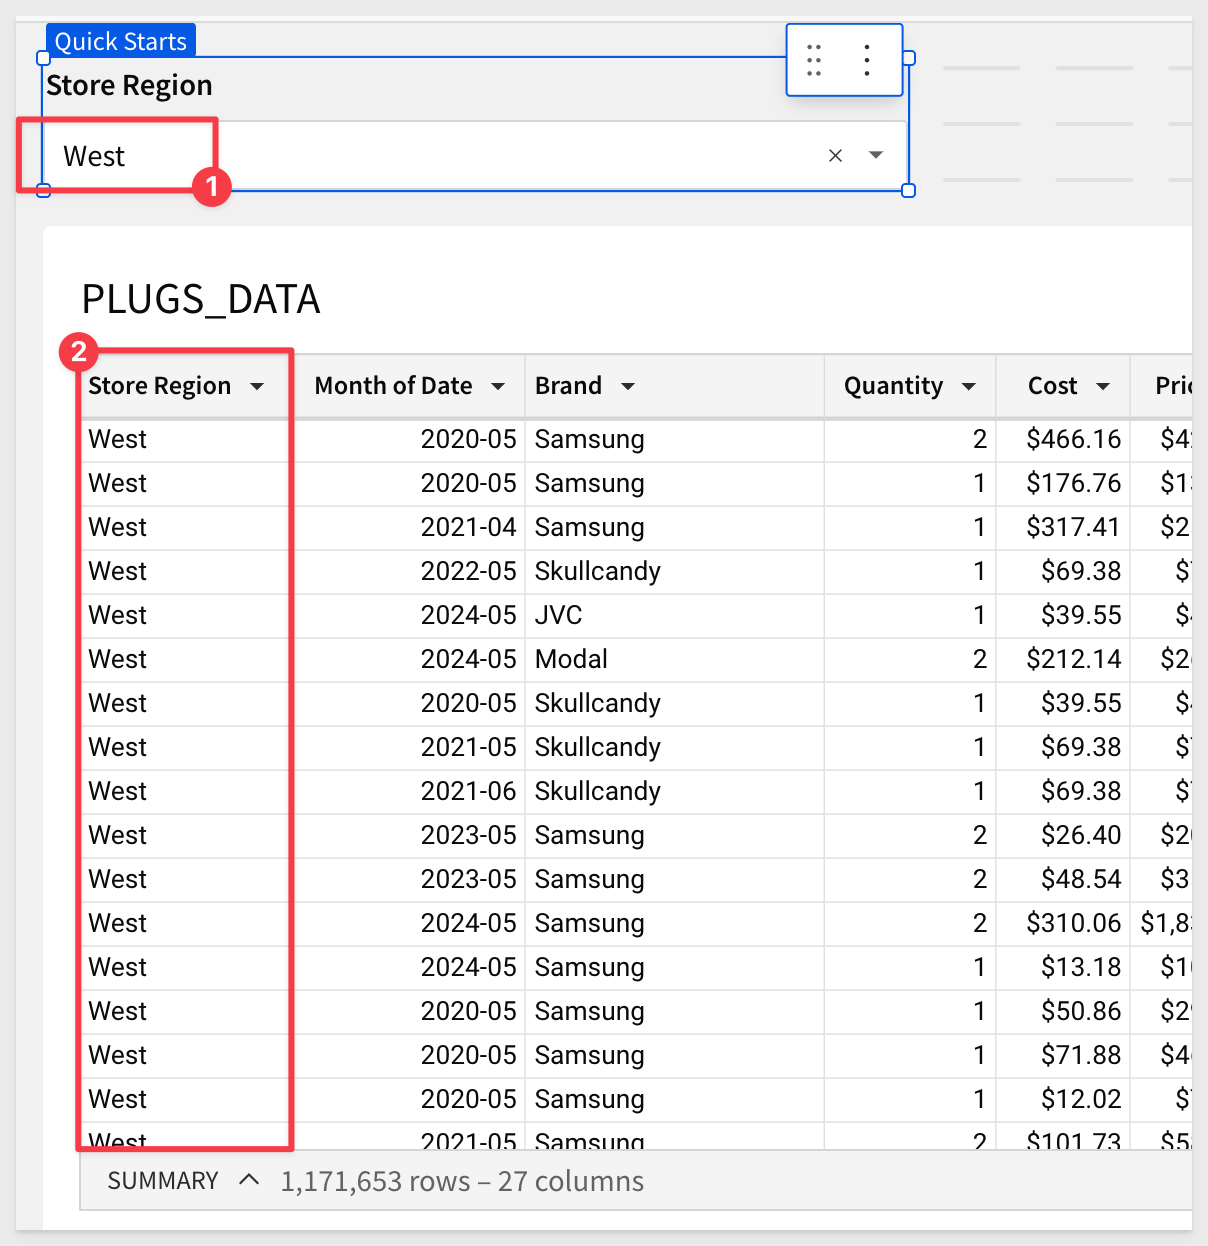
Now the table can be filtered from East to West by using the dropdown filter list as shown below:
It is really easy to resize elements and move them around on the canvas. Feel free to explore doing that until you get comfortable.
More Filters
The filter control provides more functionality we want to touch on.
Setting different filter types is really easy by accessing the filter menu:
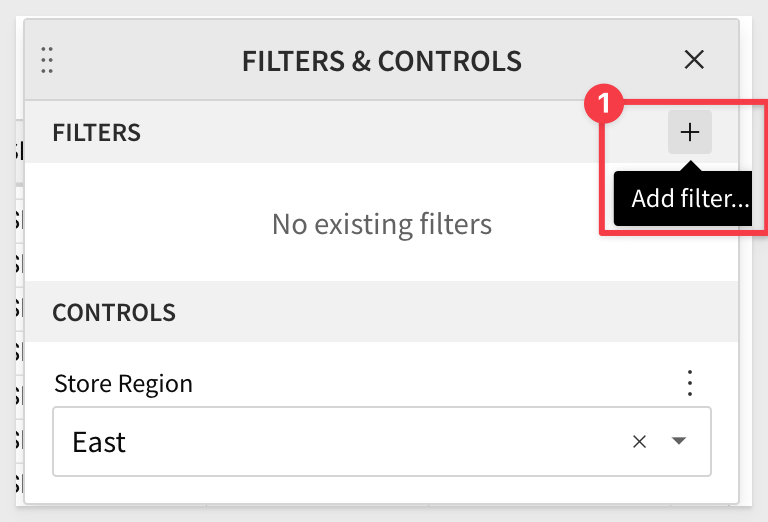
You can add more filters by clicking on the + button here:
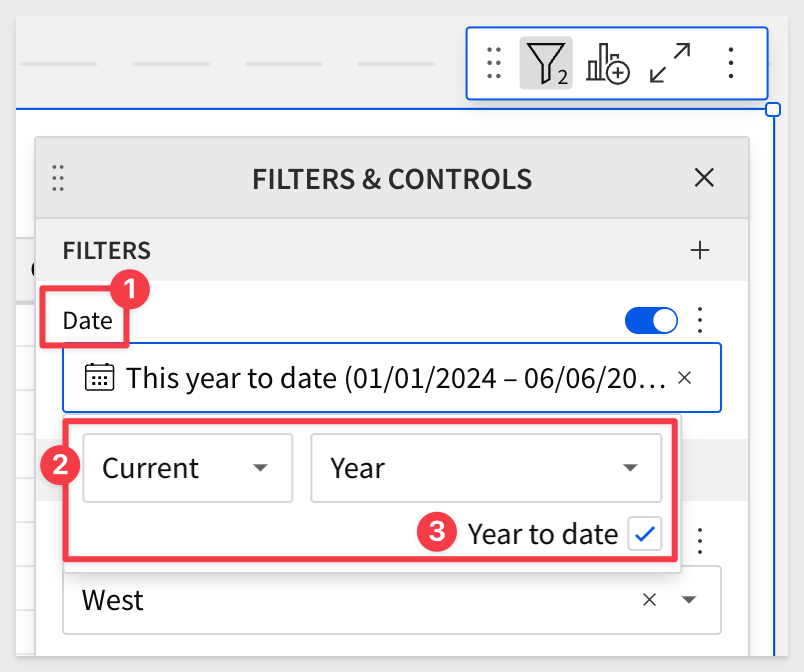
For example, if we select the hidden column Date in the element panel, open it's menu and select filter, Sigma knows that is a date column, and provides filtering options based on that:
Lets set the table to just show year-to-date rows:
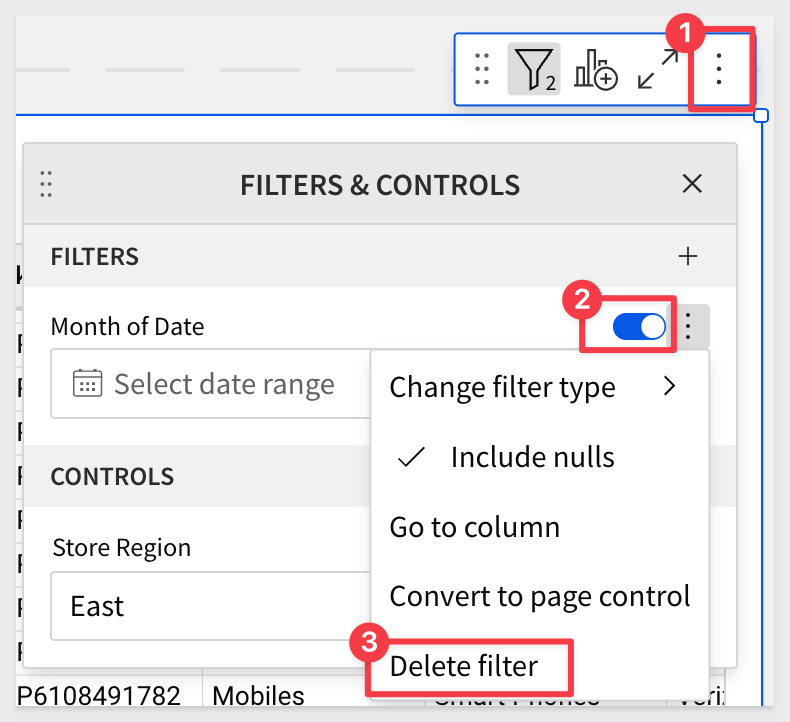
Filters can be deleted (#3) or disabled temporarily (#2) easily:
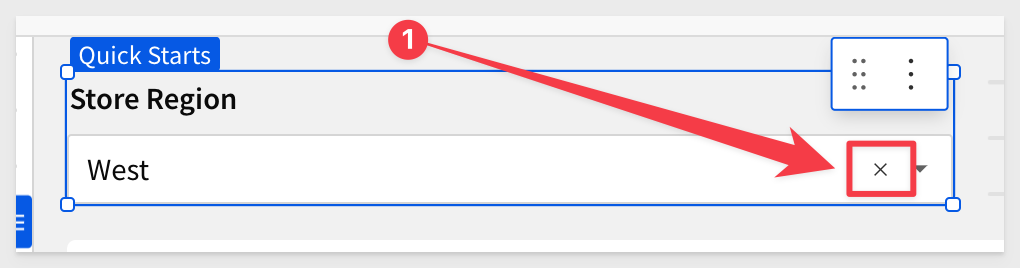
Go ahead and click the x in the Store Regions control to show all regions:
A complete list of available filtering options is available here.
There is also a great community post that details some ways to best use filters in Sigma.
Click Publish.
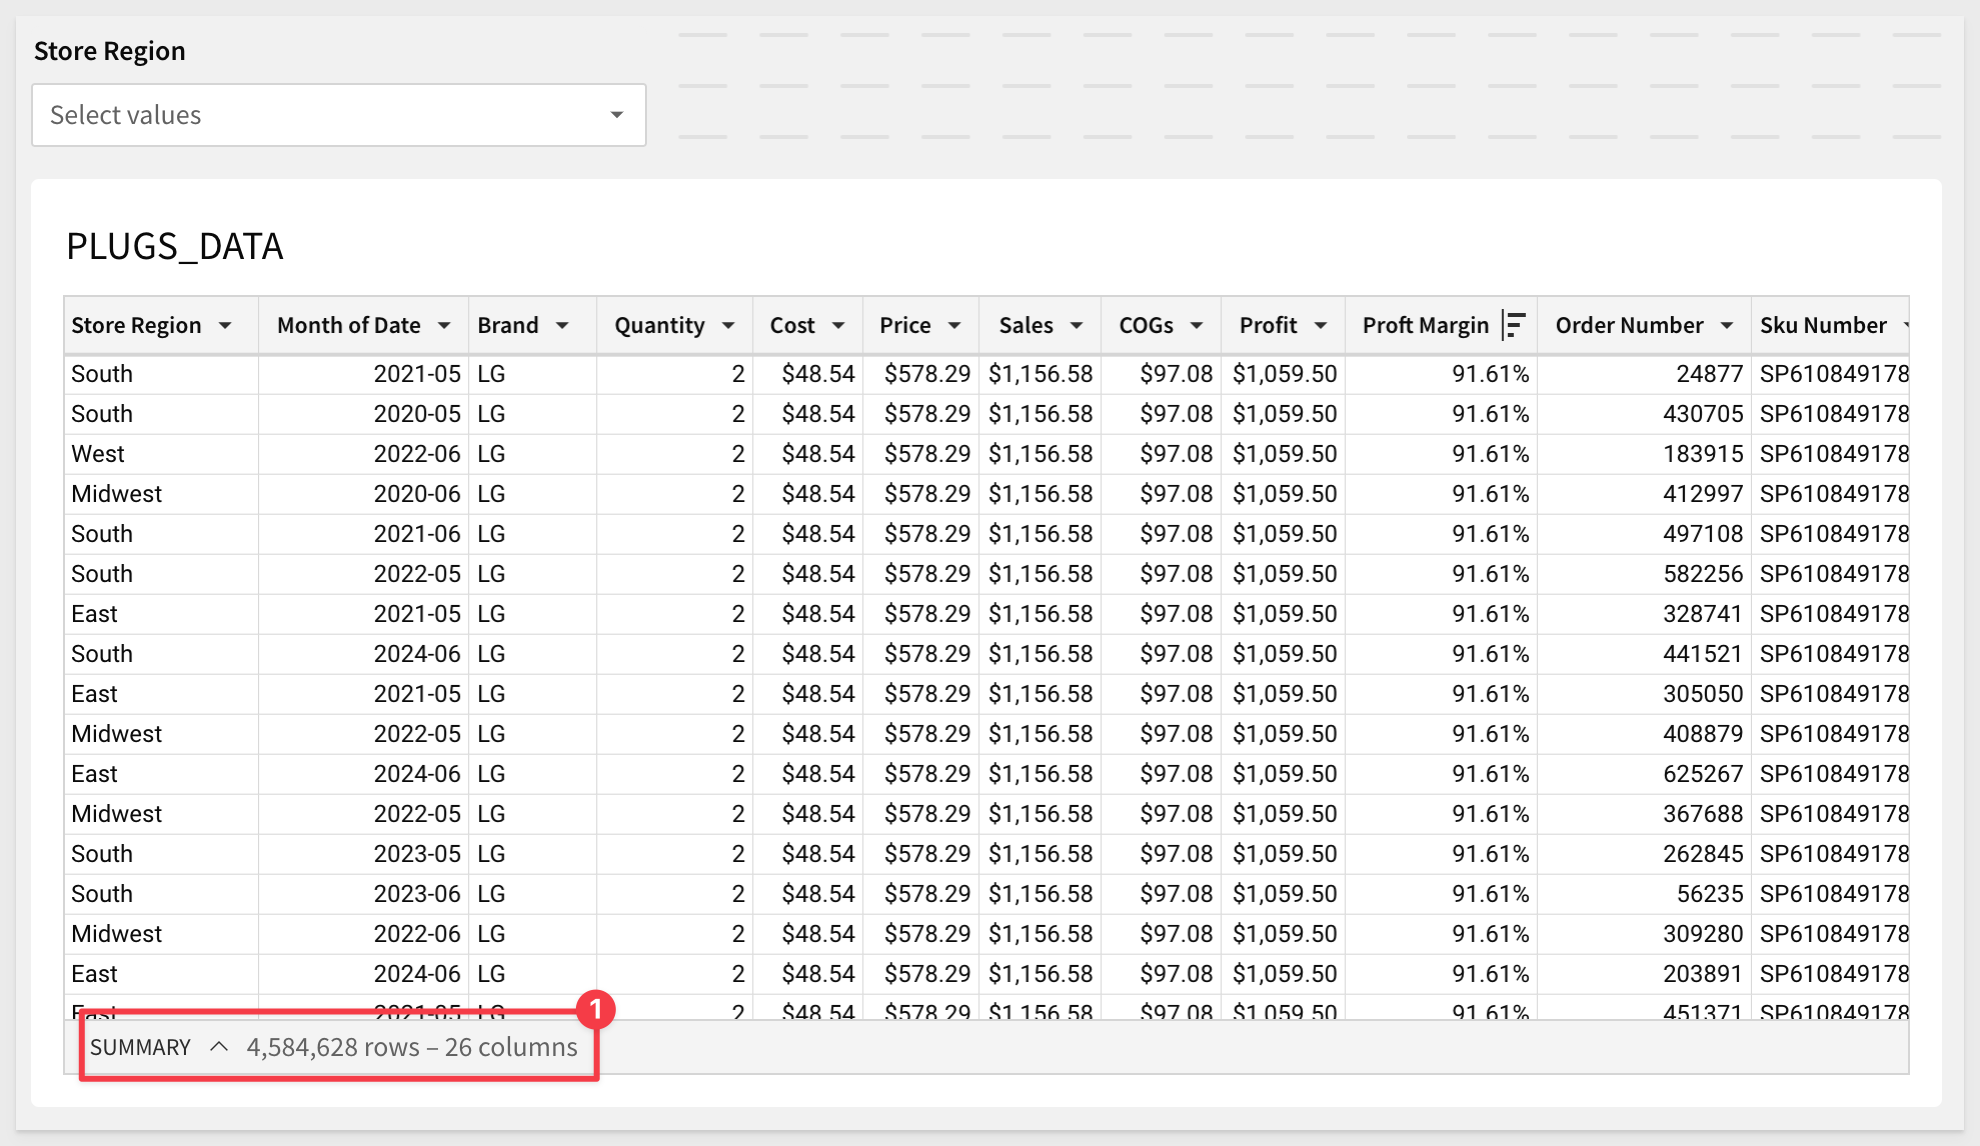
At this point, our dashboard looks like this (in edit mode still), with about 4.58M rows:
There are several ways to sort data in Sigma.
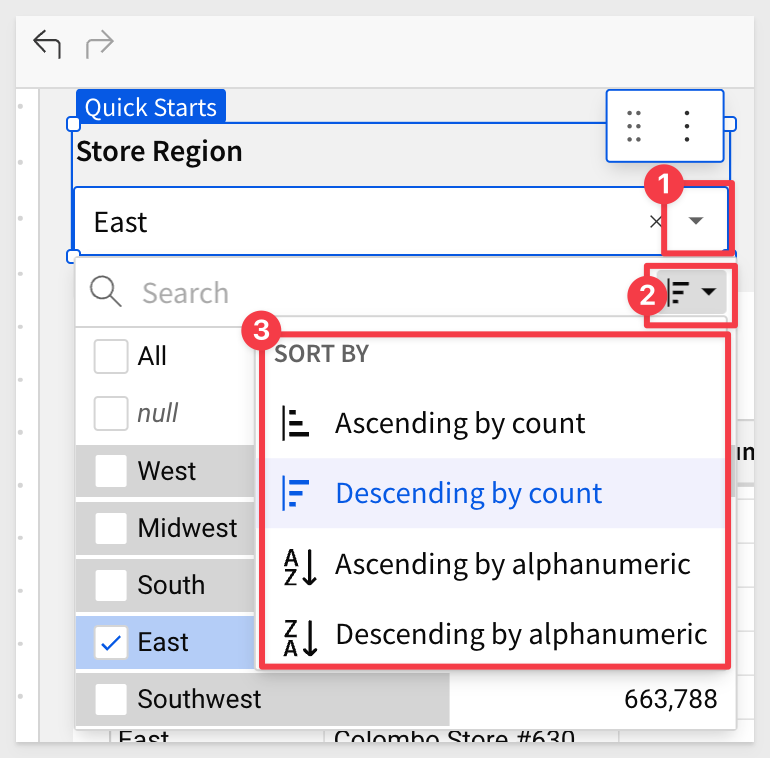
Since we have a page control for Store Regions on the page, we can access the sort options it provides:
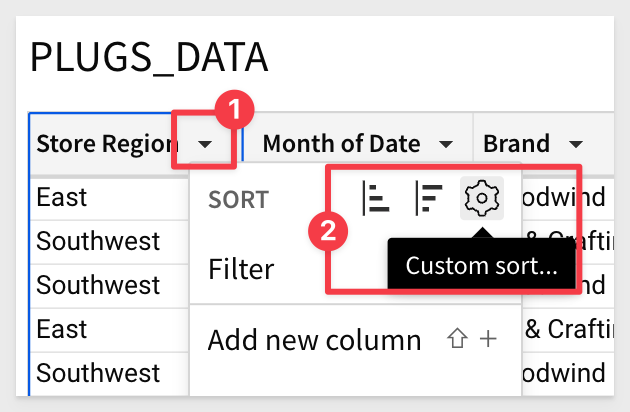
Sorting on any column is available by accessing the column's menu:
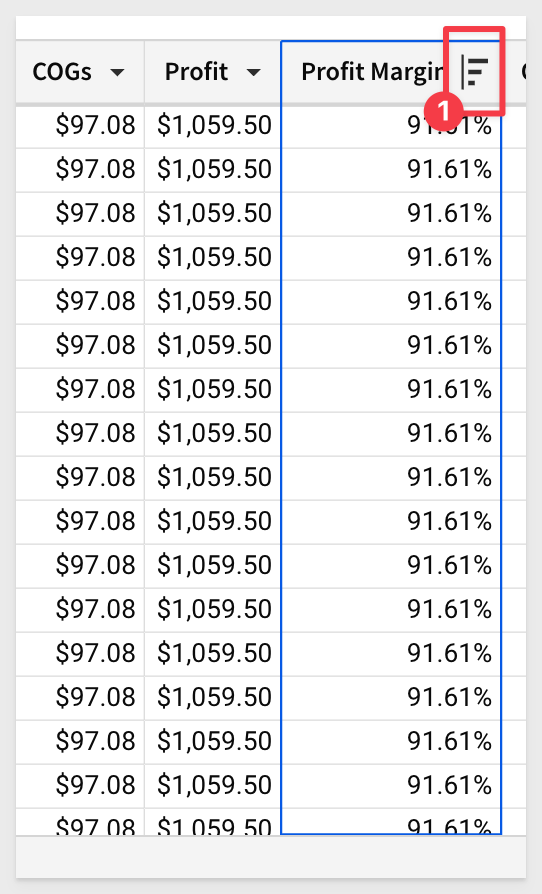
When a column as a sort order set, it will display an icon:
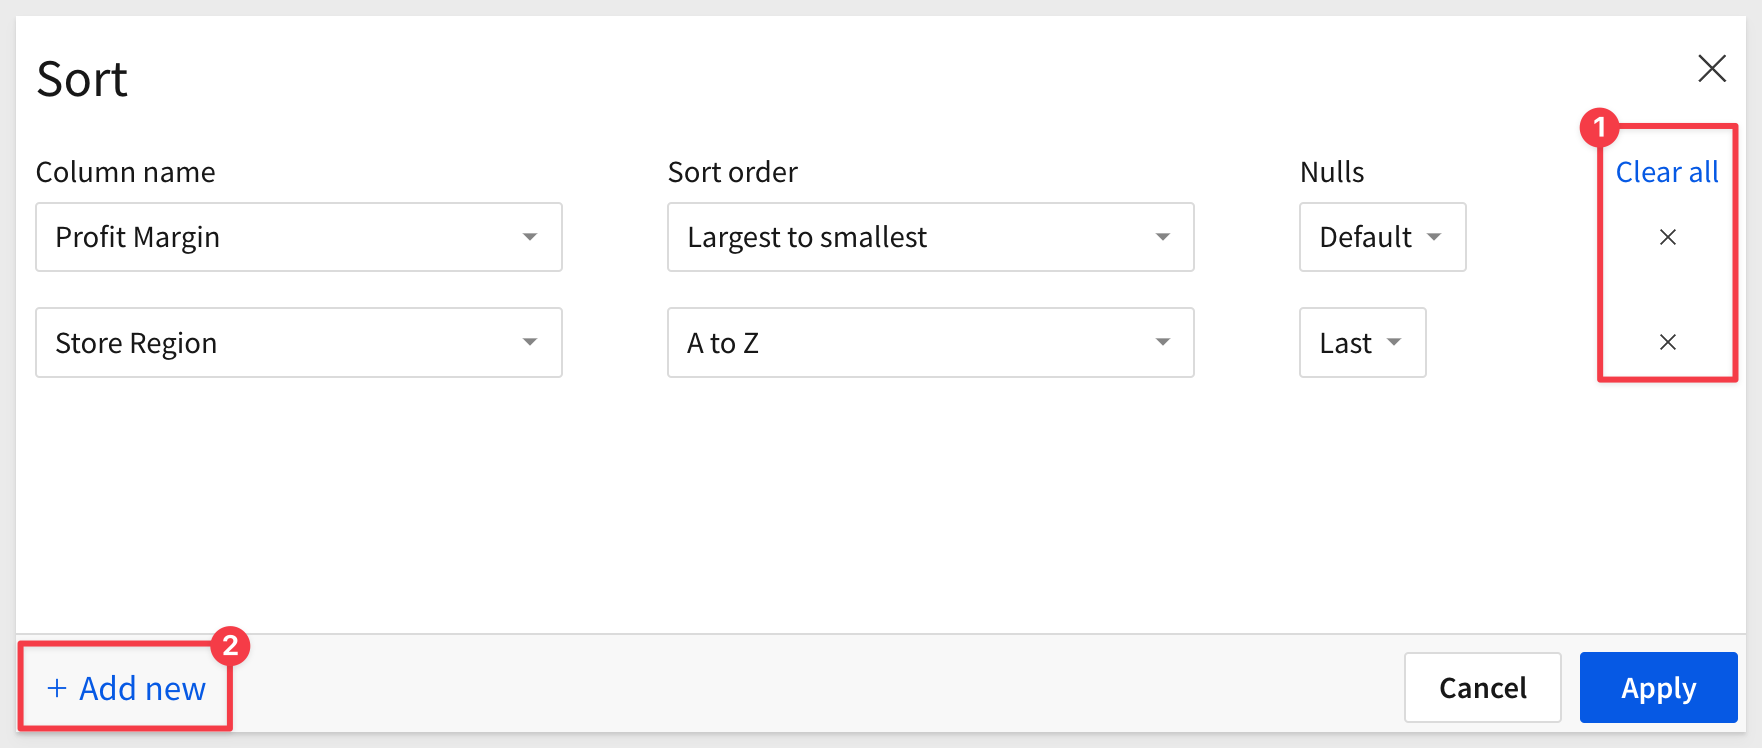
Along with ascending/descending options there is a custom sort that provides a way to create sorts based on multiple columns and orders:
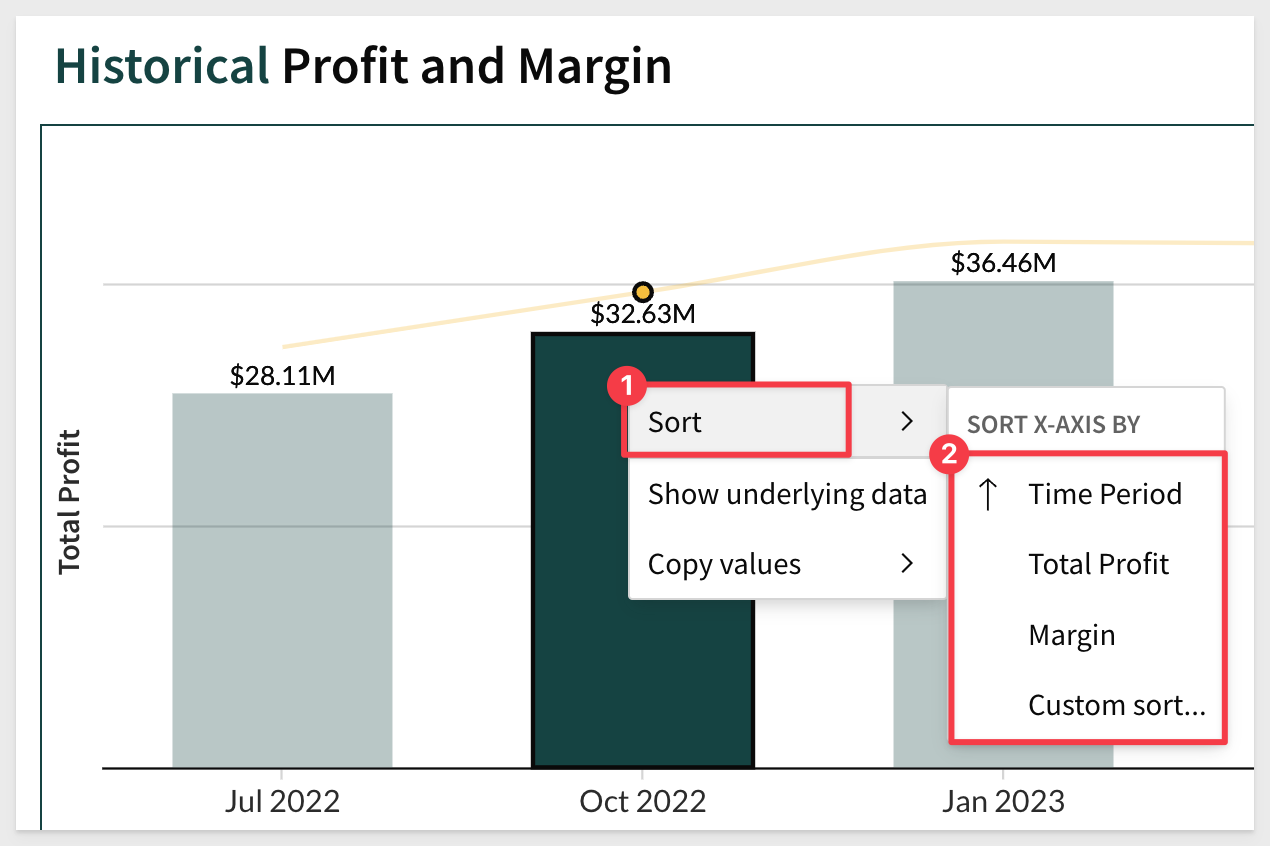
While we have not gotten to visualizations just yet, it is good to know that sort can be applied there as well. Just right-click on any chart bar (for example) and select sort:
At this point (with filters removed), our dashboard still looks like this (in edit mode still), with about 4.58M rows:
So far we have done some pretty simple operations.
Let's go a bit deeper and group the data, building on the work we just did.
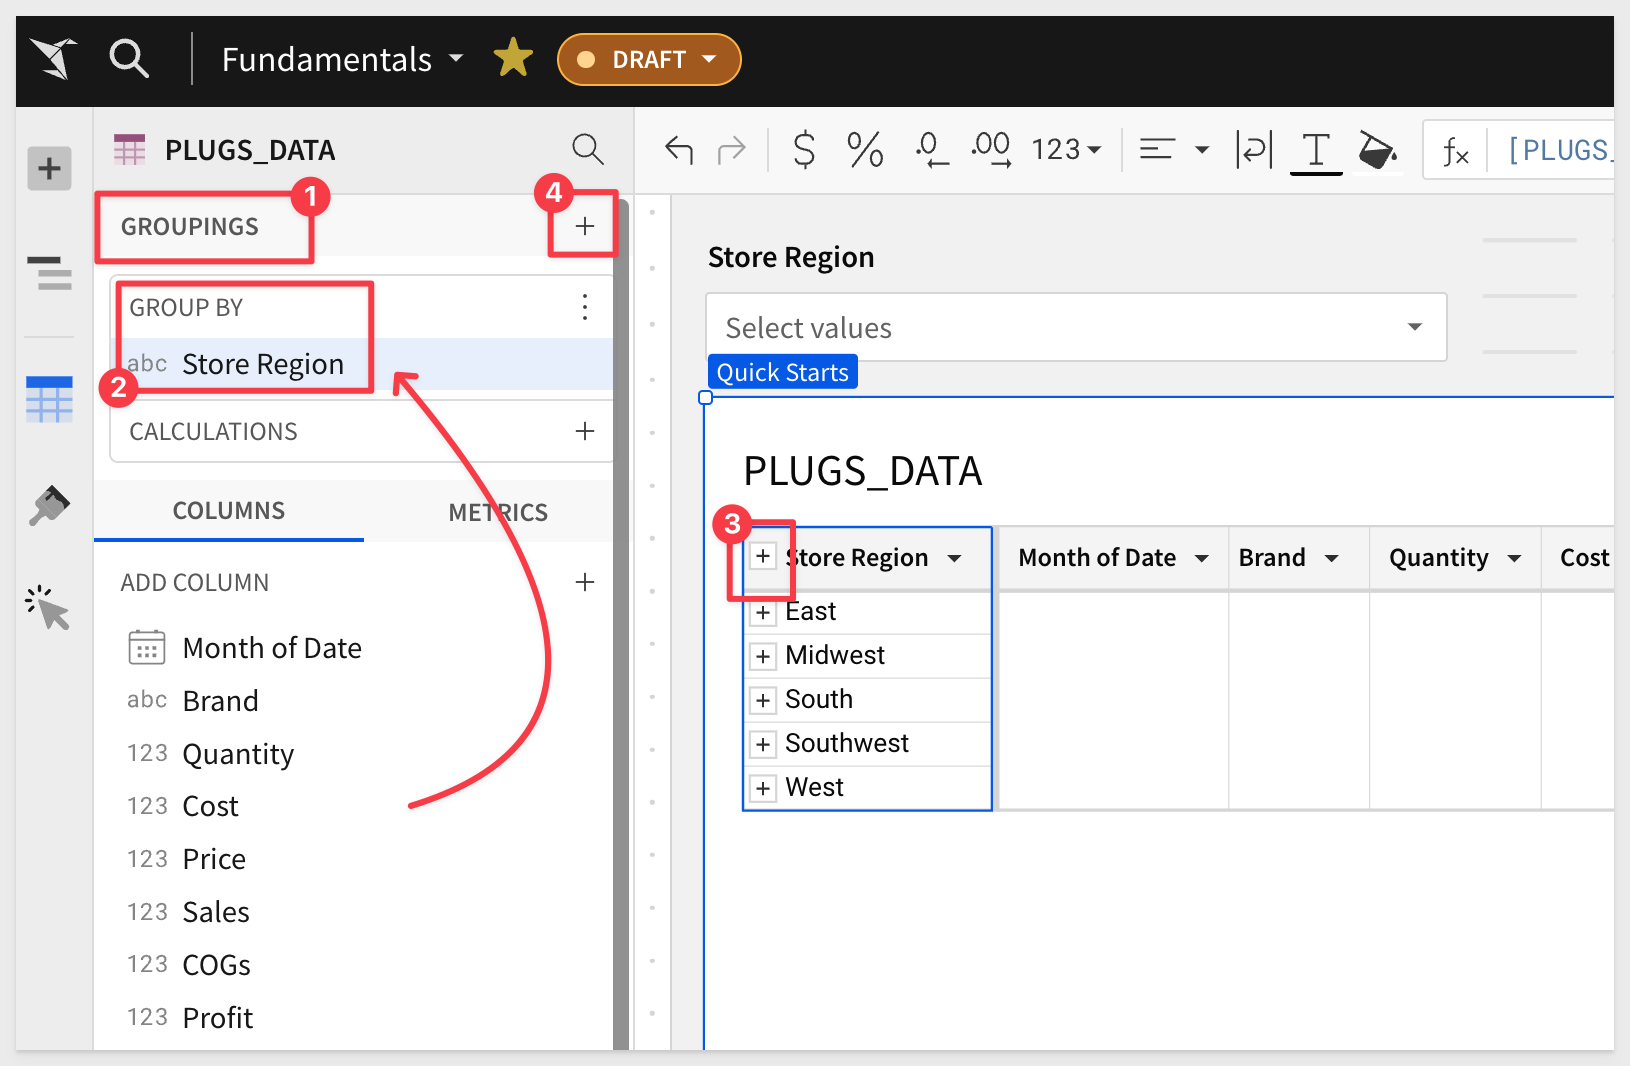
There are a few ways to group data.
1: The specific column's menu in the table.
2: Drag and drop a column using the element panel
3: Click the + icon in the element panel > GROUPINGS section (#4)
Group by Store Region
Group the Store Region column using one of these methods, or use one method, undo that and try another.
Whichever works best for you is fine.
After grouping, you can collapse the groupings by clicking the - to the left of the Store Region column name (#3).
Summarizing Profit
We want to show the sum of profit for each region and we already have added a calculated column that shows profit per row.
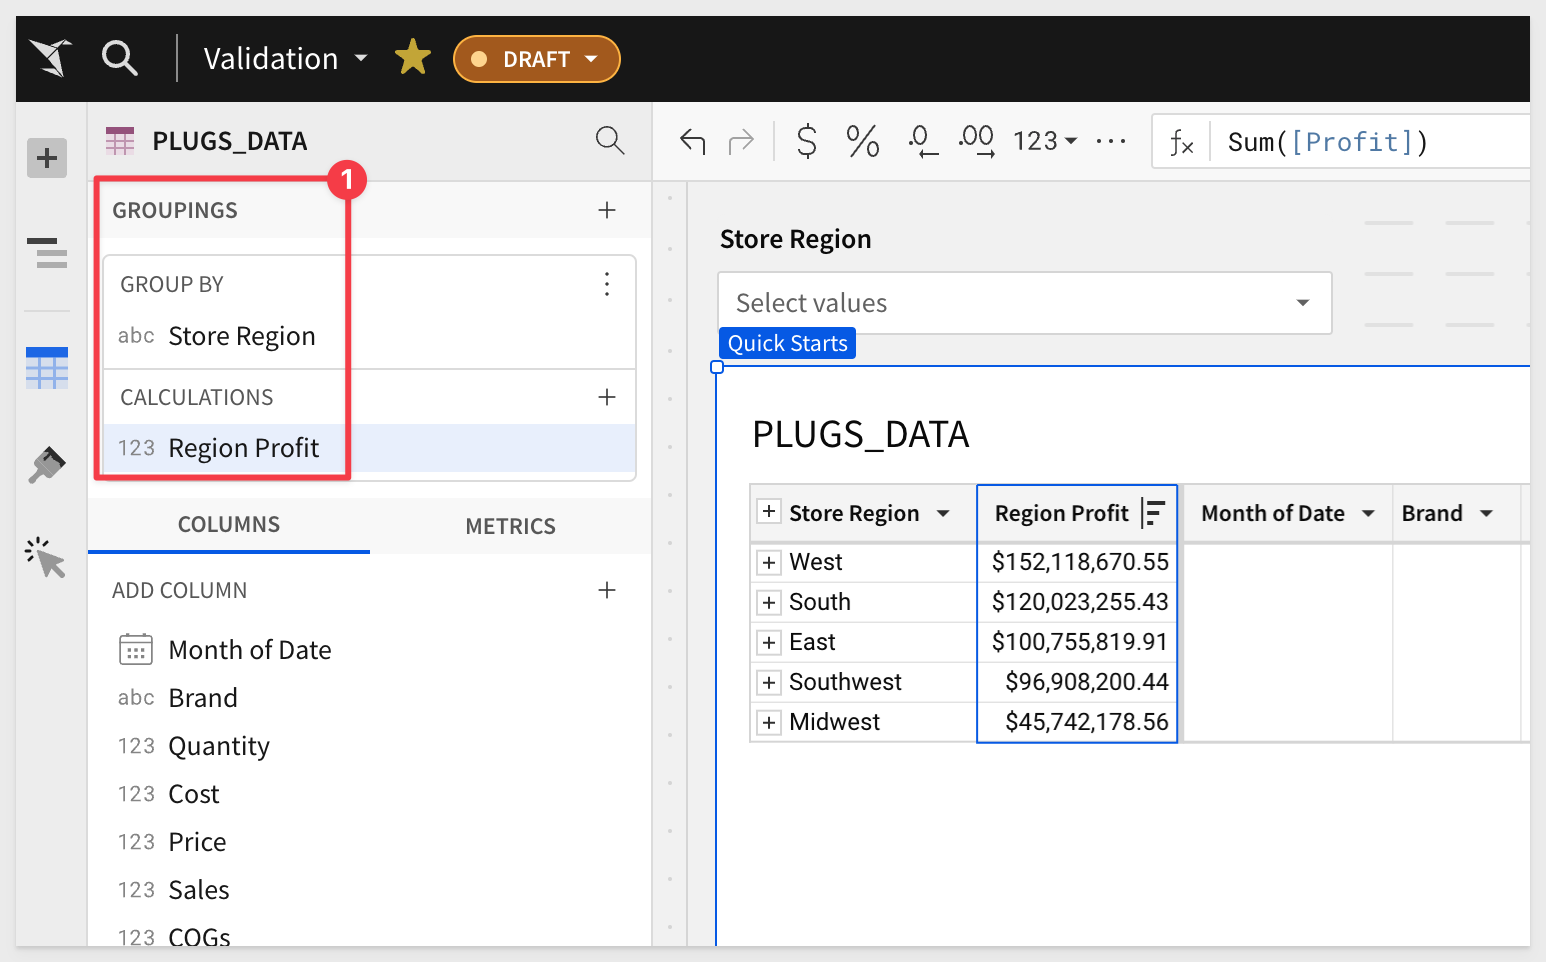
To add this rollup, we simply drag and drop the Profit column in the element panel (the PLUGS_DATA table has to be selected), and place it in the GROUP BY > CALCULATIONS section of the GROUPINGS panel.
Rename the calculation column to `Region Profit:
We can add as many groupings and calculations as required.
To learn more about grouping in Sigma, see here.
Sort the Region Profit column.
Click Publish.
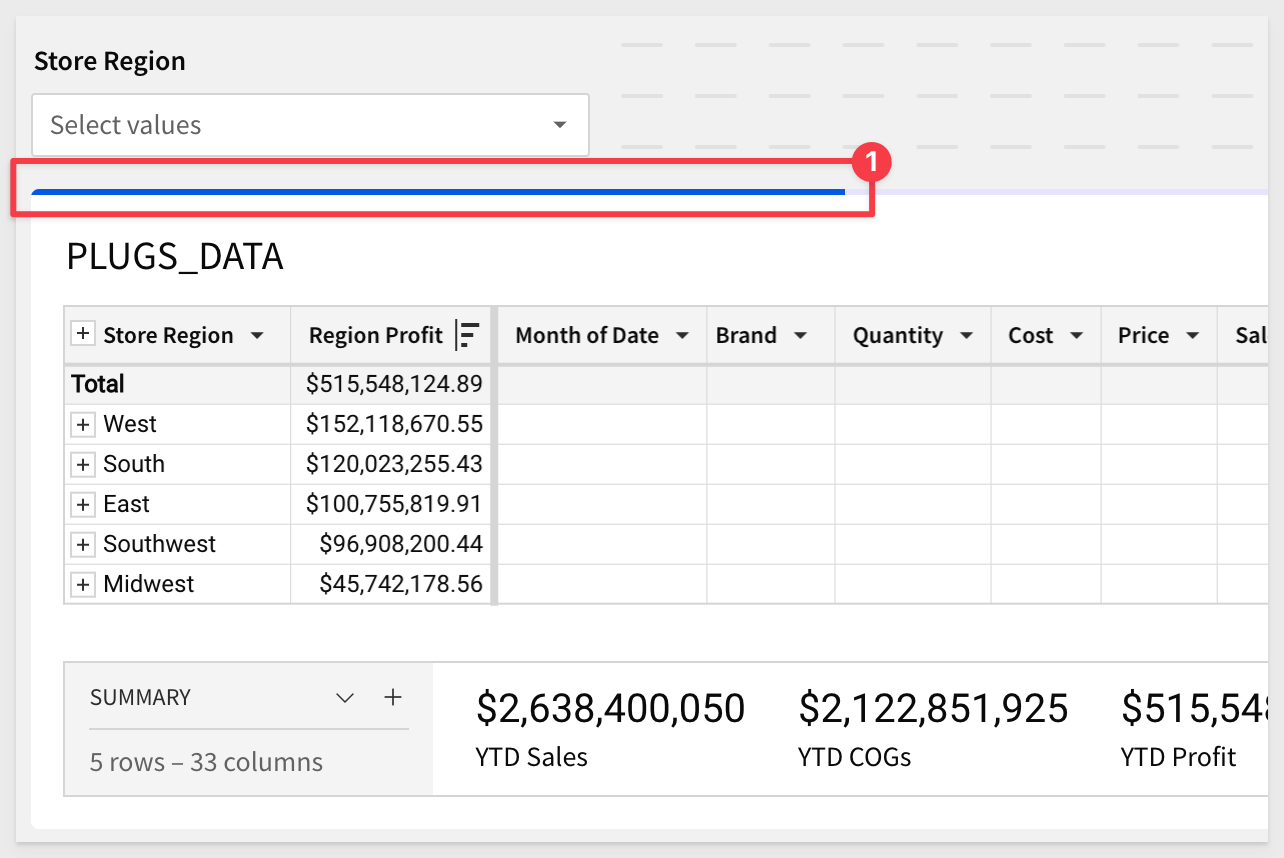
The table should now look like this:
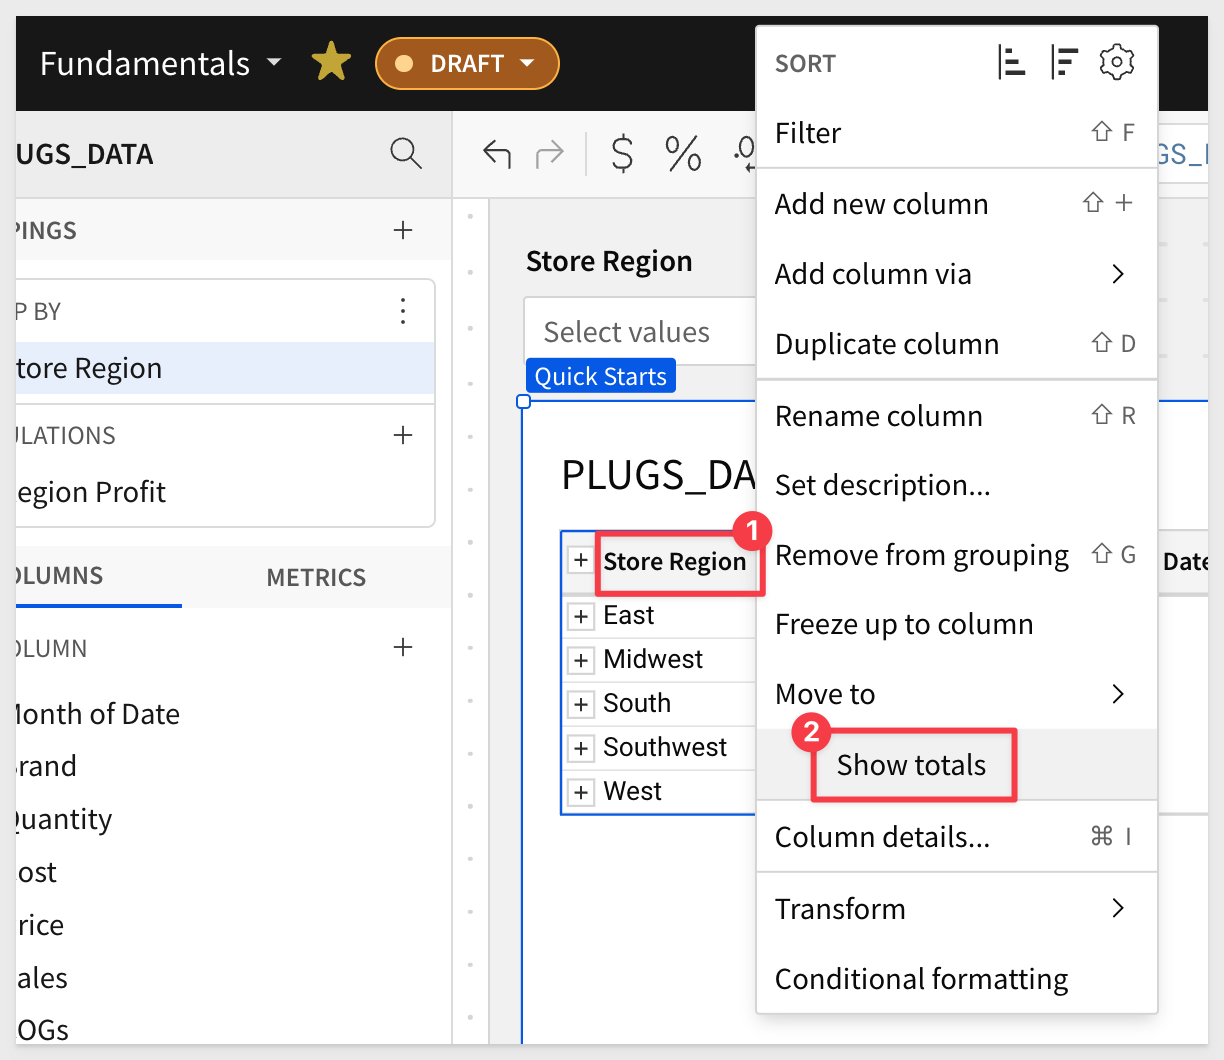
Sigma workbook tables provide a simple way to get totals and subtotals.
From the Store Region column header dropdown, select Show Totals:
We now have the total for all Store Regions:
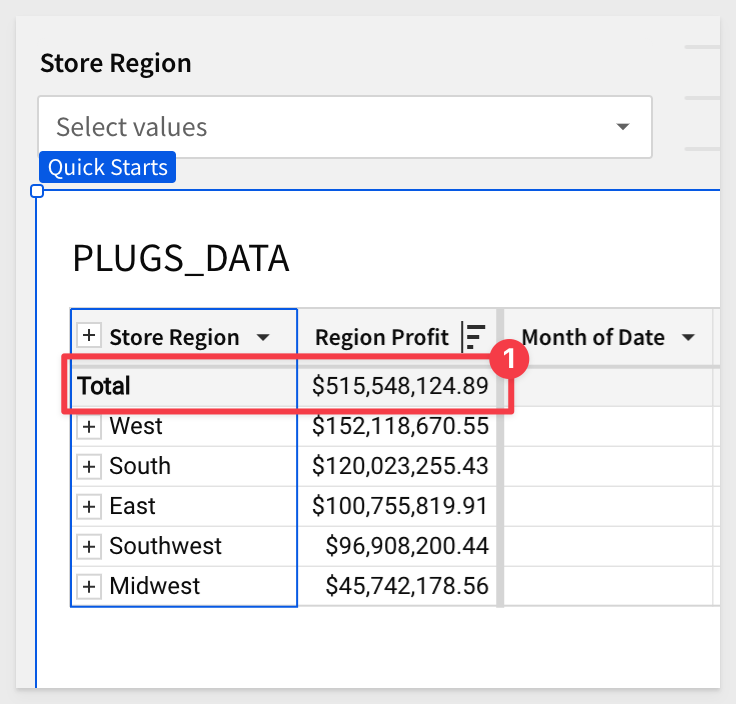
Click Publish.
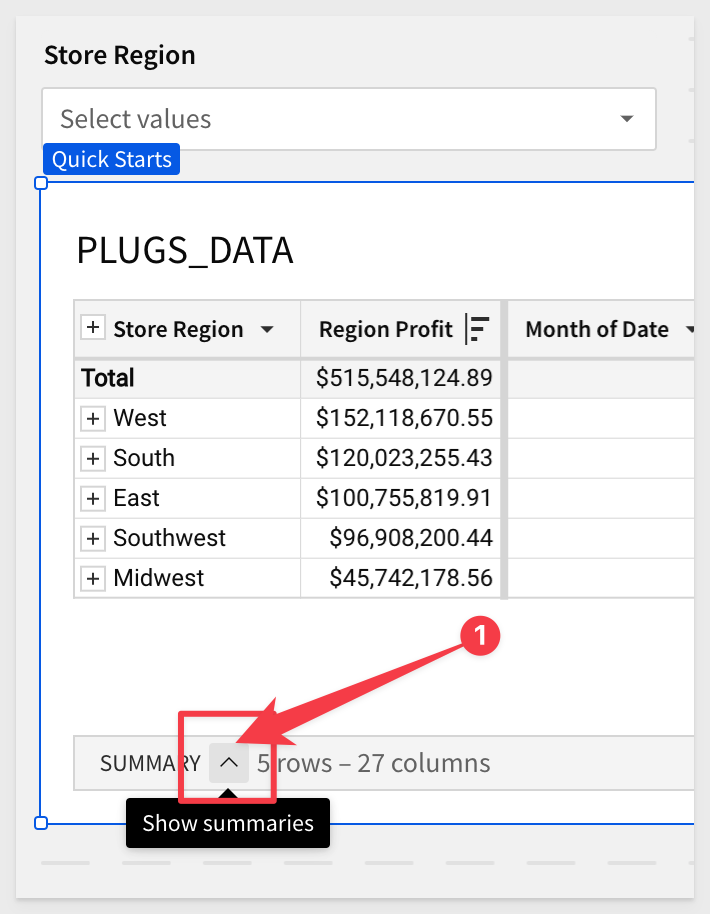
Sigma also has the ability to create Summary Values across the entire table.
At the bottom of the table you will see a line that says SUMMARY, which shows the number of rows as well as the number of columns.
At the bottom left corner of the table click on the caret:
And click the + button:
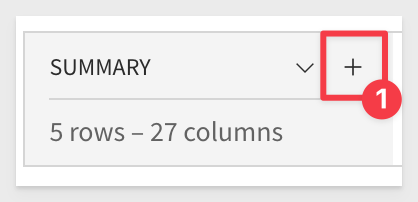
Select the Region Profit column. Sigma will automatically sum the column.
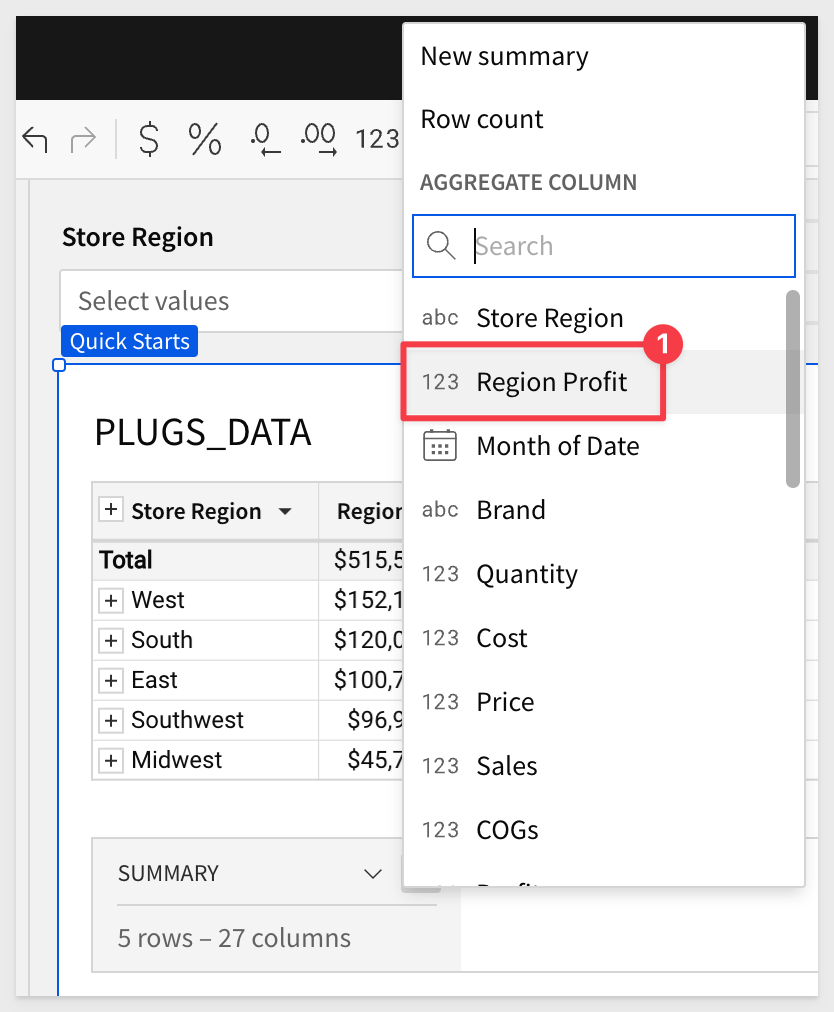
Remove the extra decimals and rename to change it to YTD Profit:
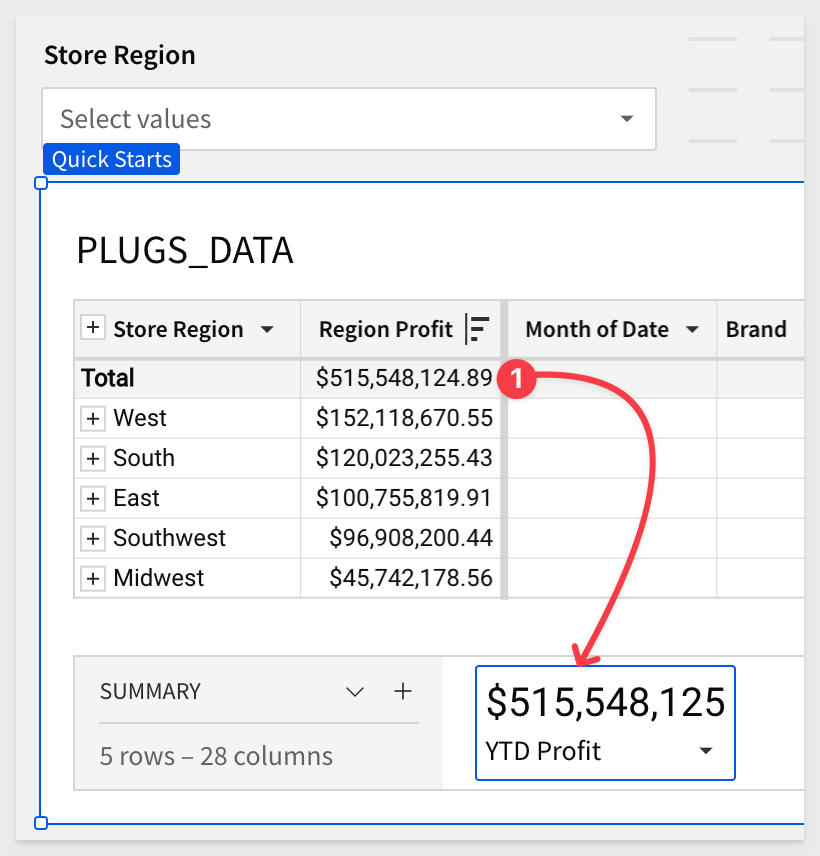
The new summary should match the Total in the table from the previous section.
Go ahead and add two more summaries based on the COGs and Sales columns.
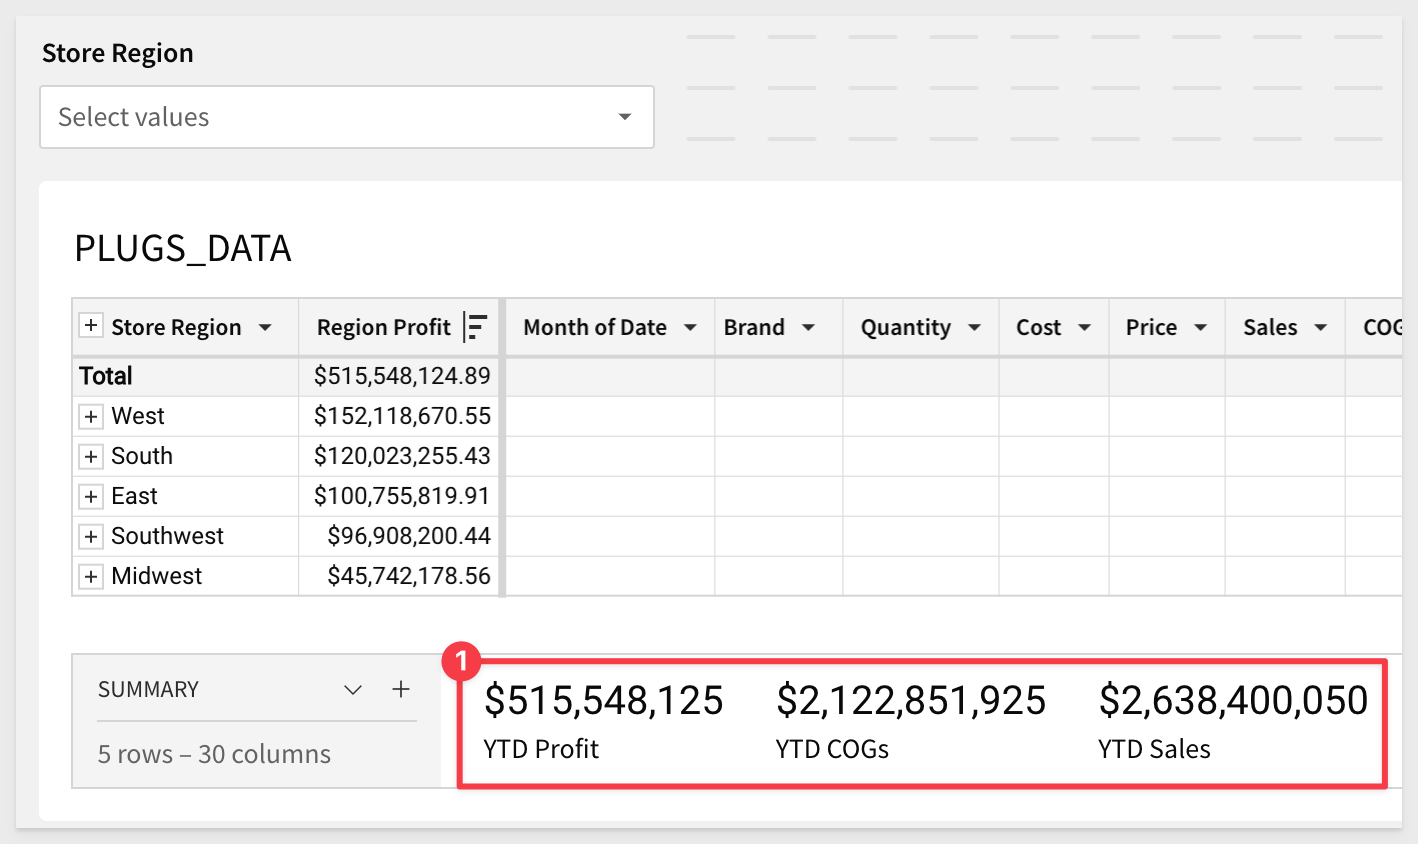
Publish the workbook.
Accessing summaries in formulas
Click the + to add another summary, but this time don't select a column. We can also create a New summary (instead of selected a column) that will be based on some formula we write:
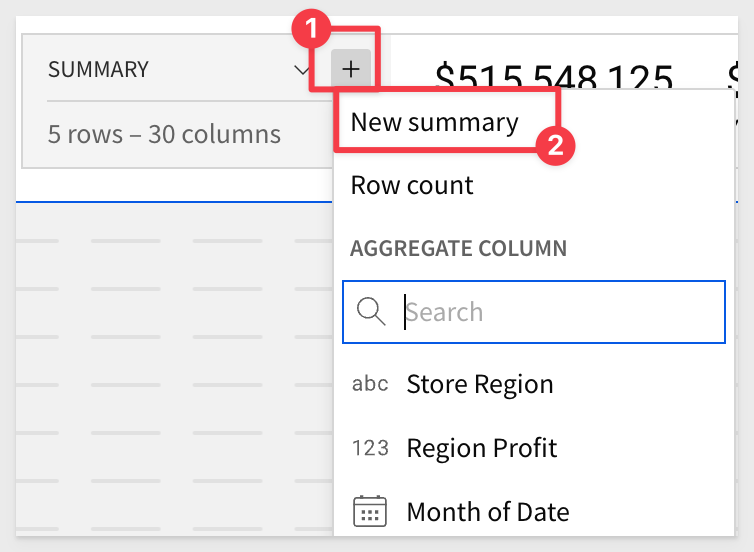
Let's create one more summary value by clicking on the caret ^, and selecting the + button. This time Select New Summary. This will give us a blank summary which we can write a function for:
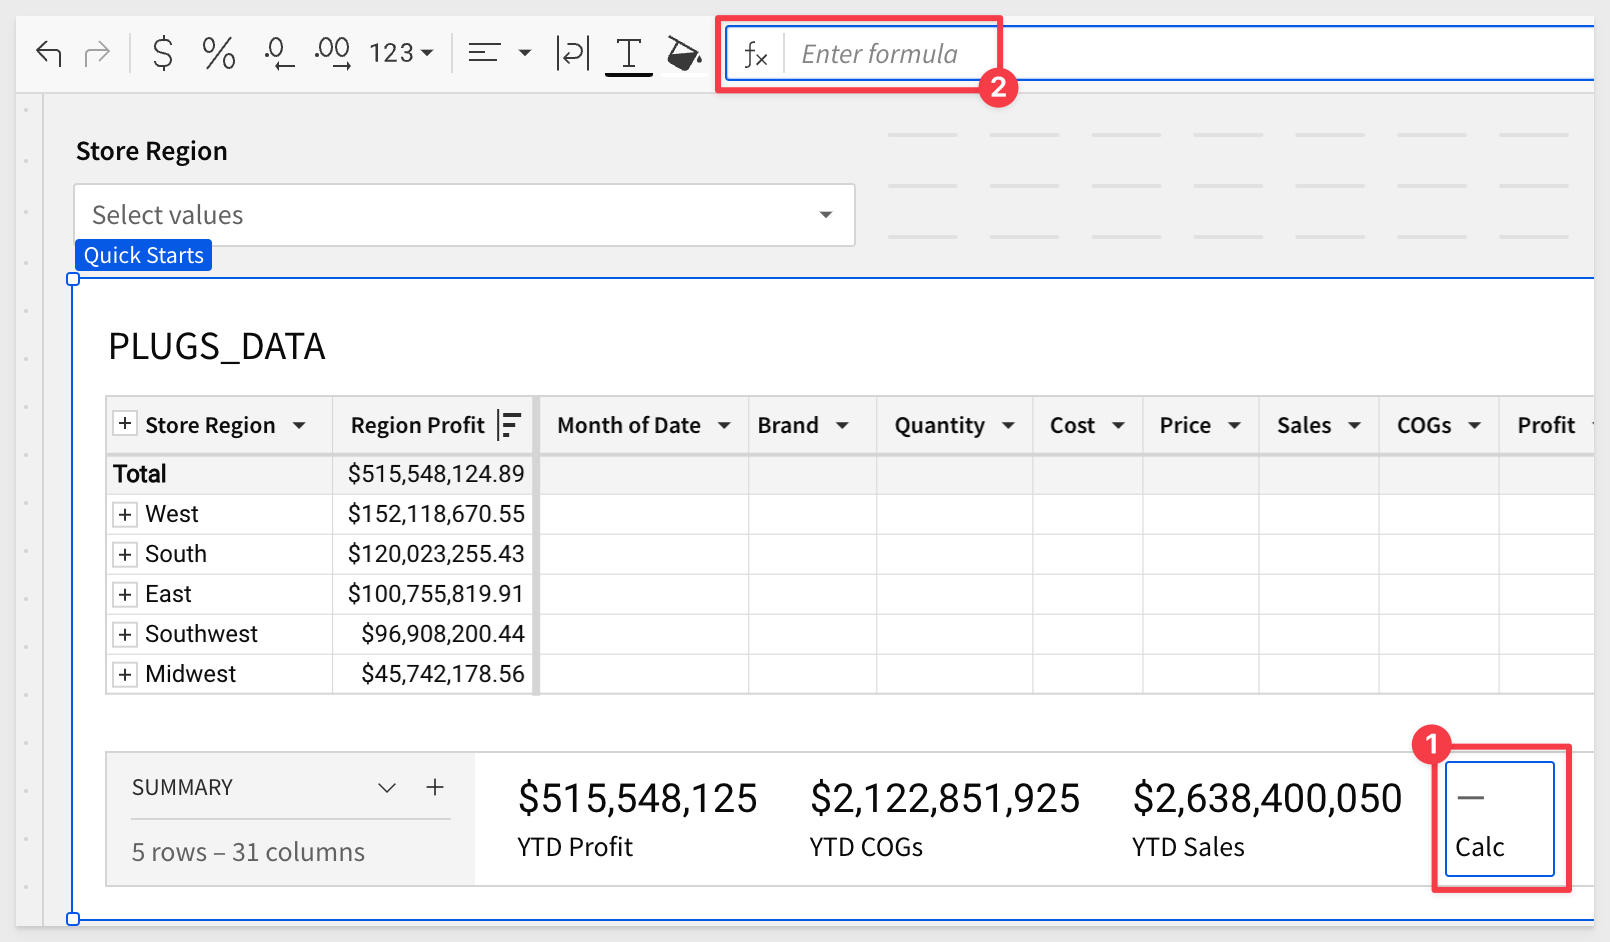
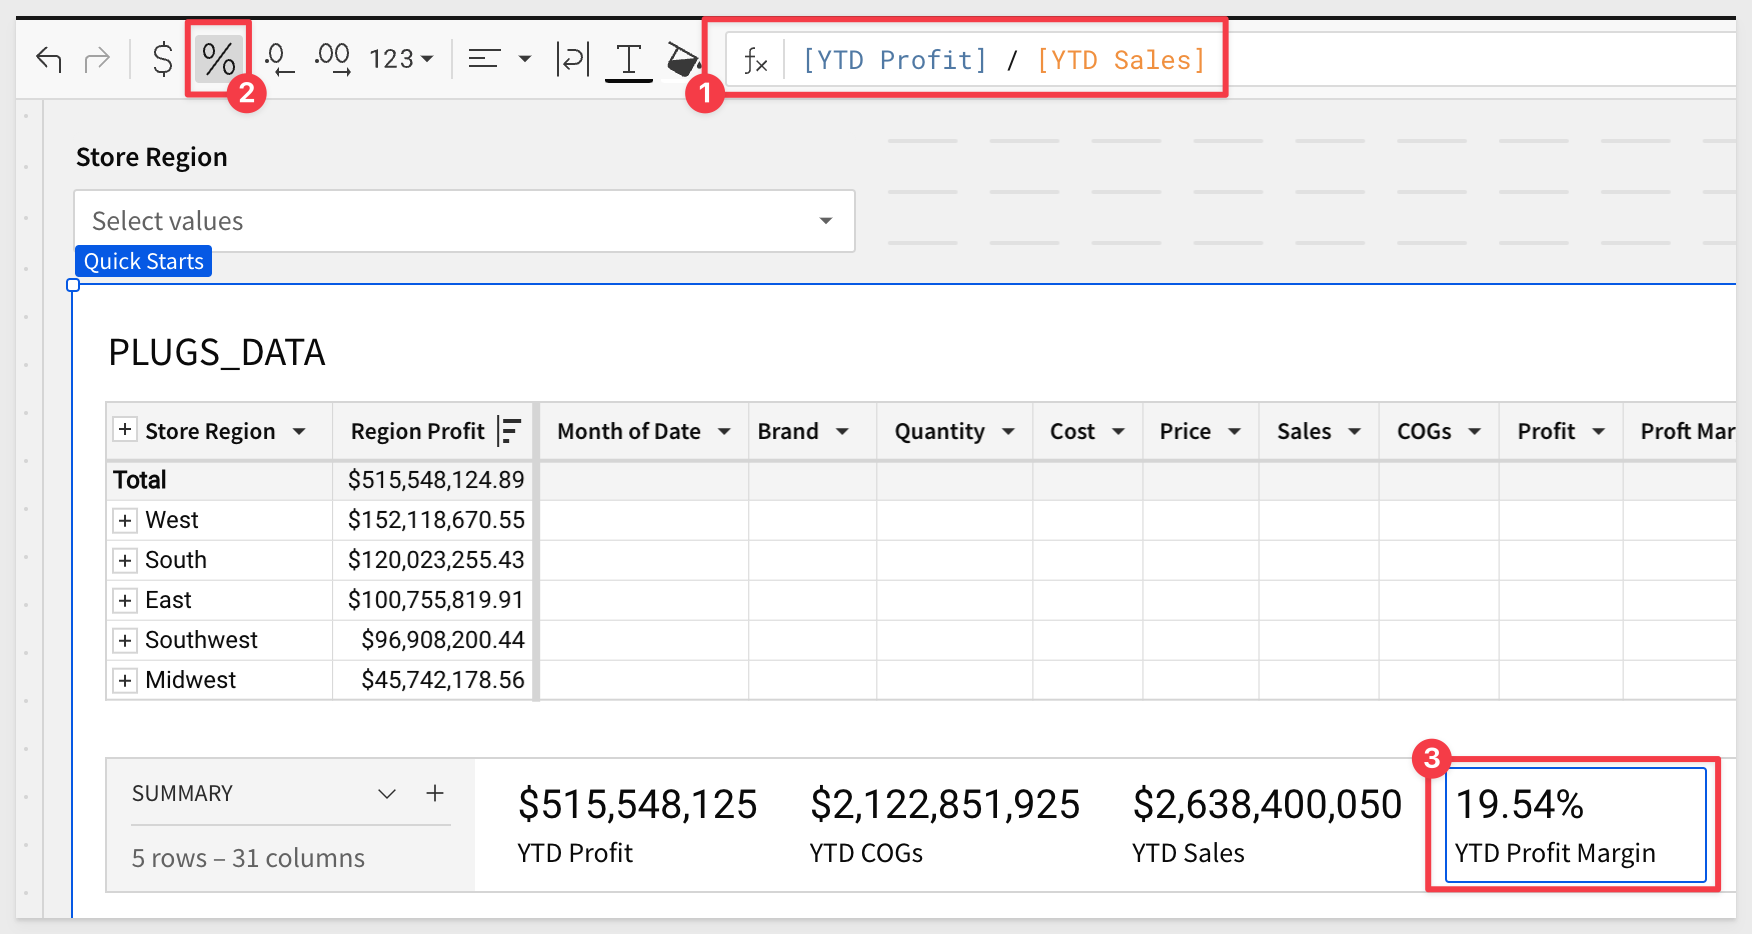
In the function bar, enter the formula bar enter:
[YTD Profit] / [YTD Sales]
It will initially show $0, but we need to change this to be percentage.
Also rename this Summary to YTD Profit Margin.
Grand Total
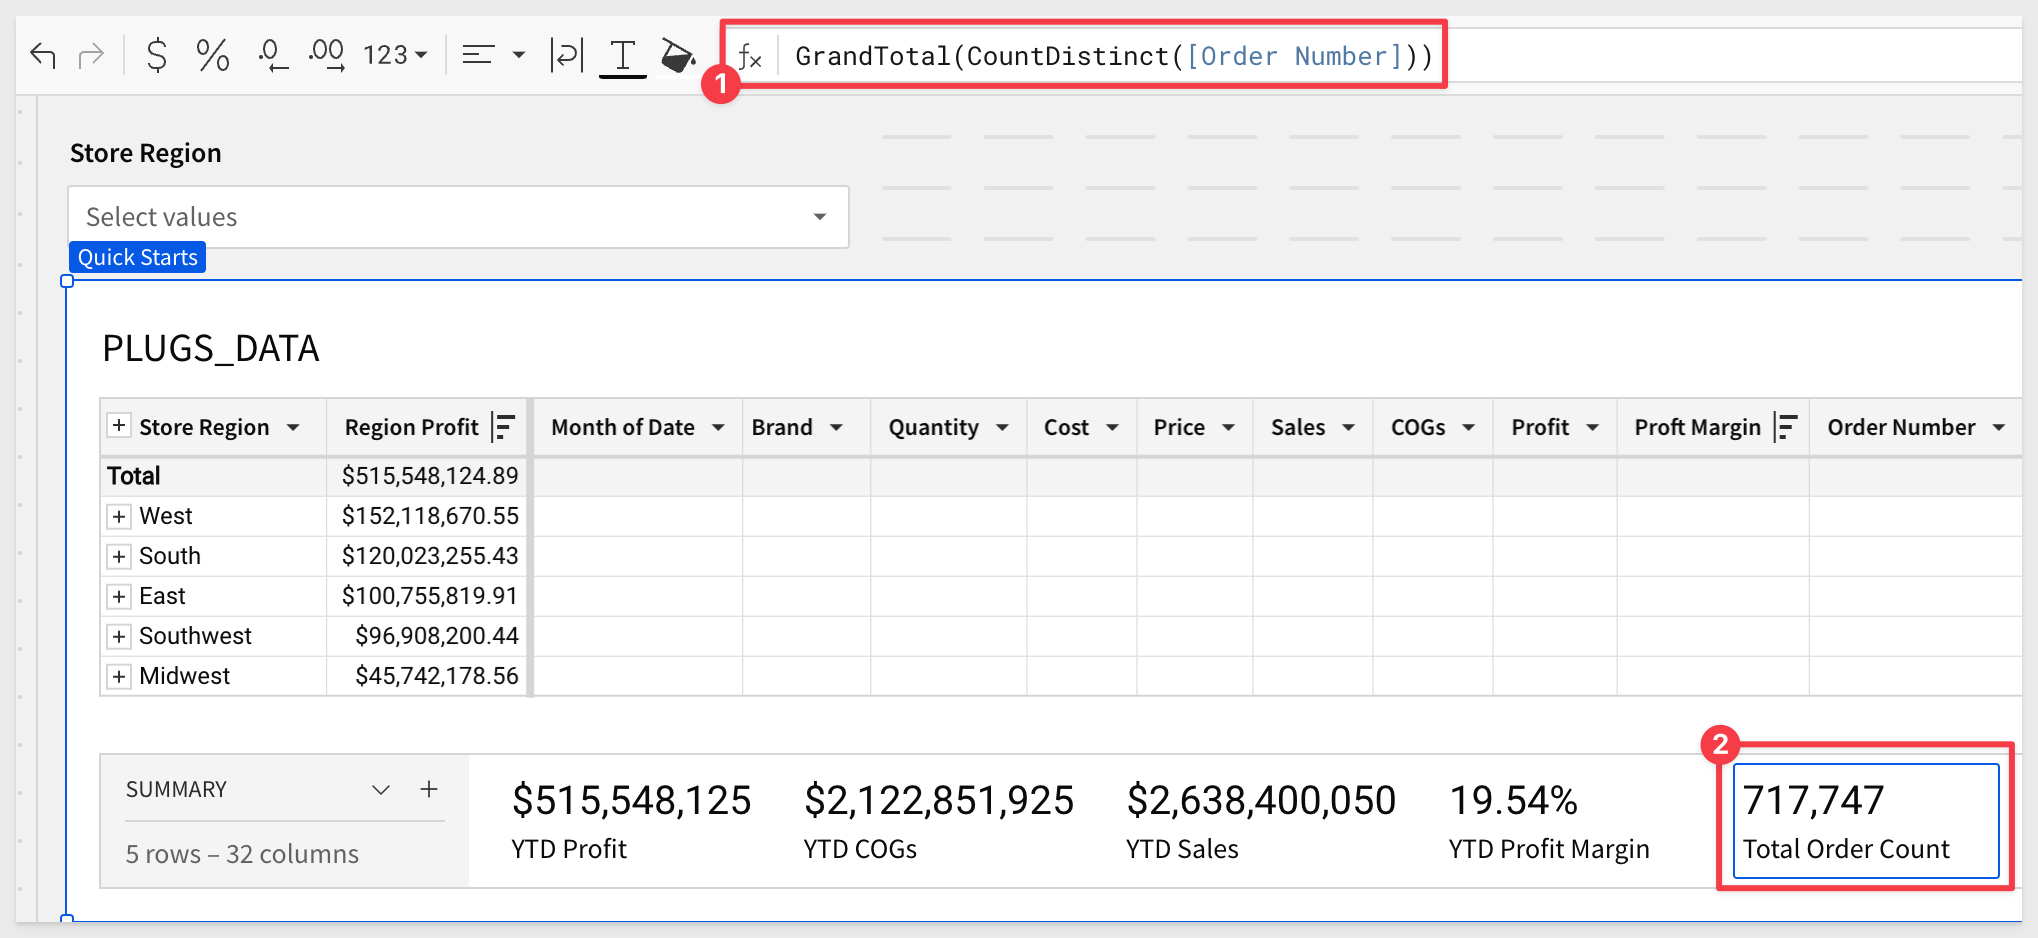
It may also be helpful to have the total number of orders represented in the data. Sigma has a function for that.
Add another New summary and set the formula to:
GrandTotal(CountDistinct([Order Number]))
Rename it to Total Order Count:
It is easy to reorder the summaries with drag and drop:
The table should now look like this:
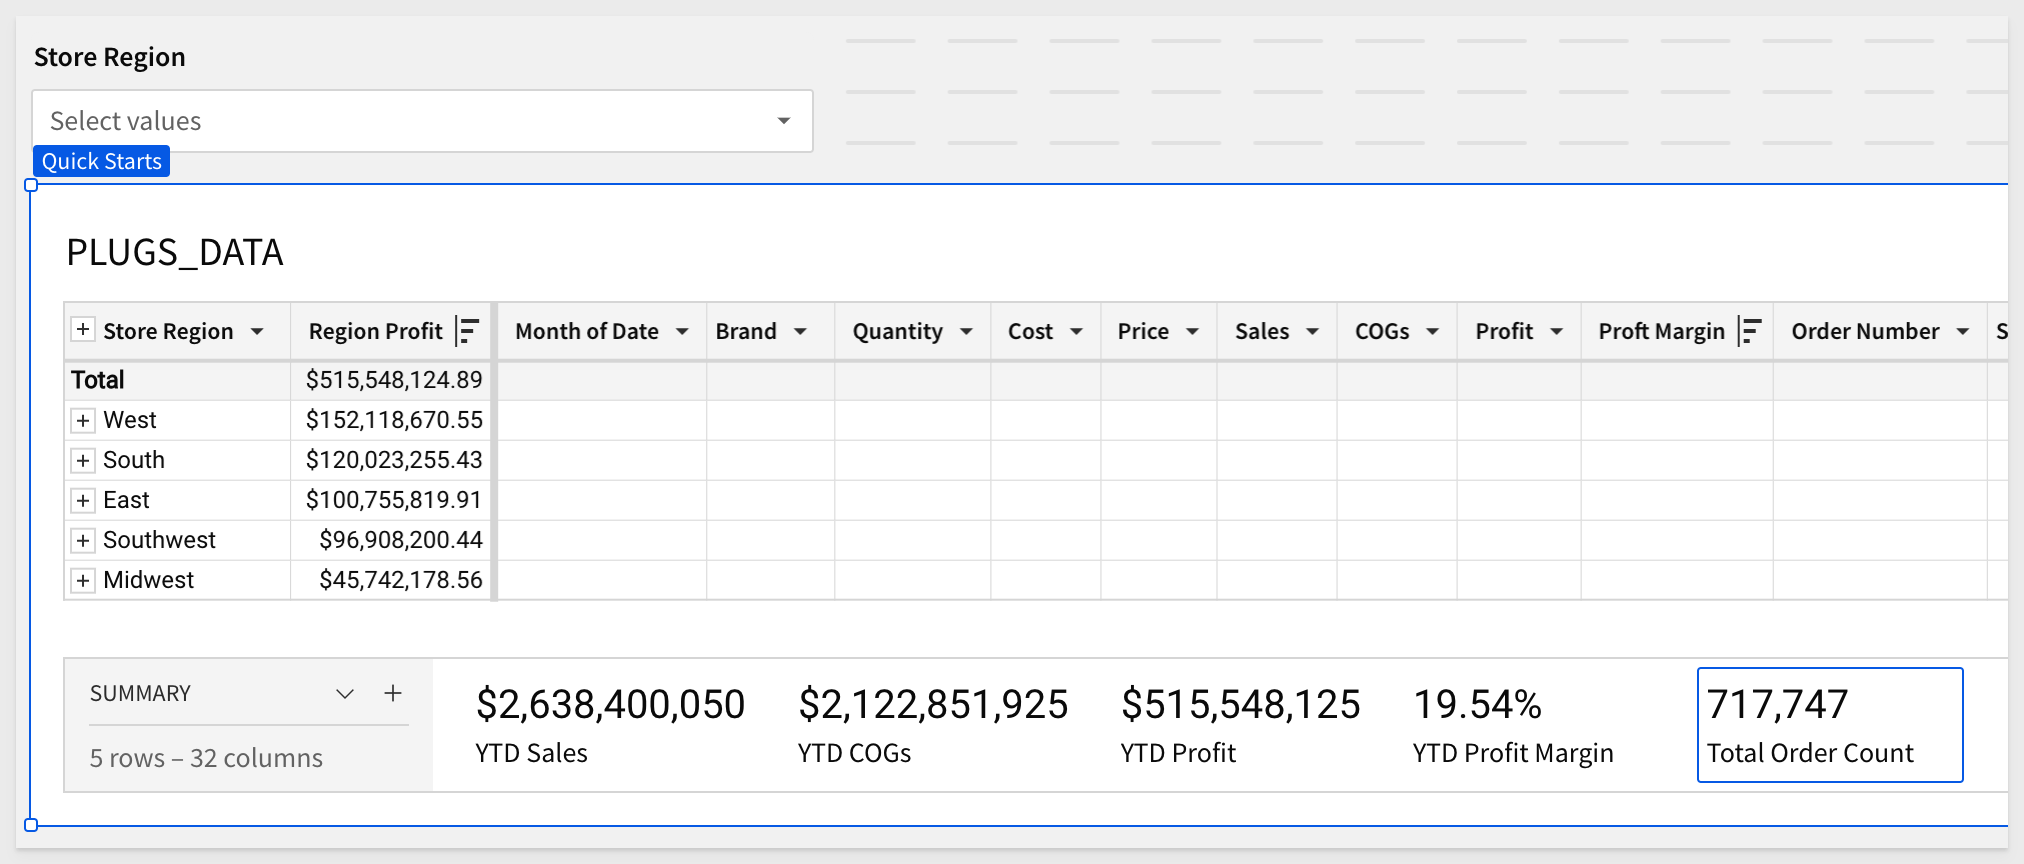
Click Publish.
Up until now, we have been using one table, but in practice, it is often necessary to do some "lite" data modeling.
Data modelling is a broad topic, and in order make this section "fundamental", we will join a sample table from our Sigma Sample Database connection as before.
For those looking for a more comprehensive data modeling solution, see Fundamentals 10: Data Modeling
We will also move a little faster now that we have been oriented in Sigma.
We want to add a column to show inventory on-hand, from the F_INVENTORY_ADJUSTED table by joining it to the existing PLUGS_DATA table, on the Data page.
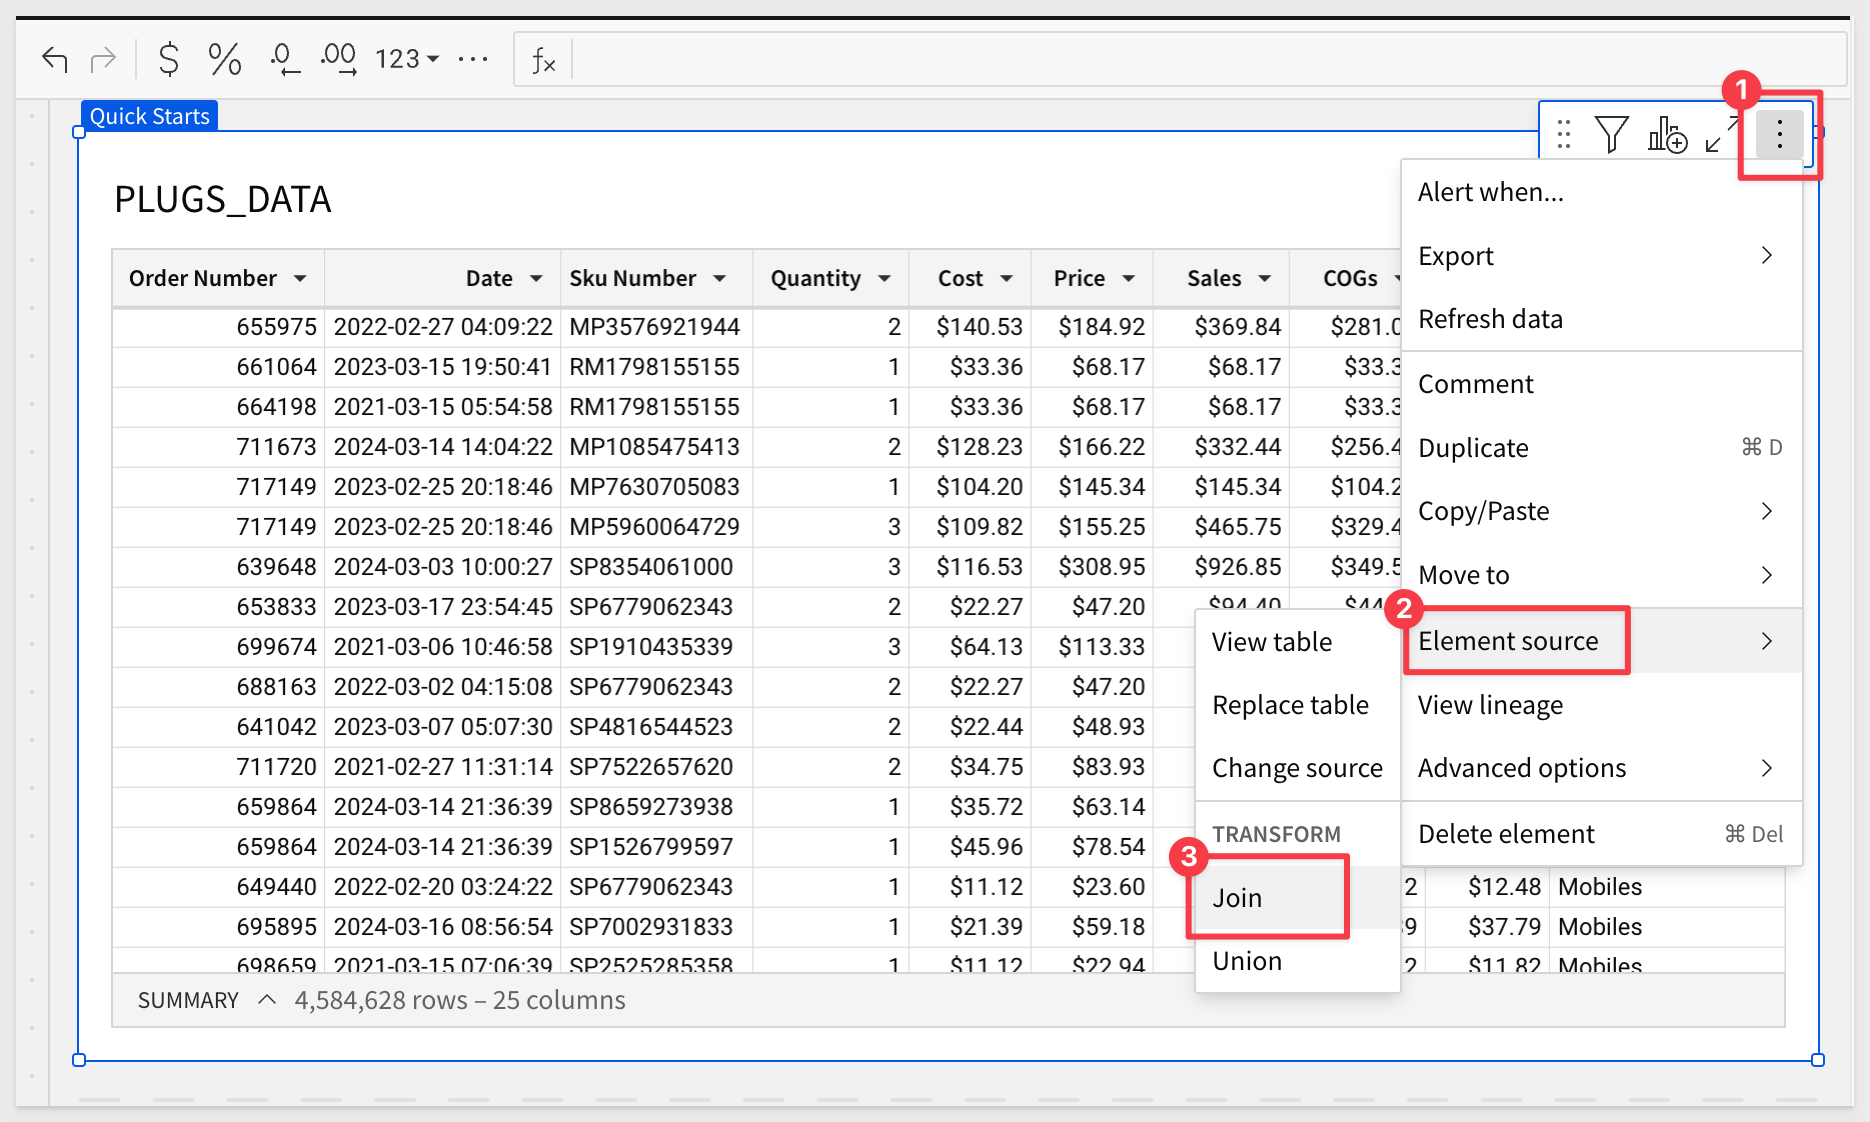
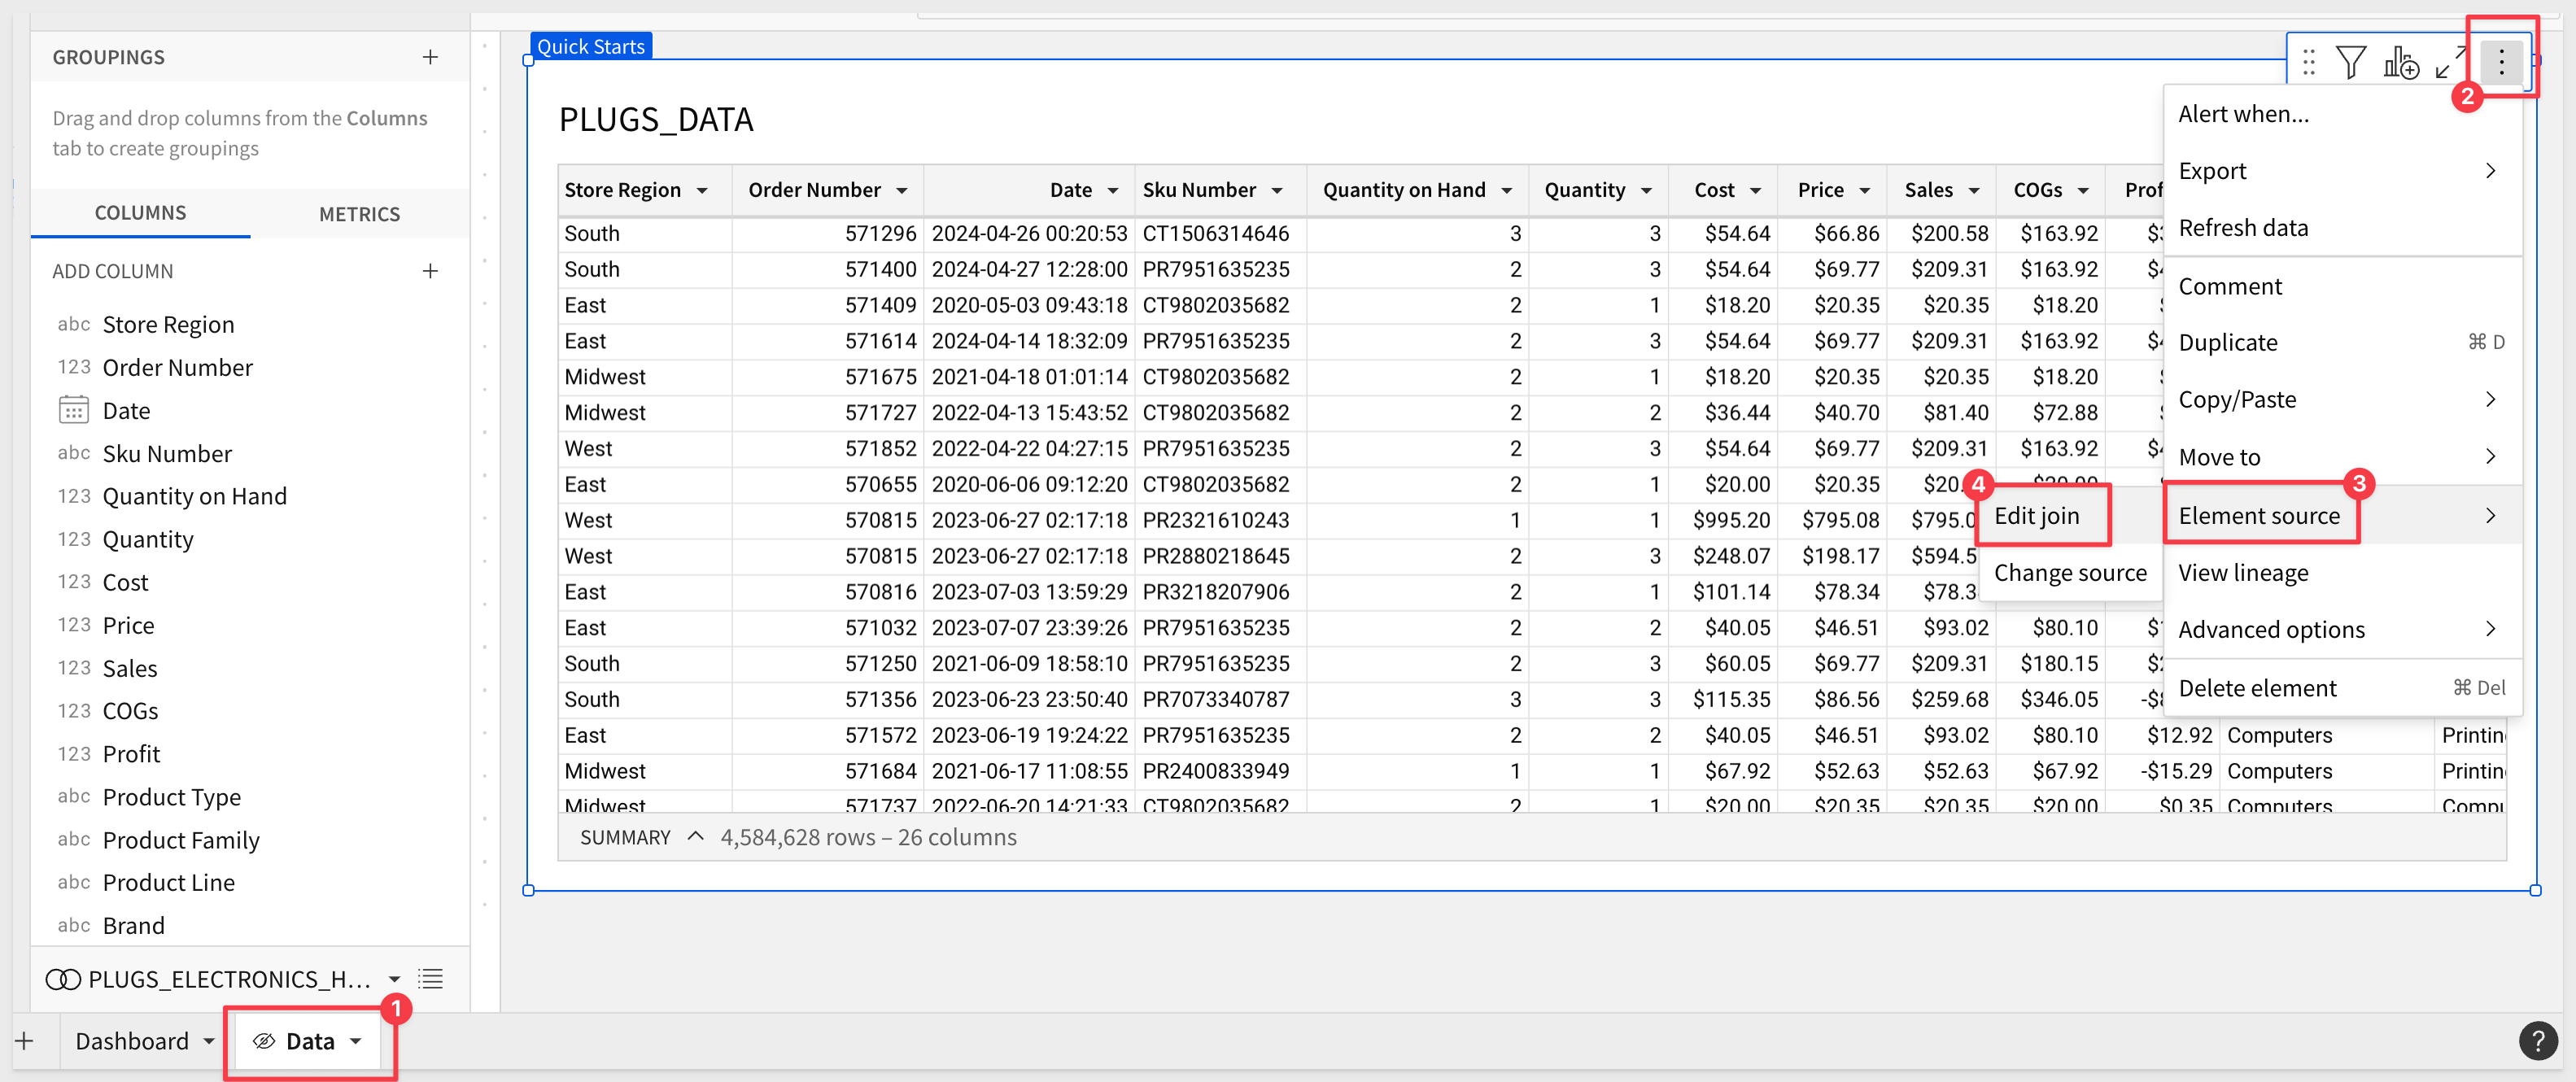
Add an Element source > Join from the PLUGS_DATA table (on the Data page):
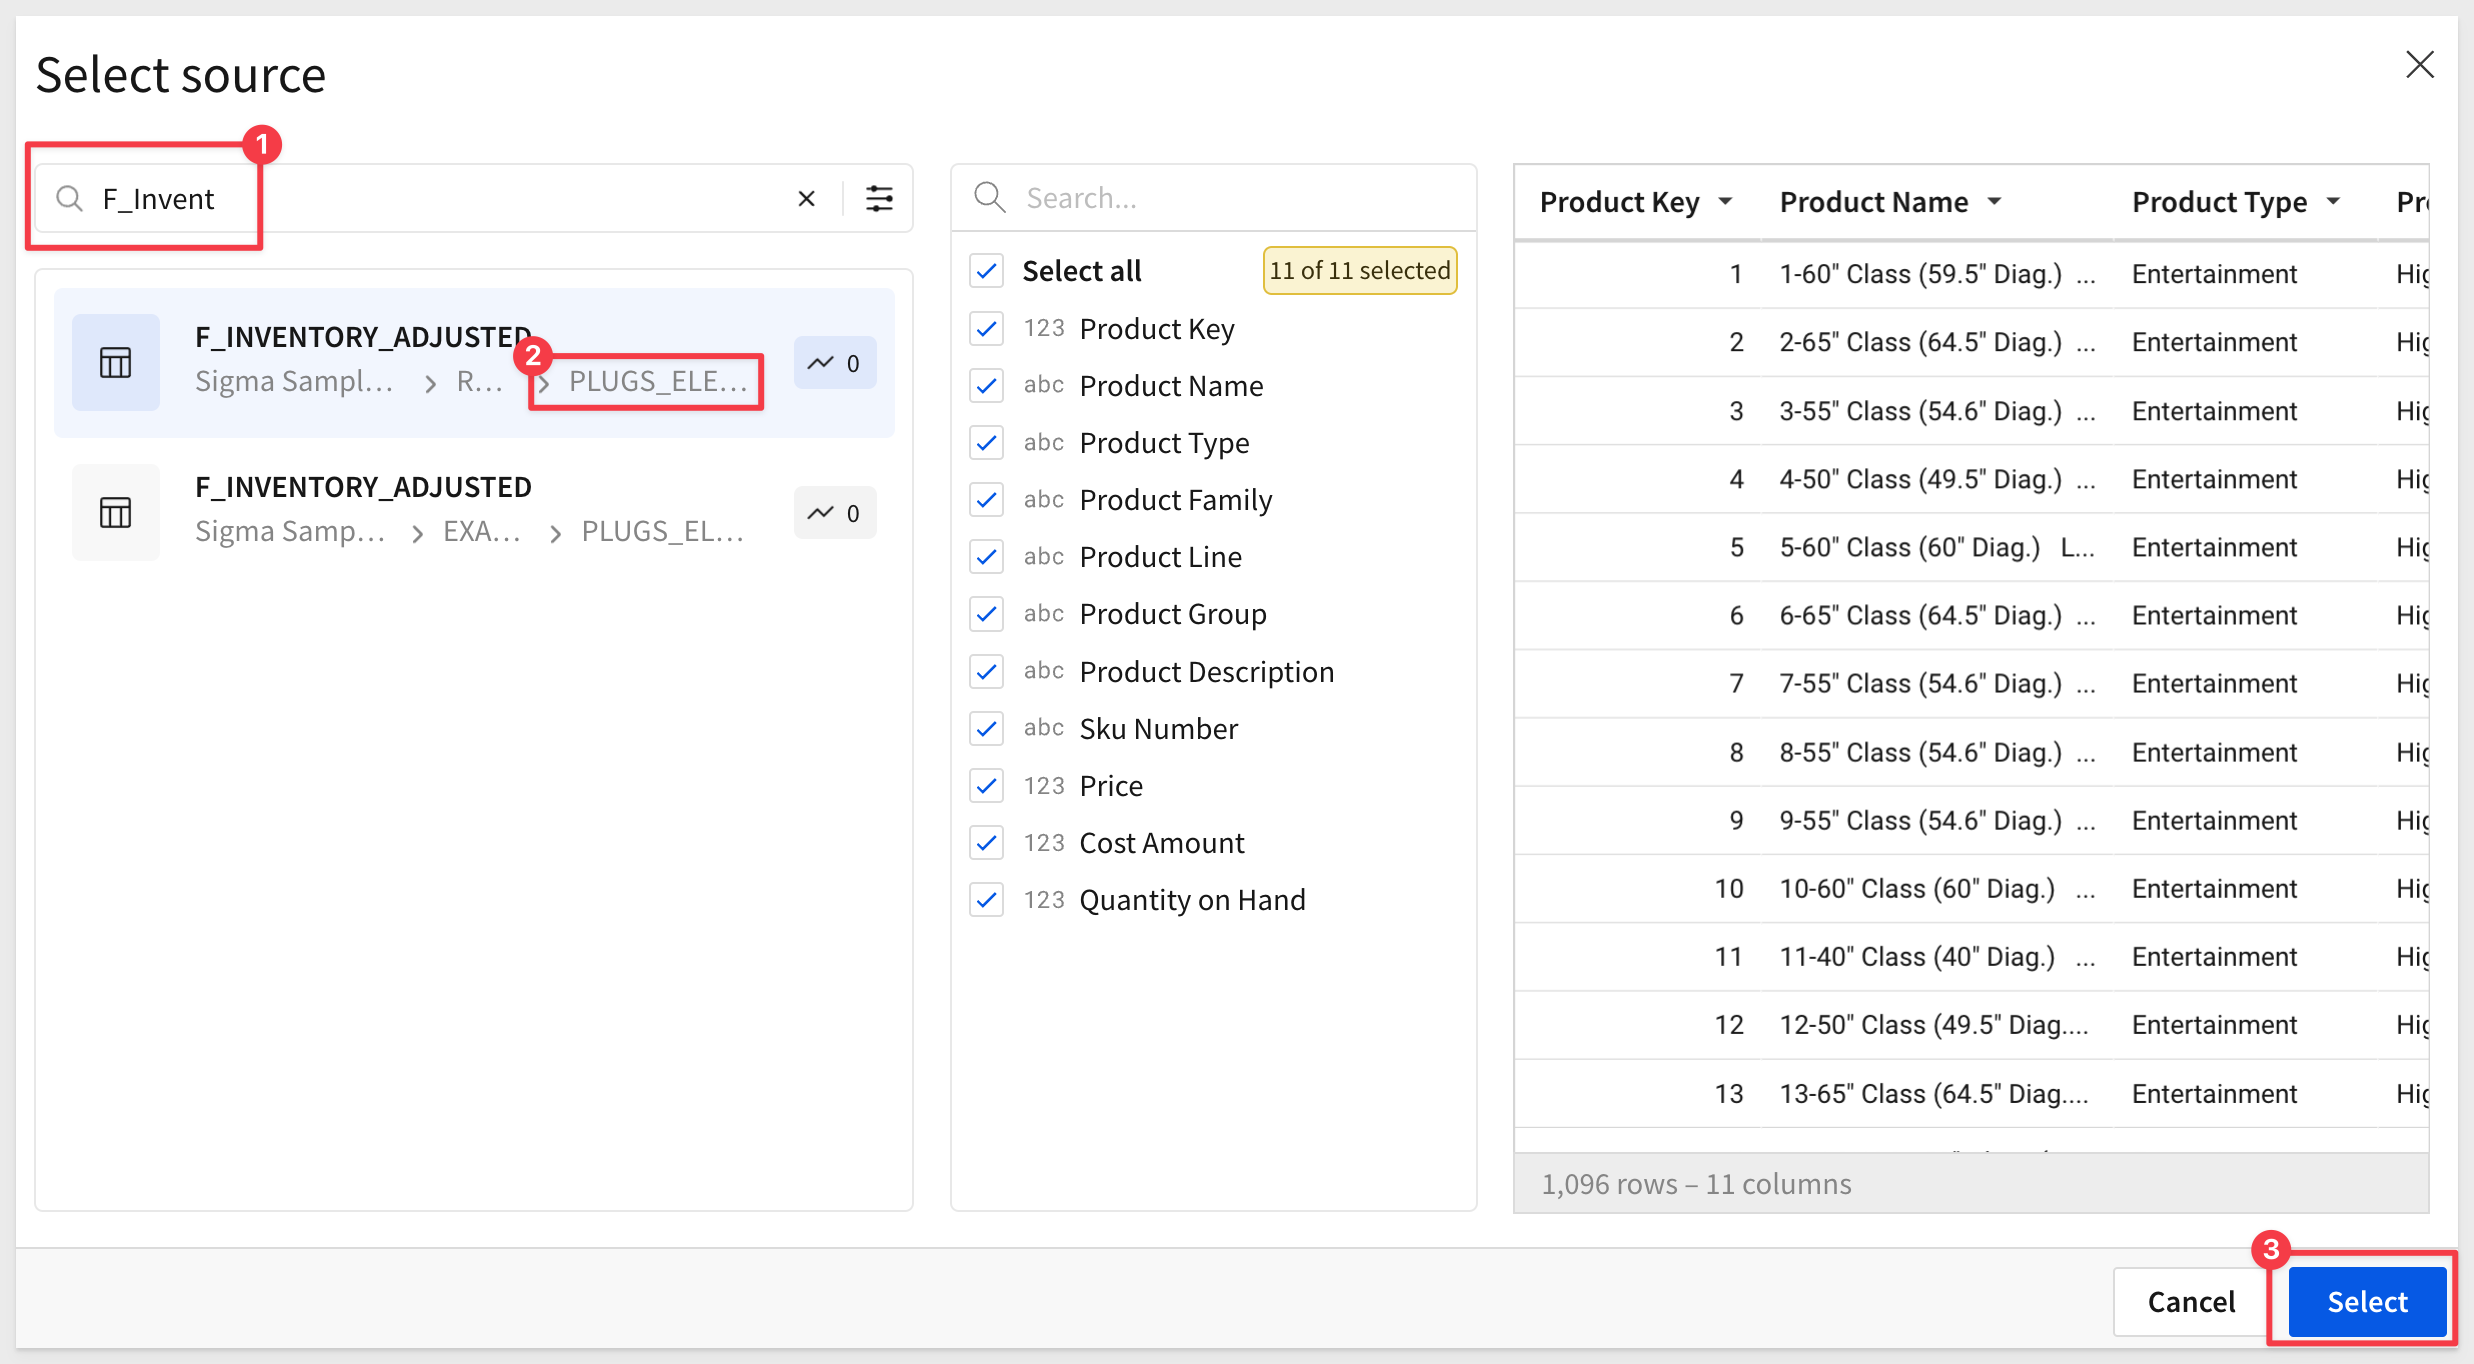
In the Source selector, search for F_Invent and select the one that has PLUGS_ELE (#2).
When you click it, a preview of the data is shown. Click Select:
We need to configure the join keys and type. In this case, we are joining on Sku Number in each table.
In this example, having no Keys with no matches means that every record in our base table has a matching row in the F_INVENTORY_ADJUSTED table:
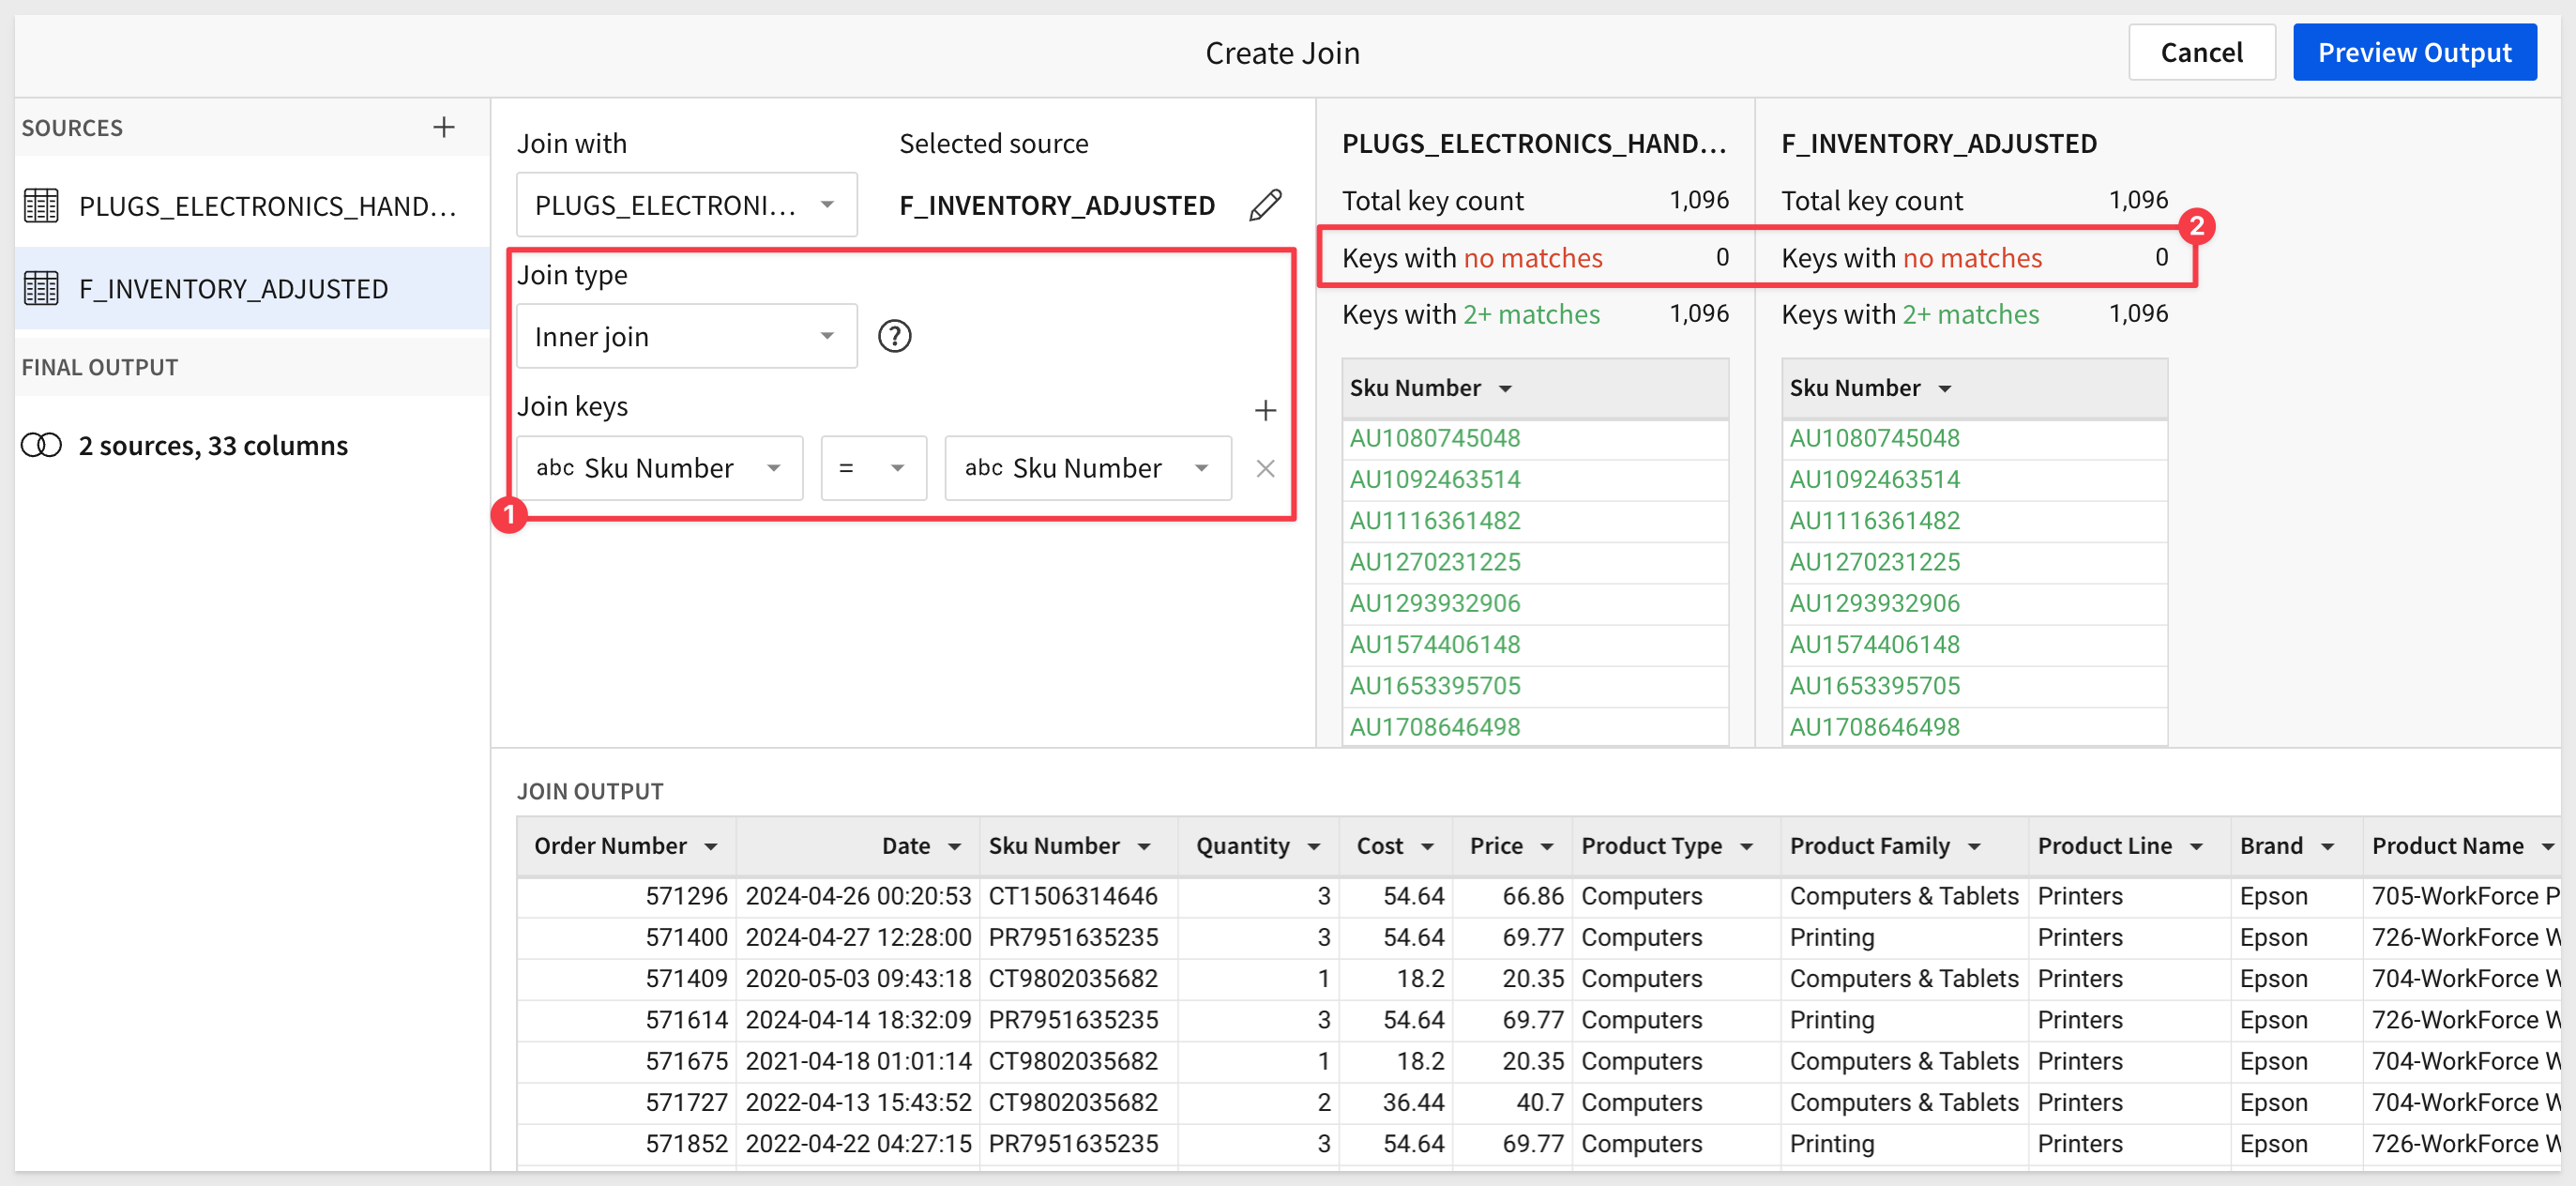
Click Preview Output.
Sigma does not know which columns from the F_INVENTORY_ADJUSTED table we want to add; we need to tell it.
Deselect all the columns except the Quantity on Hand column:
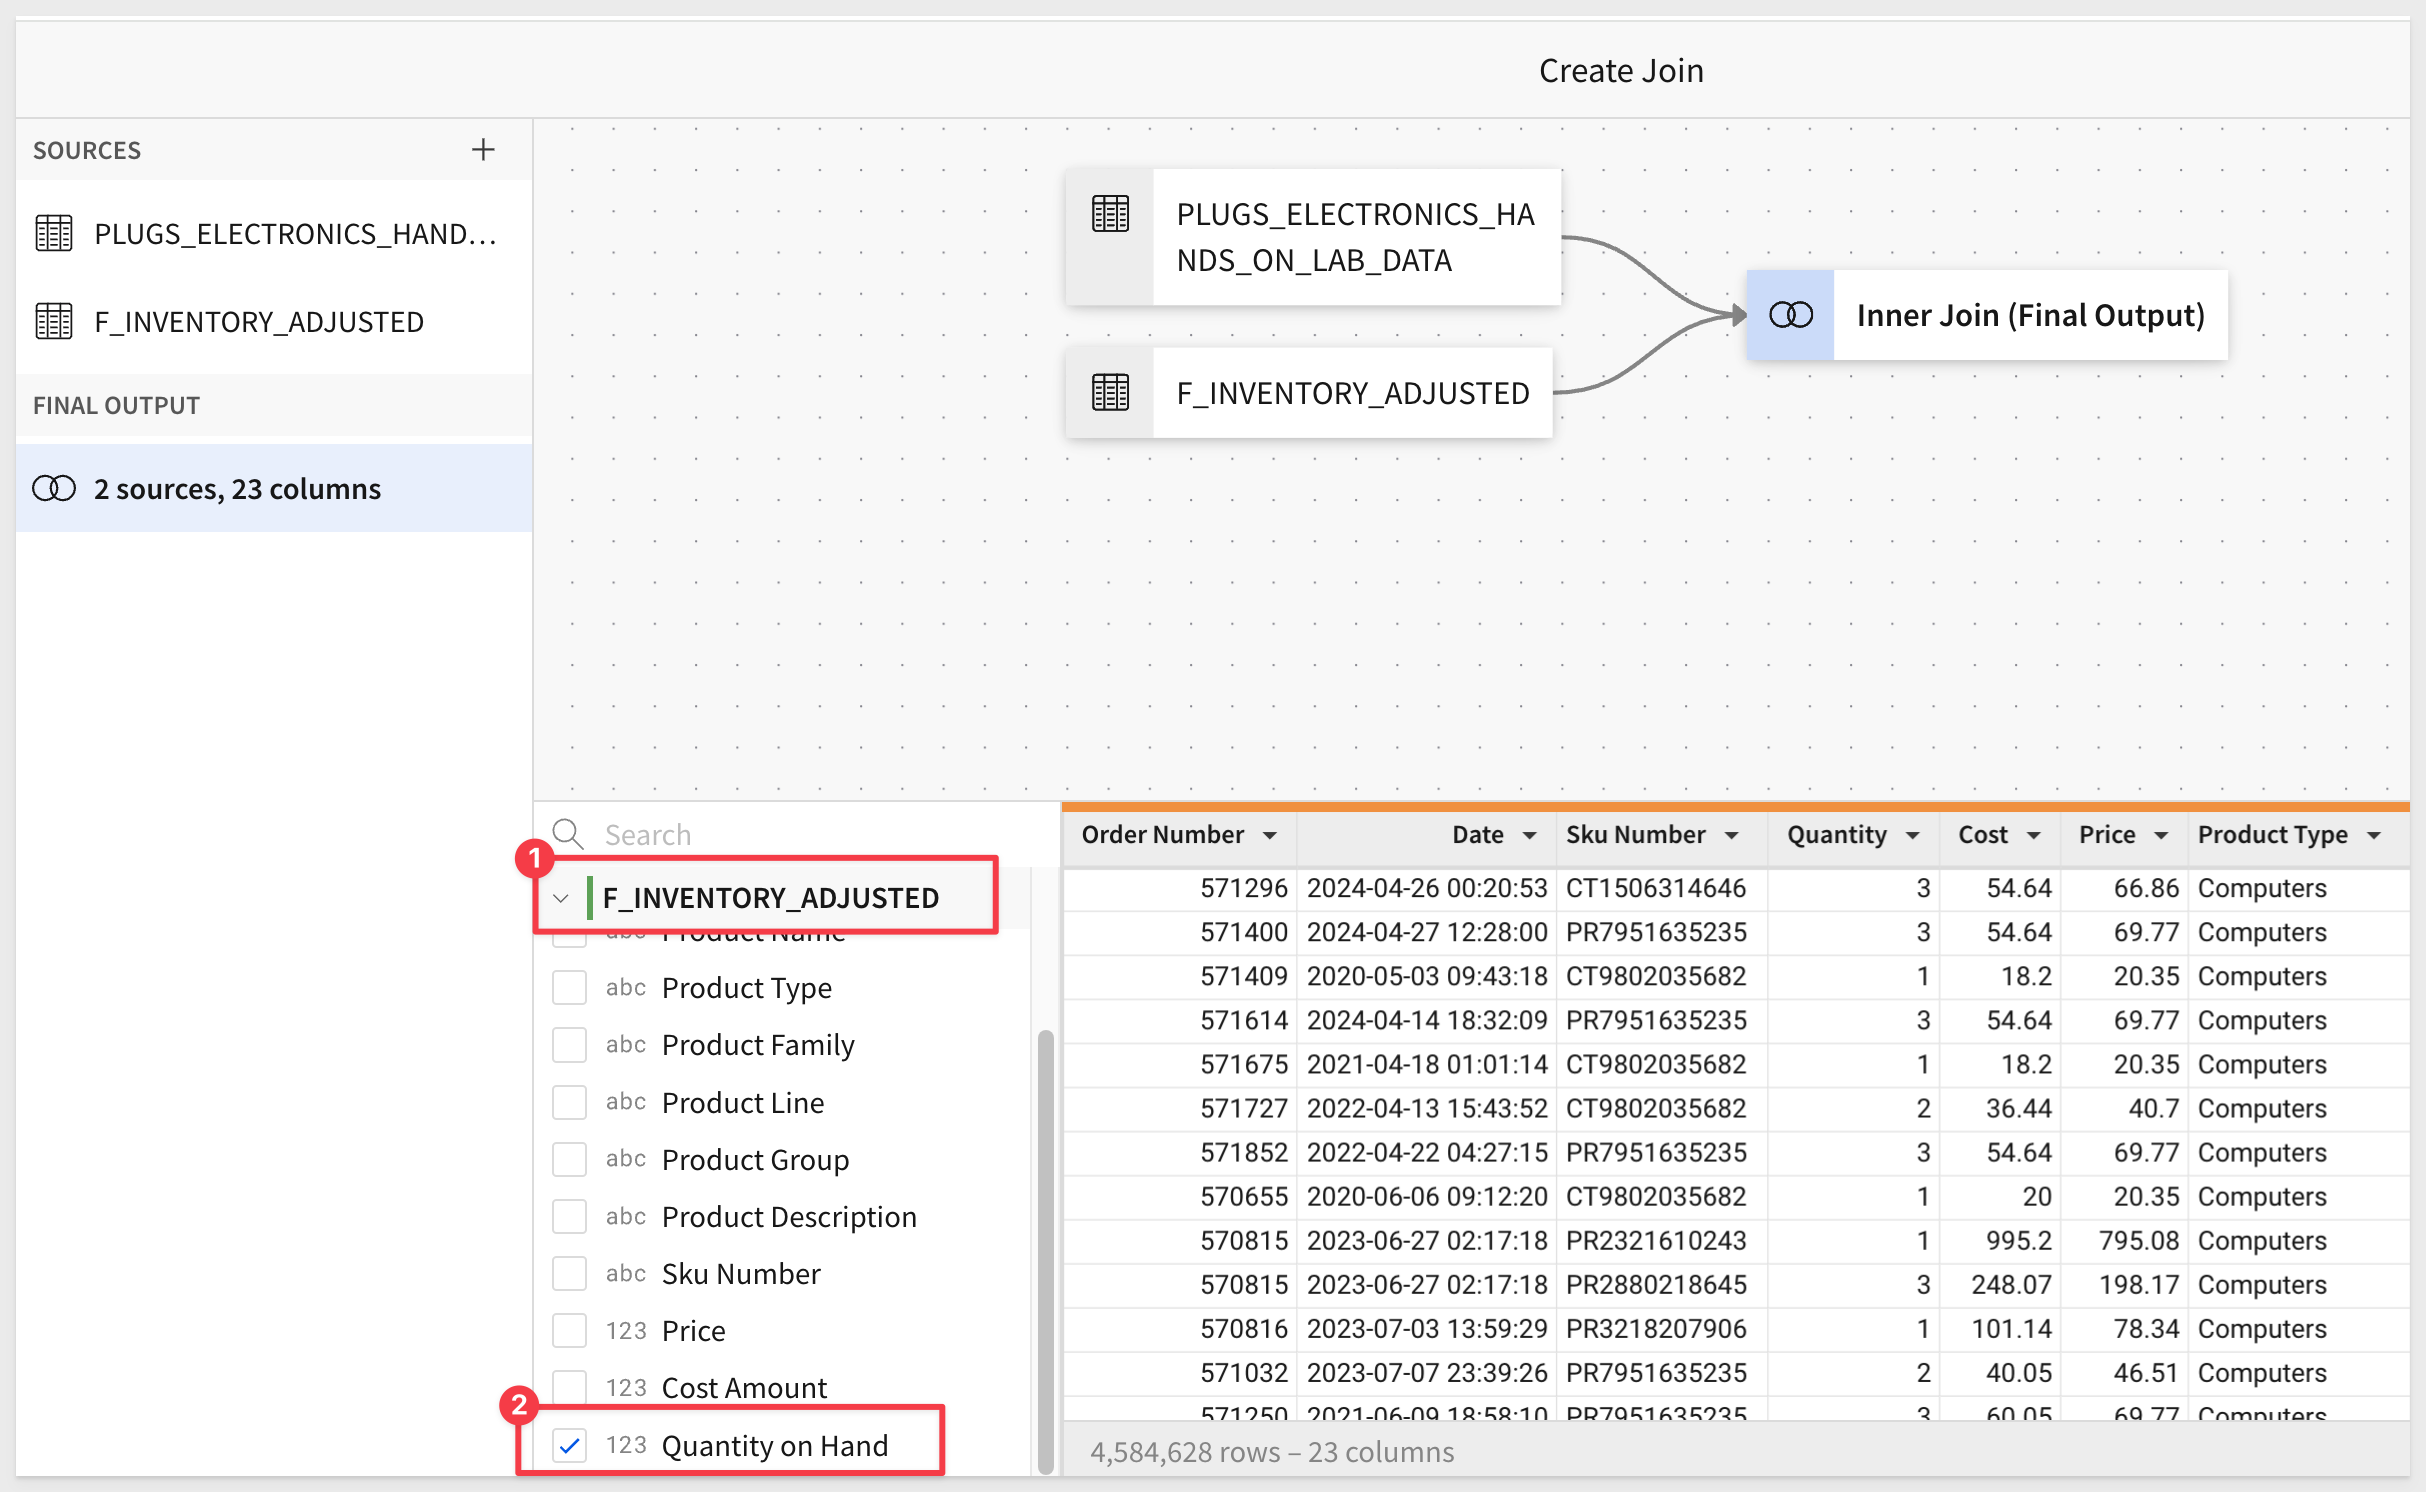
Click Done and Publish.
Return to the Dashboard.
We can see that the Quantity on Hand column is now shown in our table.
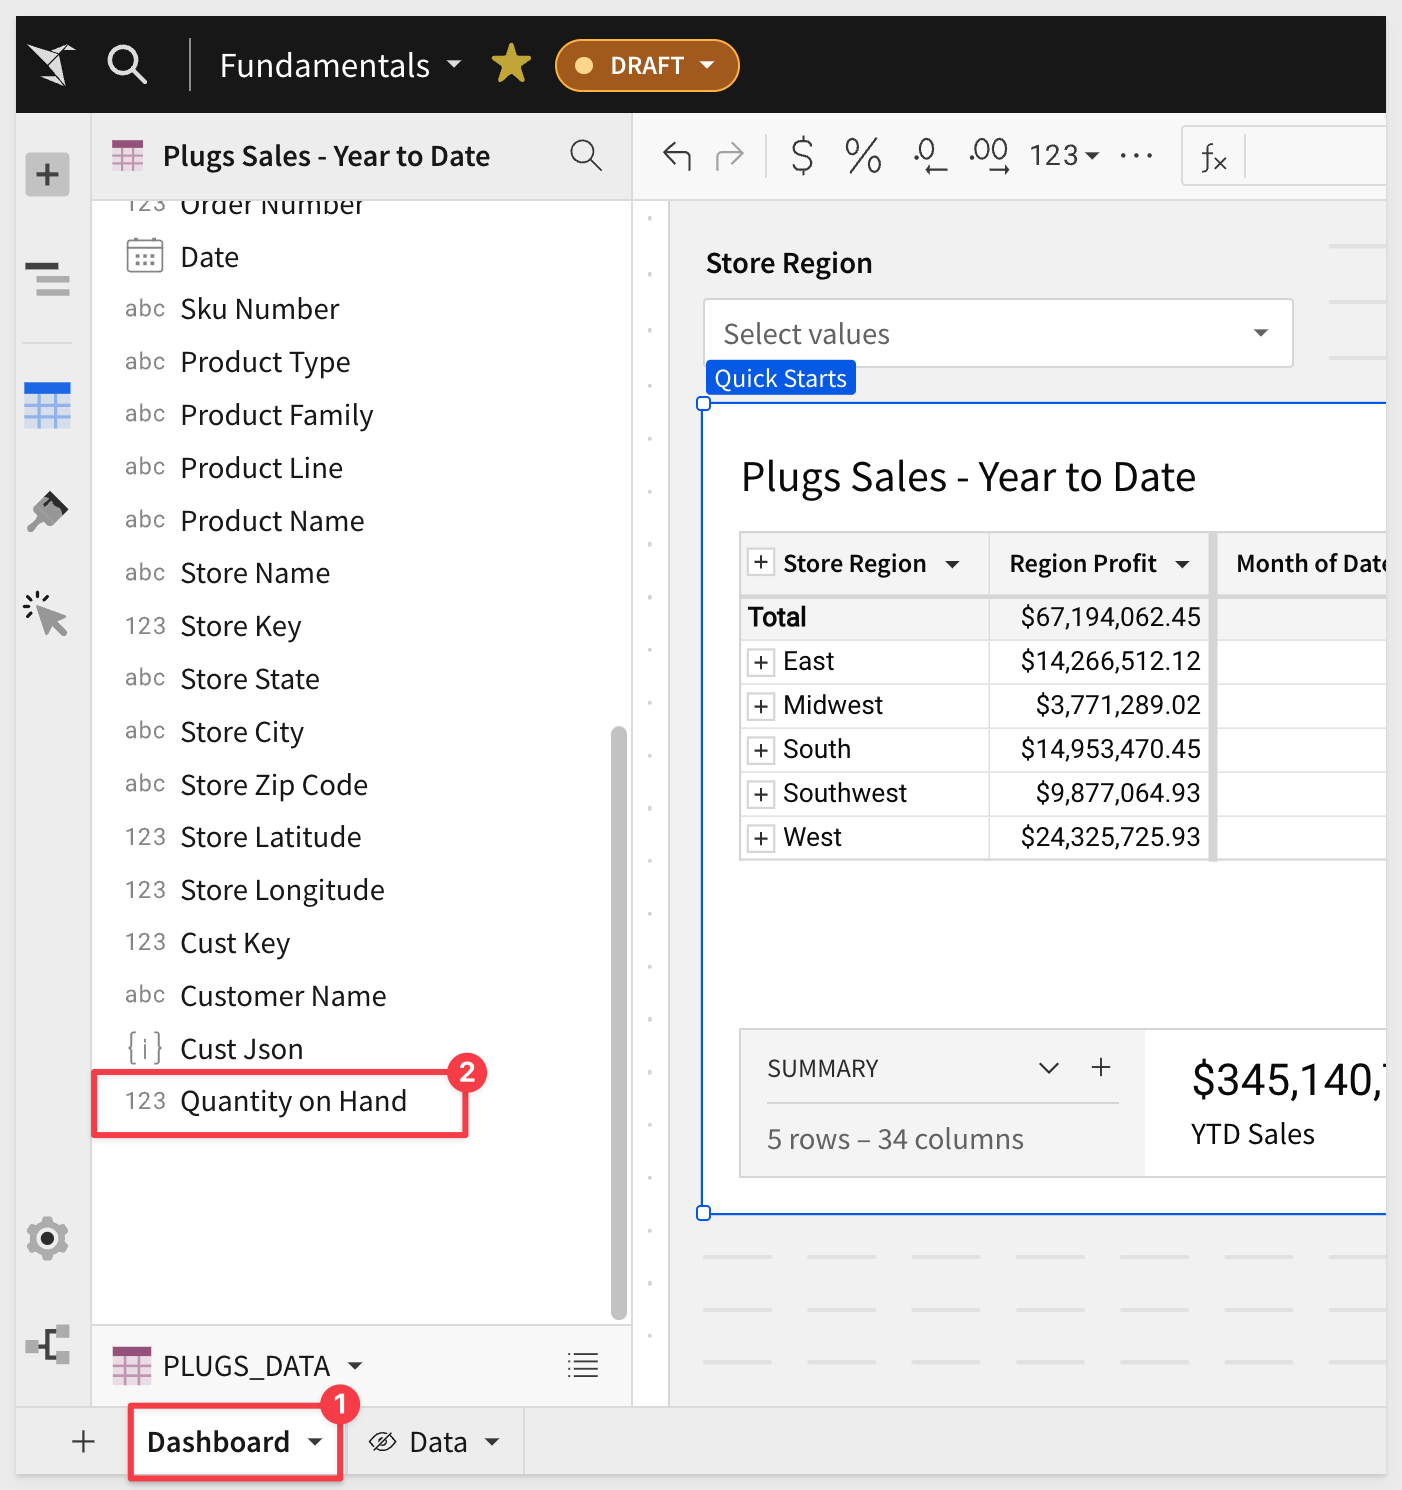
We can edit the join at any time by returning to the Data page and:
In the last section, we joined two tables from our warehouse, selected join keys, join type and saw the results. We never wrote SQL or any other proprietary code to make that happen.
Sigma makes things easy for you and there is a ton of power being applied in the background to make it that way.
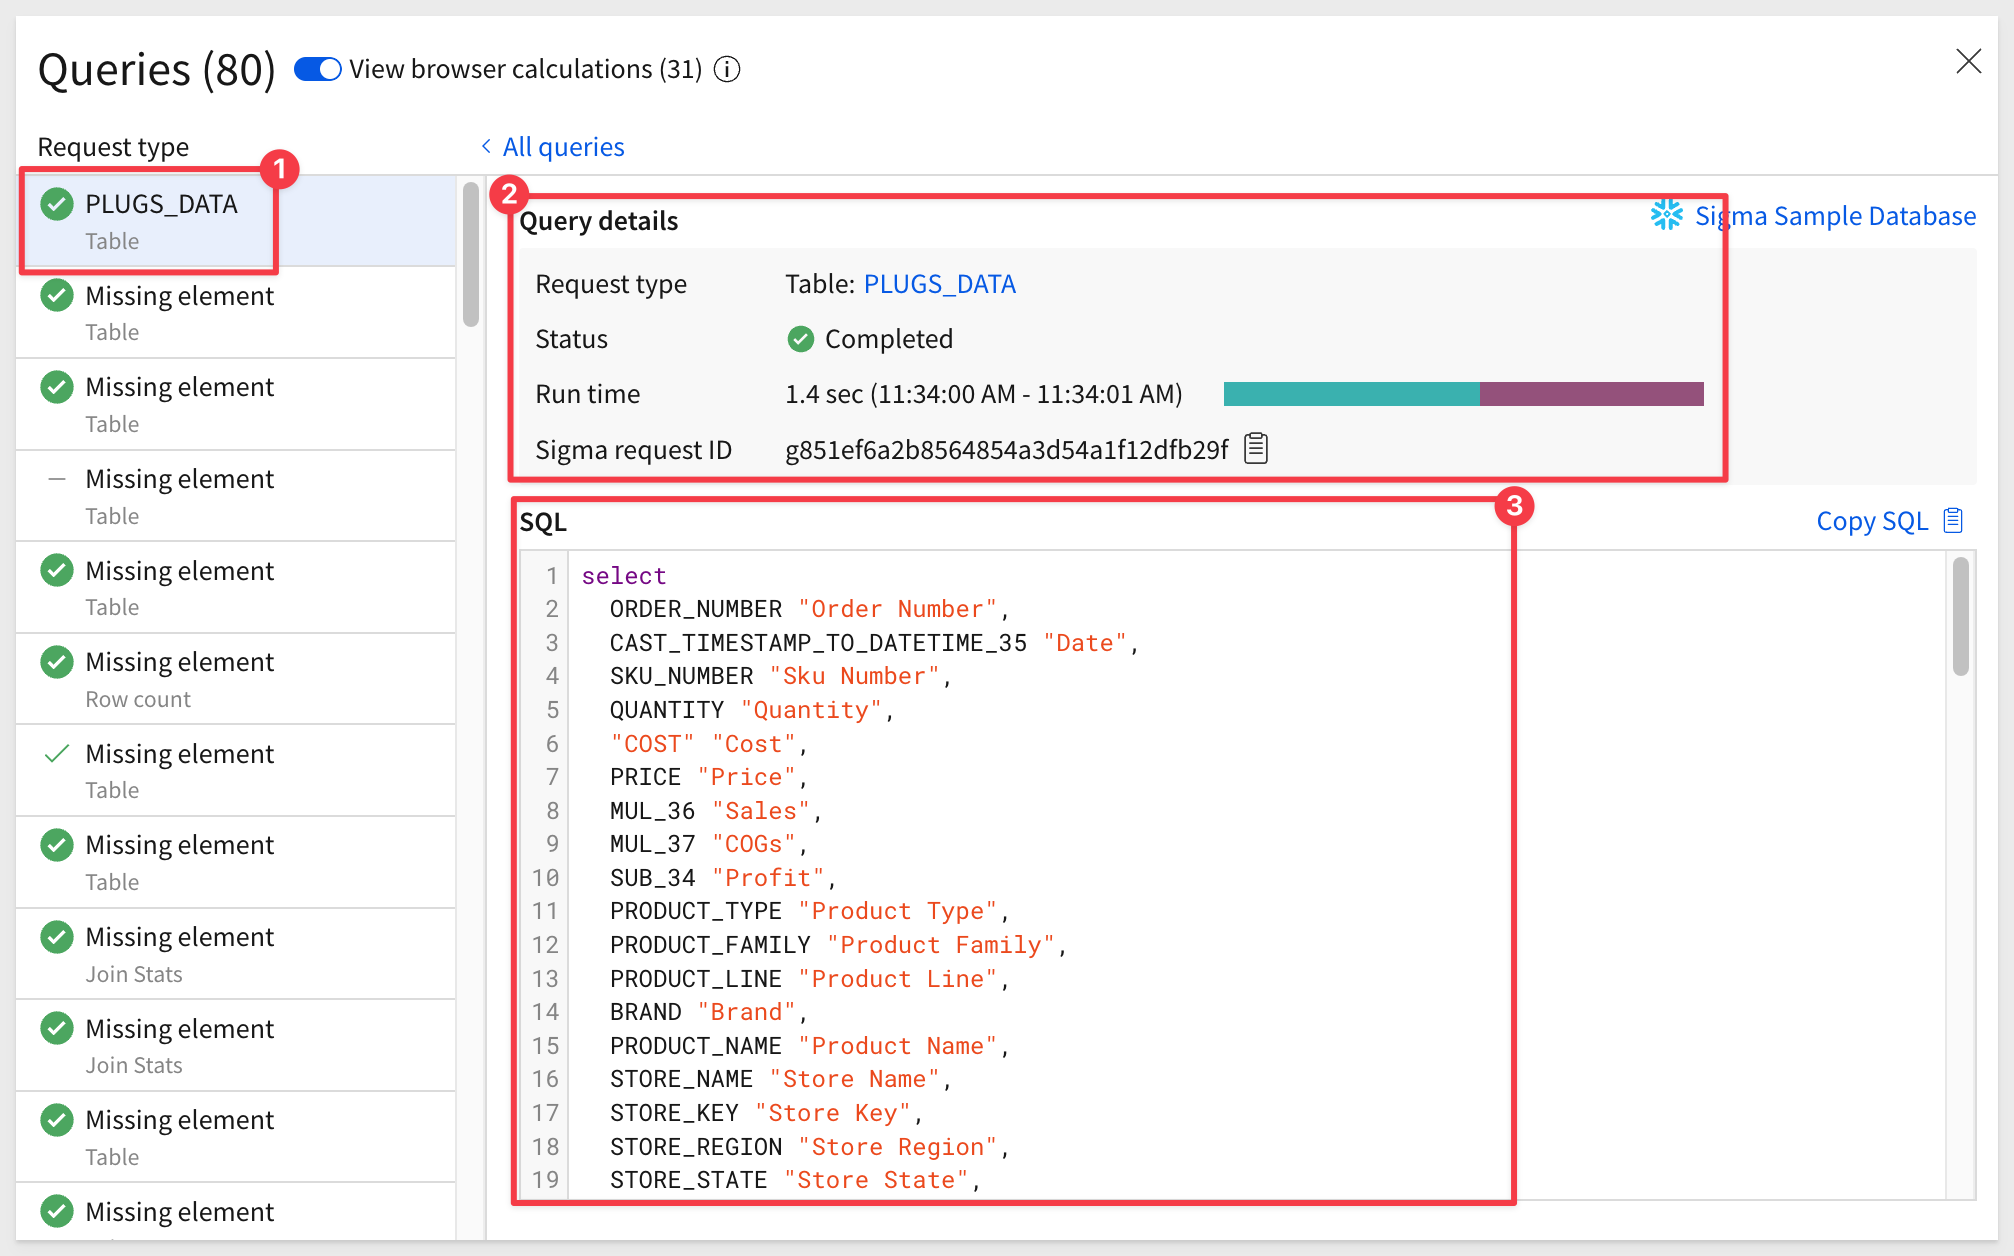
Click on the dropdown next to the refresh icon and select ‘Query History' to see exactly what is being run each time a change is made. This can be very useful for those with knowledge of SQL.
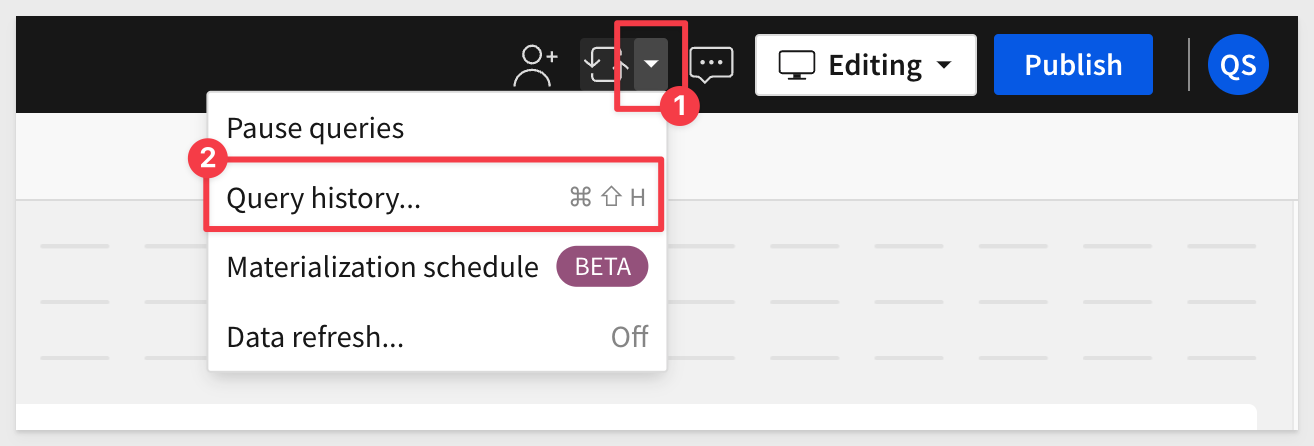
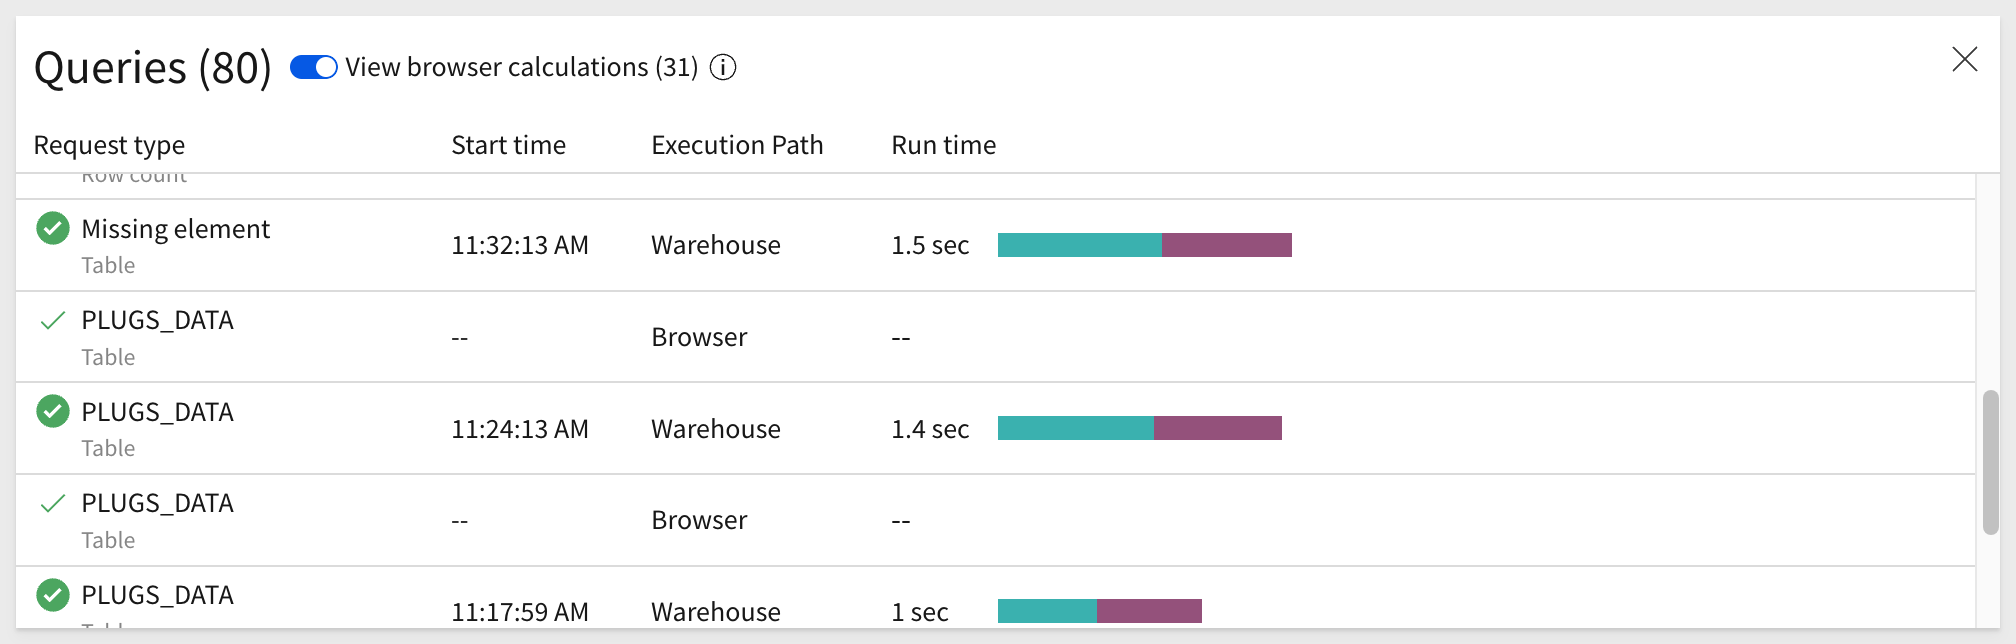
Clicking into the first Query gives every last detail:
If you are really interested in the low-level workings of Sigma's unique approach to data retrieval, read this QuickStart.
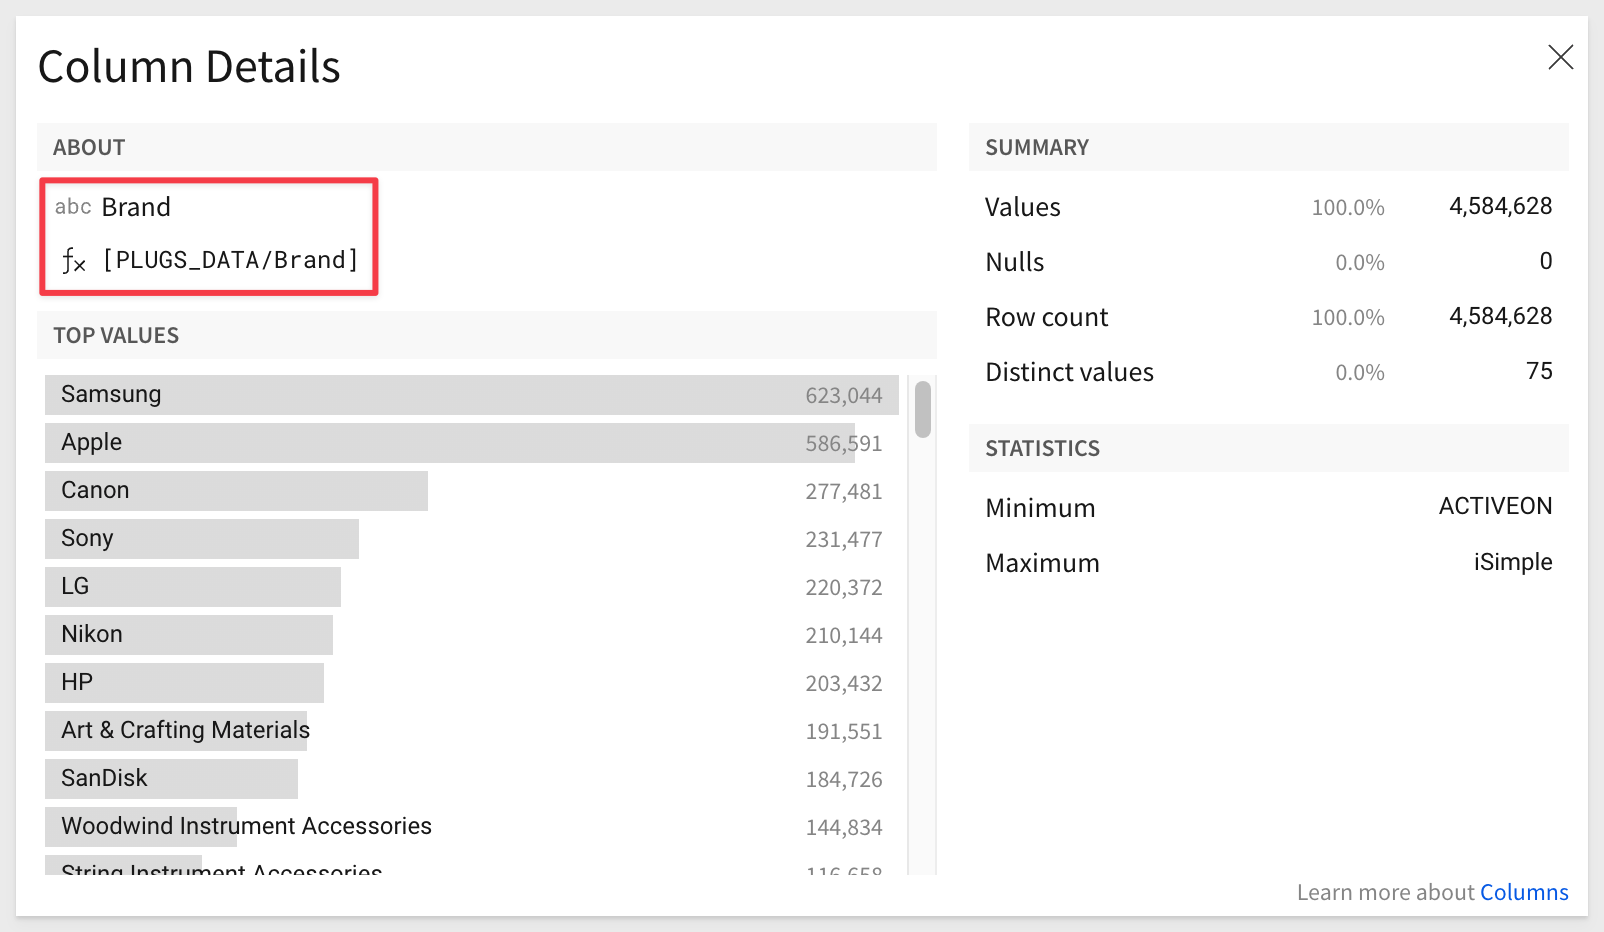
Related to the last item, there is another cool feature that lets you "peek" behind a column, to see some useful information.
Click on the Brand columns menu, and click Column Details. This will display a pop-up to help you see things like Top Values and if Nulls exist, and more:
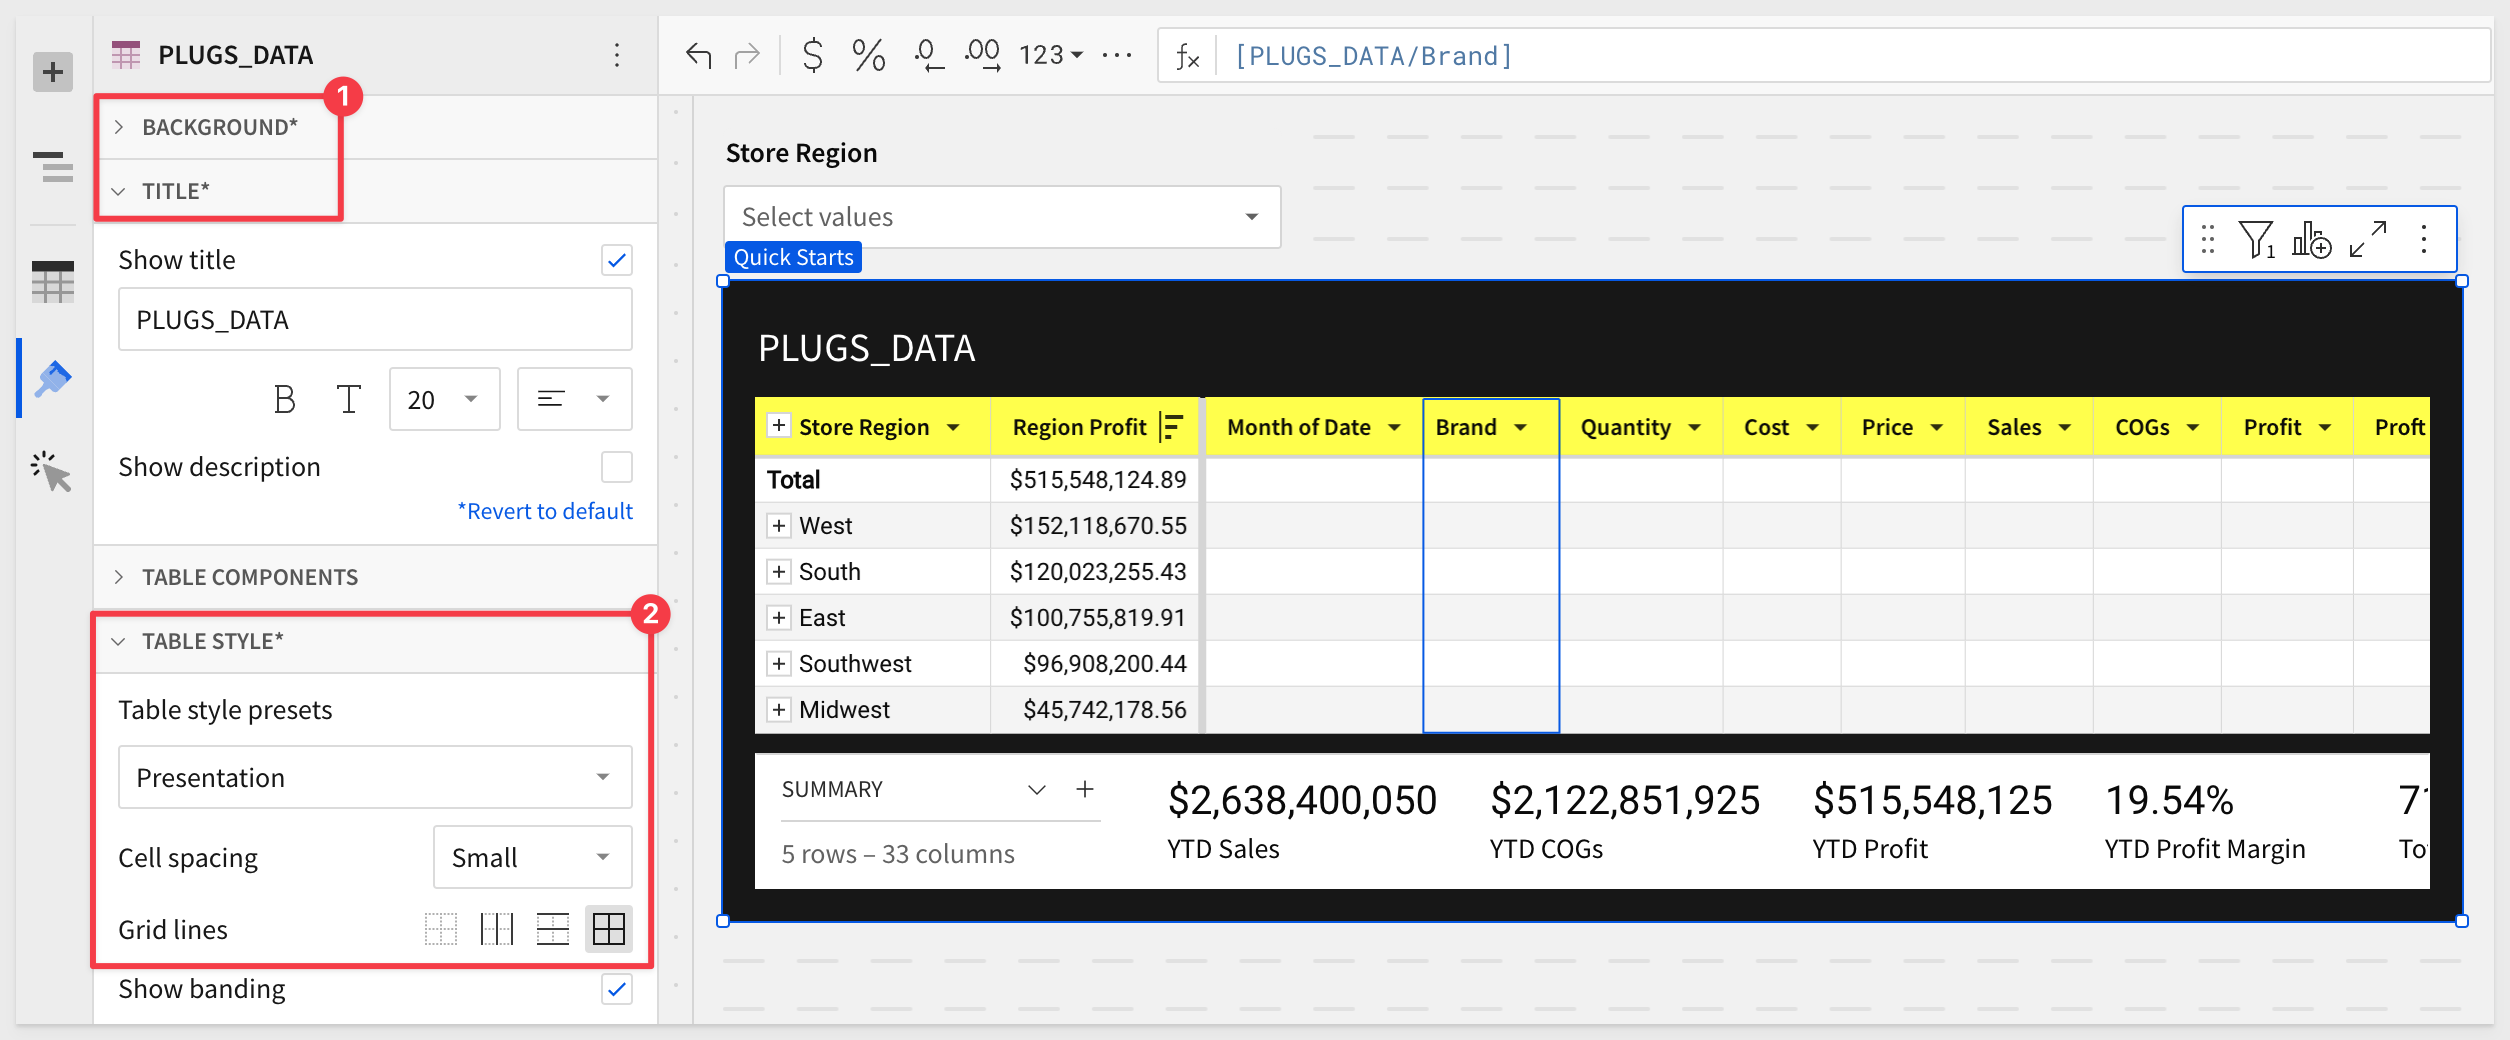
When working with tables, Sigma provides style presets for out-of-the-box aesthetics and readability. You can customize all style components independently for more personalized table designs.
There are two table presets that can be quickly set and then further customized to suit your needs, Spreadsheet and Presentation.
Click the table to select it, and then click the paint brush icon (#1 in the image below) in the element panel.
This exposes the many options for styling the various aspects of the table.
Experiment with them to find a style that pleases.
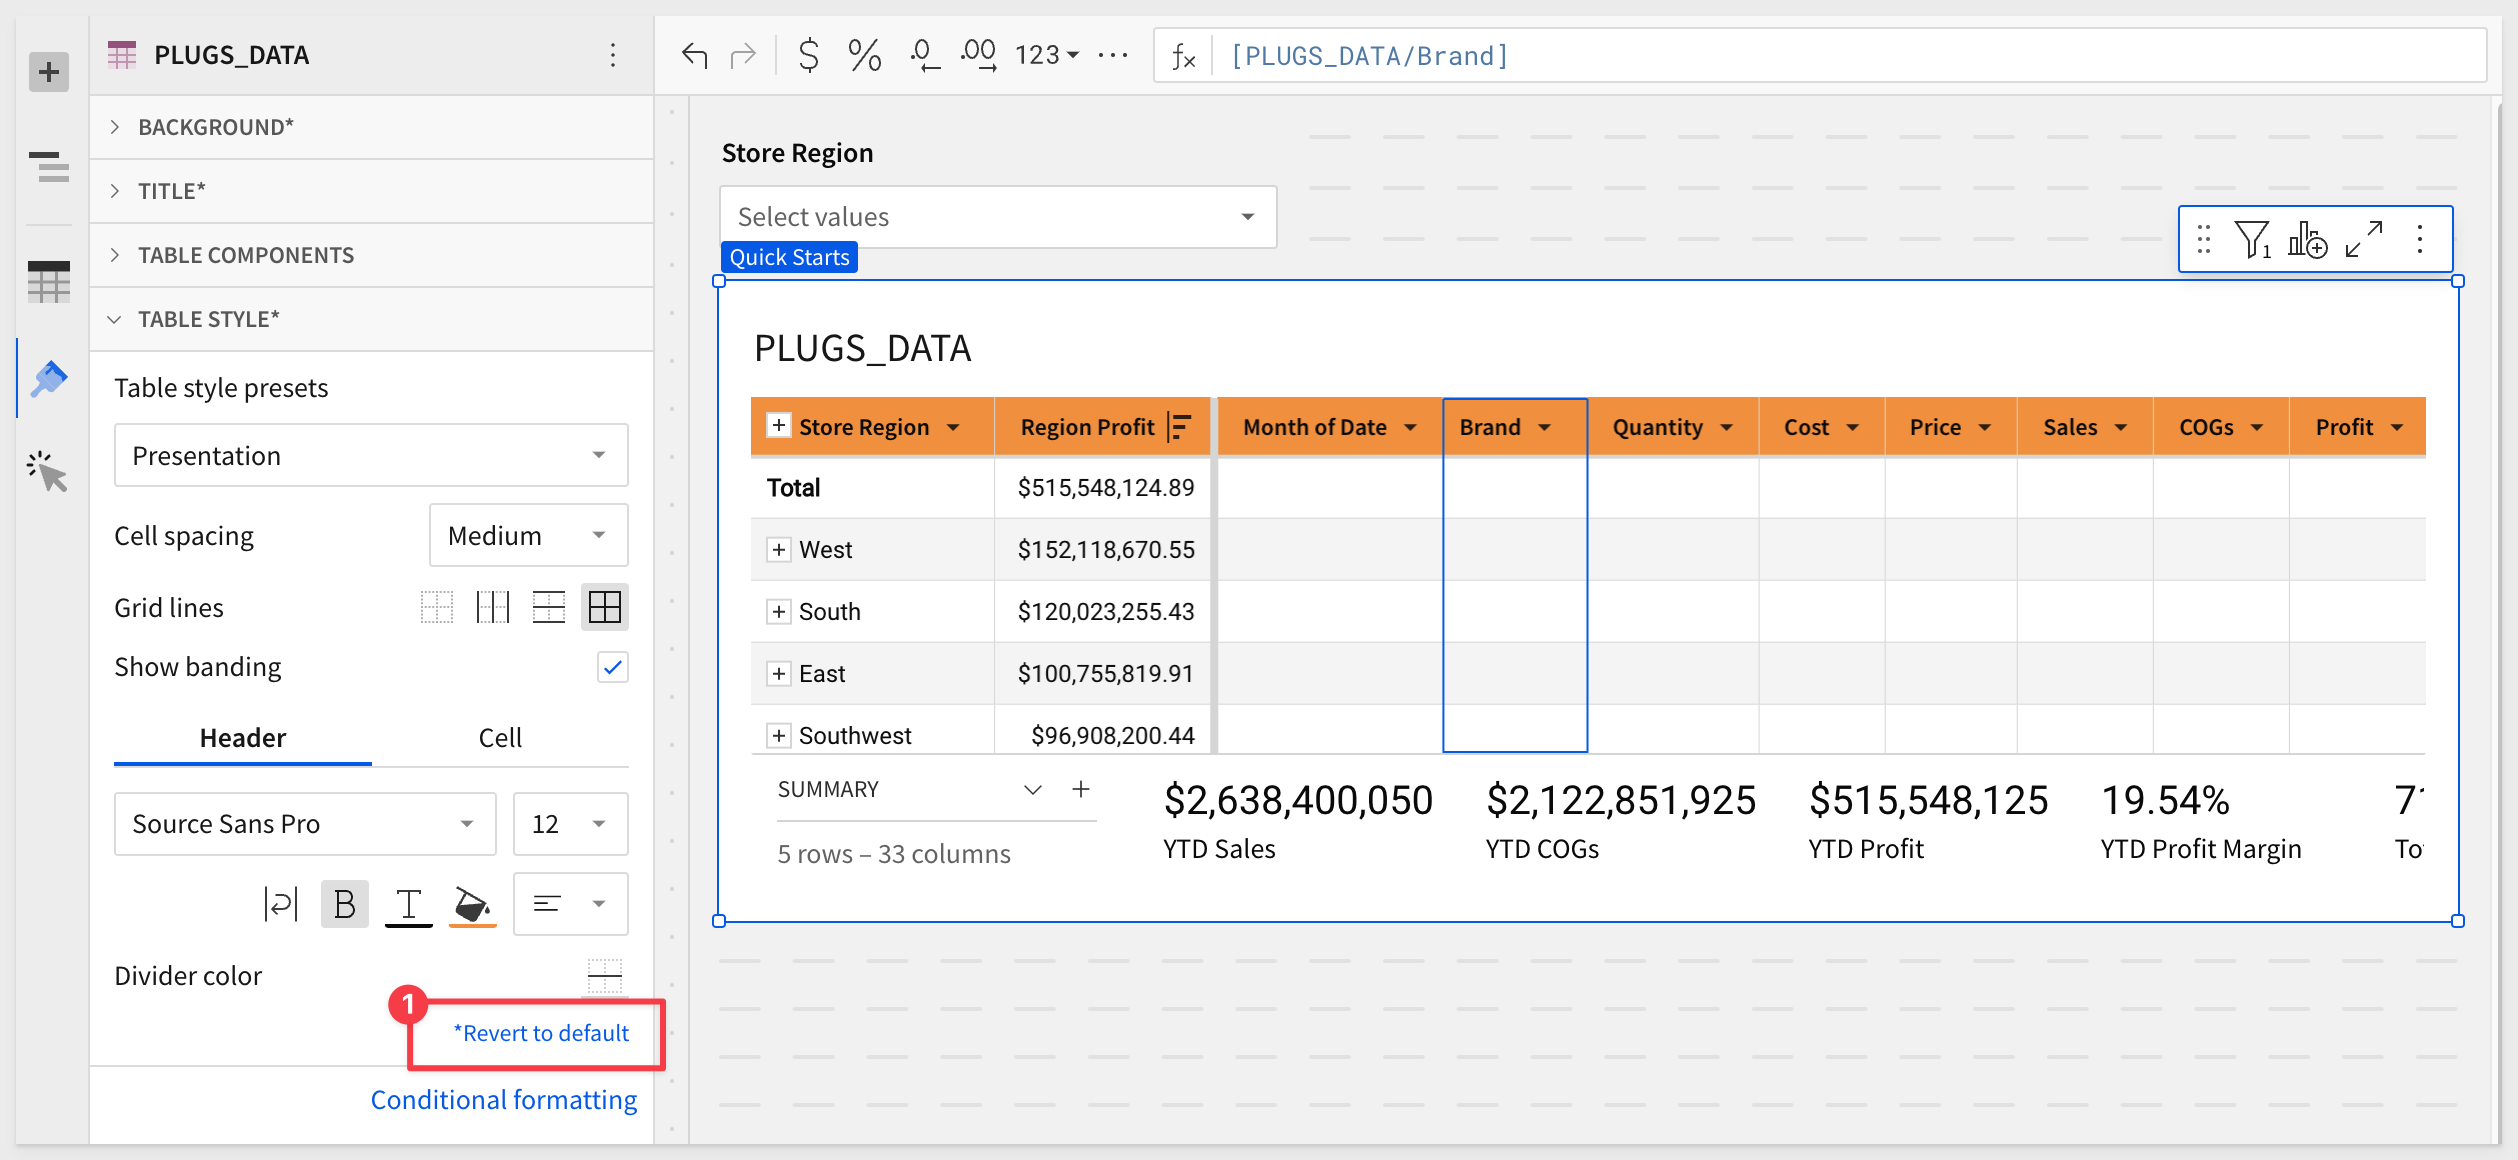
There are many possible customizations to enhance tables. It is really easy to experiment and see what the results.
Revert to default anytime:
Sigma will warn you if the styling set is problematic for some people. For example:
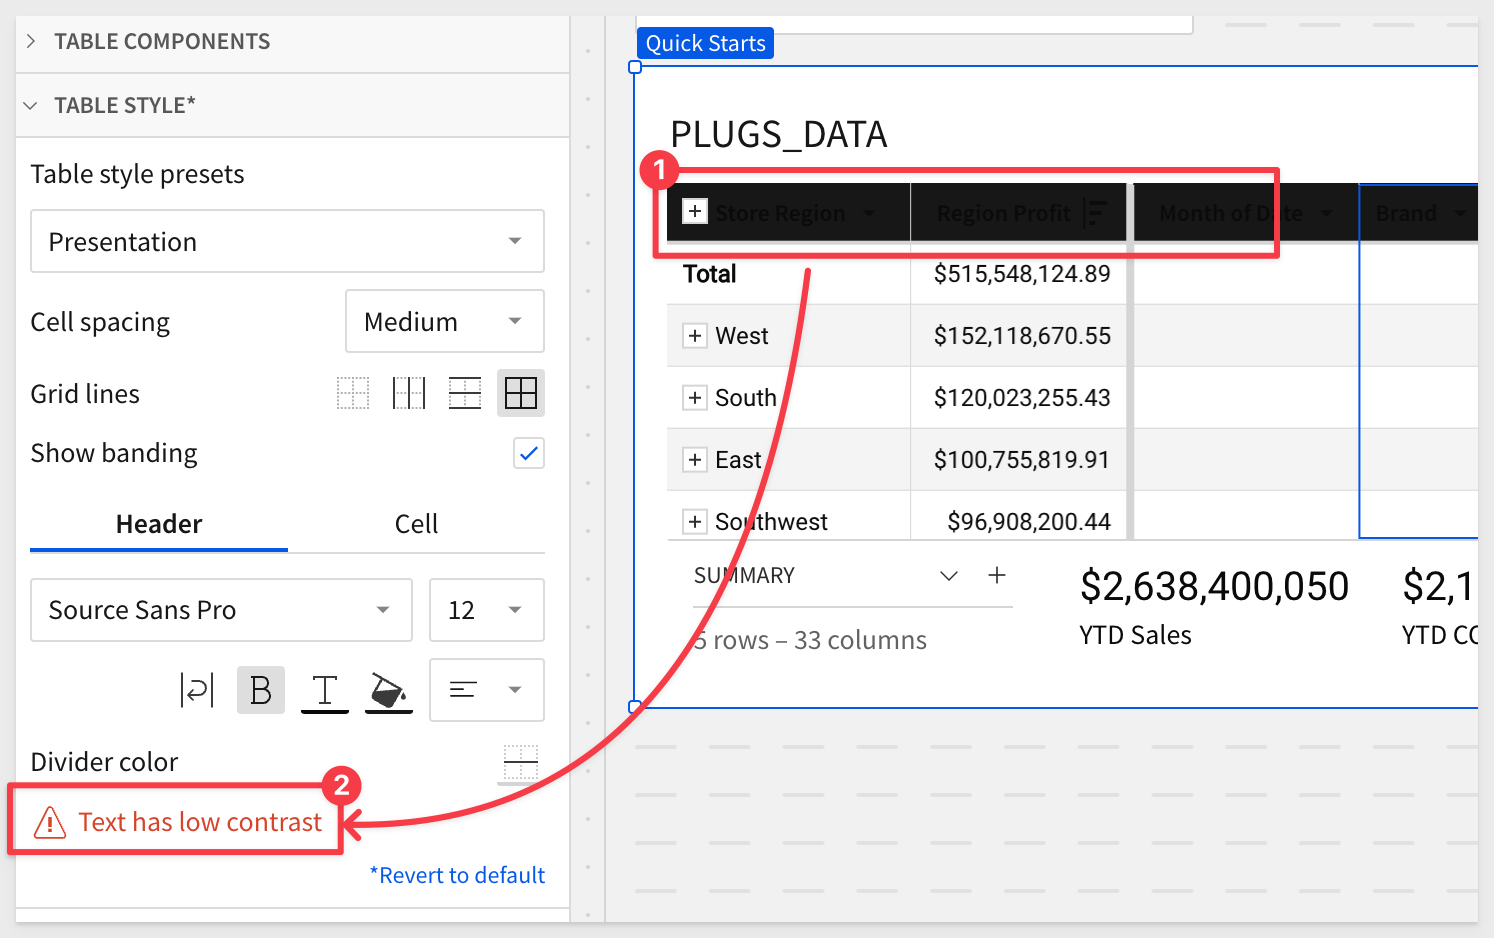
Once satisfied, click Publish.
Sigma workbook tables can use colors to give the user a more comfortable experience, drawing their eyes to important information through the use of Conditional Formatting.
Using the Store Region control, filter the table to show only the Midwest.
Expand the Midwest Store Region column.
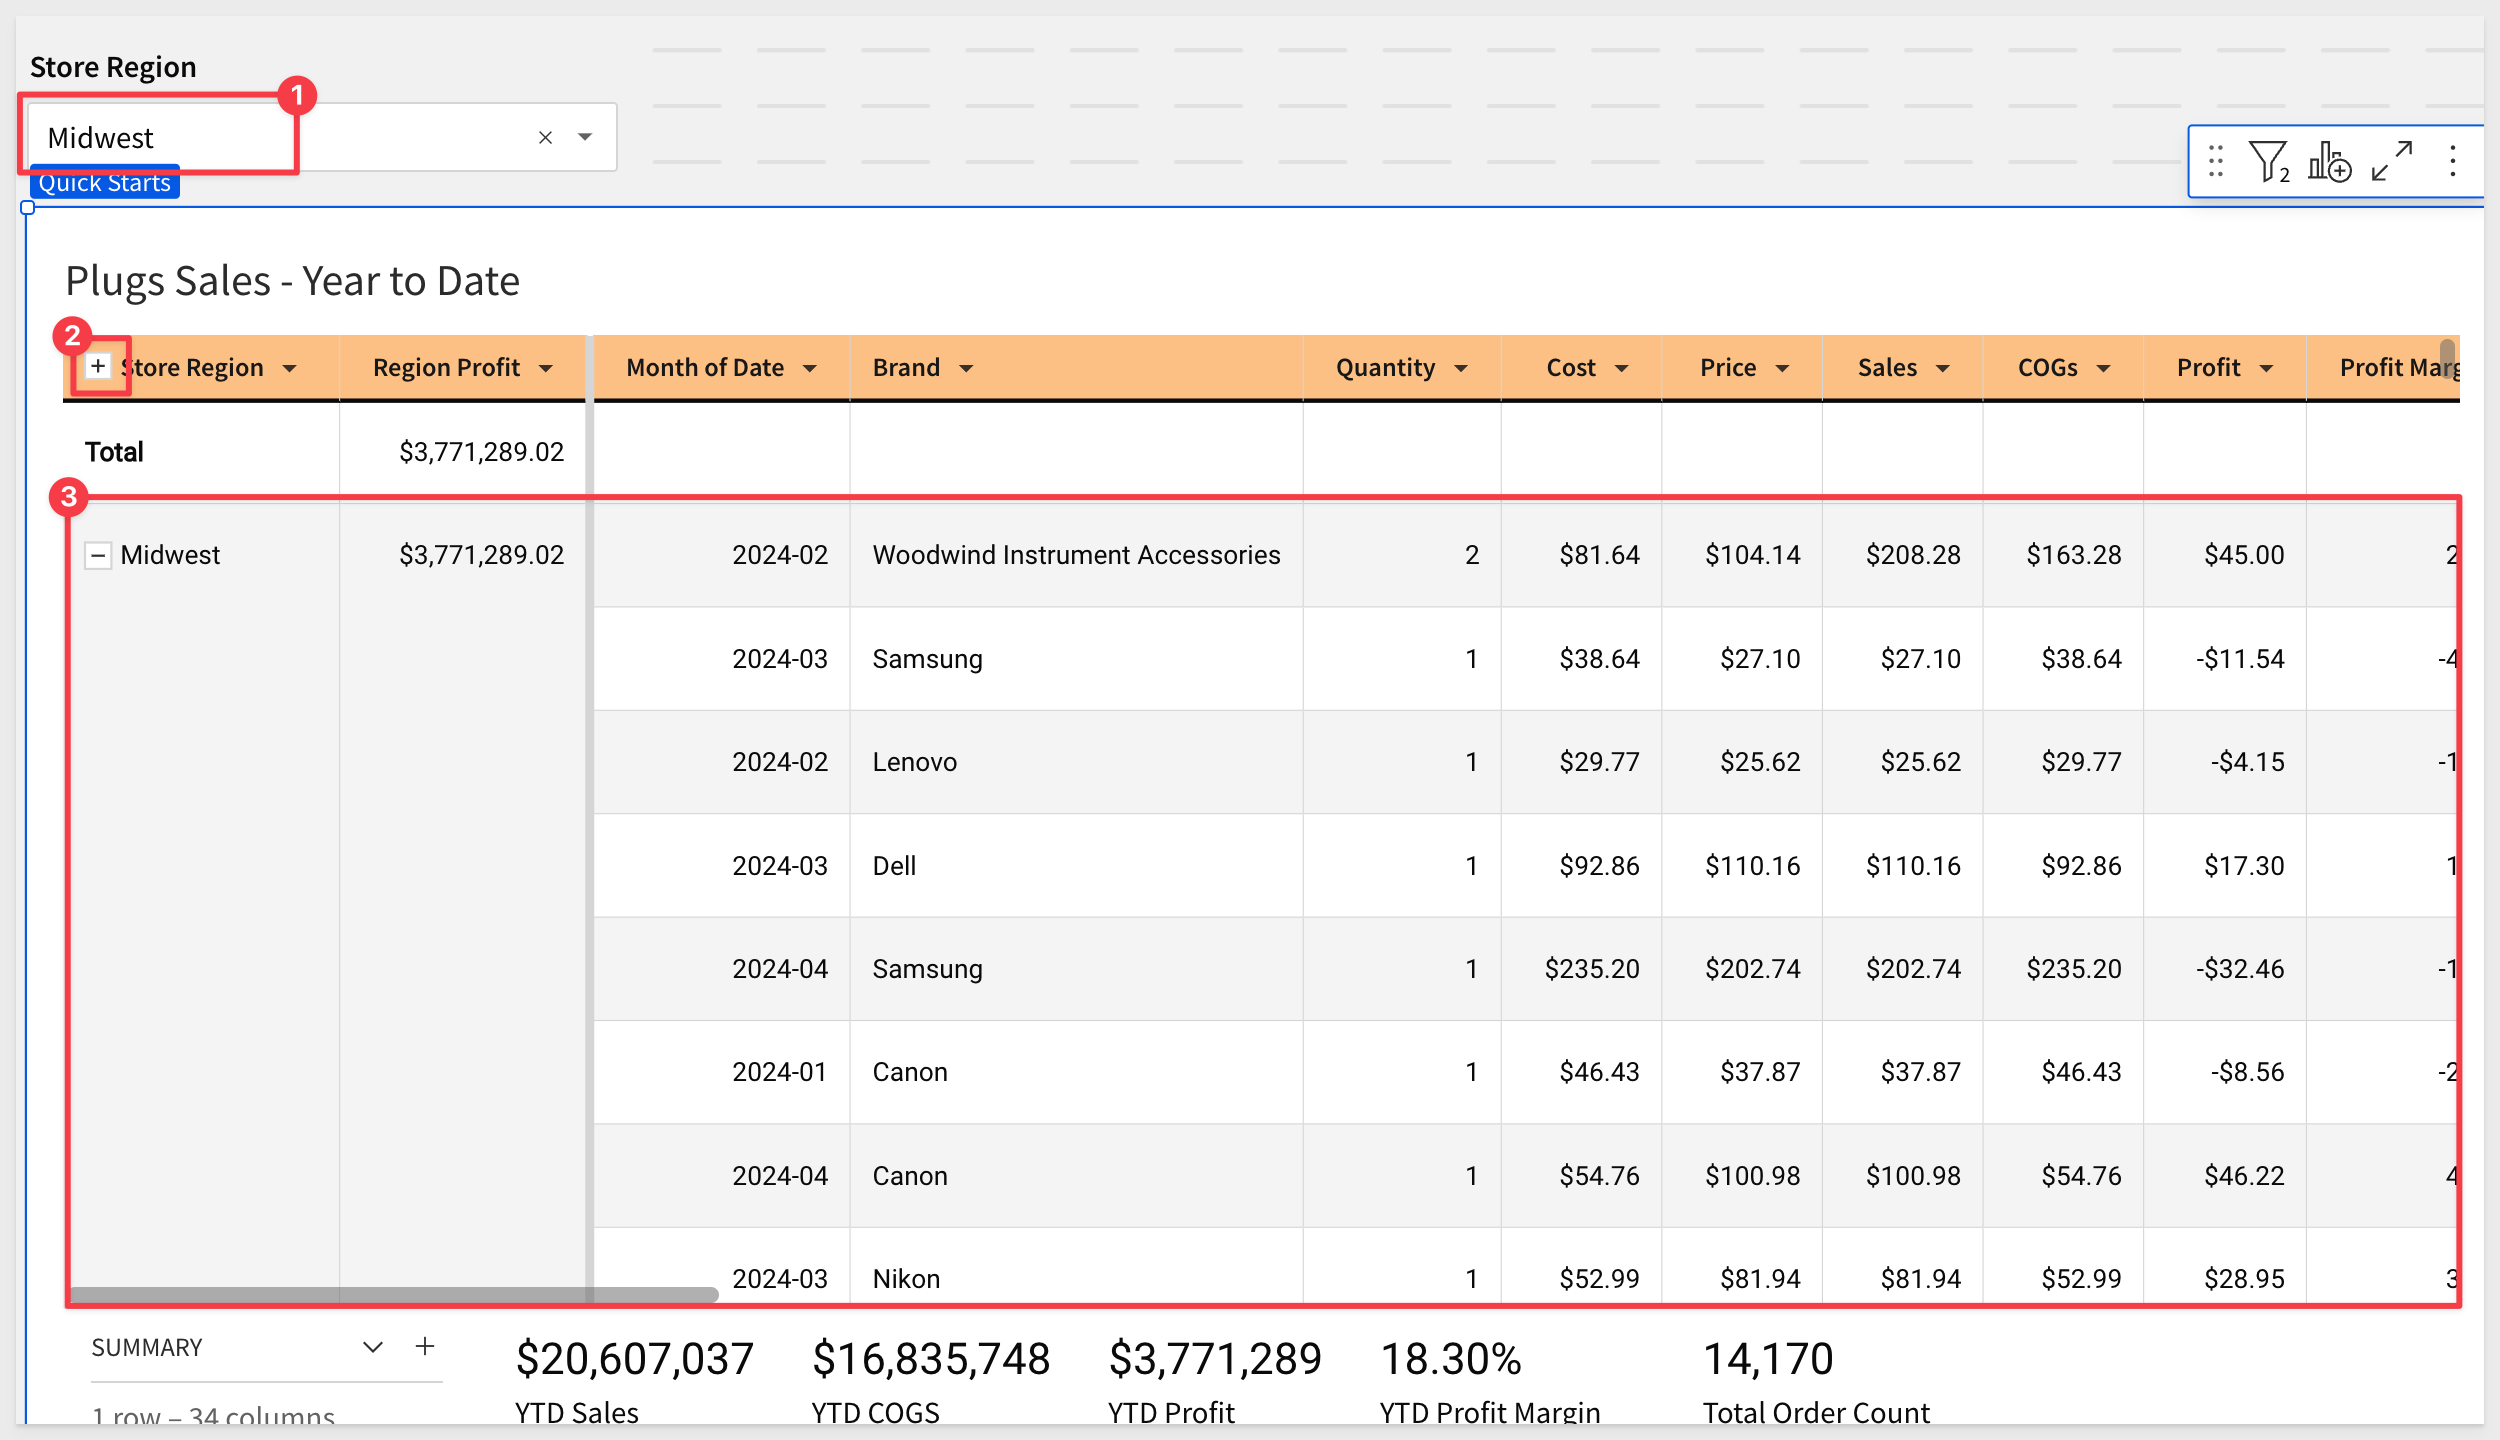
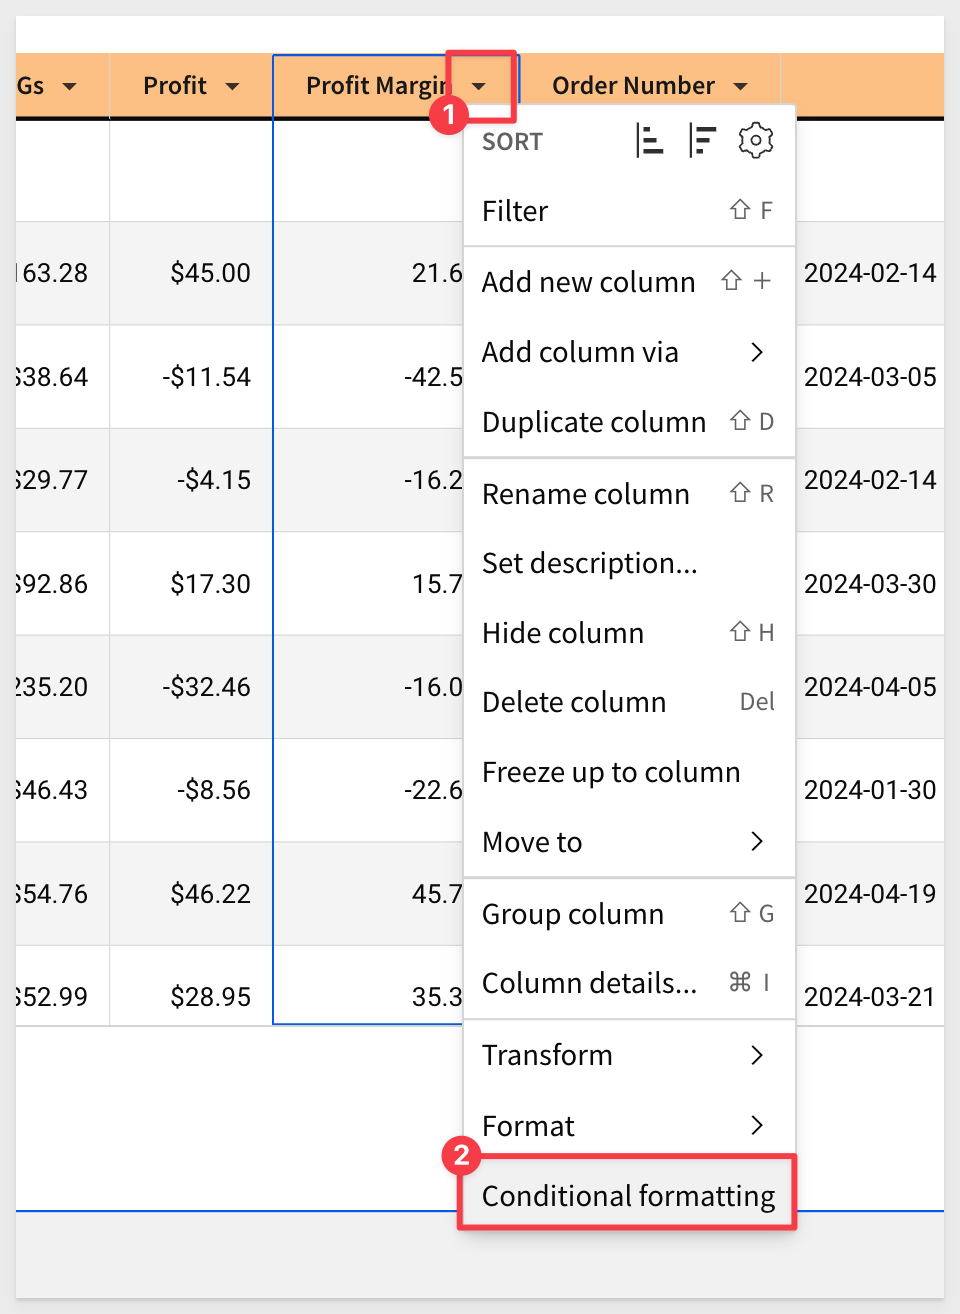
We want to apply a Conditional Format to the Profit Margin column:
In the left-hand pane, configure the conditional formatting rule for the values as shown below.
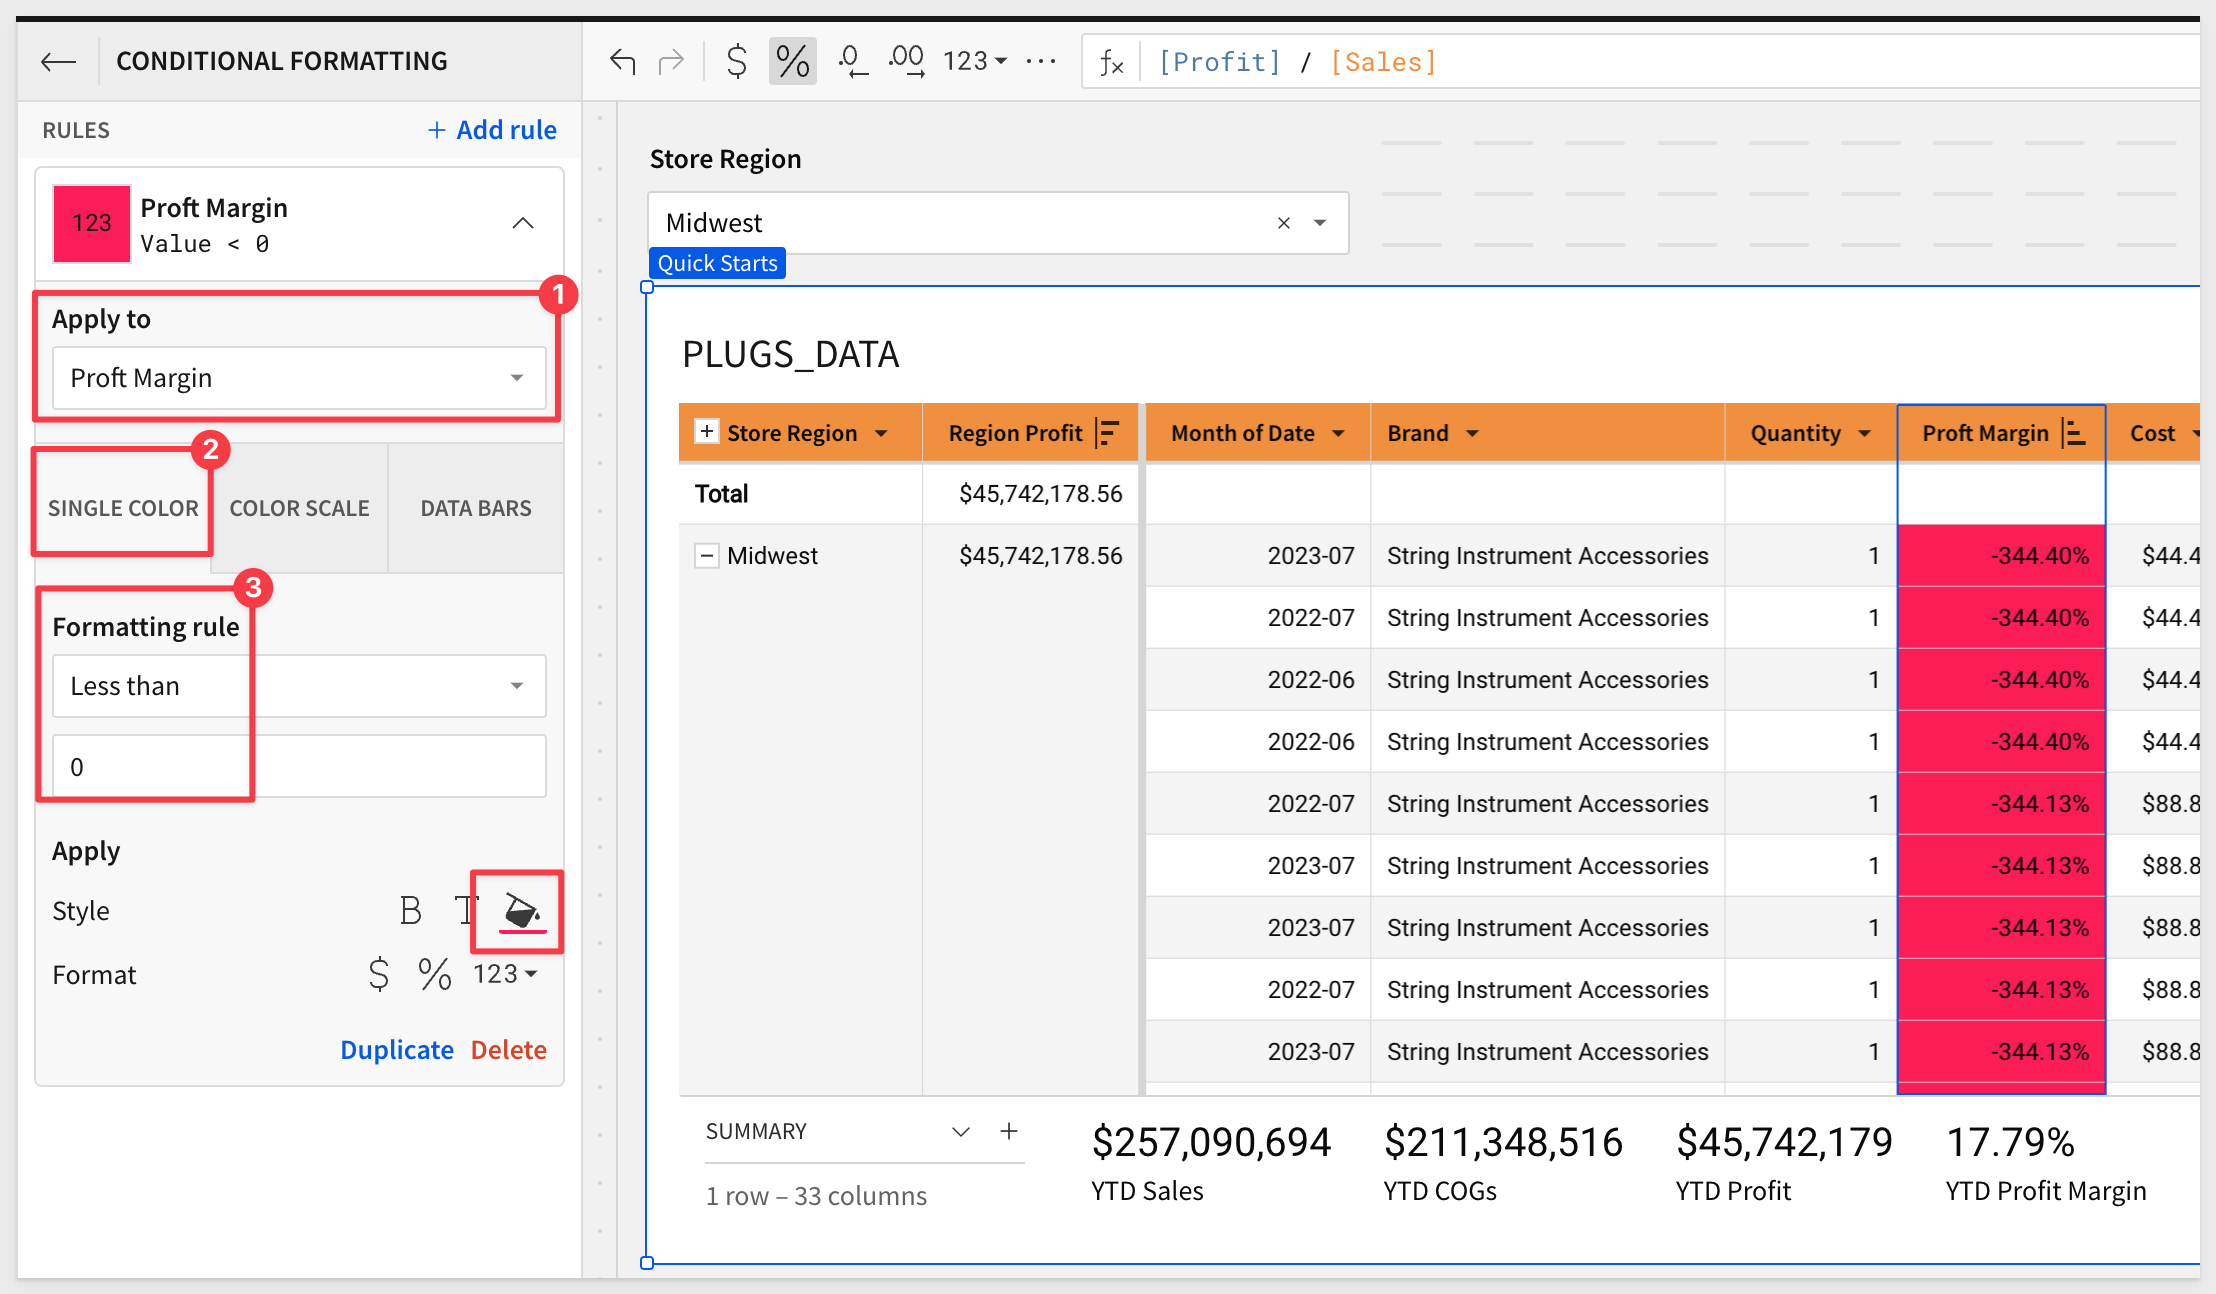
We can now see which transactions have a negative profit margin in red (you may have to change the sort on the Profit Margin column to show the lowest values).
Add as many rules (and customize each rule) by clicking + Add rule.
There are many things you can do to enhance your table; feel free to experiment and see what you can come up with.
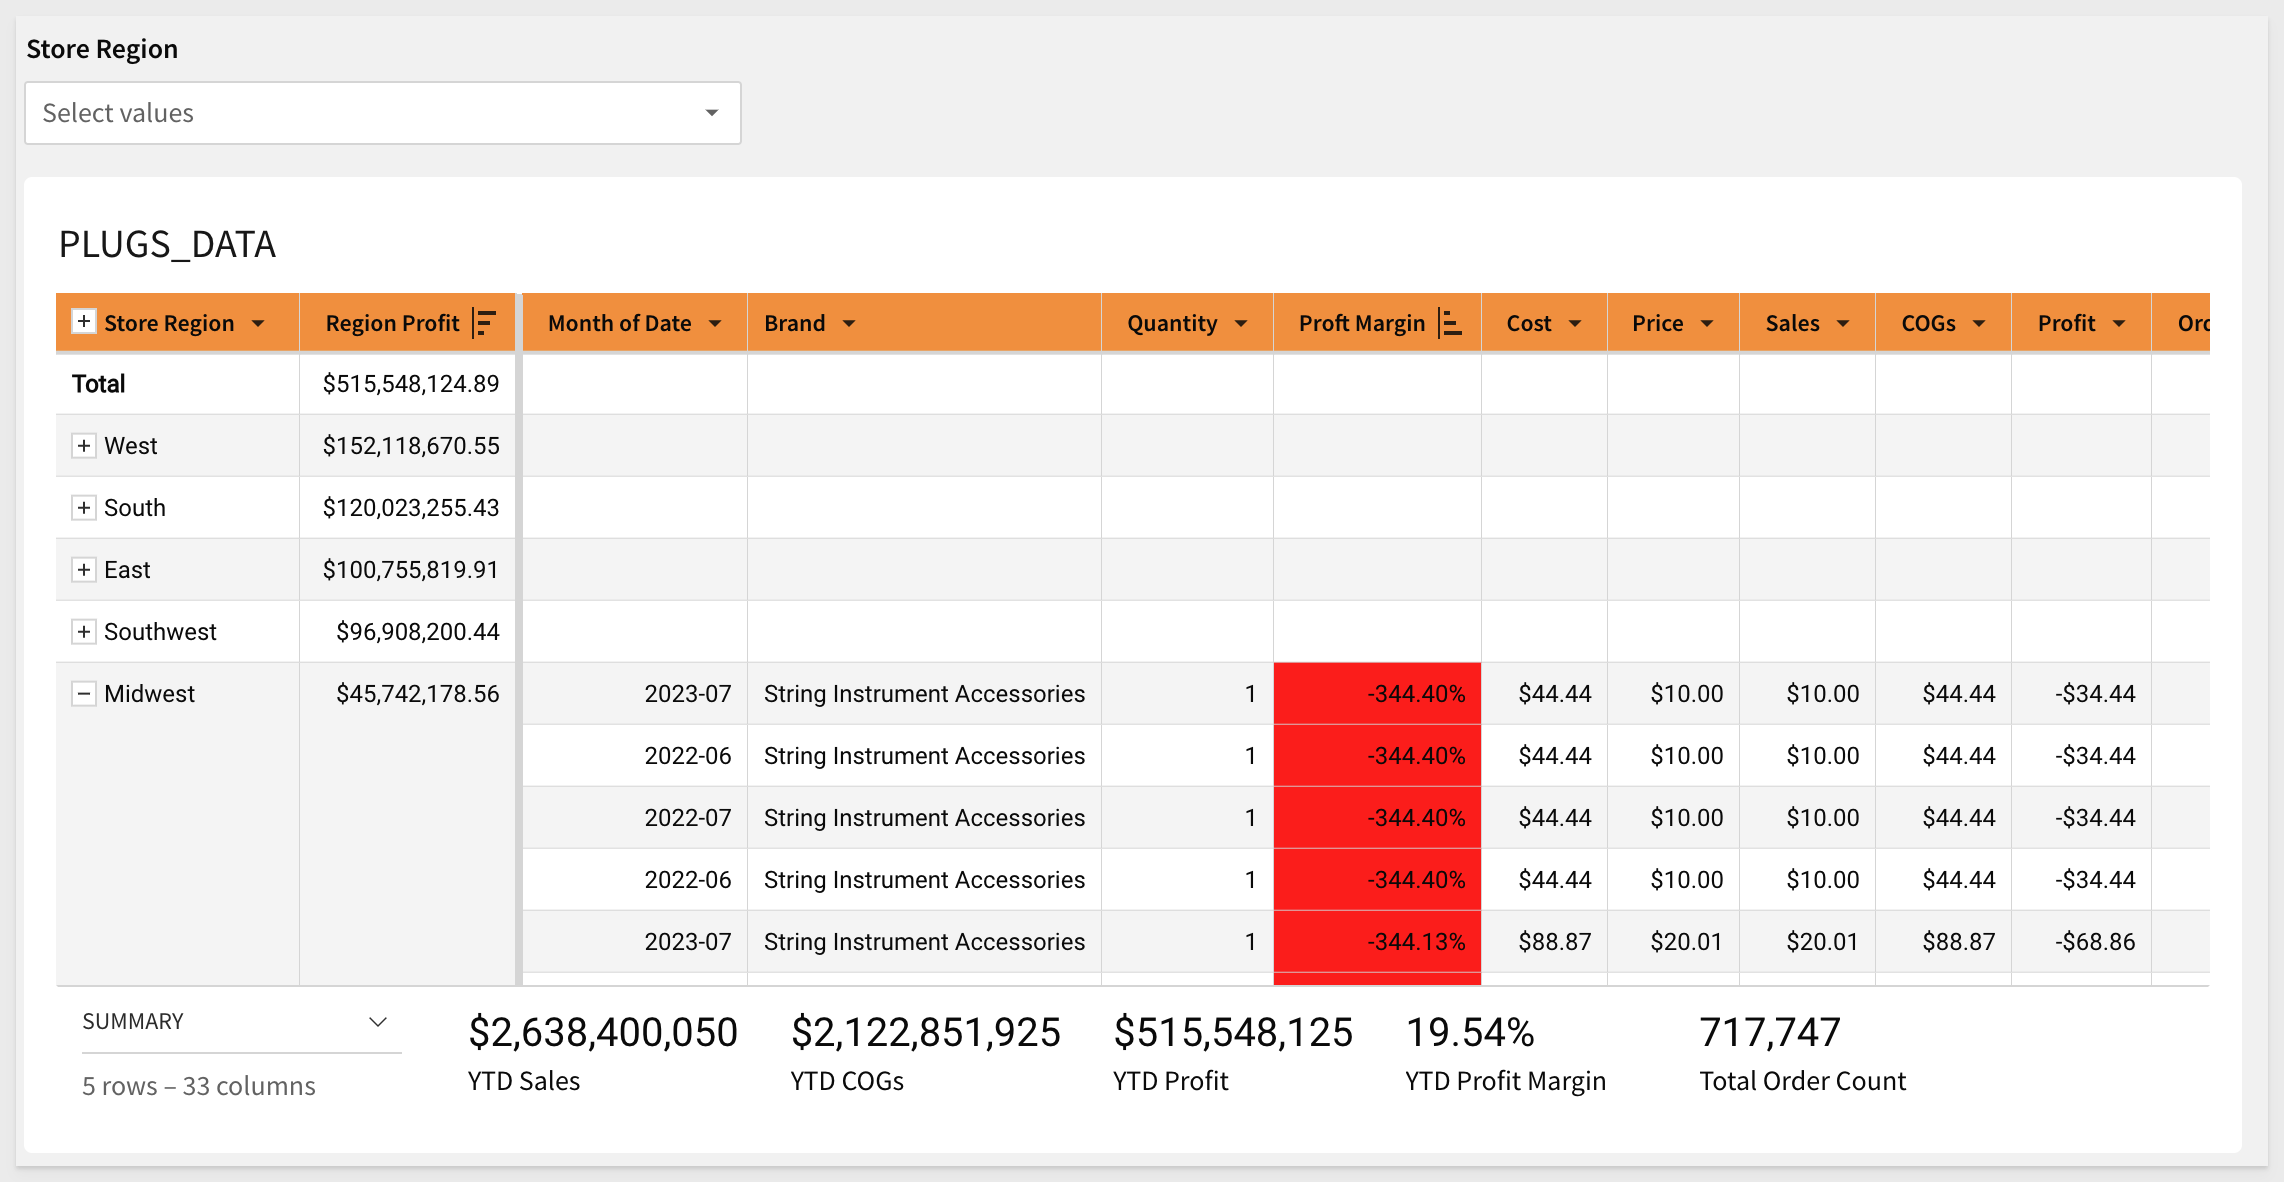
Clear the Store Region control.
Click Publish.
In this QuickStart, we covered how to access sample data to build a table, join other tables, add calculated columns, group and filter data, apply conditional formatting, and filter the result set.
Our Fundamentals workbook looks something like this:
Click here to move to the next QuickStart in this series.
Additional Resource Links
Be sure to check out all the latest developments at Sigma's First Friday Feature page!
Help Center Home
Sigma Community
Sigma Blog