Many Sigma users are used to creating a new workbook and then using warehouse tables as the data source for their content. This often requires the user to do extra data preparation work, like joining tables together, renaming fields or creating aggregations. This modeling logic is bound to a single workbook and is not reusable across your Sigma deployment. This can lead to duplicated effort and inconsistent reporting.
With Data Models, you can define your data transformation and semantics in one place, and use them anywhere in Sigma. This avoids duplicating effort, and provides a single source of truth for your Analytics Engineering team to collaborate on key business logic and metric definitions.
In this QuickStart, you'll learn how to:
- Understand Sigma's data modeling philosophy and features
- Create a data model using sample data
- Define relationships across tables
- Add custom columns and formulas
- Create metrics
- Use column-level security
- Validate downstream content with content validation
- Use column folders
- Materialize a data model
- Deploy reusable models for analysis
Our Modeling Approach
A primary design goal for Sigma data modeling is to make model creation seamless so your data team can move fast, without managing additional complex code, and deliver governed analytics to stakeholders.
Business users can focus on gaining insights from data without needing to worry about its physical structure, and can also contribute directly to the data model through Sigma's UI. Sigma models are collaborative and versioned—ideal for both data teams and business users.
For teams that prefer a code-driven workflow, Sigma also supports managing data models programmatically via the REST API, enabling version control and CI/CD automation. For more information, see Data Models as Code.
For more information on Sigma's product release strategy, see Sigma product releases
If something is not working as you expect, here is how to contact Sigma support
Target Audience
This QuickStart is intended for data analysts, analytics engineers, and data-savvy business users who are responsible for modeling, curating, or transforming data within Sigma. It is especially useful for those who:
- Want to create reusable, governed data models for analysis.
- Need to join and enrich warehouse tables visually without writing SQL.
- Are tasked with delivering consistent metrics to business stakeholders.
Prerequisites
- A computer with a current browser. It does not matter which browser you want to use.
- Access to your Sigma environment.
- Some familiarity with Sigma is assumed. Not all steps will be shown, as the basics are assumed to be understood.

Use case
For this demonstration, let's assume we are a data analyst at a retailer called Plugs Electronics. Marketing wants to do some ad-hoc analysis against sales transactions and wants to work from trusted data without making mistakes.
Corporate policy dictates that marketing should not have access to actual customer names and addresses but city/state information is fine.
The CFO wants to make sure that any calculations that are performed meet the published standard.
Since marketing's requirements are not fully defined, we'll provide access to product and store tables so they can be added to their analysis if needed.
Set up the data model
Let's use Sigma's data modeling tools to create a reusable model to serve as the foundation for a workbook.
To create or manage a data model, the following is required:
- Users must be assigned an account type with the Create, Edit, and Publish data models permissions enabled.
- Users must be the data model owner or be granted Can edit access to the data model.
For example, by default a Build user has the following data modeling permissions:
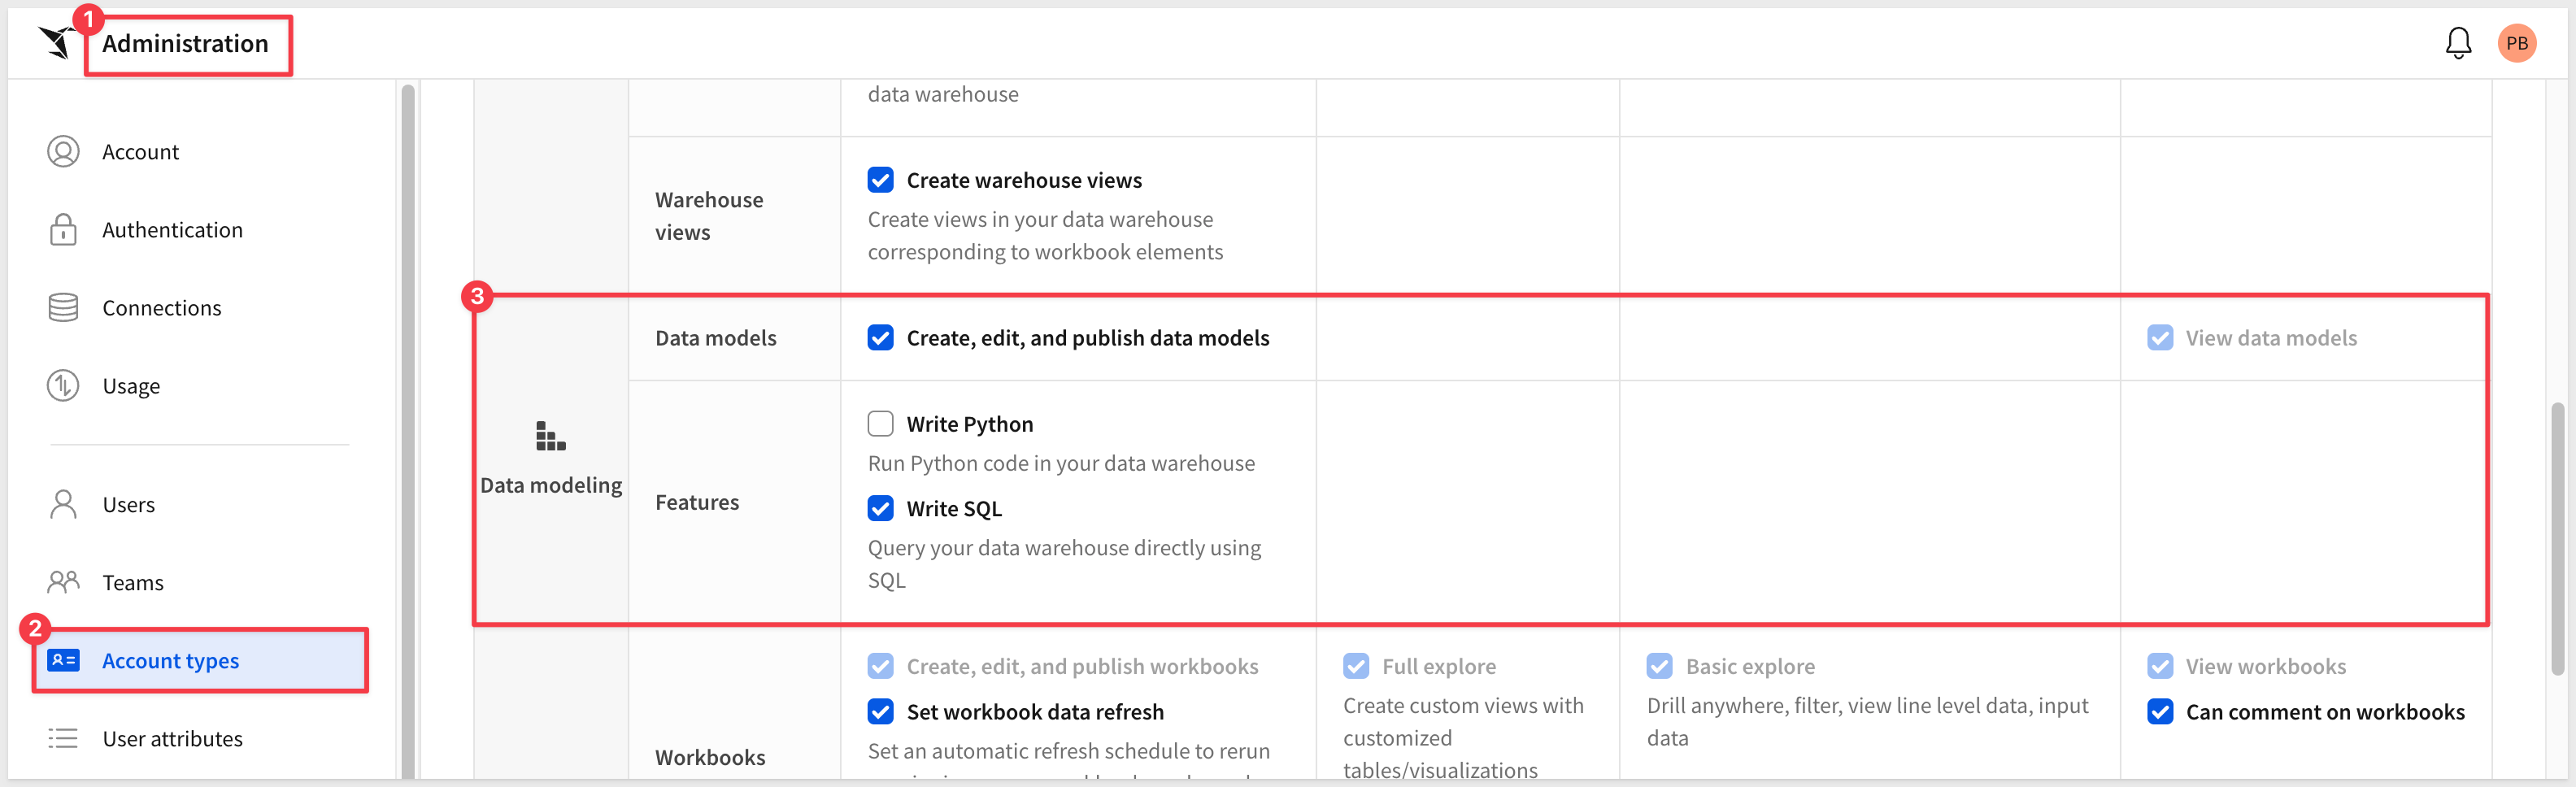
Access to individual datasets, data models, and workbooks are determined by folder and document permissions
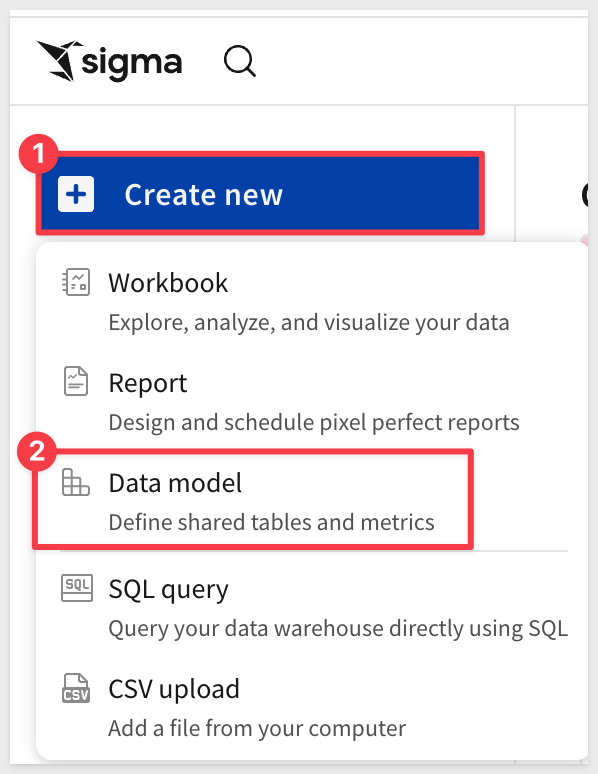
From the Sigma homepage, click Create new > Datamodel:
The data modeling page looks and behaves a lot like a standard Sigma workbook by design to make things as easy as possible.
To satisfy marketing's request we will use five tables that are provided to all Sigma customers in the Sigma Sample Database > PLUGS_ELECTRONICS schema.
Base table
To satisfy marketing's main request, we are going to create a "base table" by joining three tables together, culling the column list manually and creating a calculated column.
Why start with the most-granular table?
Sigma's Define relationships in data models guidance recommends using the most-granular table as the source element, with less-granular tables joined or related to it.
Picking the wrong base risks "fanout" — joining a less-granular table to a more-granular one inflates row counts unintentionally, which may lead to incorrect aggregations downstream. In our retail dataset, the line-item POS table (F_POINT_OF_SALE) is the most granular — each row represents a single line on a single order — so it's the right starting point.
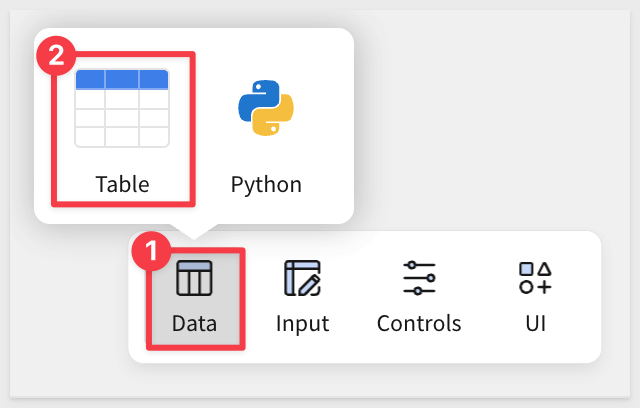
Add a new table from the Element bar > Data group:
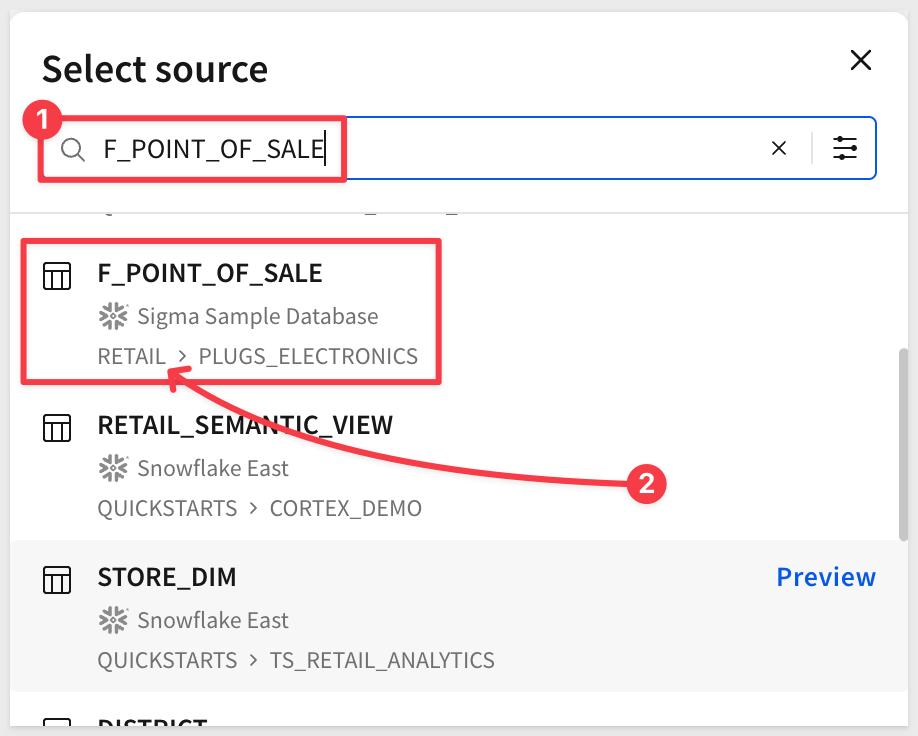
We could navigate to the table but it is easier to just search for:
F_POINT_OF_SALE
Select the table from the RETAIL schema:
The table is added to the page and we can work with it just as we would in a Sigma workbook.
Rename the table to Plugs Sales. The data model name is for the business audience — "Plugs Sales" describes the use case better than the underlying table name and is how builders will find it.
Save the work as a new data model named:
Data Model QuickStart
Marketing will always need columns from F_SALES (for order-header context including the customer key) and D_CUSTOMER (for customer attributes), so we can join them to our F_POINT_OF_SALE base.
Order matters.
We join F_SALES first because F_POINT_OF_SALE carries Order Number but not Cust Key — the customer key lives on the order header, not the line item. Once F_SALES is in the model, the Cust Key it brings in becomes the join key to D_CUSTOMER.
Both joins are many-to-one from the line-item grain — each POS line maps to exactly one F_SALES row (via Order Number), and each of those maps to exactly one D_CUSTOMER row (via Cust Key) — so neither join will inflate row counts.
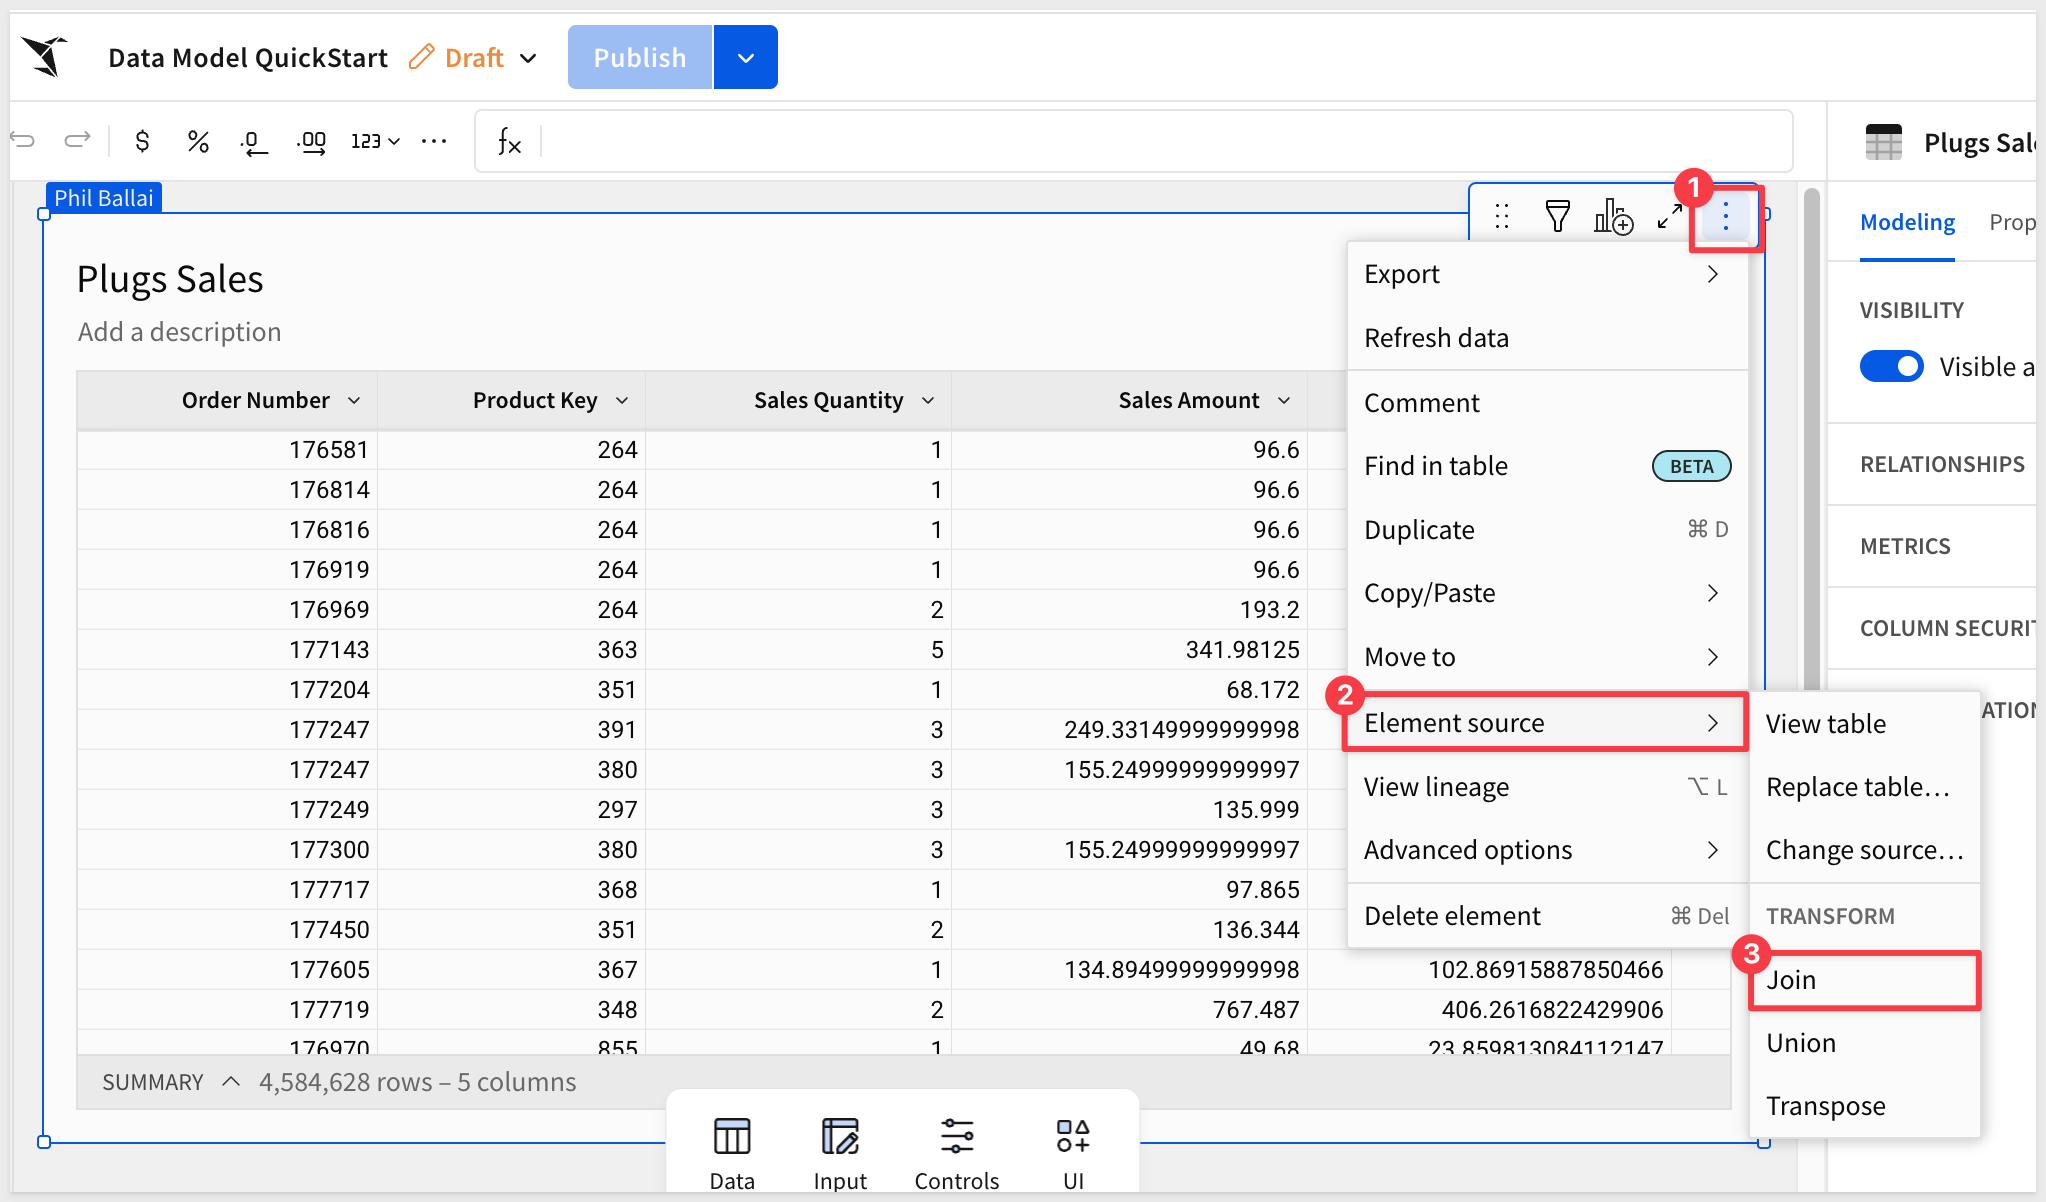
From Plugs Sales, select Element source > Join from the table menu:
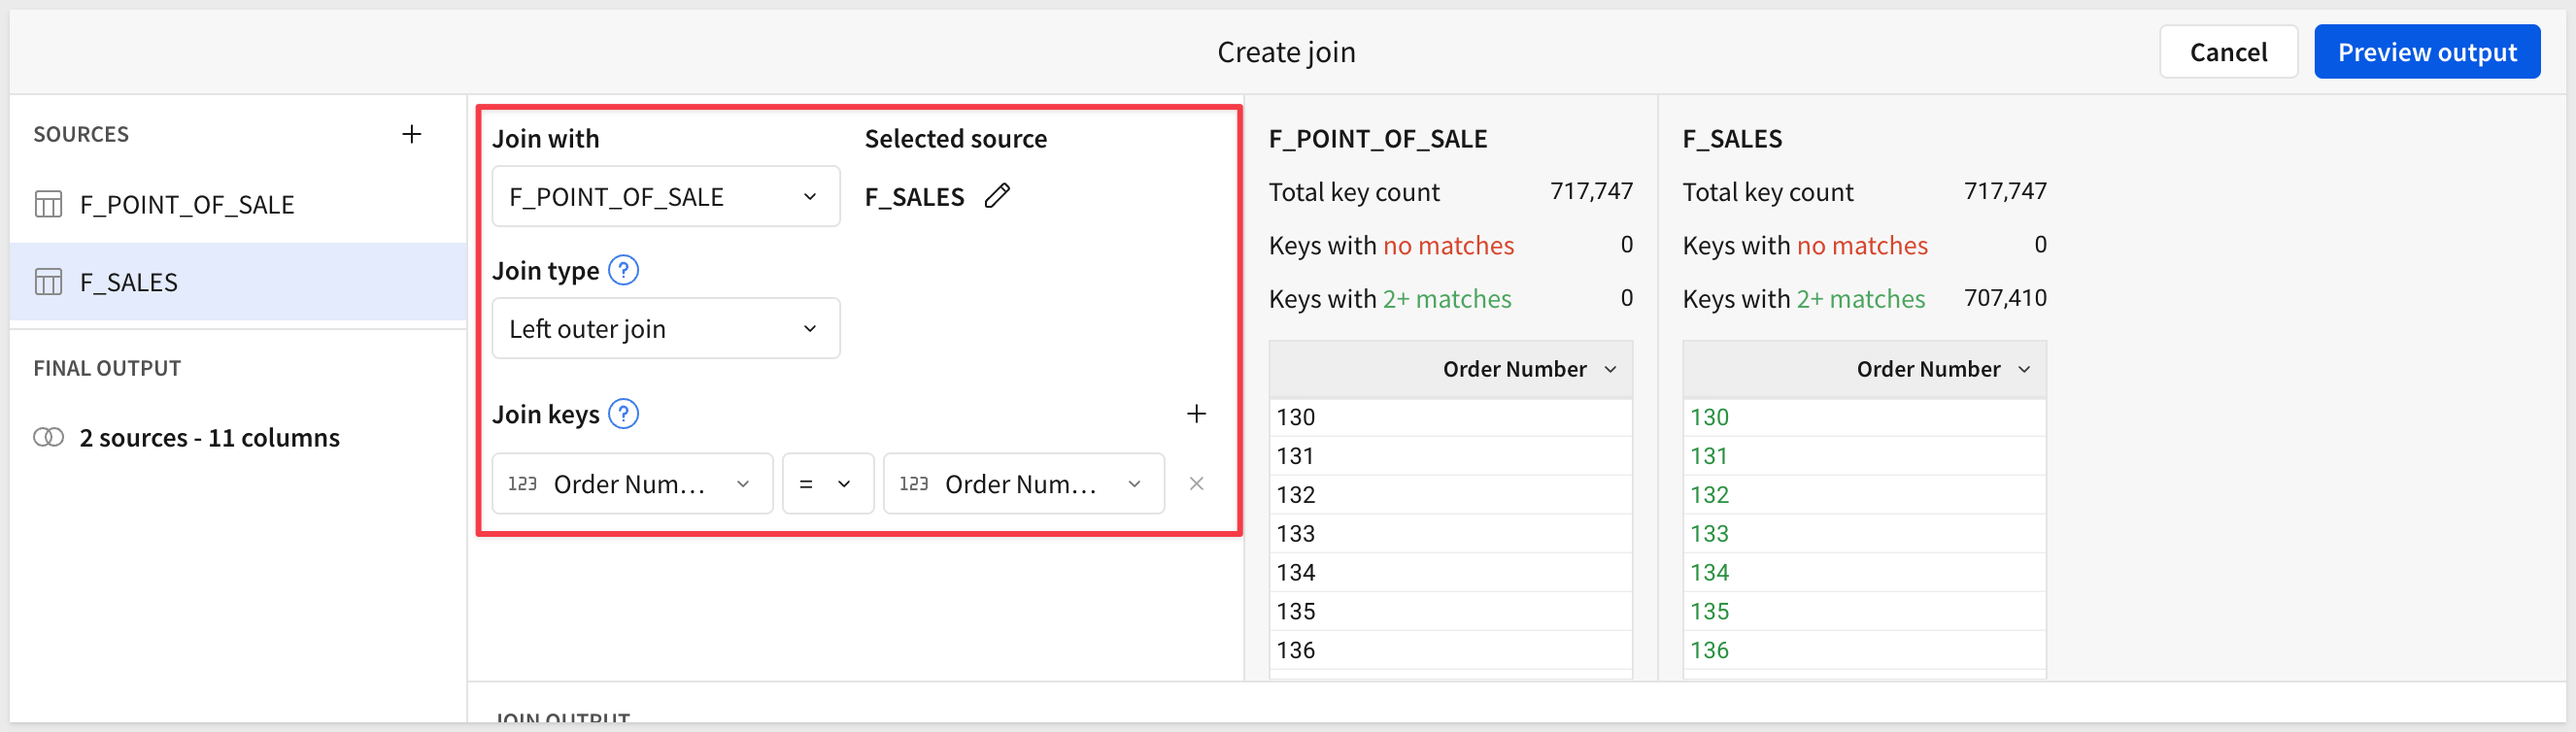
Search for F_SALES and select the one from the RETAIL > PLUGS_ELECTRONICS schema.
Click Select to accept all columns and set the Join keys to Order Number:
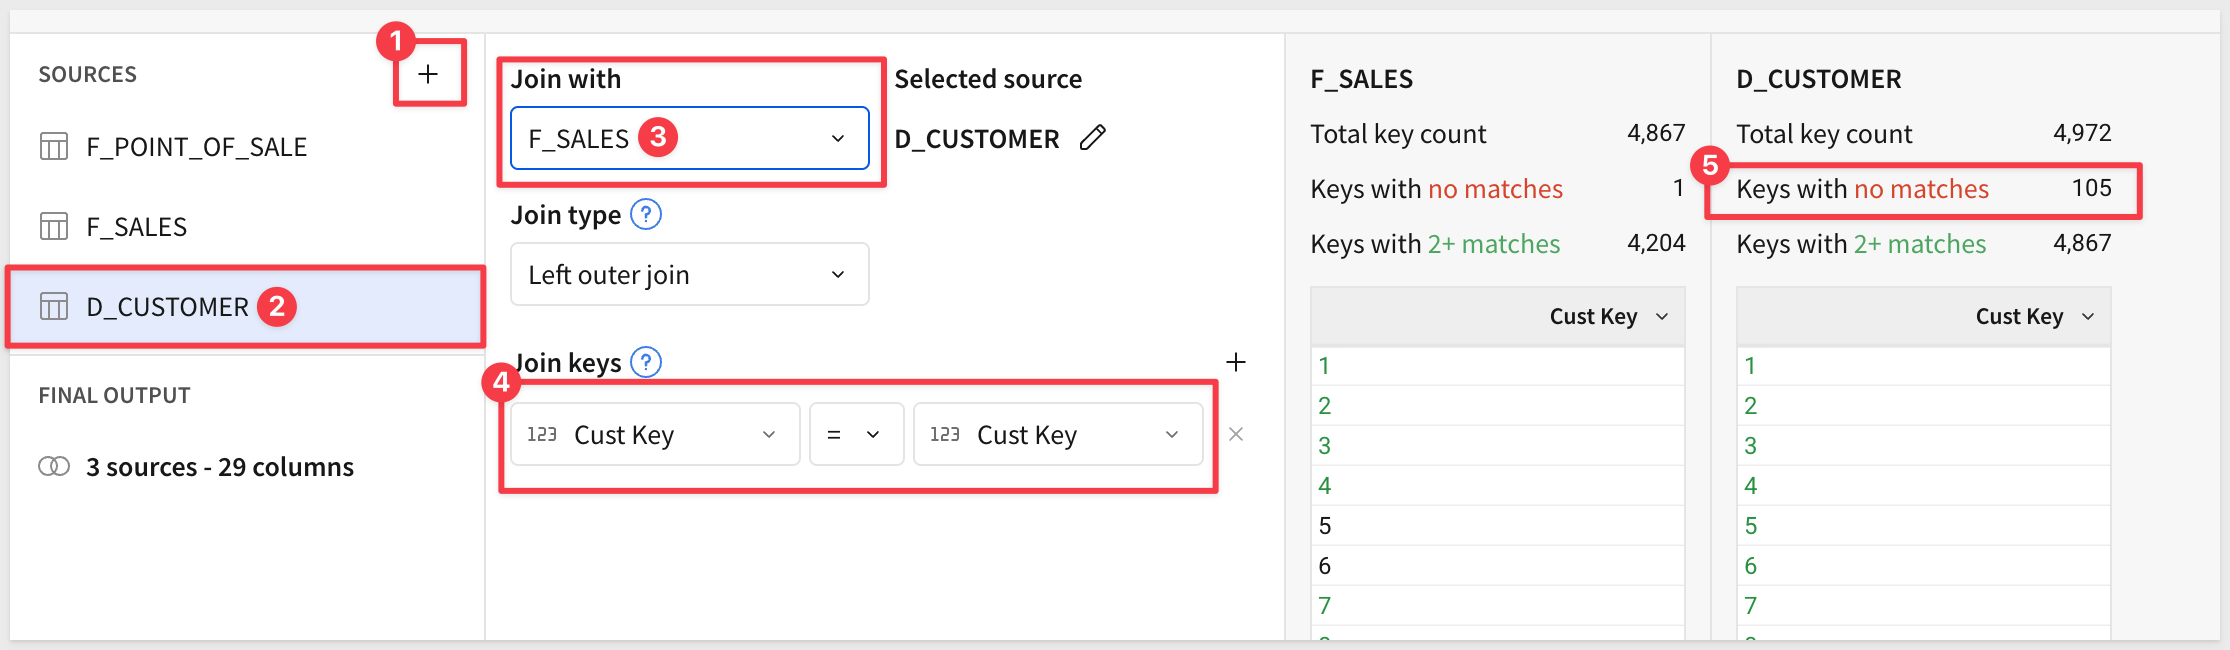
Click the + icon to add another table to the join, this time selecting D_CUSTOMER from the RETAIL schema and joining on Cust Key (which came in via F_SALES). There are 105 customers who have never made a purchase:
Click Preview output.
Sigma shows us the lineage of the joins and gives us an opportunity to deselect columns as needed. Note how F_POINT_OF_SALE sits on the left as the source, with D_CUSTOMER and F_SALES joined to it — this is the canonical "most-granular-first" shape:
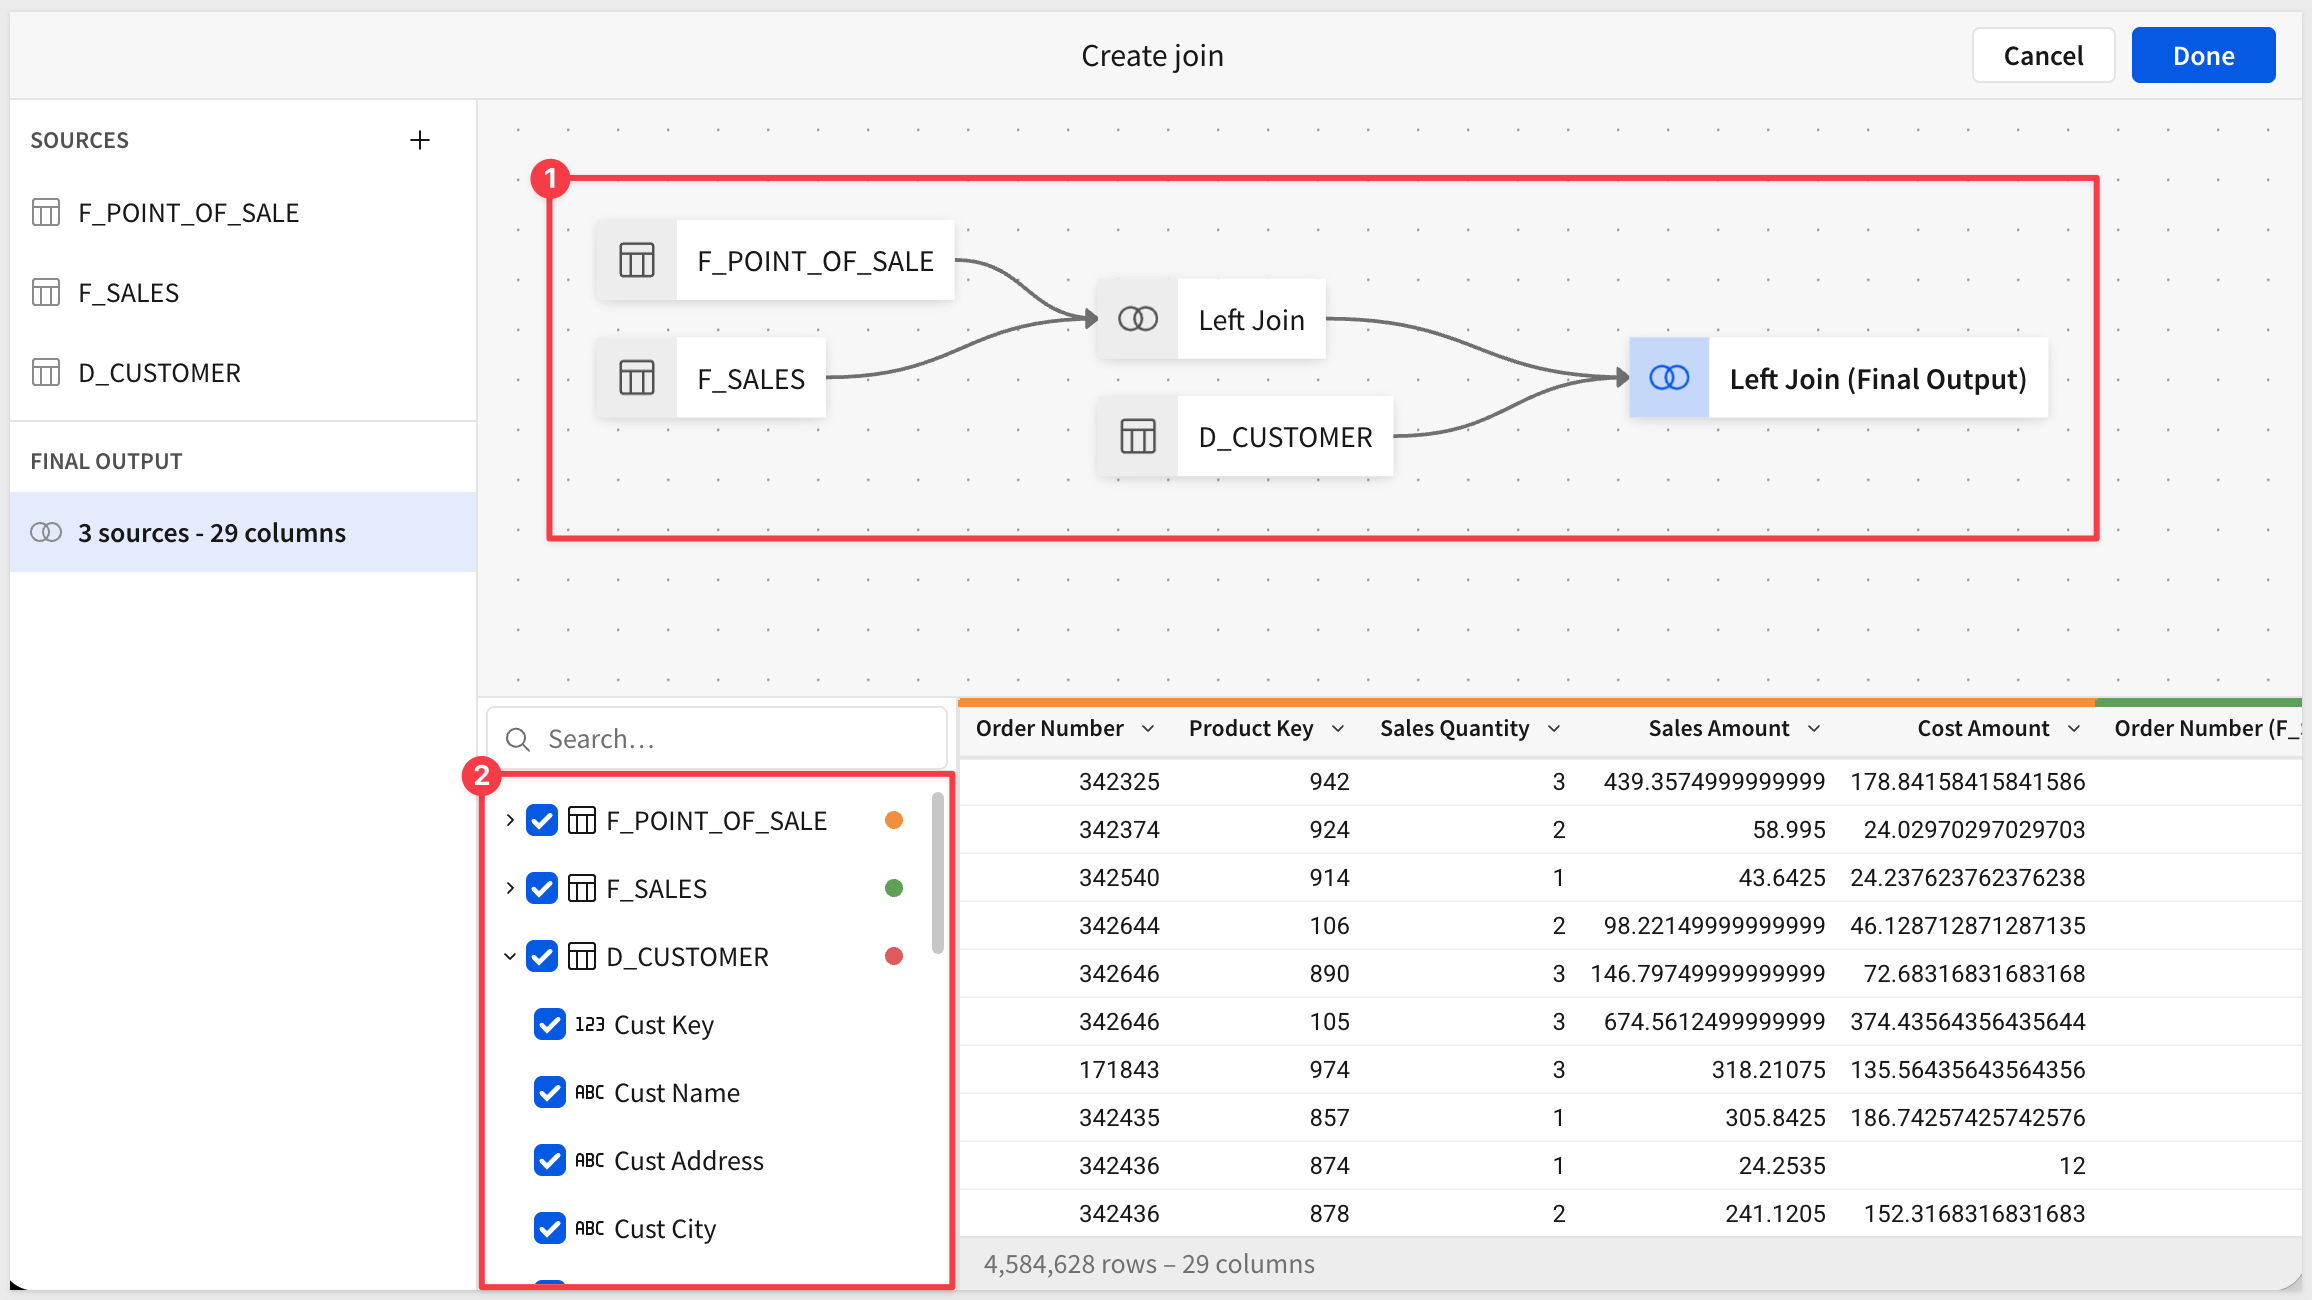
Click Done.
The two joins bring in a lot of new columns — many of which marketing won't need by default but which a builder might want to expose later. This is the right point to demonstrate hiding columns, which is reversible, versus deleting them outright.
Hide the four columns as shown below:
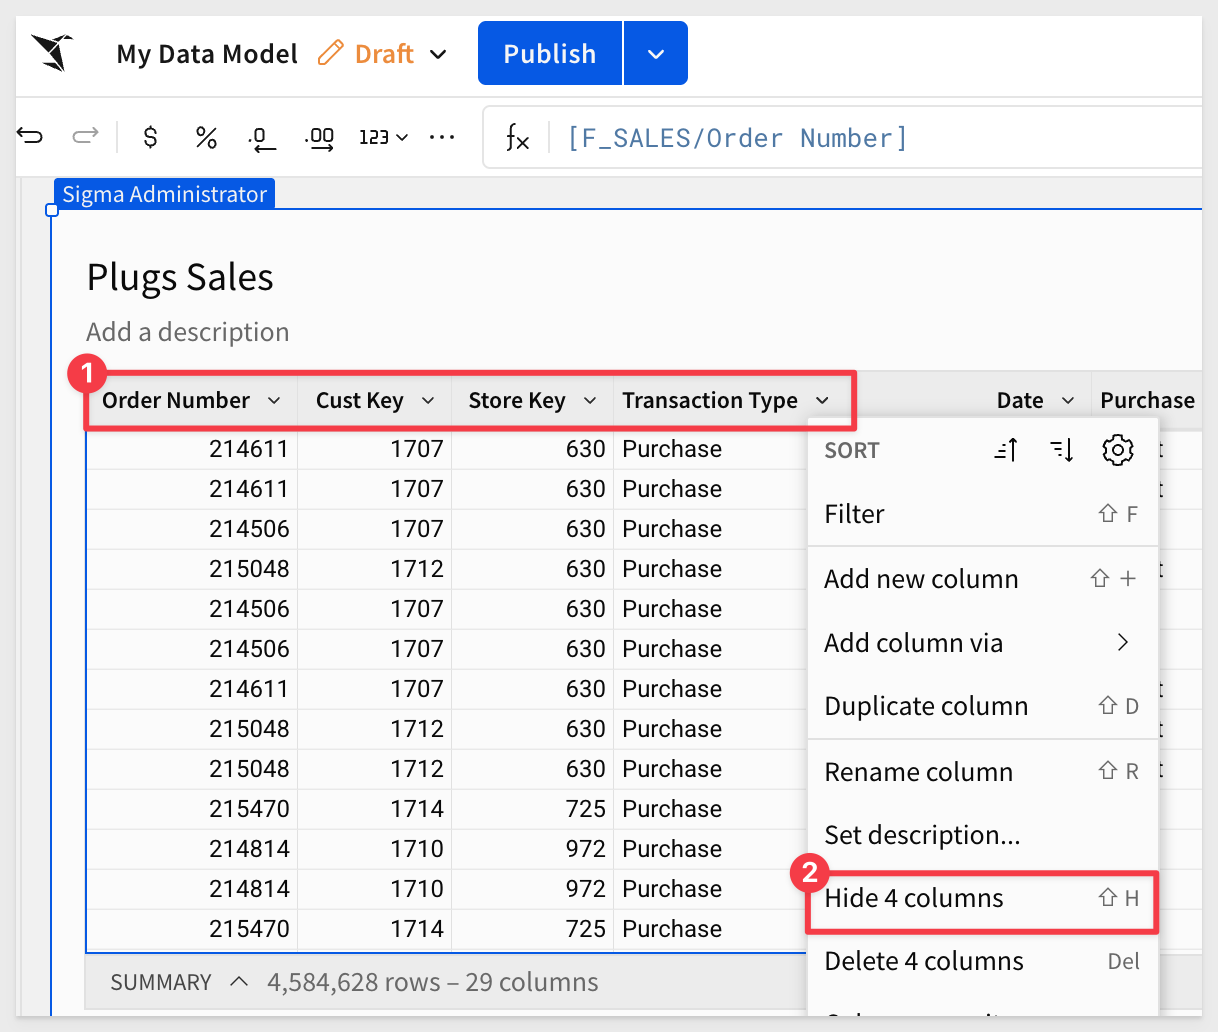
Notice that in the Source columns list the four columns are still selected:
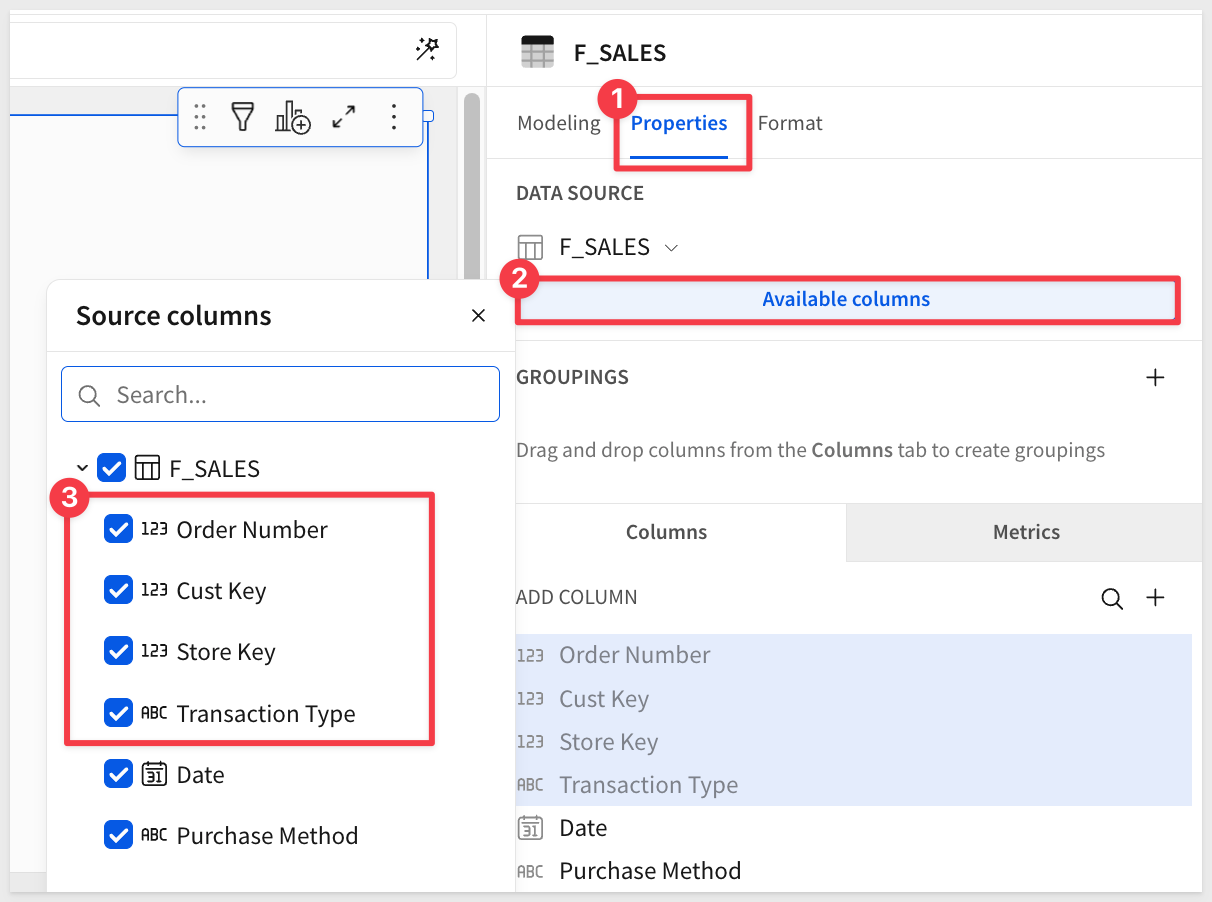
What this means is that downstream (i.e., when the data model is used in a workbook) the four hidden columns do not appear initially, but are available for the user to unhide.
For example, if we used the data model we have so far in a workbook, we can see the columns are still available, though not selected by default:
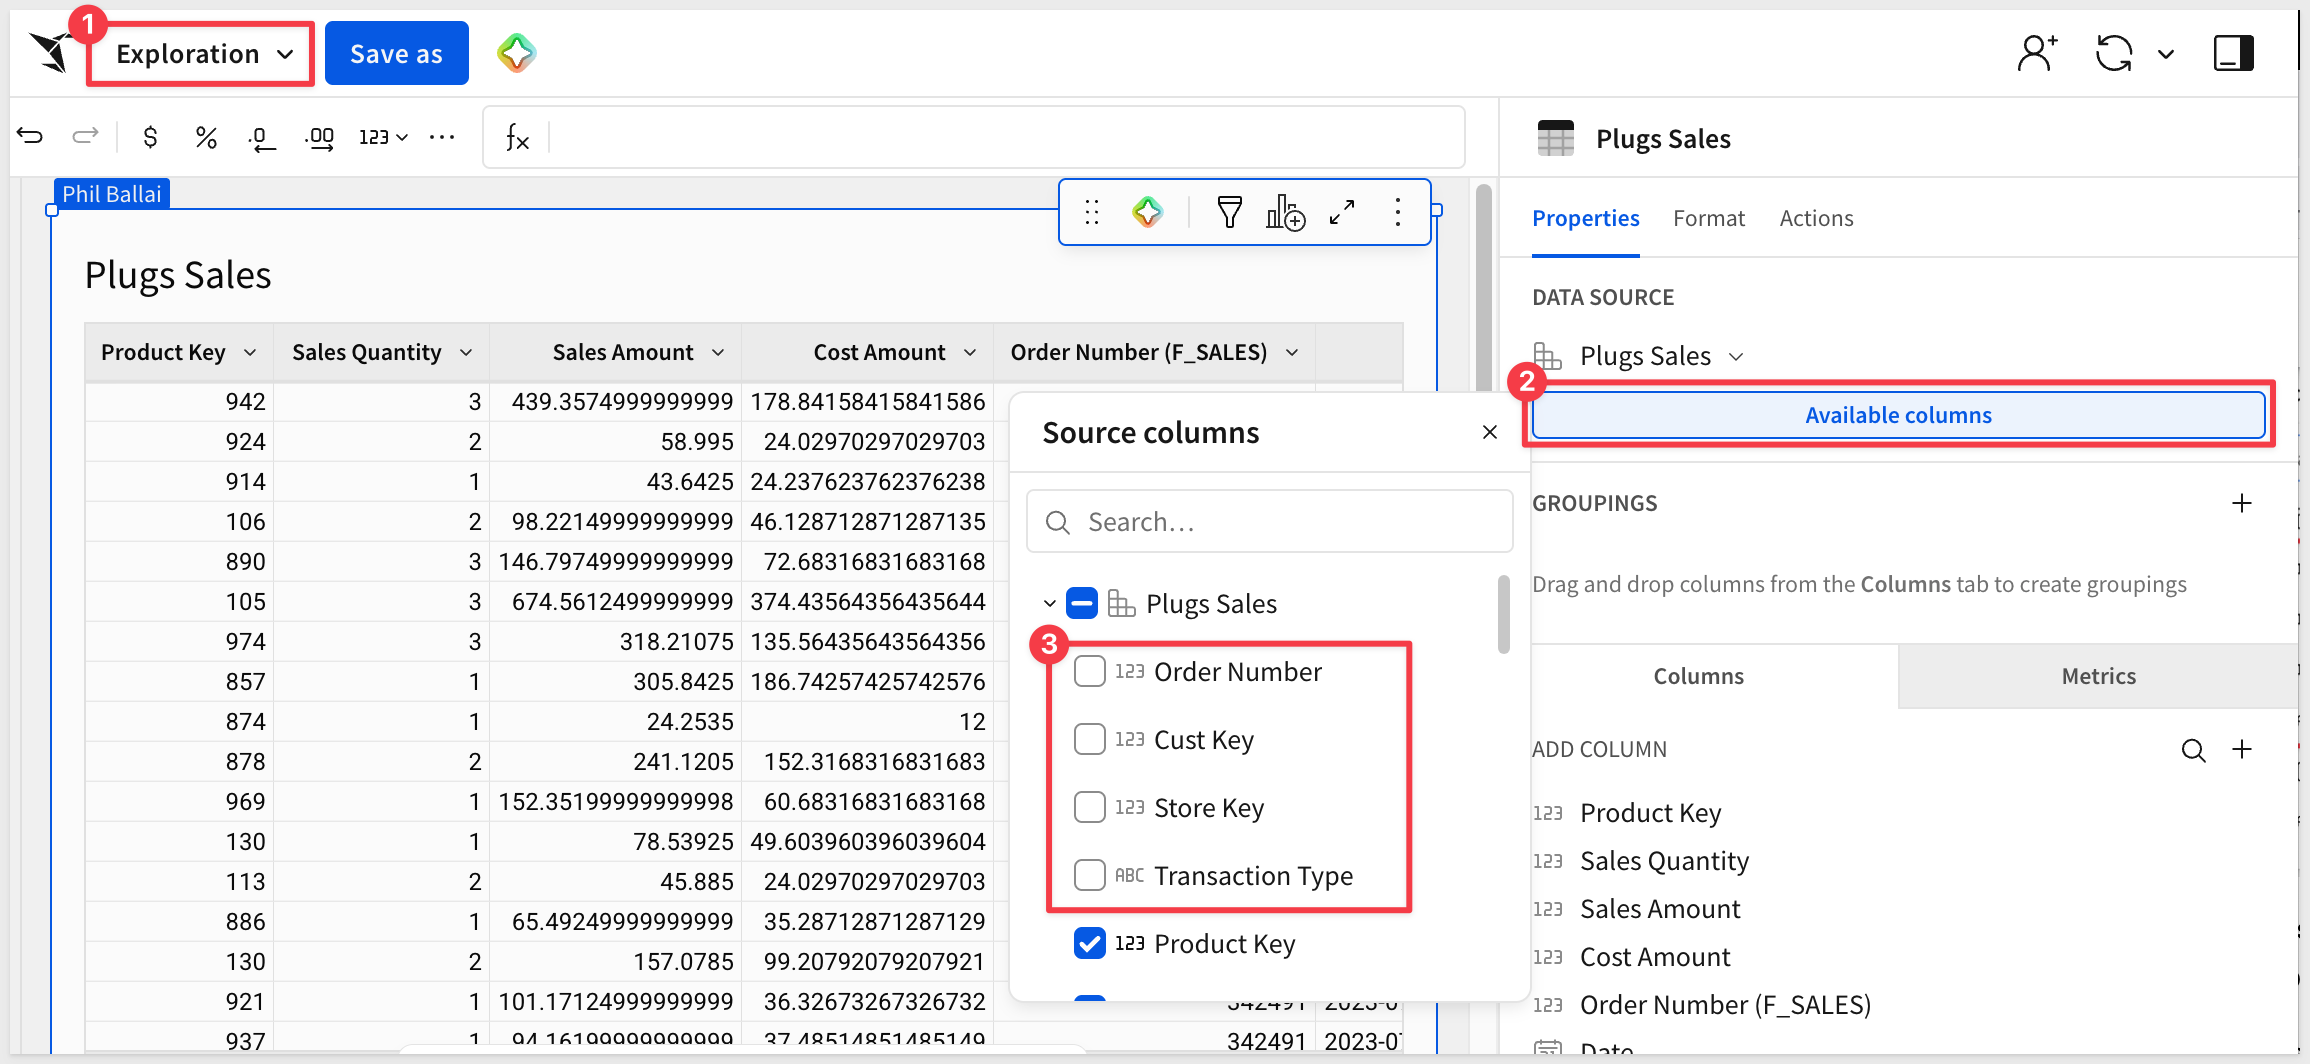
Use the Undo icon to unhide these columns:

For columns that will never be needed, deletion is the right call.
For example, columns with duplicate information or key columns that won't be used to create relationships later.
For example, we can delete D_CUSTOMER/Cust Address since we don't want to expose that.
Calculated columns
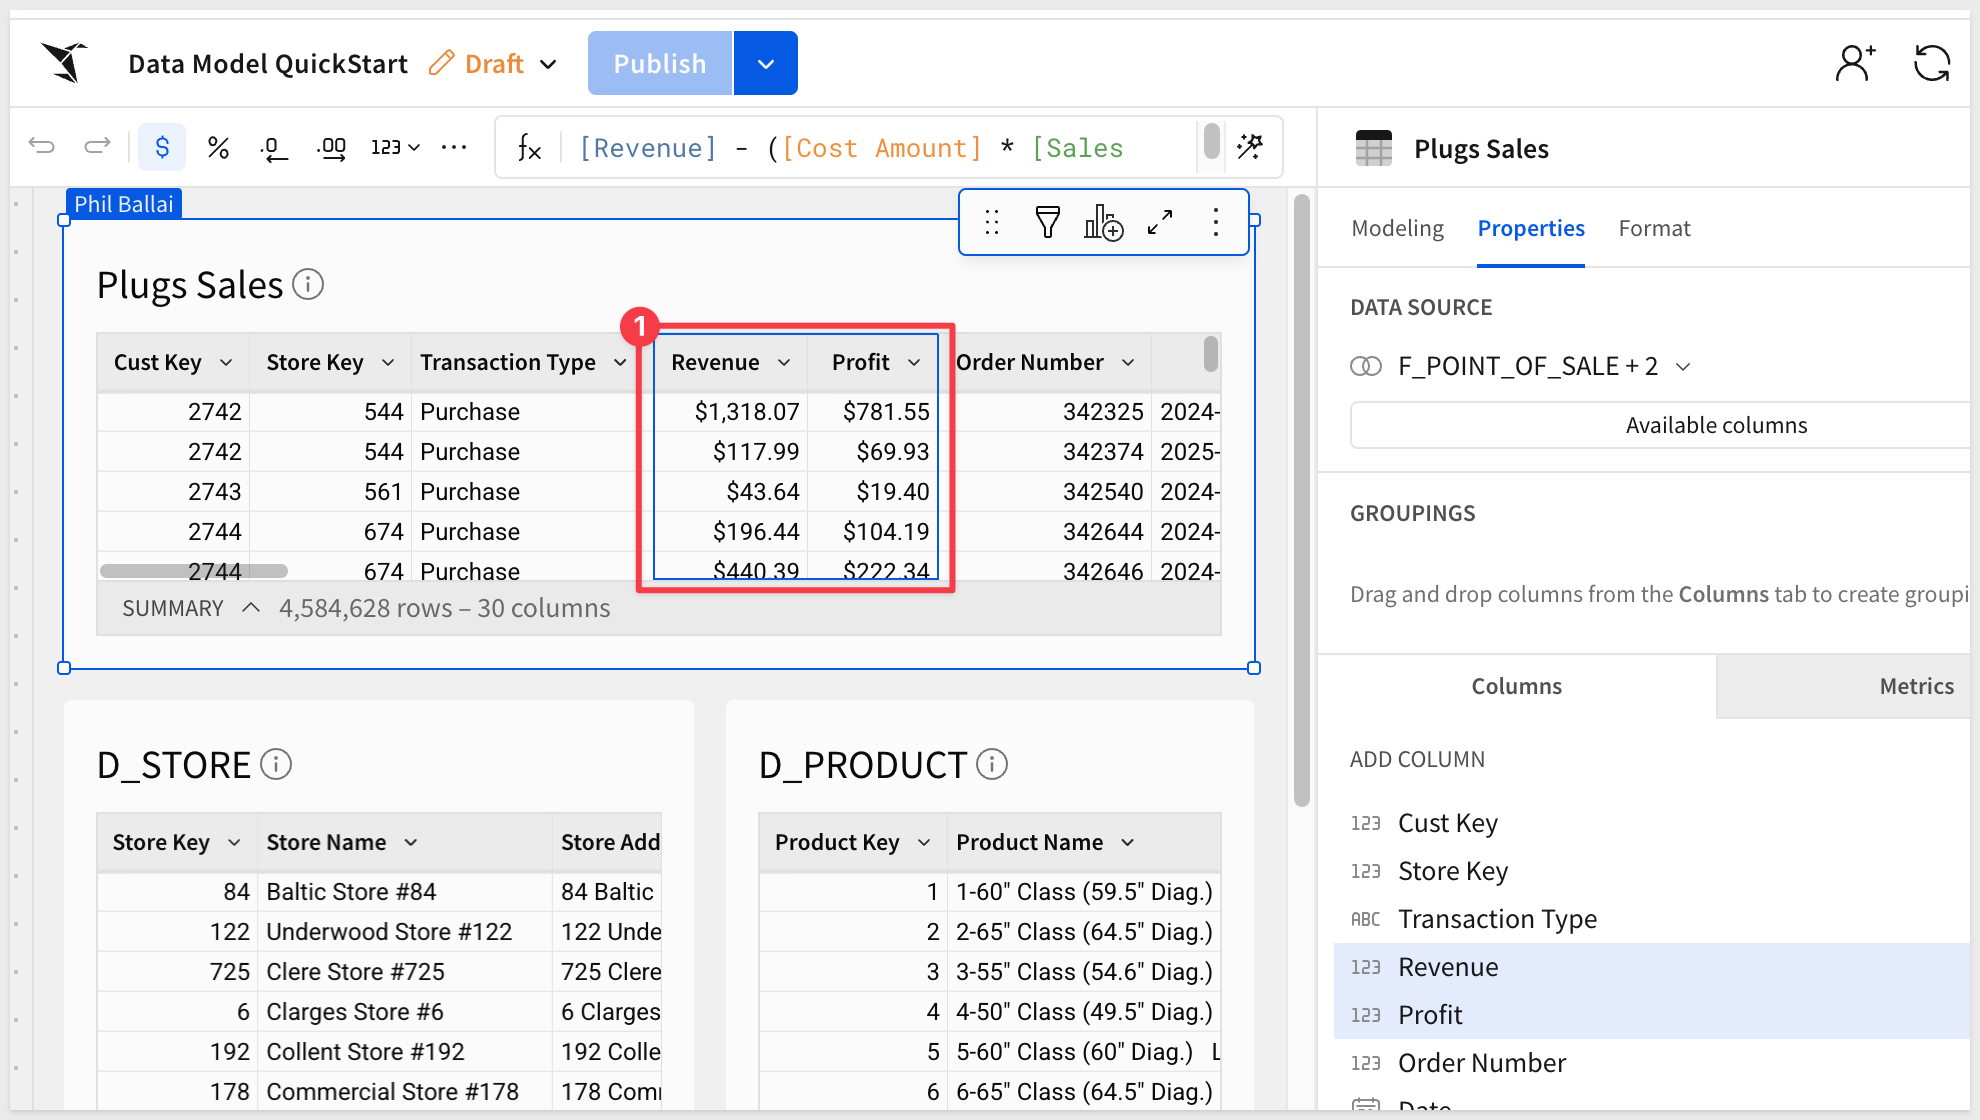
Since our base table does not have columns for Revenue or Profit, we can add them easily:
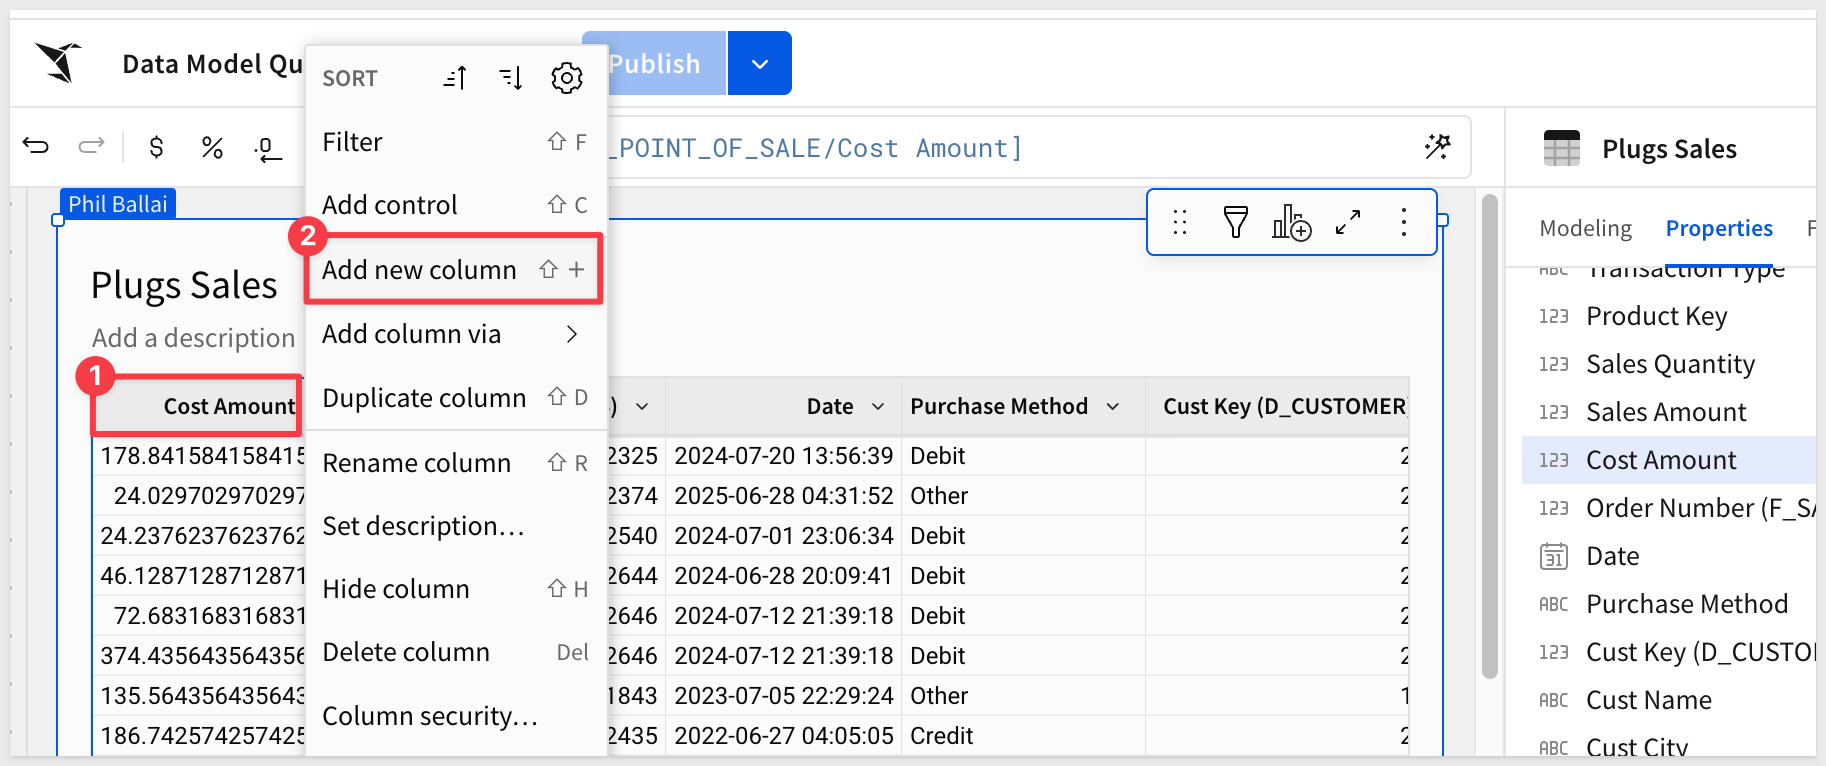
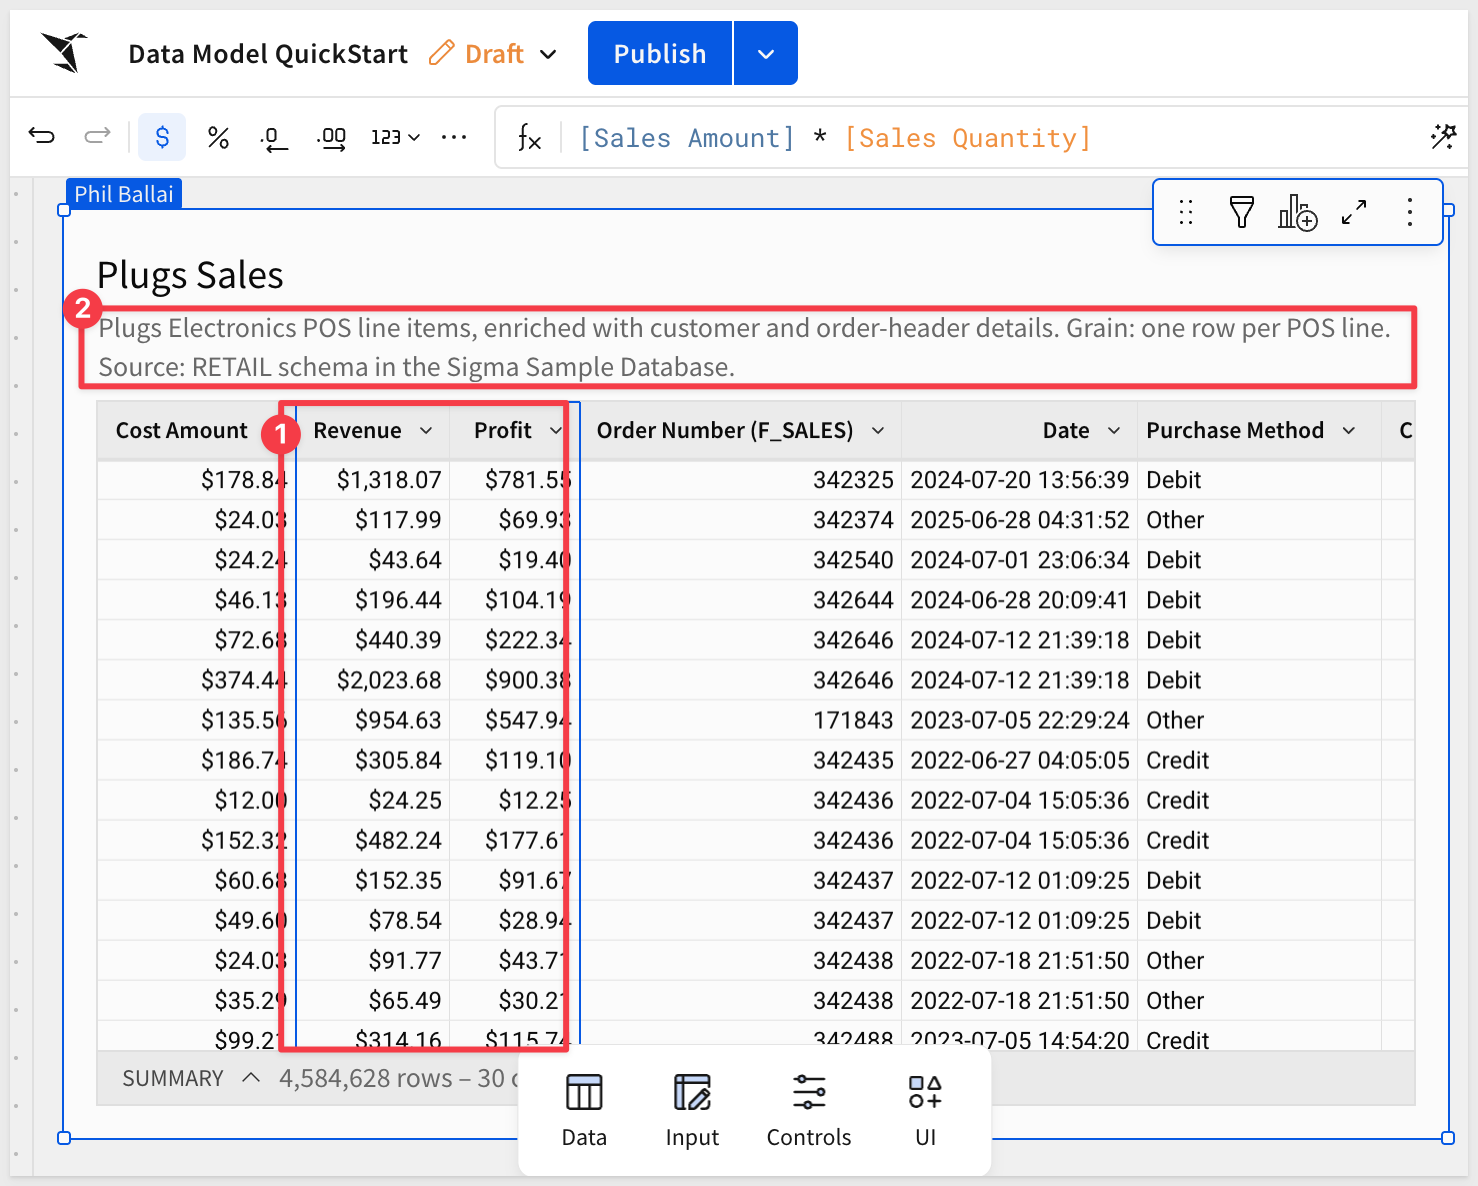
Add a new column, and rename it to Revenue. Set the formula to:
[Sales Amount] * [Sales Quantity]
Add another column, and rename it to Profit, and set the formula to:
[Revenue] - ([Cost Amount] * [Sales Quantity])
Set the table description to:
Plugs Electronics POS line items, enriched with customer and order-header details. Grain: one row per POS line. Source: RETAIL schema in the Sigma Sample Database.
Click Publish.
Data models serve as a starting point for builders in Sigma to explore data. Relationships power this experience and make it easy for the builder to quickly get what they need through predefined modeling logic, rather than working directly with raw warehouse content such as tables or views.
Once fully built, the data model might look like this, allowing the builder to get moving much more quickly than starting a workbook from scratch.
Creating the relationships
We could just join the other tables to Plugs Sales using the join workflow.
While this will still work, we'd miss out on one of the key benefits of using relationships—join pruning.
Join pruning offers several benefits:
- If a downstream query doesn't use any fields from a joined table, that join can be skipped entirely during execution.
- It can reduce query cost, complexity, and runtime.
By keeping Plugs Sales as the base data and using relationships for tables less often used, we gain:
- Clear lineage: we always know the grain and logic origin — every row is one POS line item.
- Separation of concerns:
F_POINT_OF_SALEremains the clean line-item fact, reusable elsewhere. - Simpler troubleshooting: if a join breaks or inflates rows, it's scoped to the child model.
- Cleaner published models: downstream users only see what they need.
Add Product and Store tables
Before we can create a relationship, we need to add the two tables we want to expose to the builder.
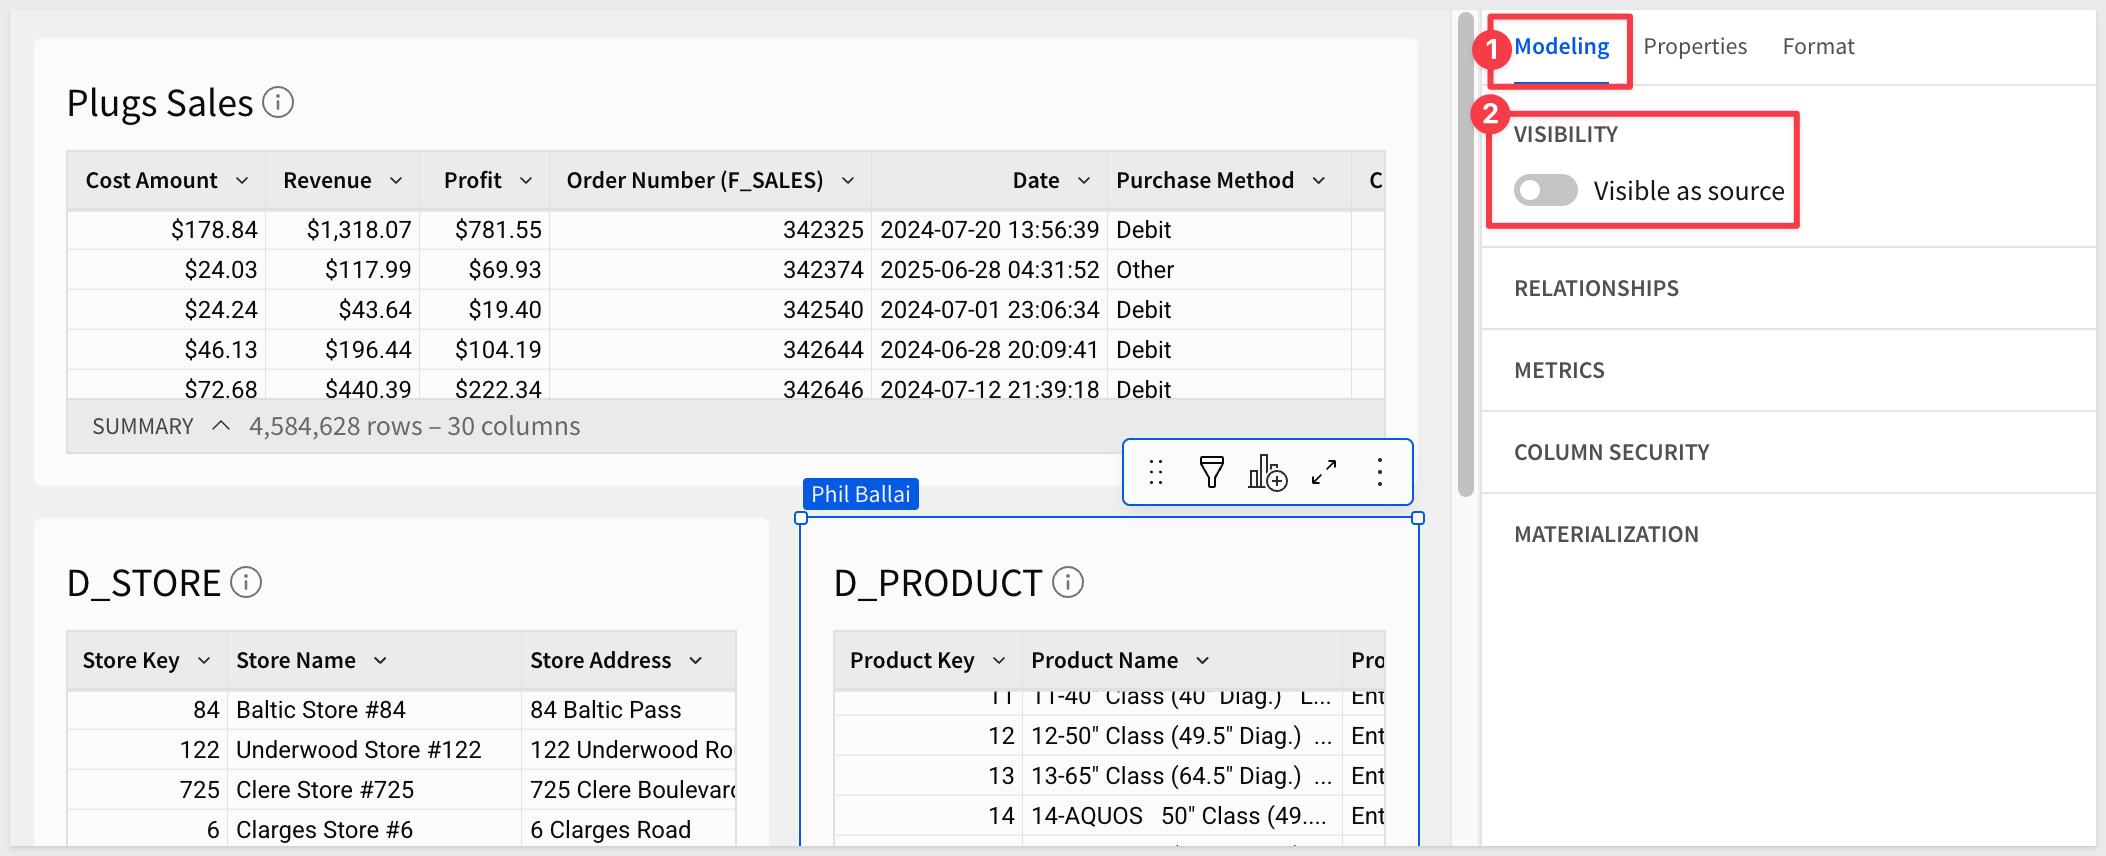
Add the D_PRODUCT and D_STORE tables from the RETAIL > PLUGS_ELECTRONICS schema directly to the data model.
We want to prevent the tables from appearing in the published data model, so we can toggle Visible as source off for both tables:
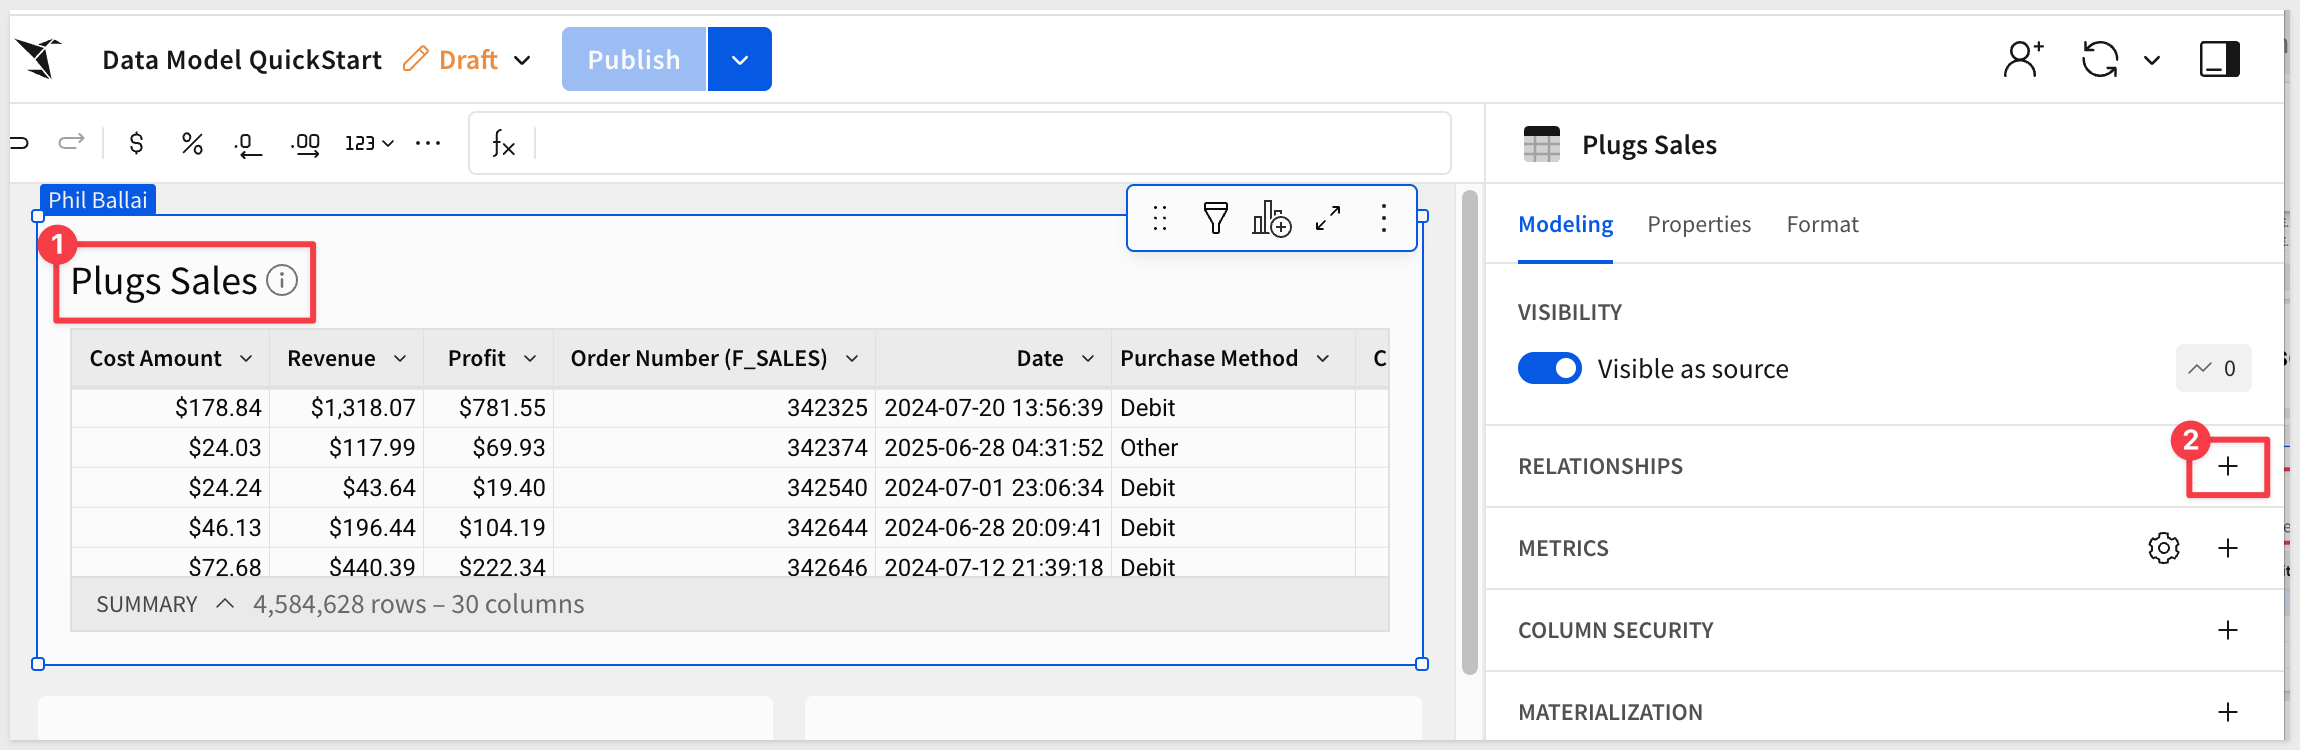
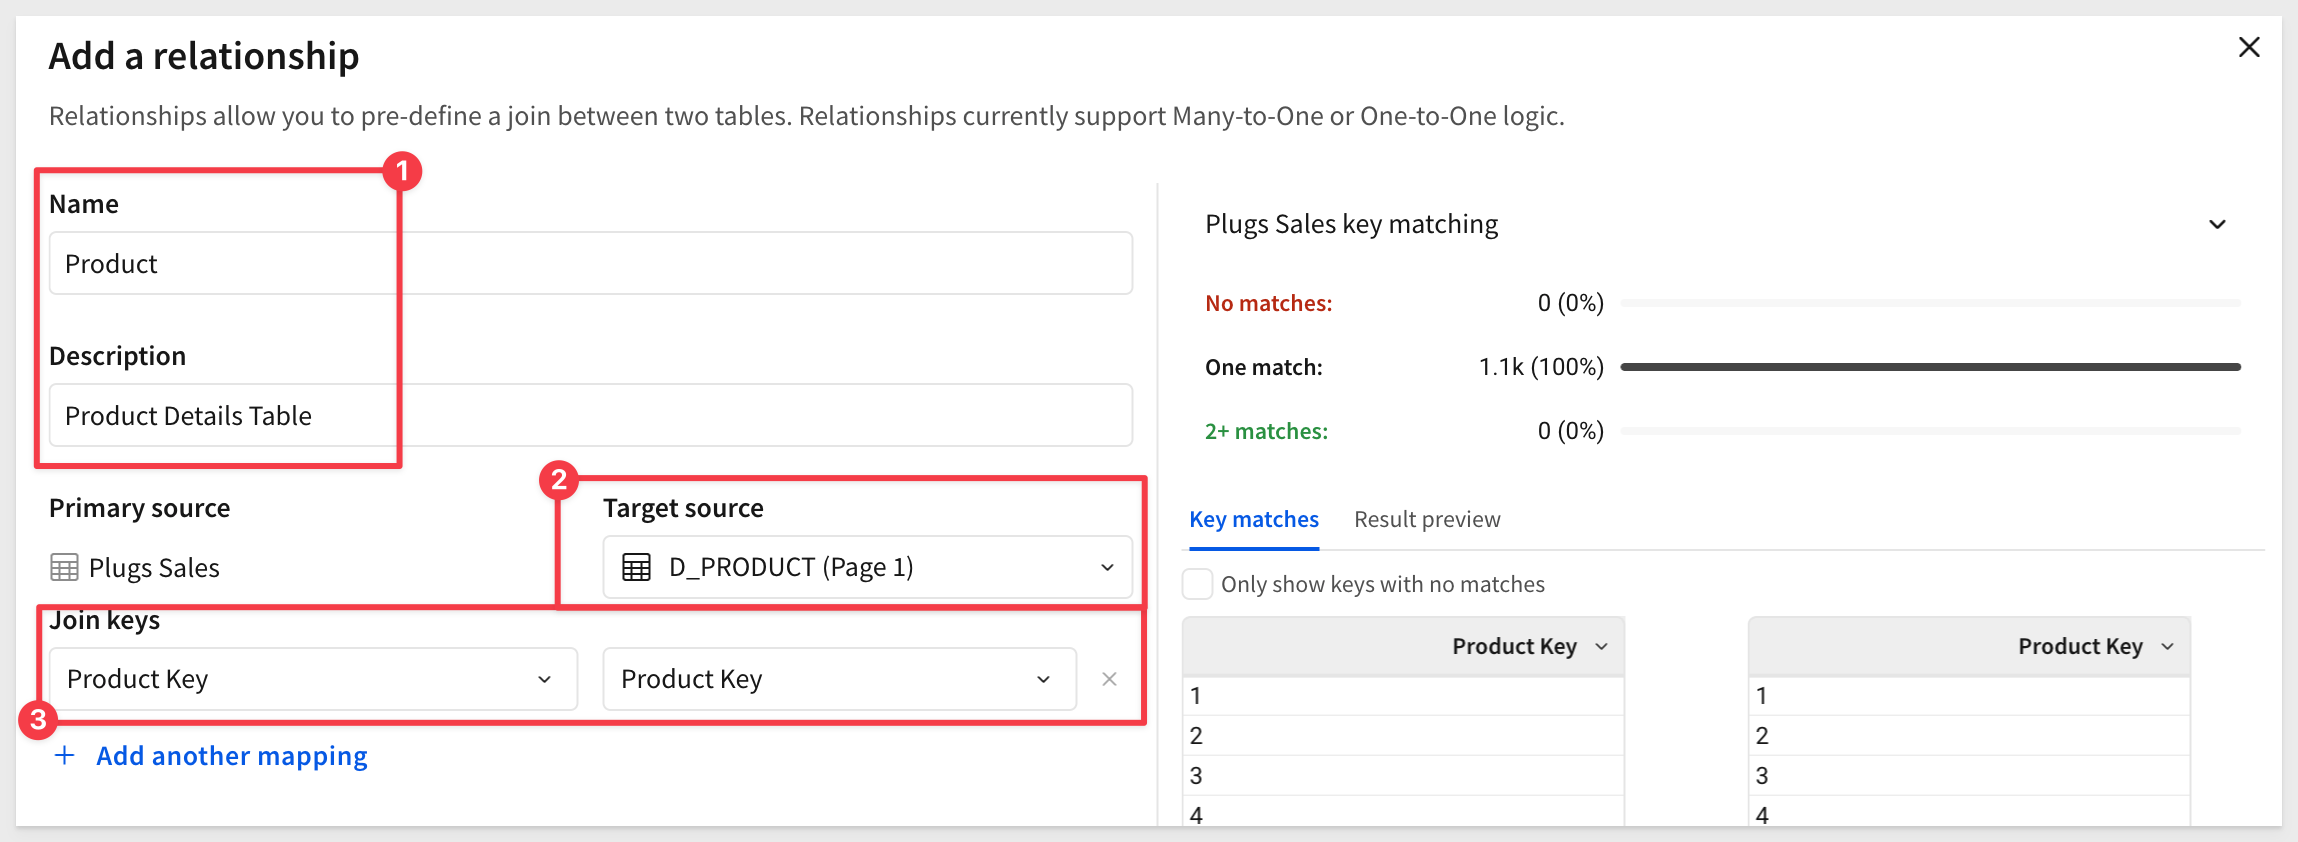
With Plugs Sales selected, click the + to create a new relationship:
Configure the first relationship for D_PRODUCT as:
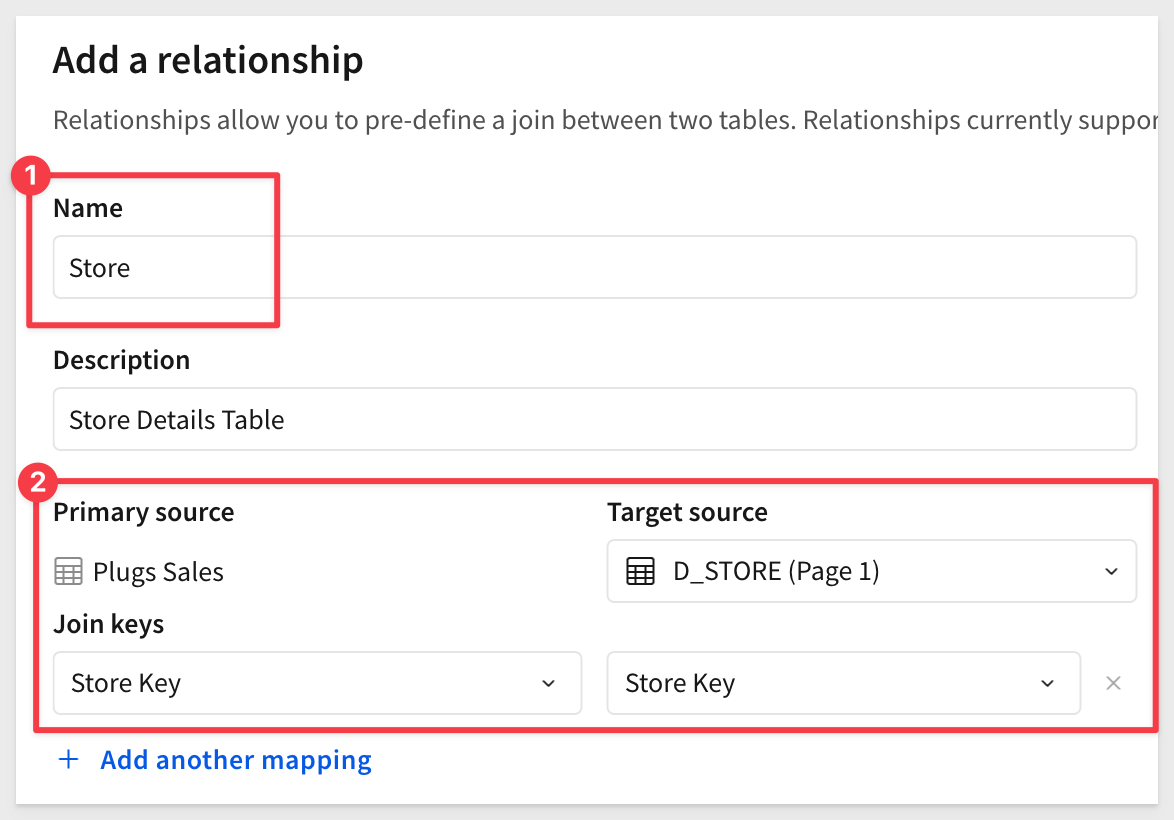
Repeat the process to add D_STORE as another relationship:
We now have two relationships, which can be edited by clicking on the pencil icon:

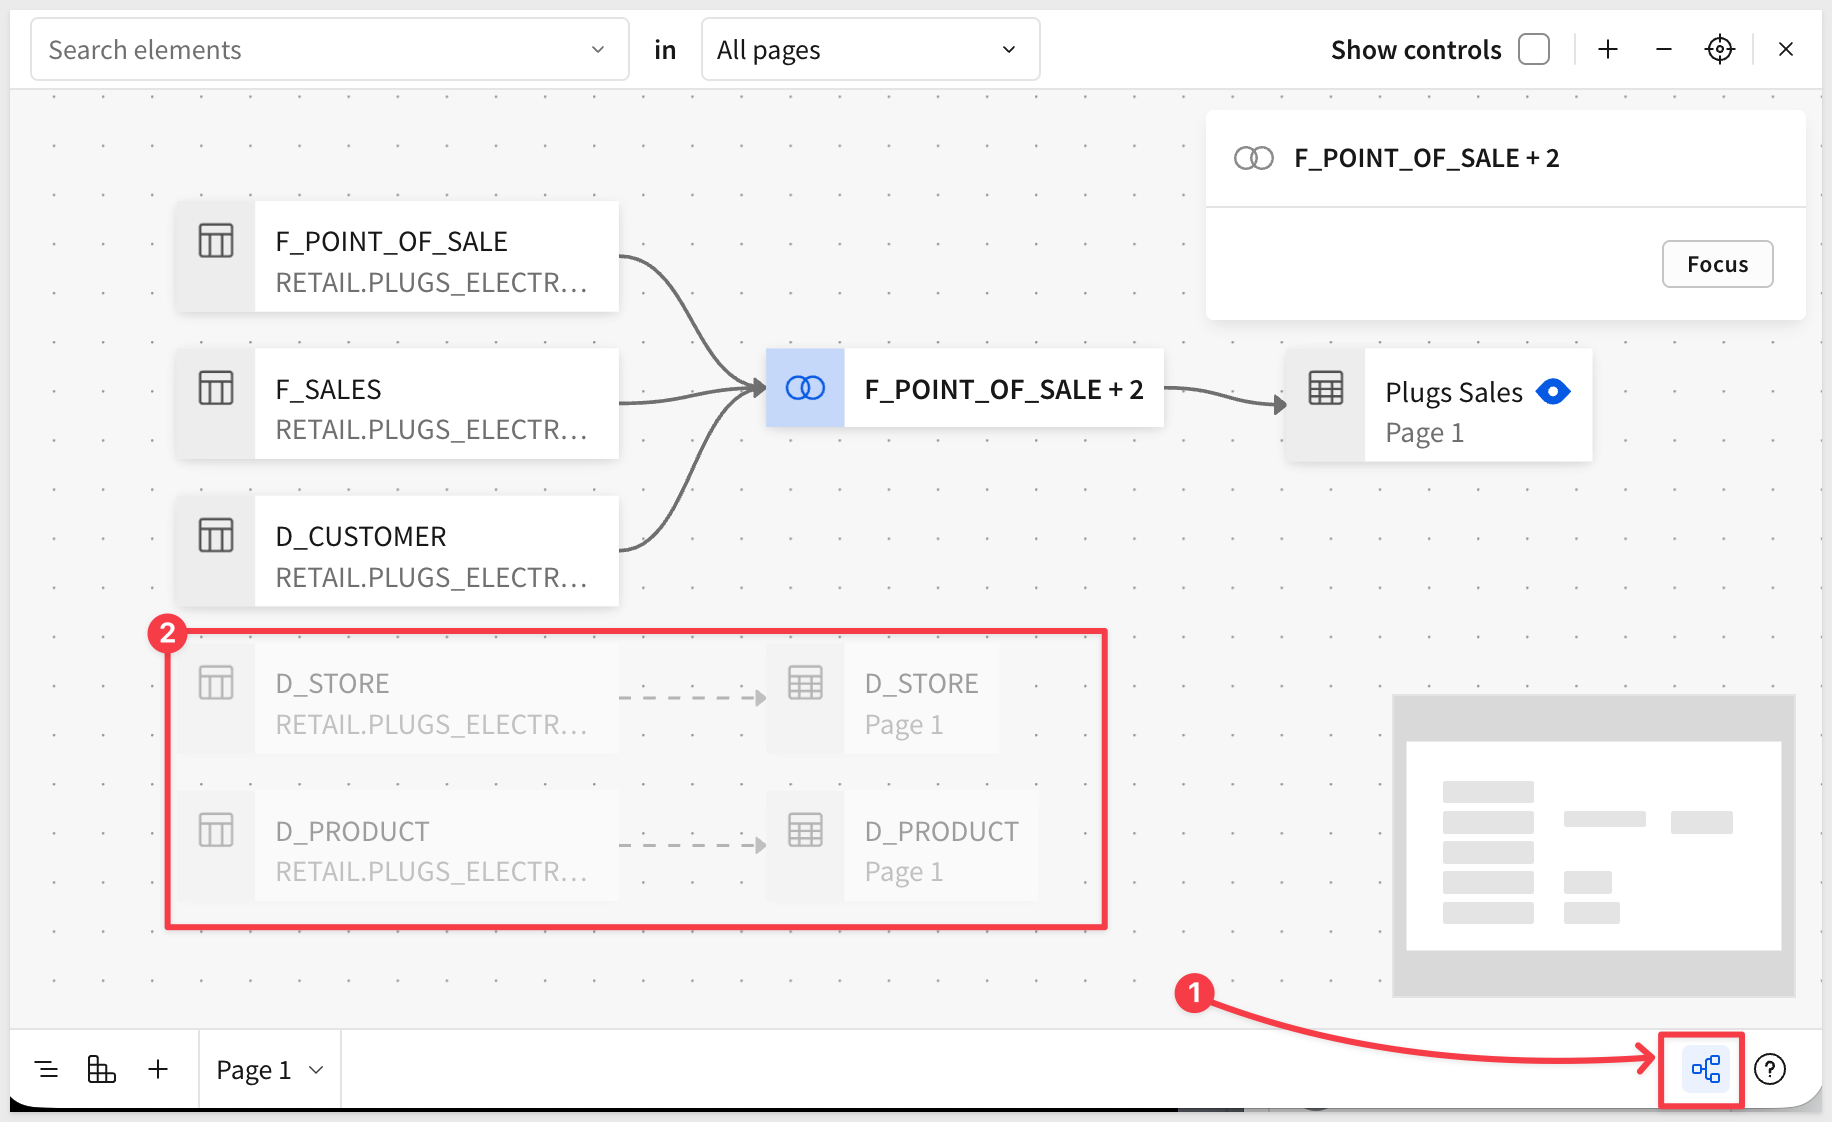
We can access the Entity Relationship Diagram (ERD) as shown:
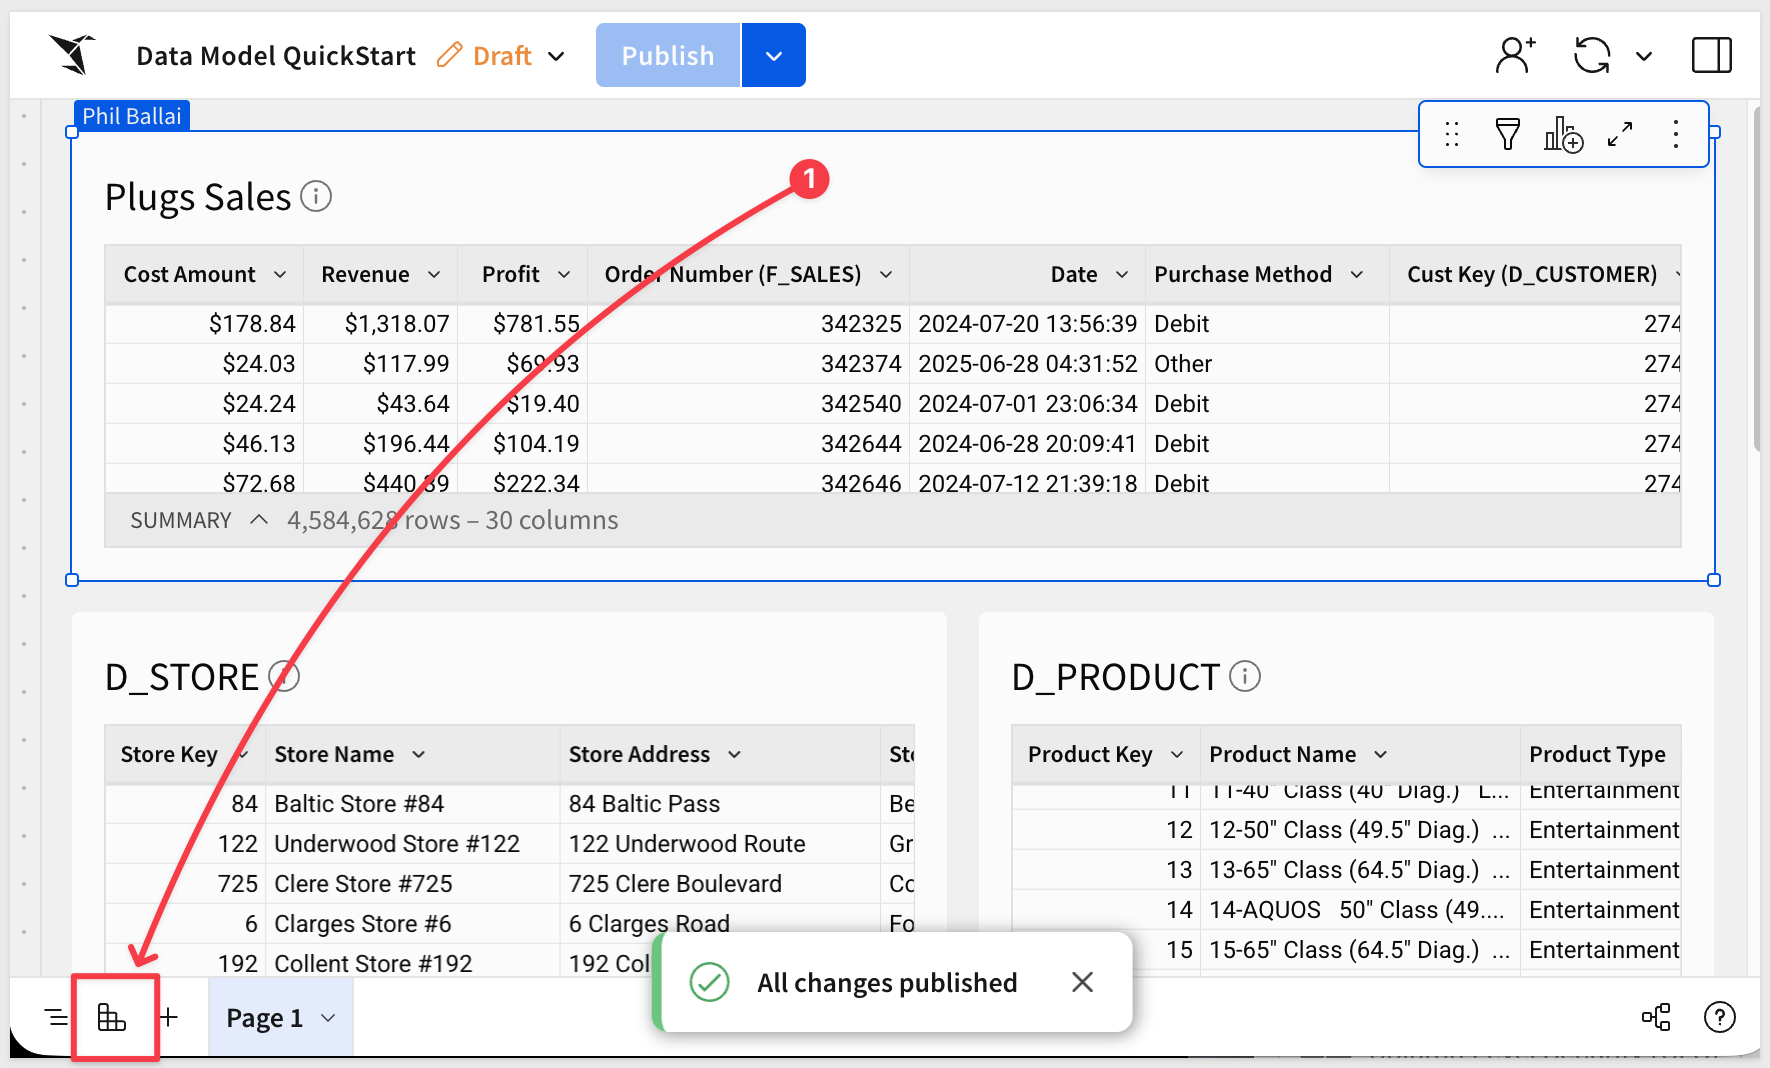
Using the ERD, we can create more relationships, metrics, apply column security and materialization too.
For more information on the ERD, see Define relationships in data models
Click the ERD icon again to return to the data model.
If we look at the data model lineage, we see the two additional tables listed, but not part of any join:
Exit lineage and click Publish.
Now that we have a published data model, we can test to make sure join pruning is actually happening.
Duplicate the browser tab and click the  icon to return home.
Create a new workbook and add a new table to it.
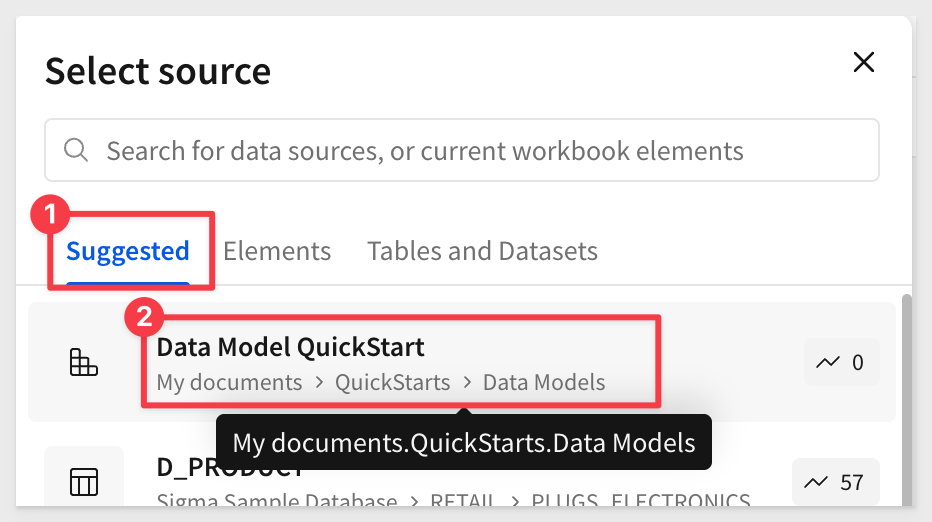
Select the Data Model QuickStart from the Suggested list, and then select the Plugs Sales table.
If it is not on your list, use Table and data models to navigate to where it's saved:
Here are a few things to note:
- 1: The manual joins we made to create
Plugs Salesare not visible to the user, but we are able to quickly return to the data model:

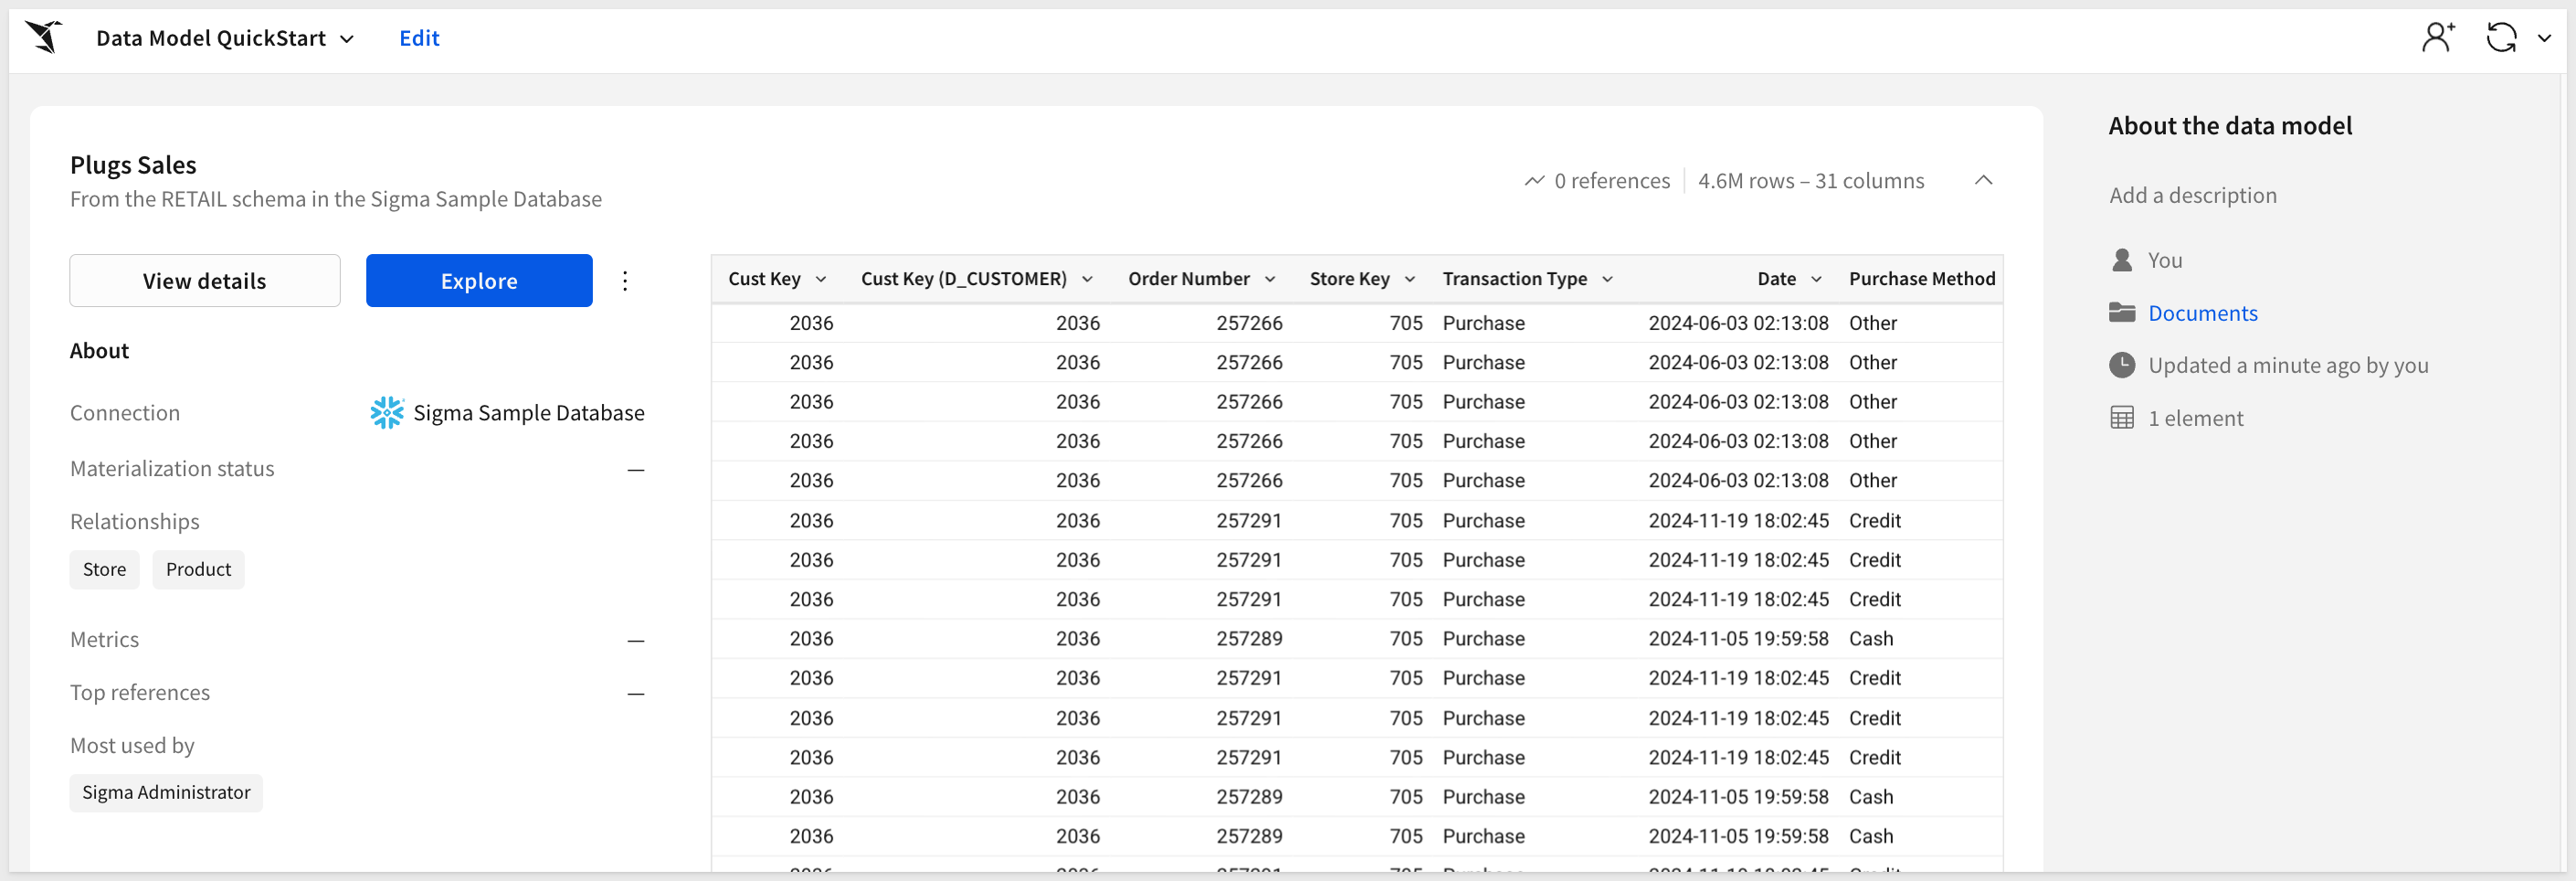
At this point, the data model page looks like this, but we're not done building yet, so we'll cover that more later.
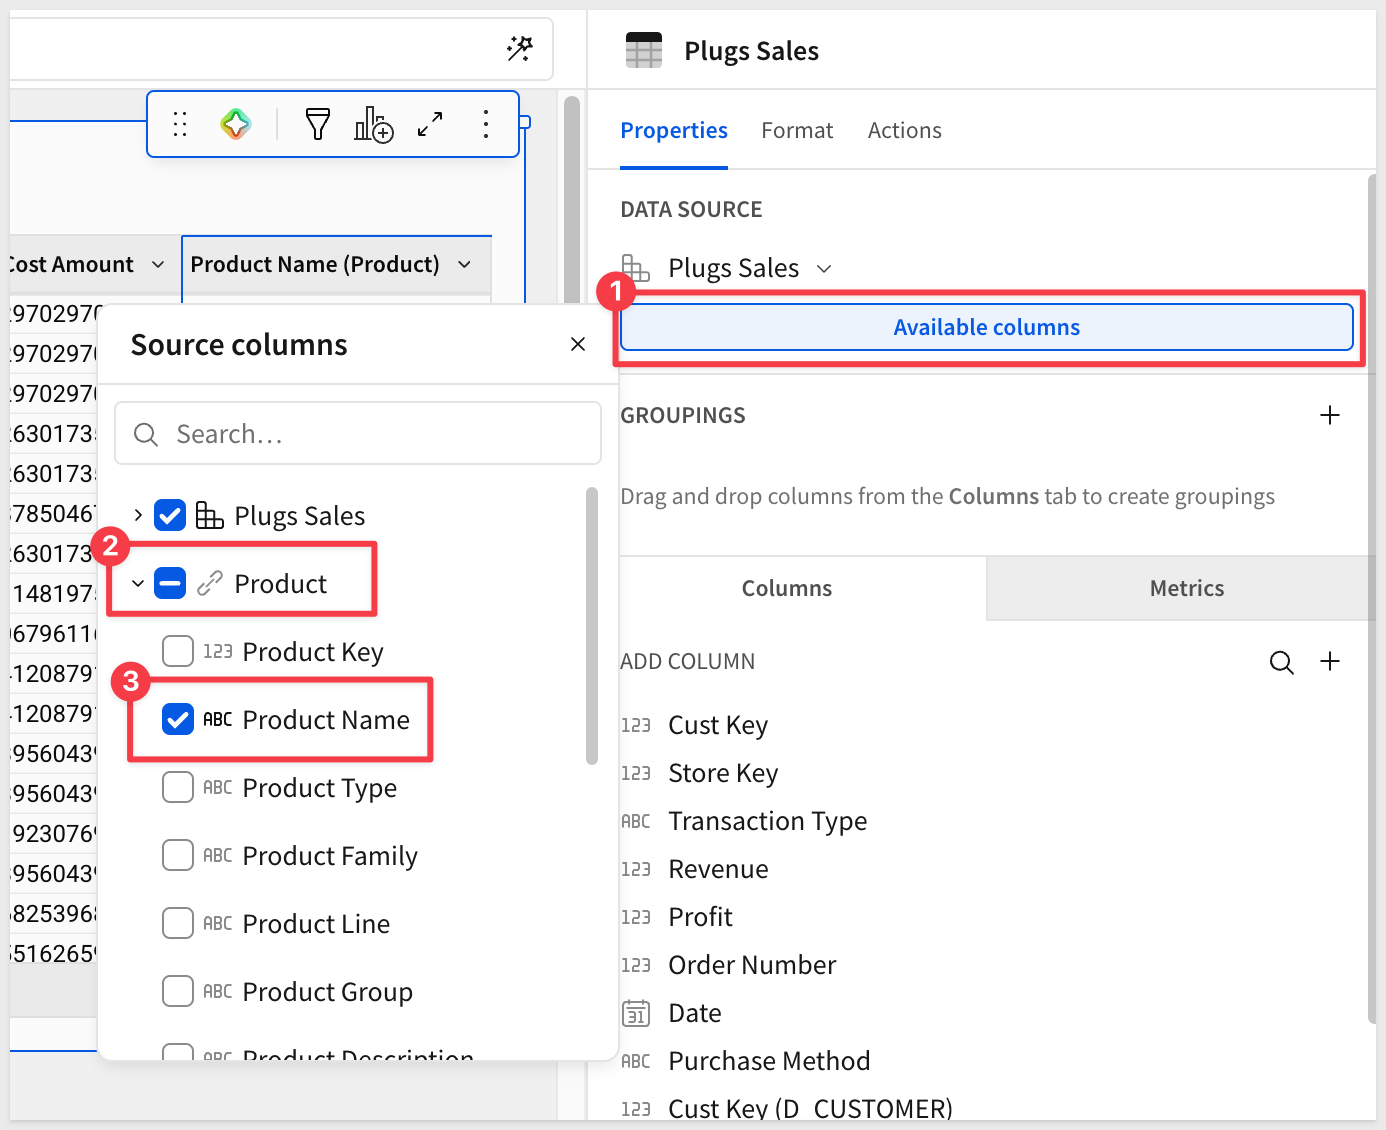
- 2: The two "extra" tables are present in the source column list, but no columns are selected from either table:
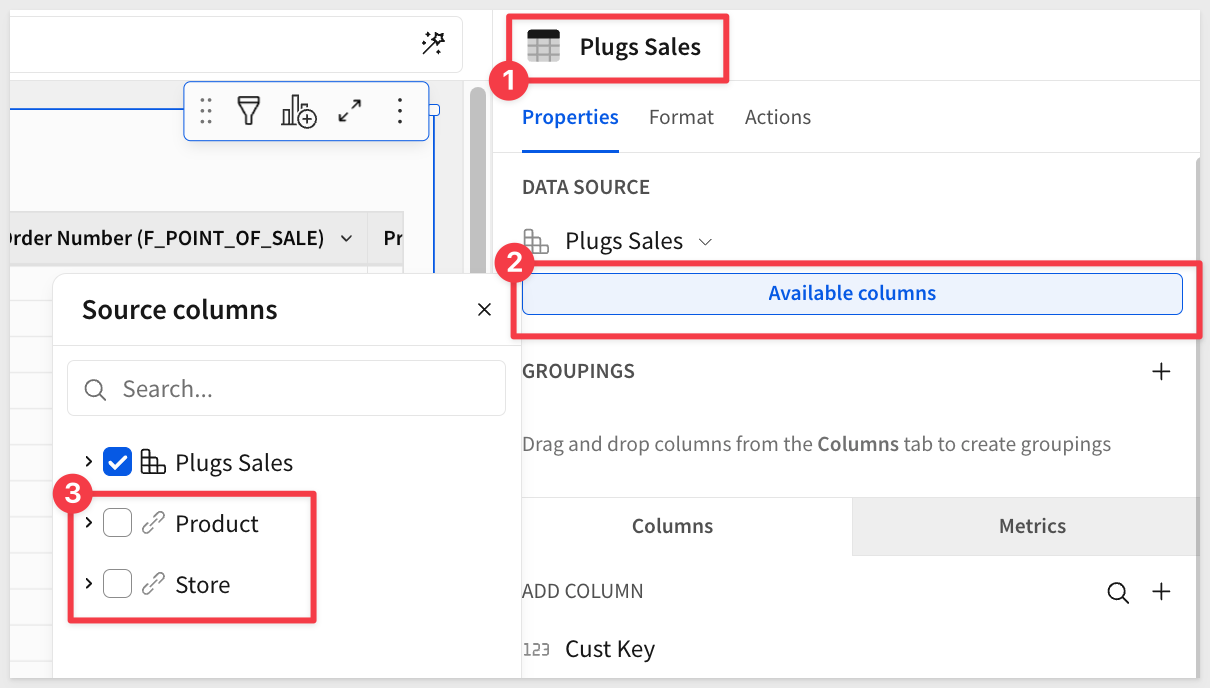
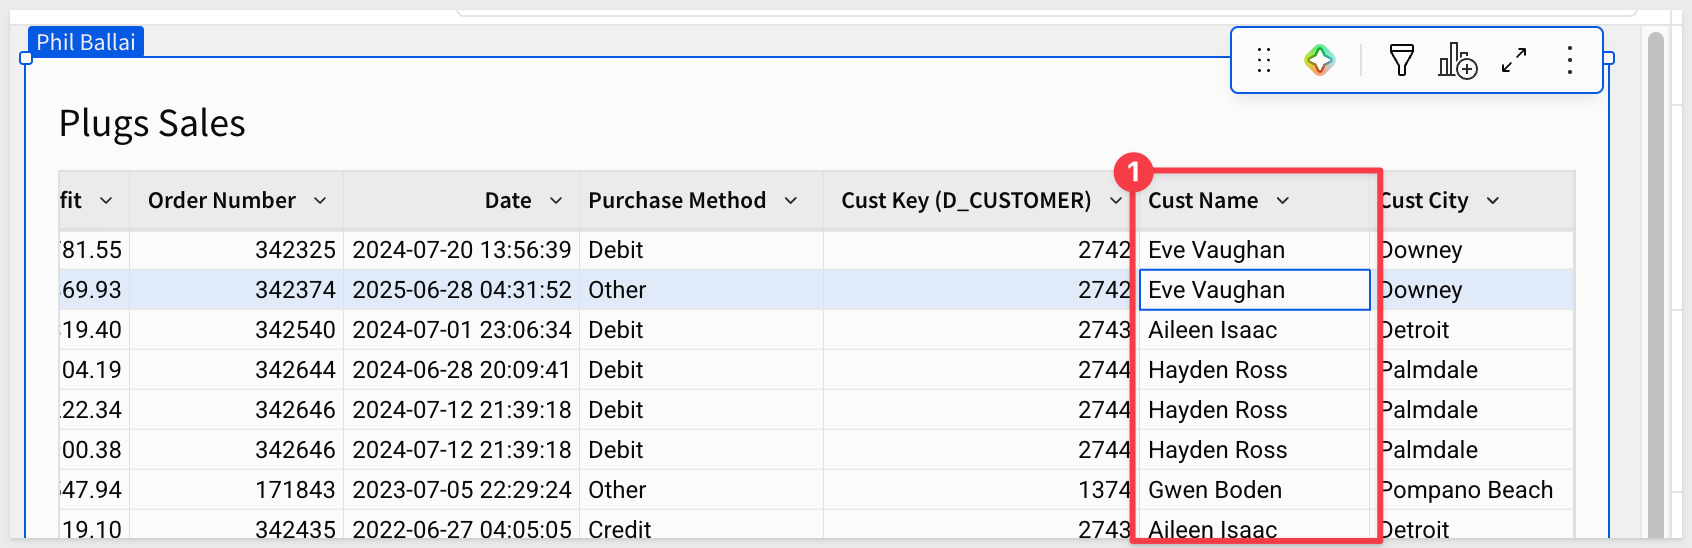
- 3: The
Cust Namecolumn is present in our table. This is against the use case policy described earlier and we'll need to fix it. Hiding the column is not sufficient and we will correct this shortly:
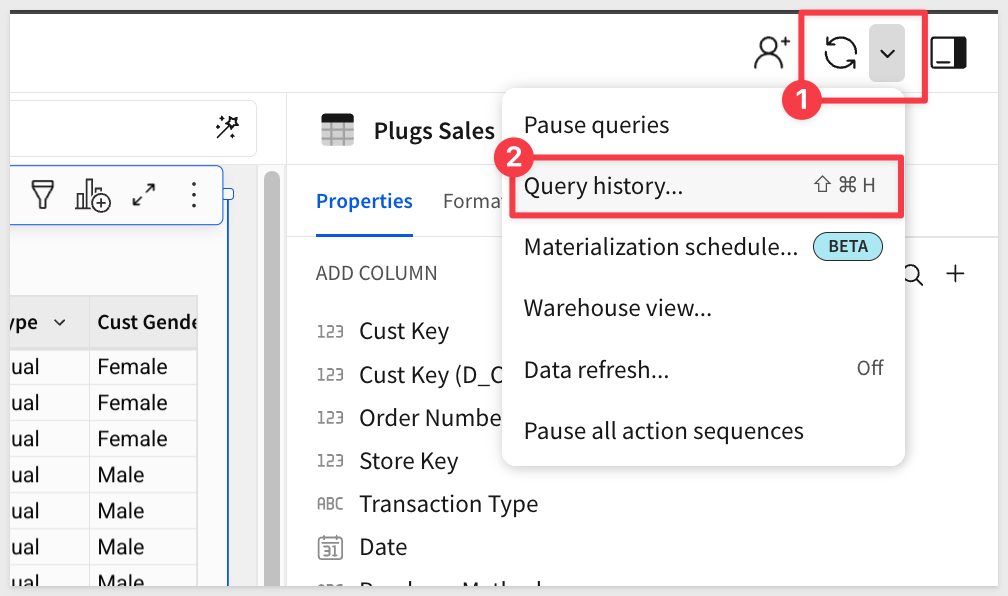
Query history
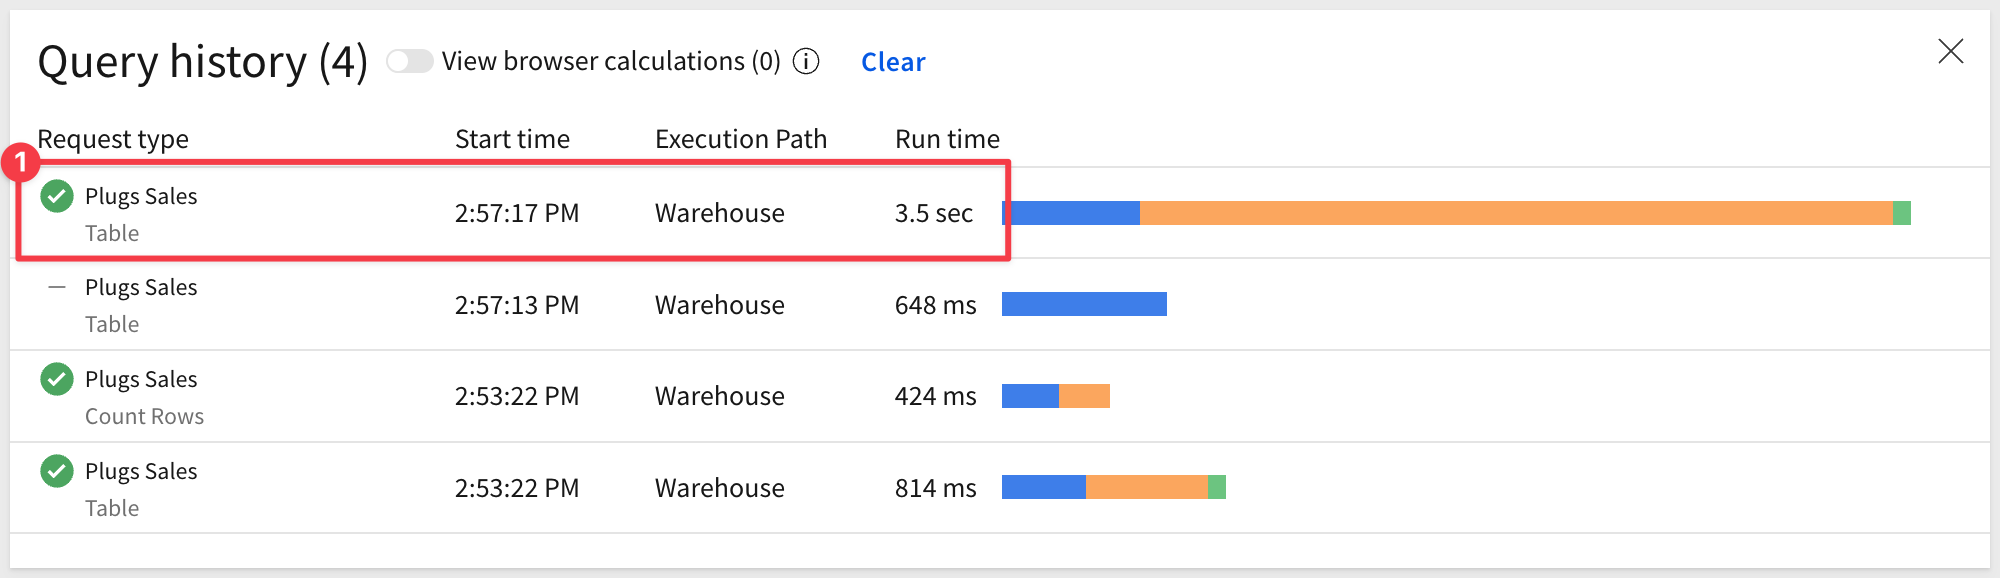
Sigma automatically generates SQL to retrieve data from the warehouse. We can access that by clicking on the Query History icon as shown:
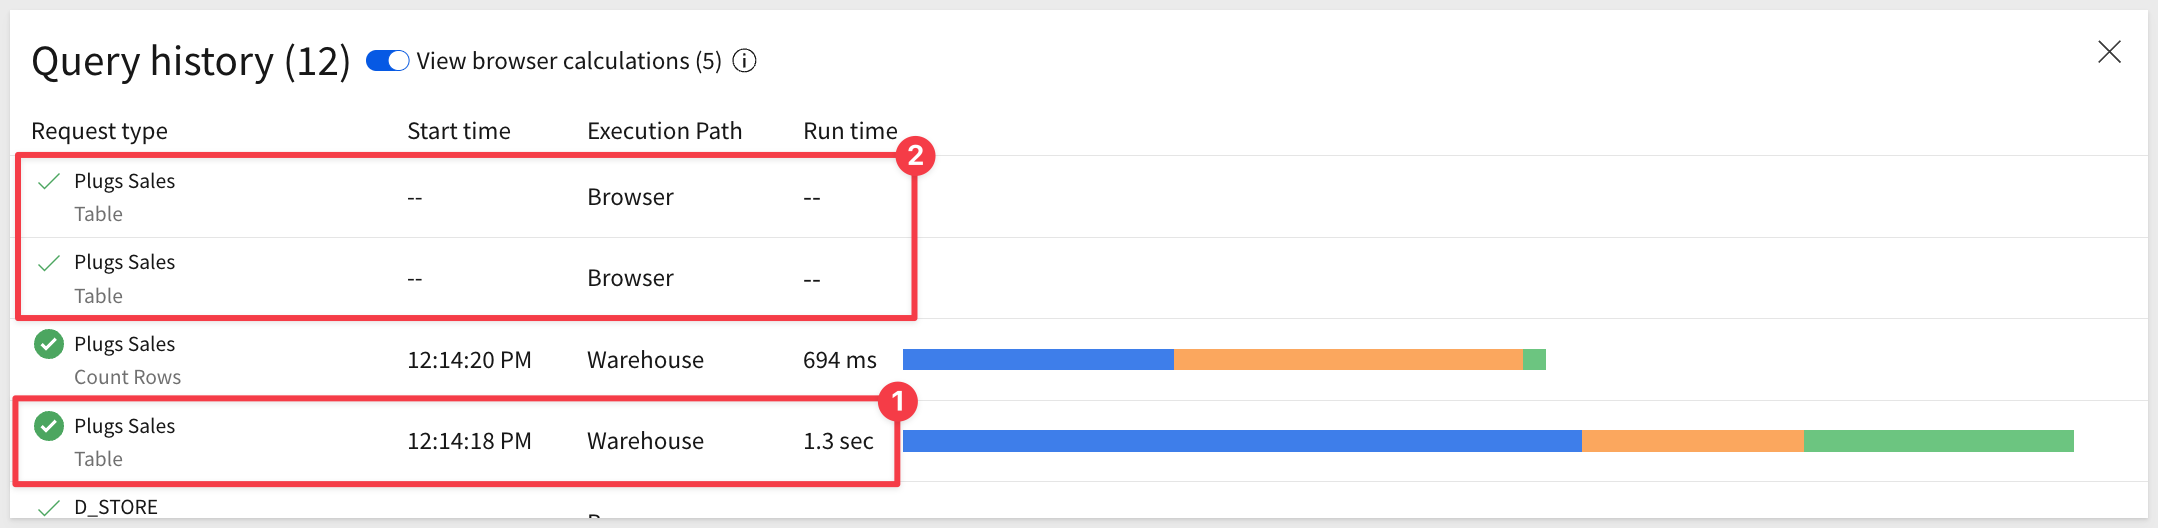
In our case, the page was just loaded so there are only two entries on the list. The second one is the table data being fetched from the warehouse cache. It came from the cache because we had accessed it recently, so it was still stored.
Our 4.5-million-record table loaded in just 1.5 seconds! Additionally, there were two more requests that did not require a call back to the warehouse so those were handled in the browser:
To read more about how Sigma optimizes data operations, see Sigma's Query Engine
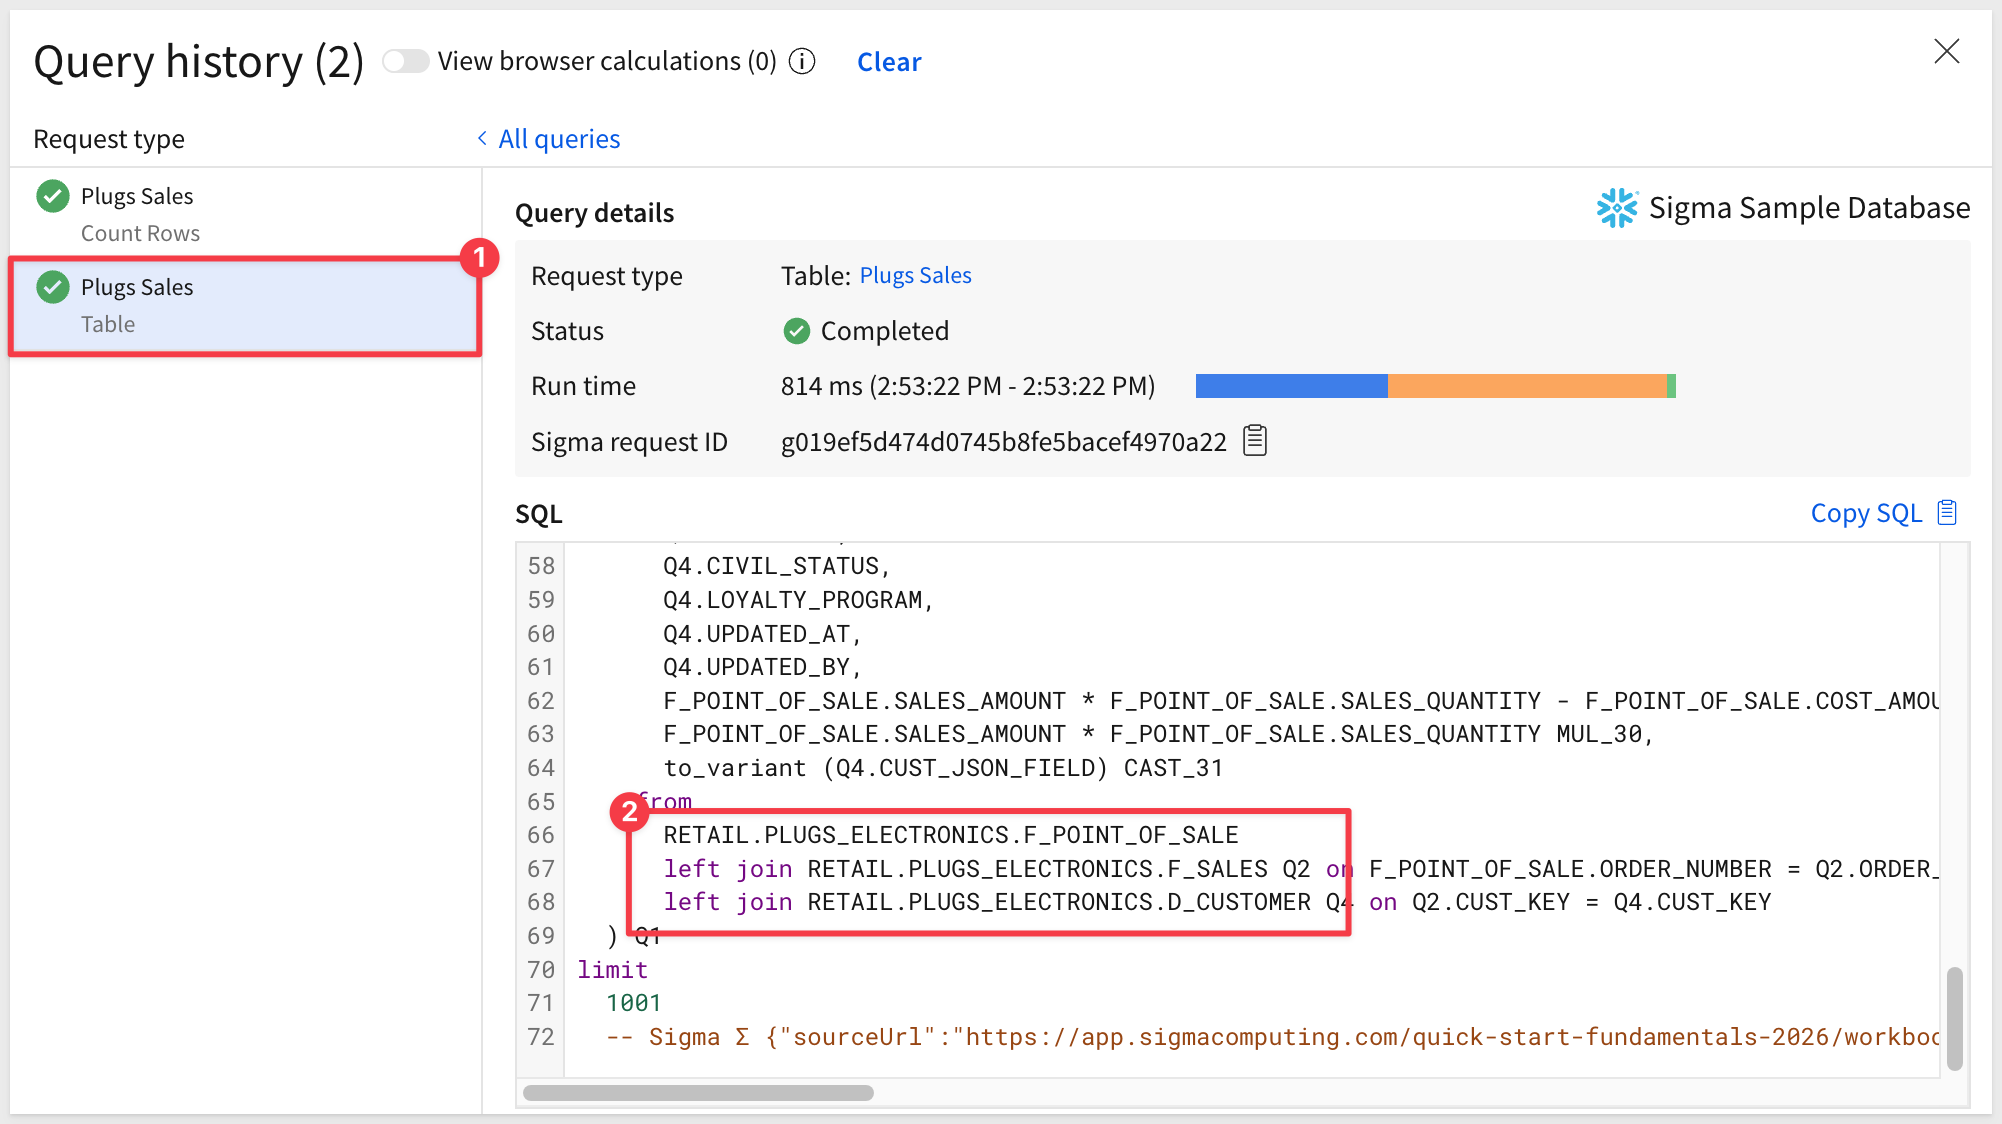
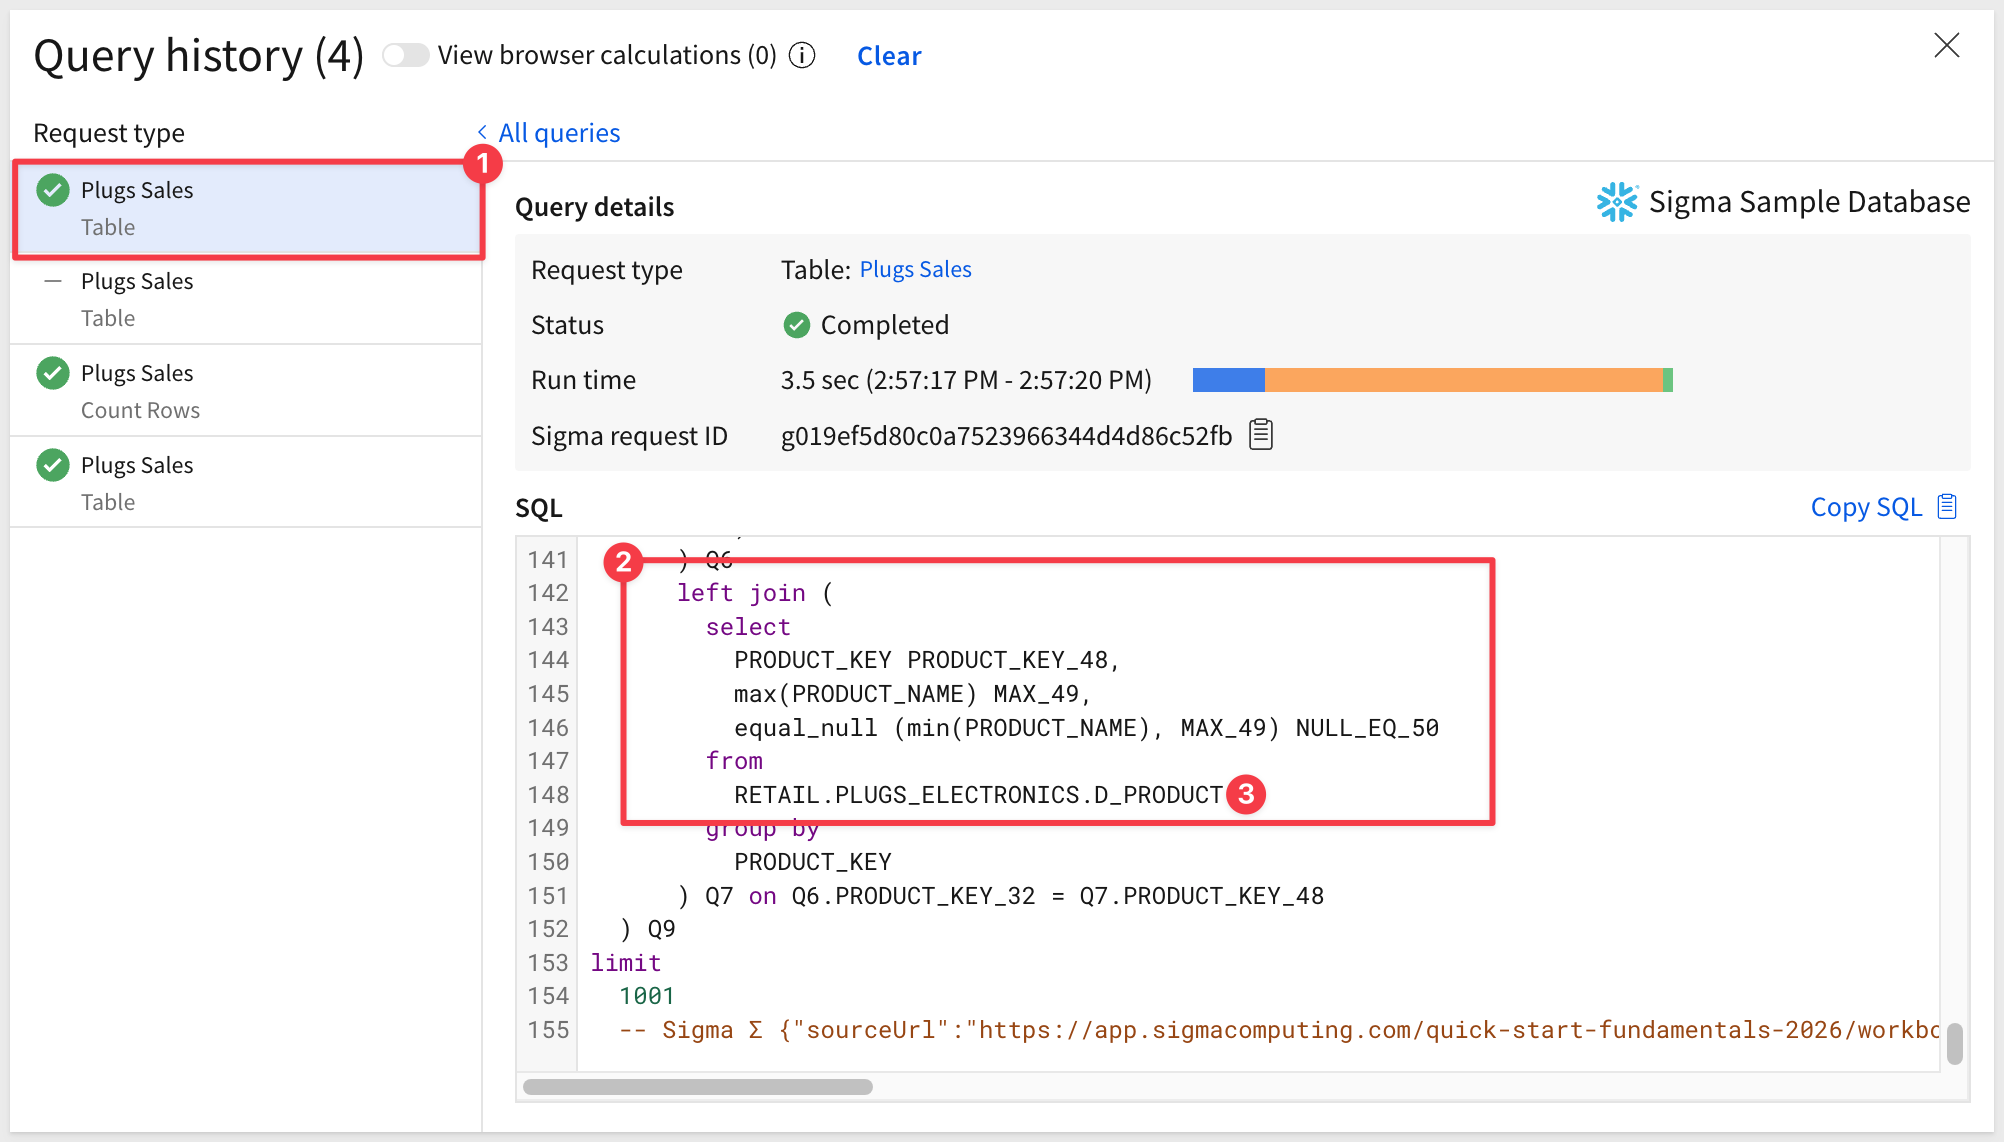
If we click into the table request, we can scroll down in the SQL code to see that only the three tables that were manually joined are present. The other two tables (D_STORE and D_PRODUCT) are not present (i.e., pruned).
Close query history and reselect the Plugs Sales table.
Now select any column from the Product table:
Reopen query history and click into the new entry:
Now we see the D_PRODUCT table is being joined but the D_STORE table is still not present:
Metrics are dynamic, reusable calculations tied to a specific data source. As such, metrics usually reference specific columns. You can create a metric to provide reliable and efficient aggregate calculations, abstracting complex formulas away from business users.
When metrics are added at the data model level, they can be easily added on demand, in downstream workbooks. This ensures consistent logic across tables, visualizations, and pivot tables.
Return to the data model.
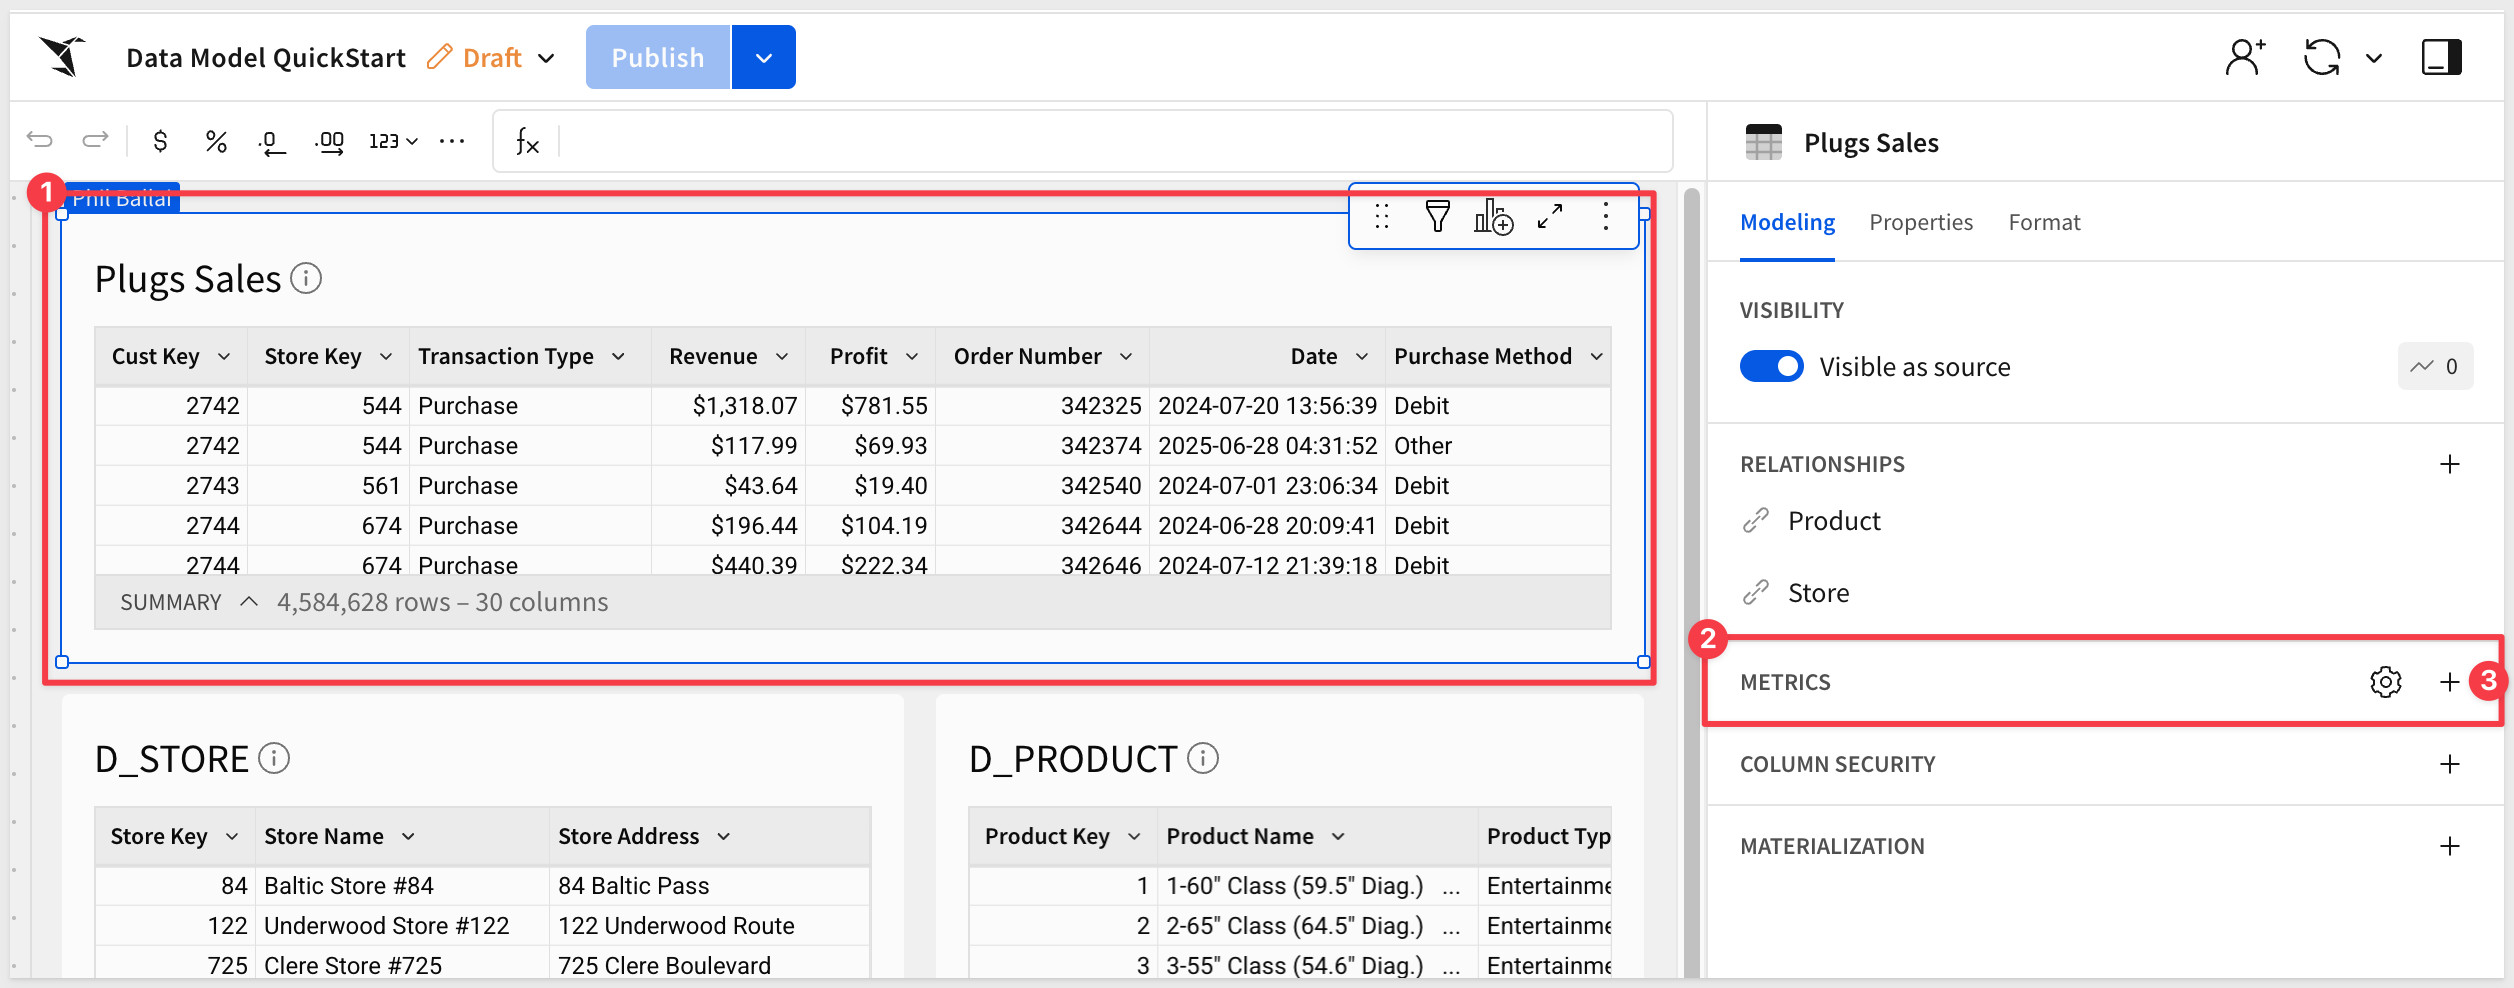
Click the Plugs Sales table.
For example, if we want to add a metric for Total Revenue, we click the + for METRICS in the Modeling section of the data model:
Configure the new metric as shown, using this formula:
Name:
Total Revenue
Formula:
Sum([Revenue])
Description:
Revenue for current year compared to previous
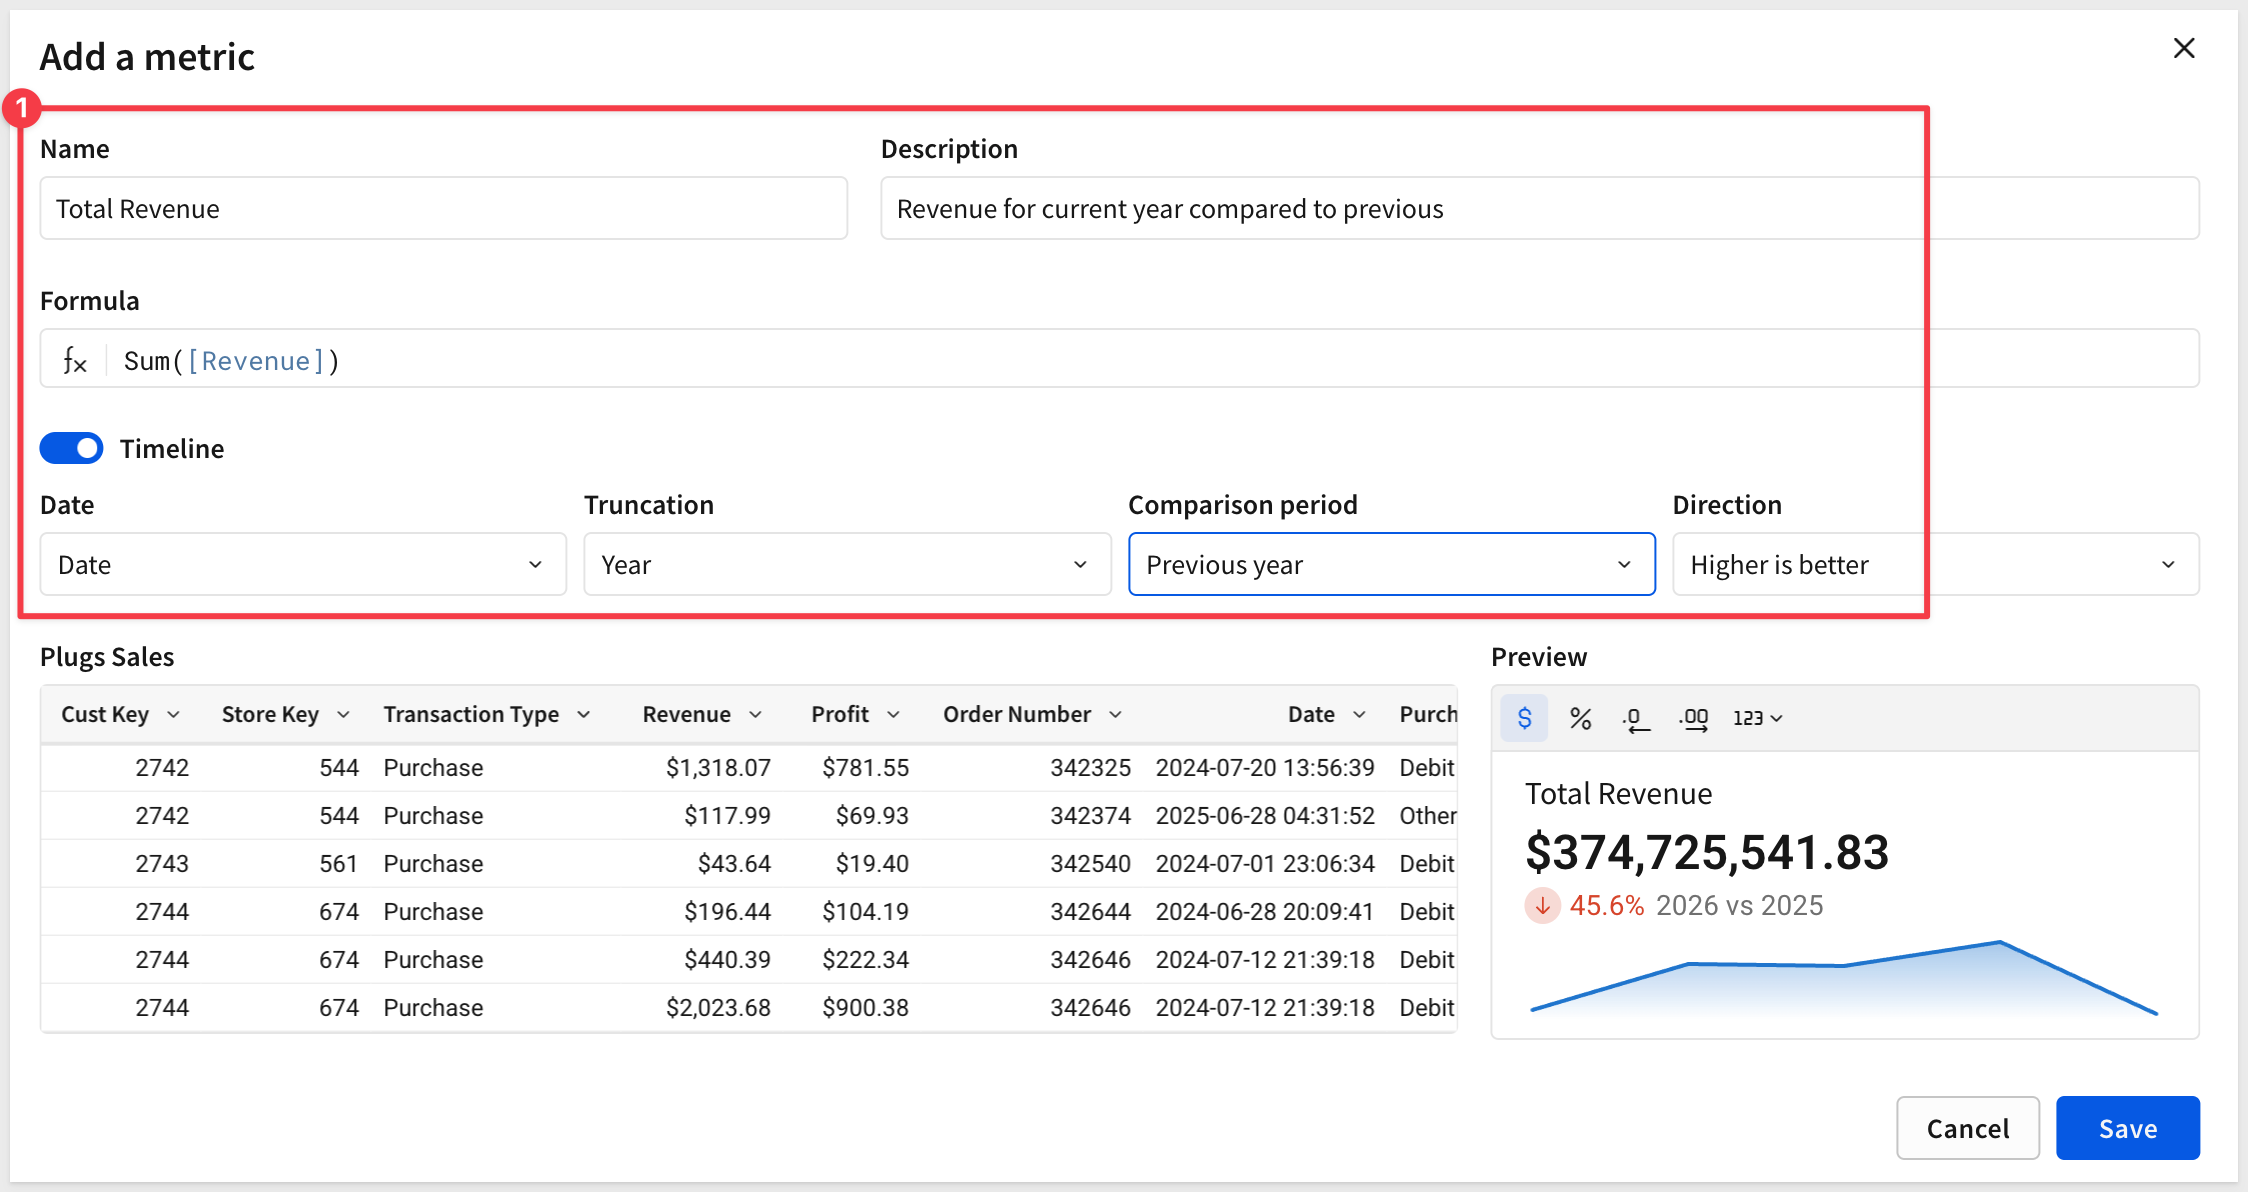
Save the new metric and click Publish.
The Timeline option enables a KPI-style chart in the Preview section of the data model landing page.
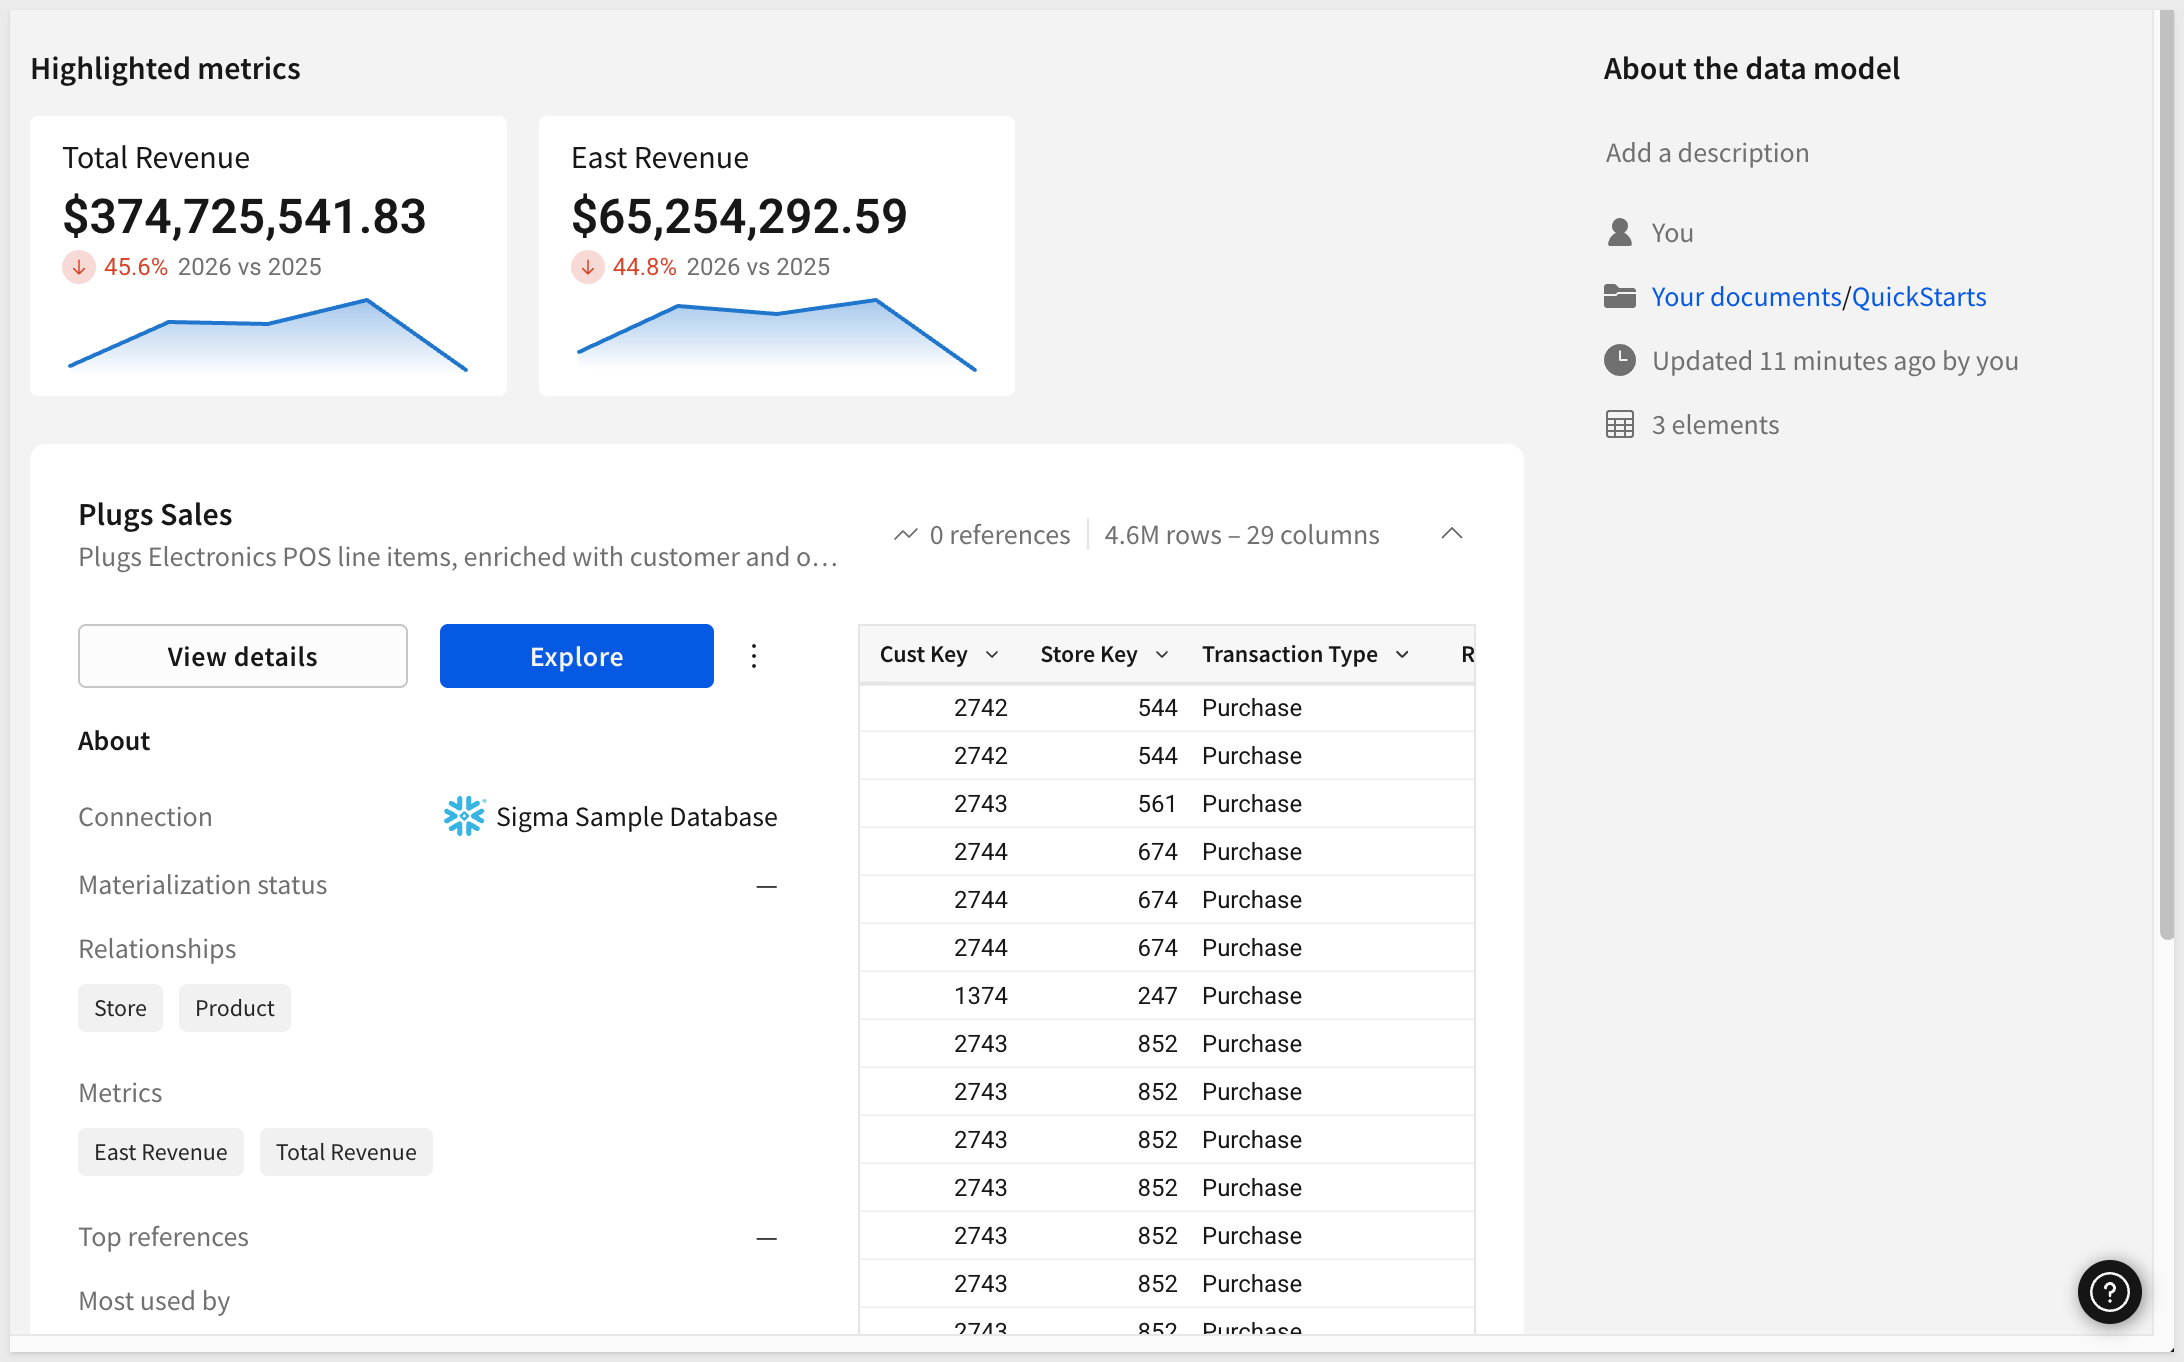
If we Go to the published version of the data model...:

...we see the new metric:
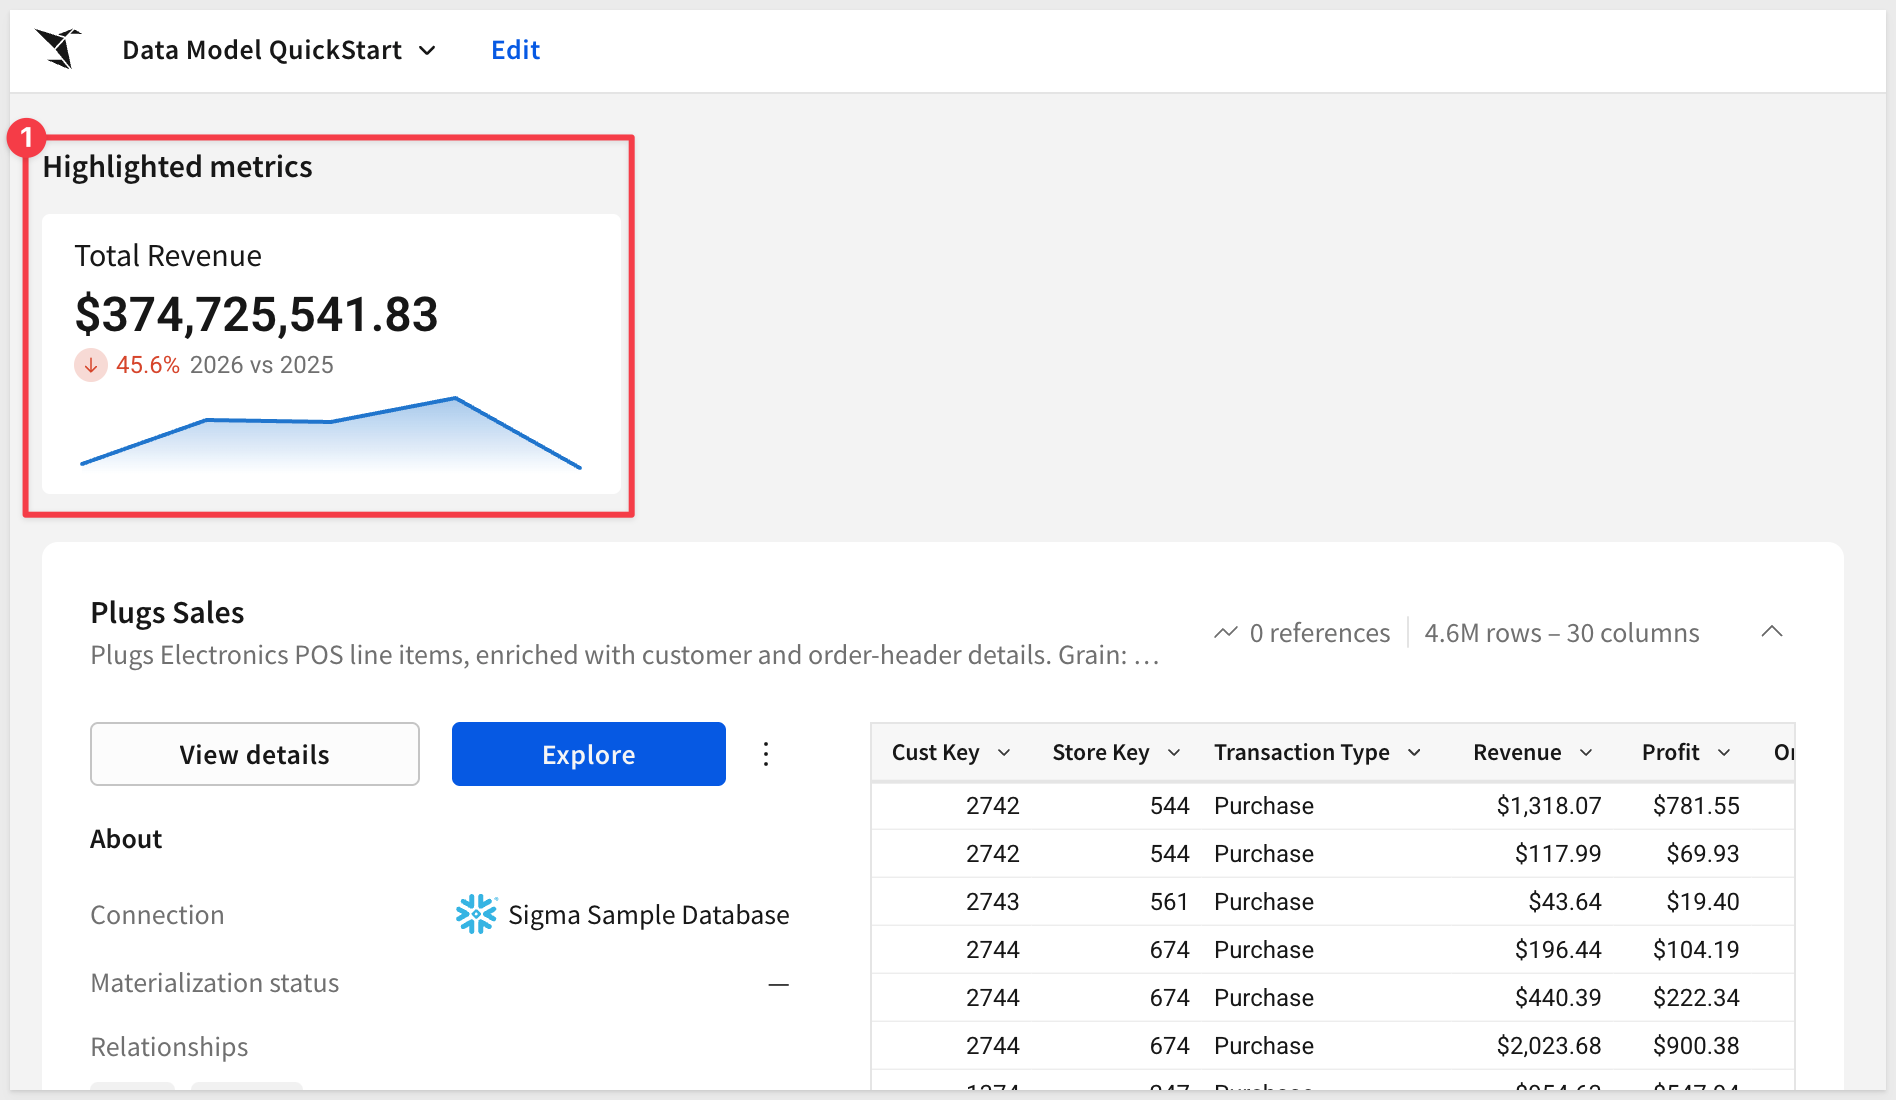
Click Edit to return to editing the data model.
Metrics with a formula-based filter
Formulas in Sigma are flexible and powerful. For example, we can use a formula in a metric that will return data for the East region only.
Select the Plugs Sales table again.
Add another metric to the data model and configure it using this formula:
Name:
East Revenue
Formula:
SumIf([Revenue], [Cust Region] = "East")
Description:
Sum of East revenue for the full year
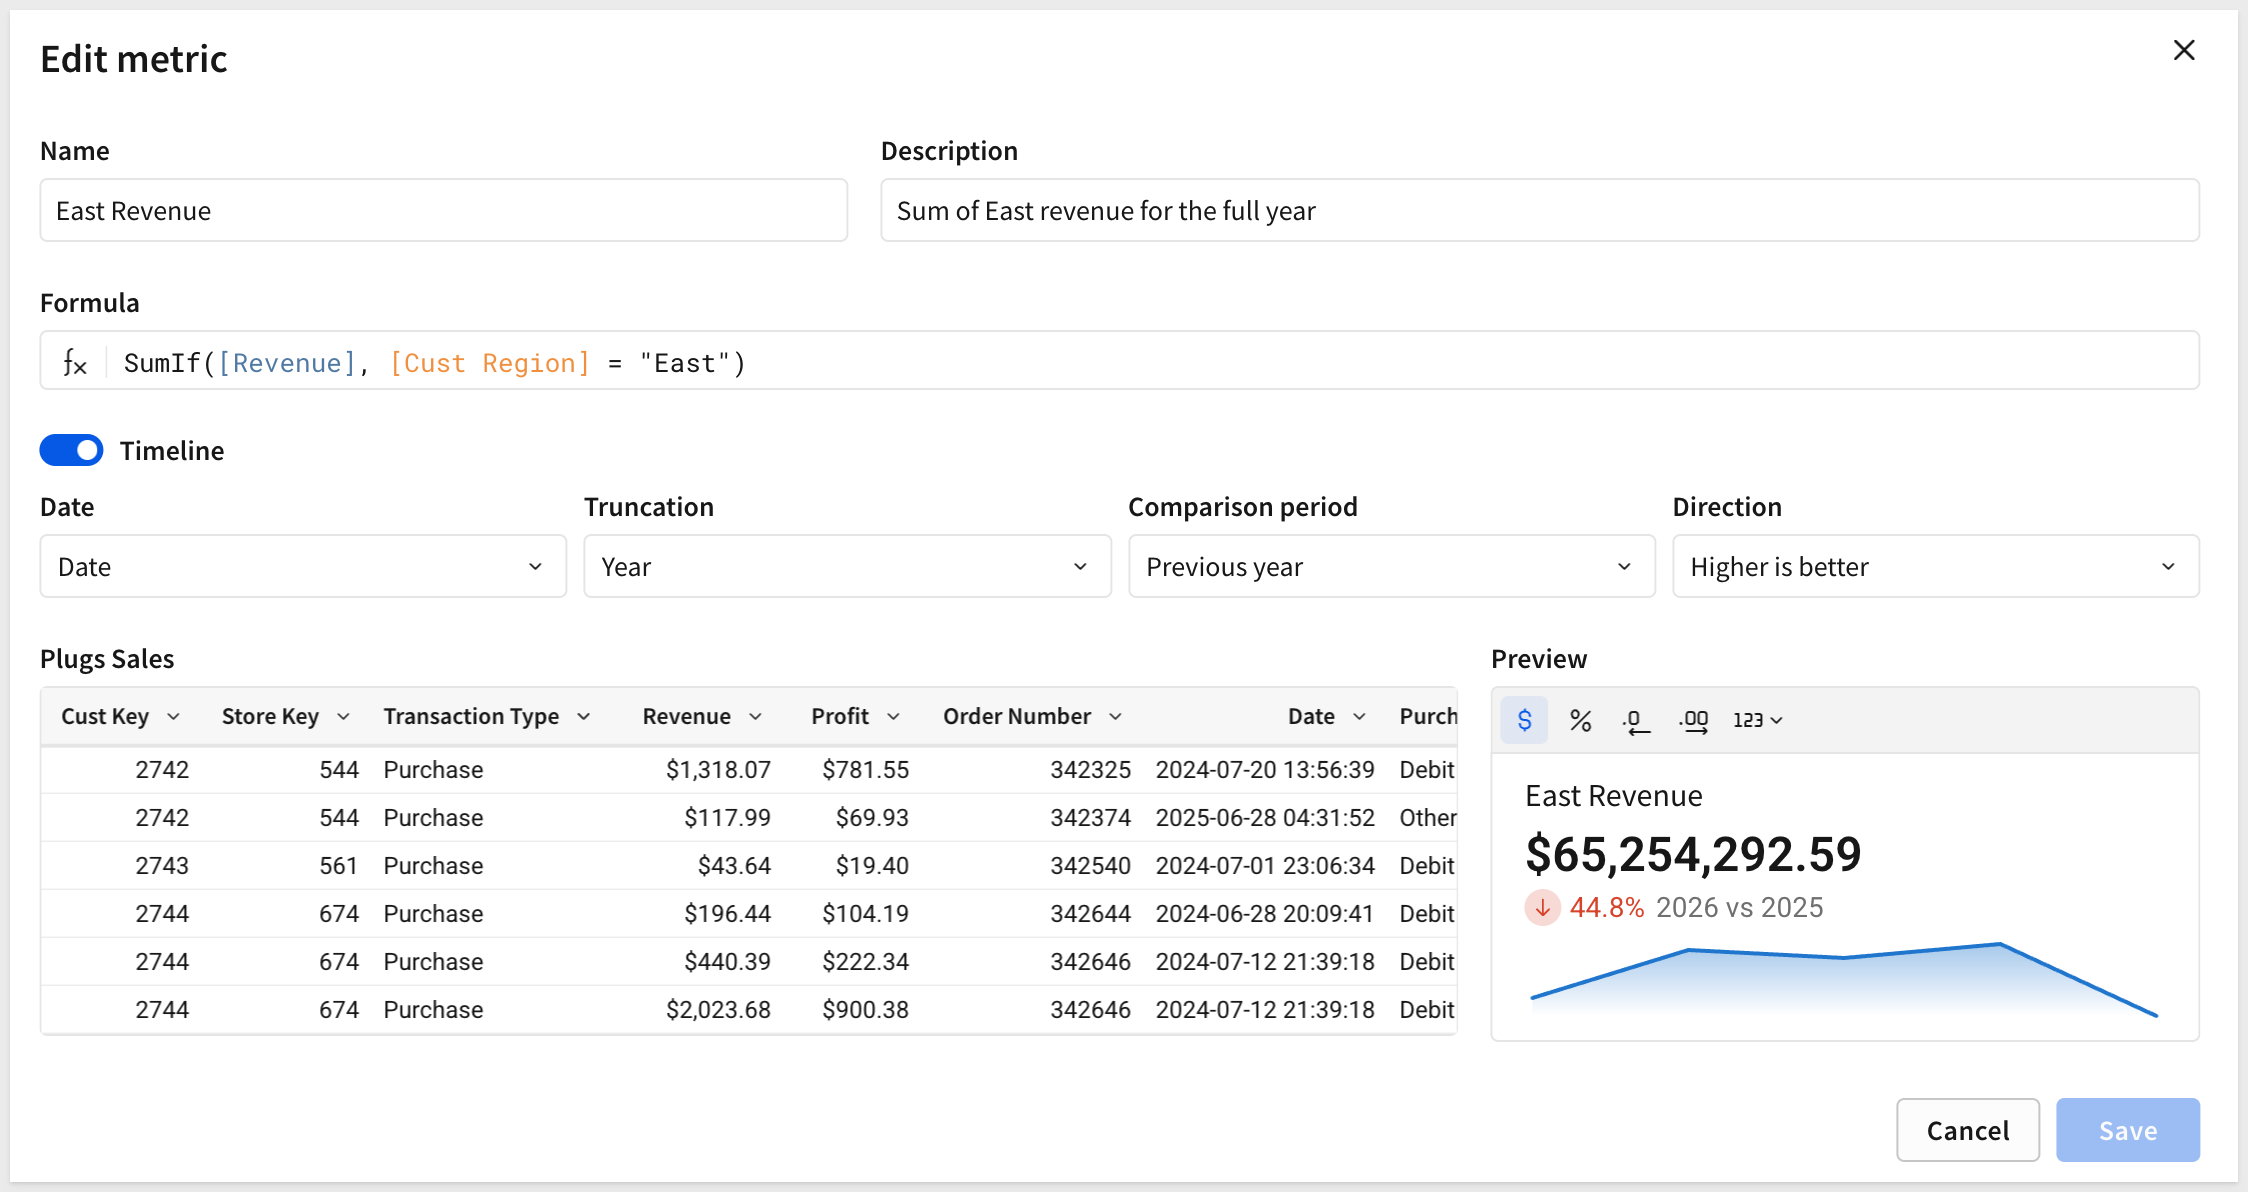
Click Publish.
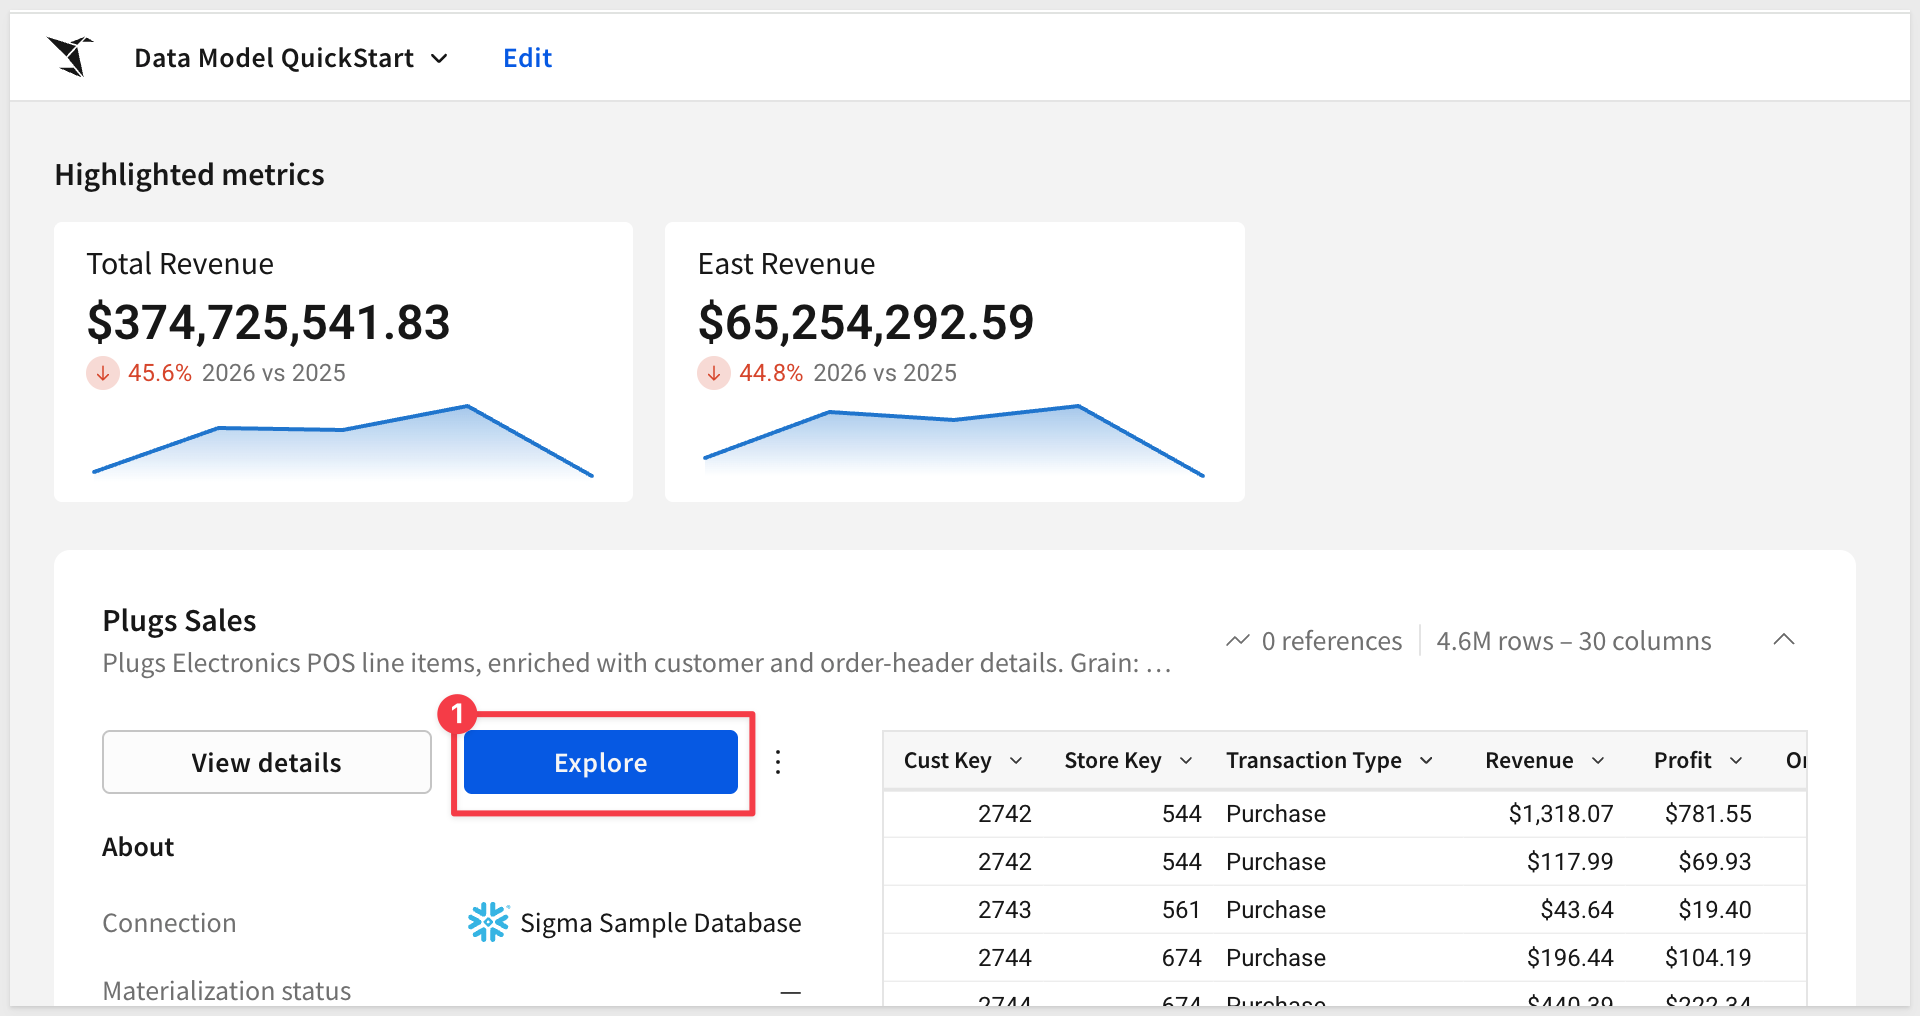
The new metric is added to the data model landing page:
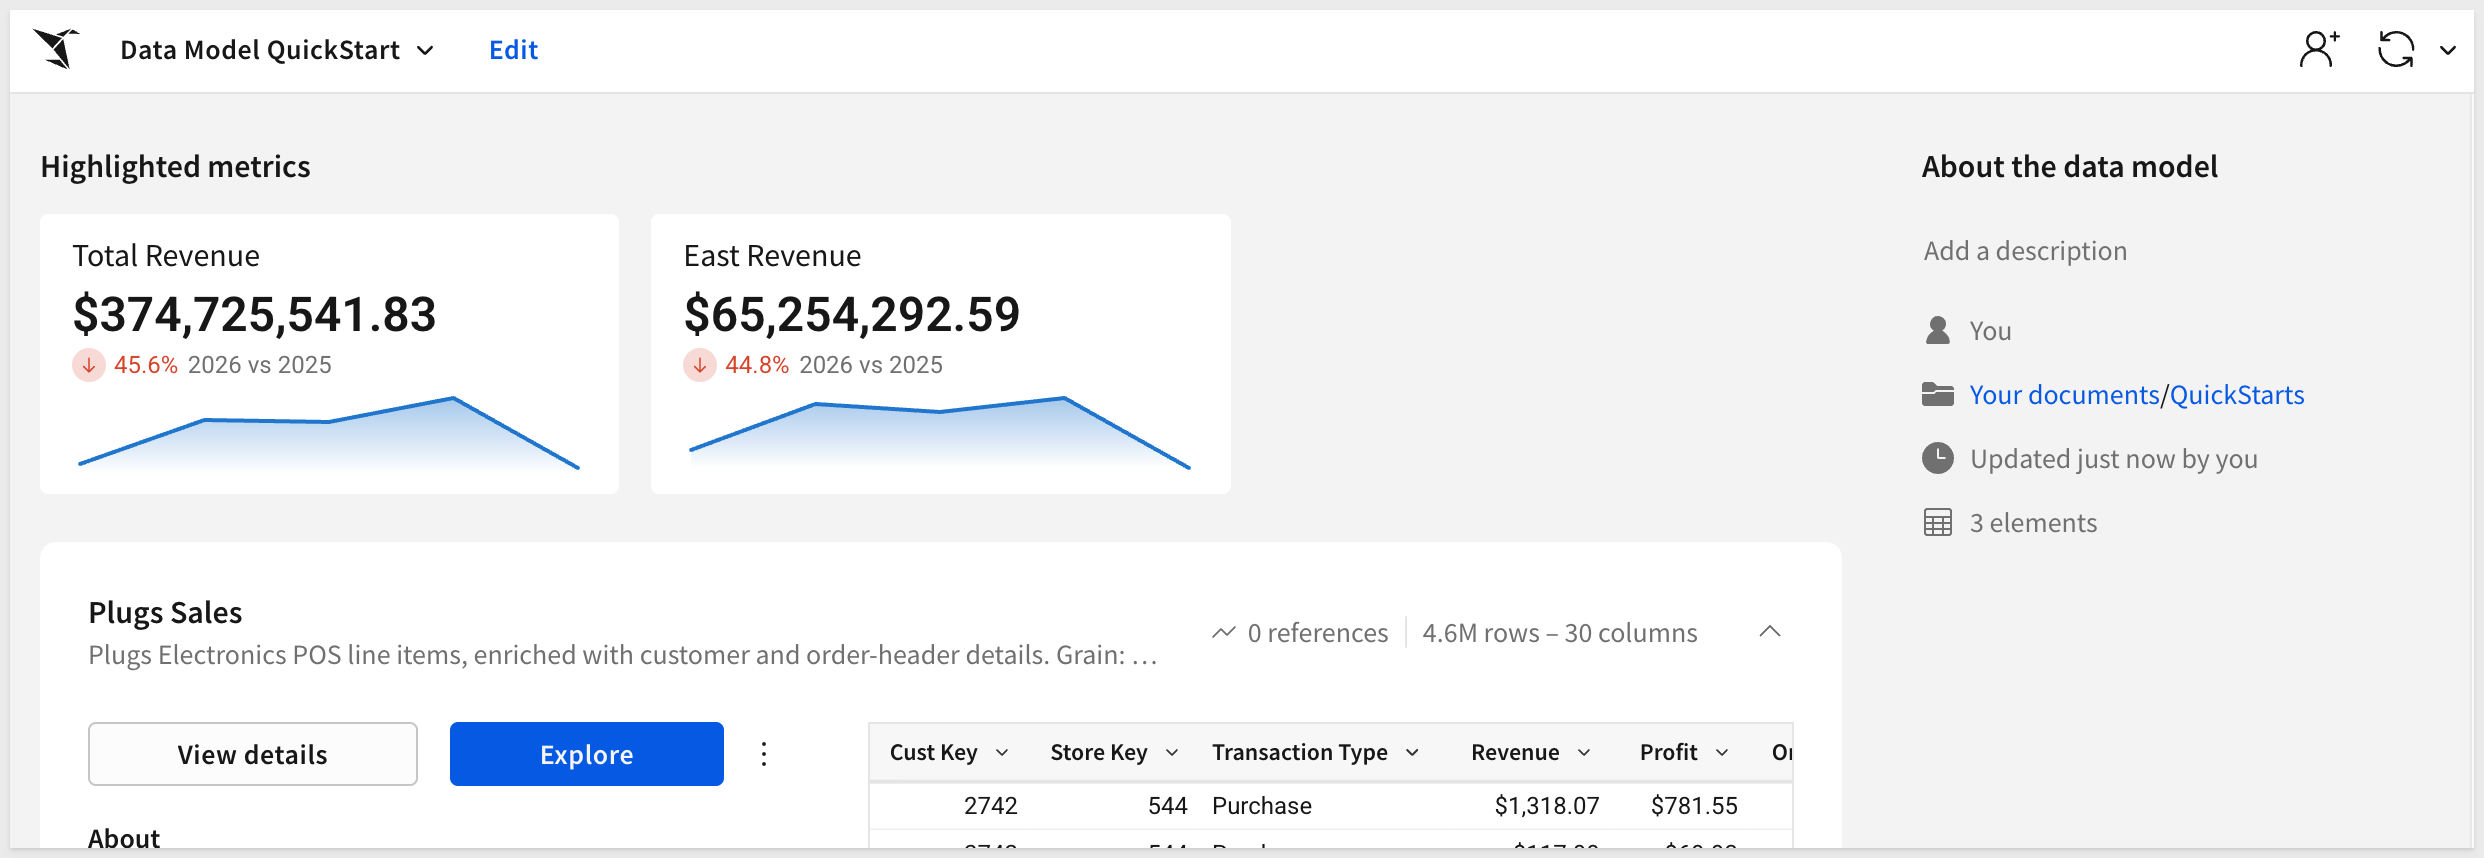
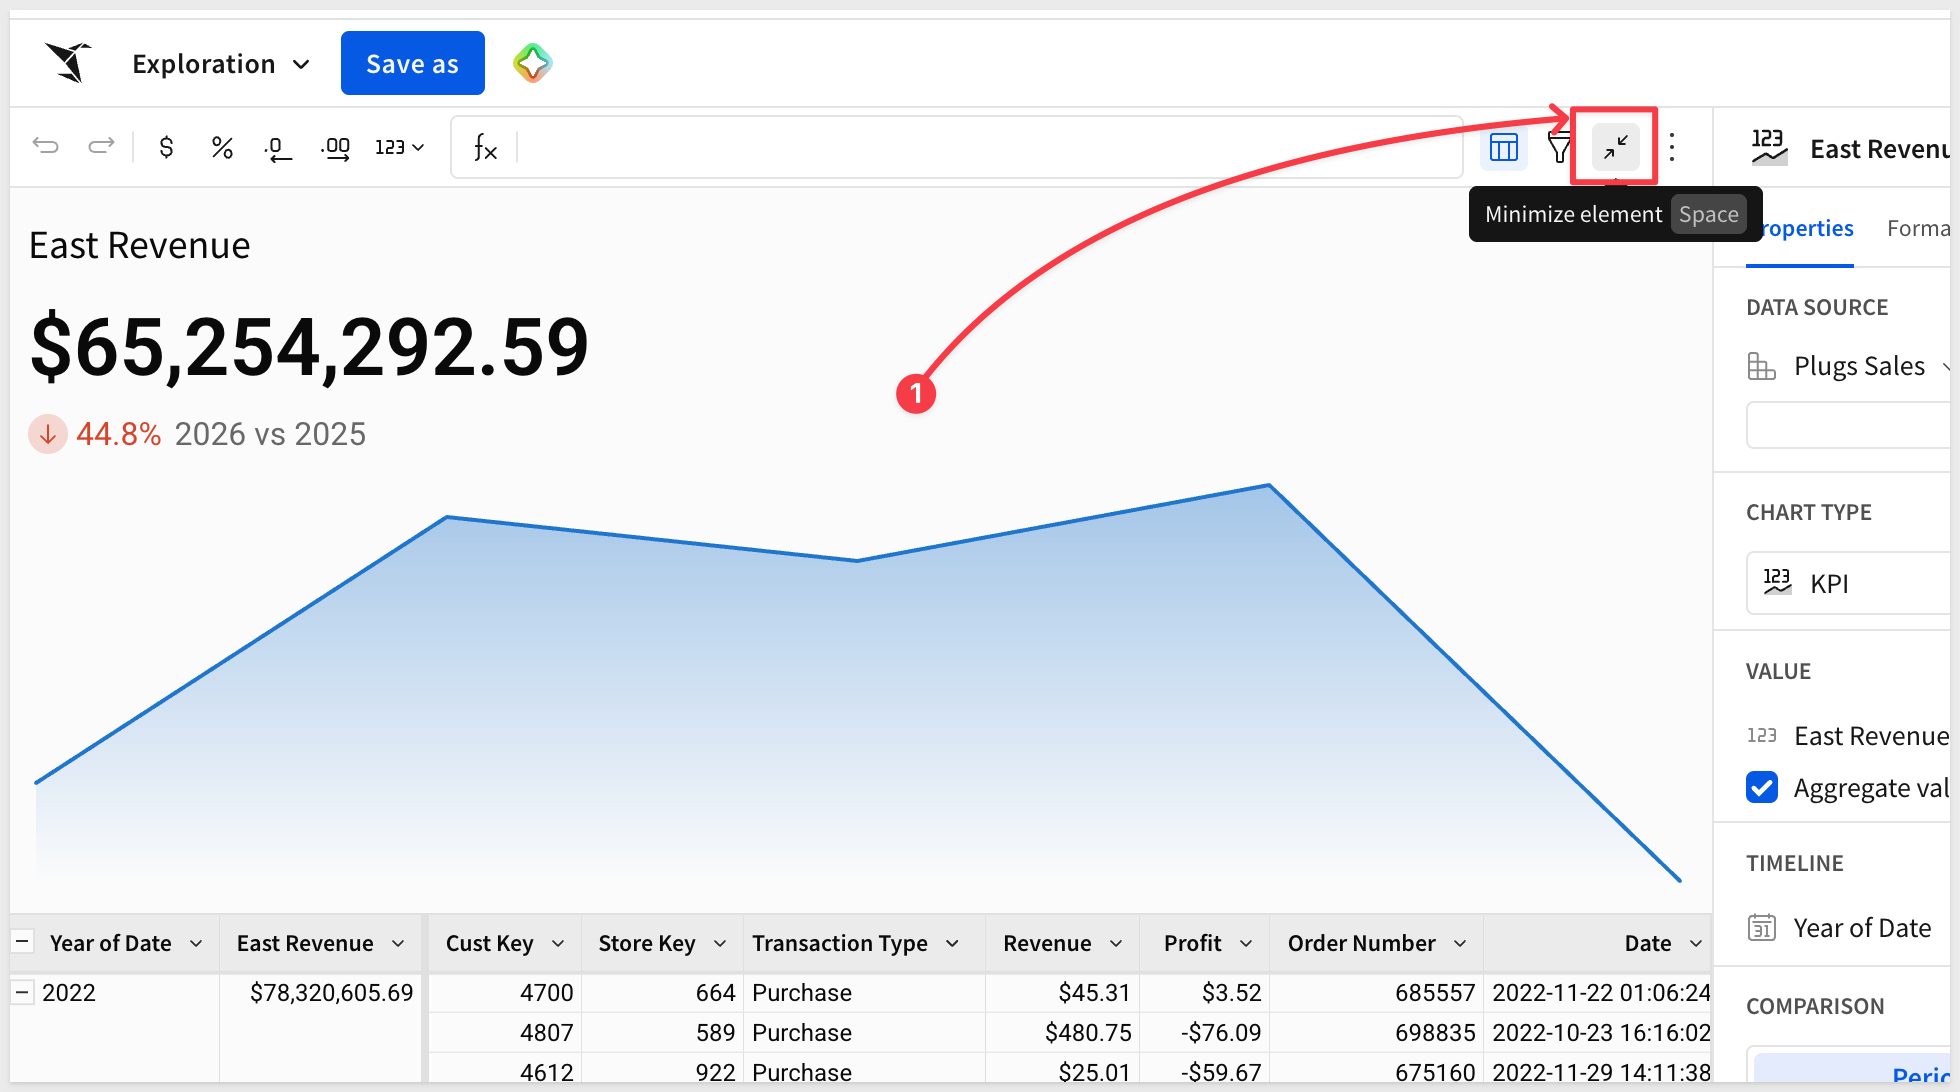
Note that we can click on the new metric (on the landing page) and it presents the option to Explore in workbook:
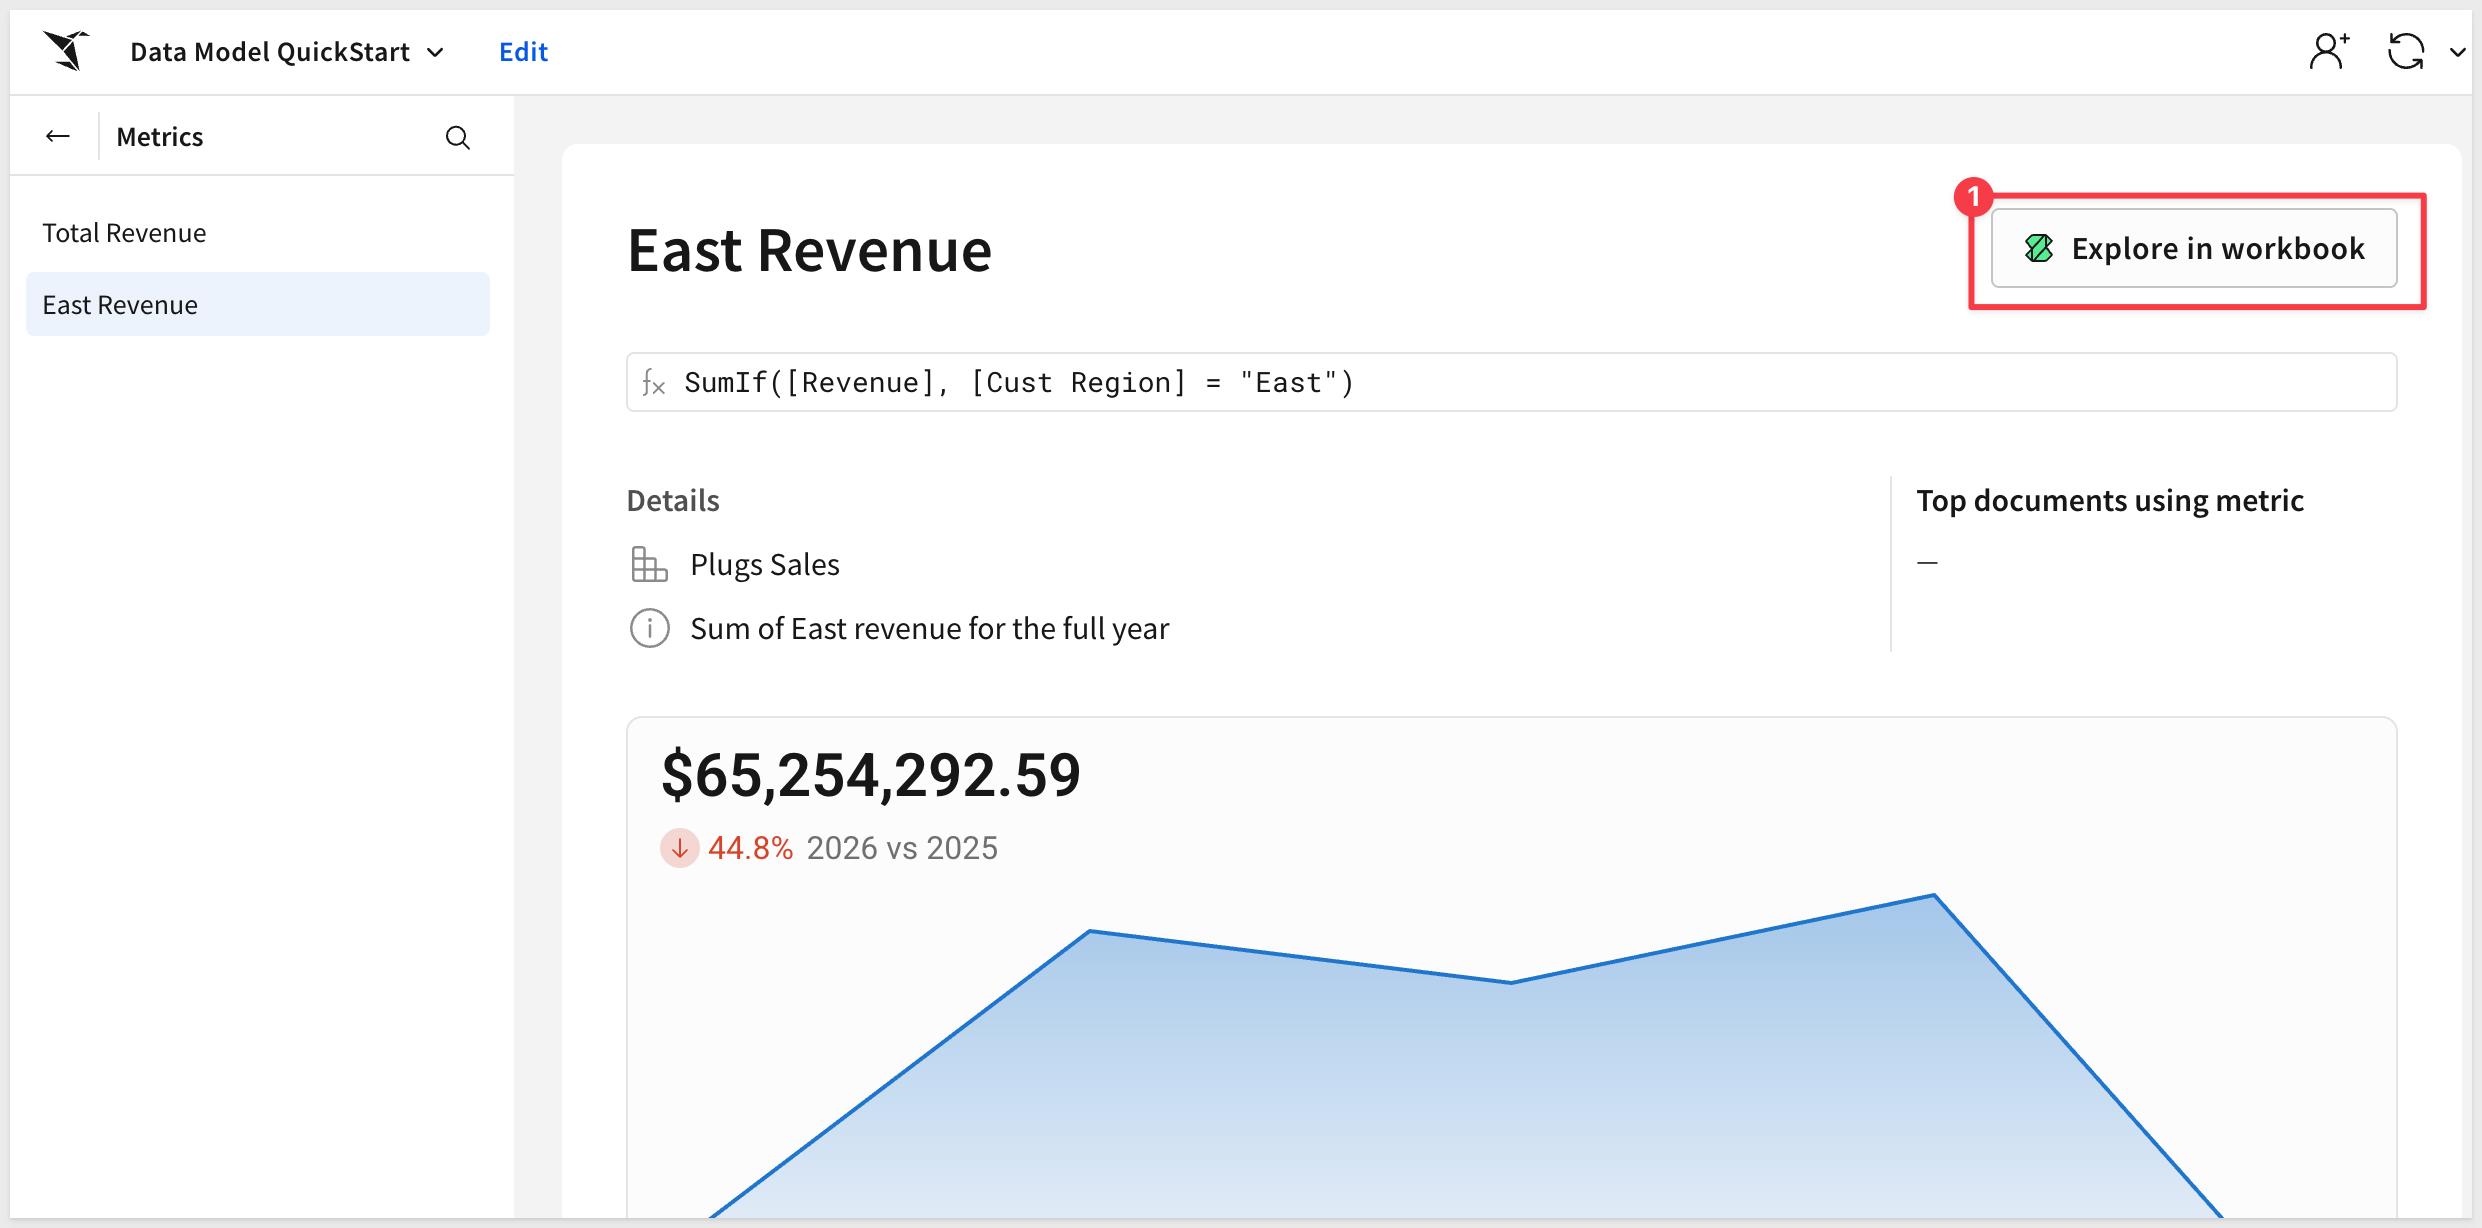
Once open, we can drill down to the row level detail with the East region being the only data available:
Using the metric
Return to the data model landing page.
Builders only need to click the explore button to open a new workbook using the full data model:
We can now group by Cust Region and use the Total Revenue metric that is supplied for us as a CALCULATION:
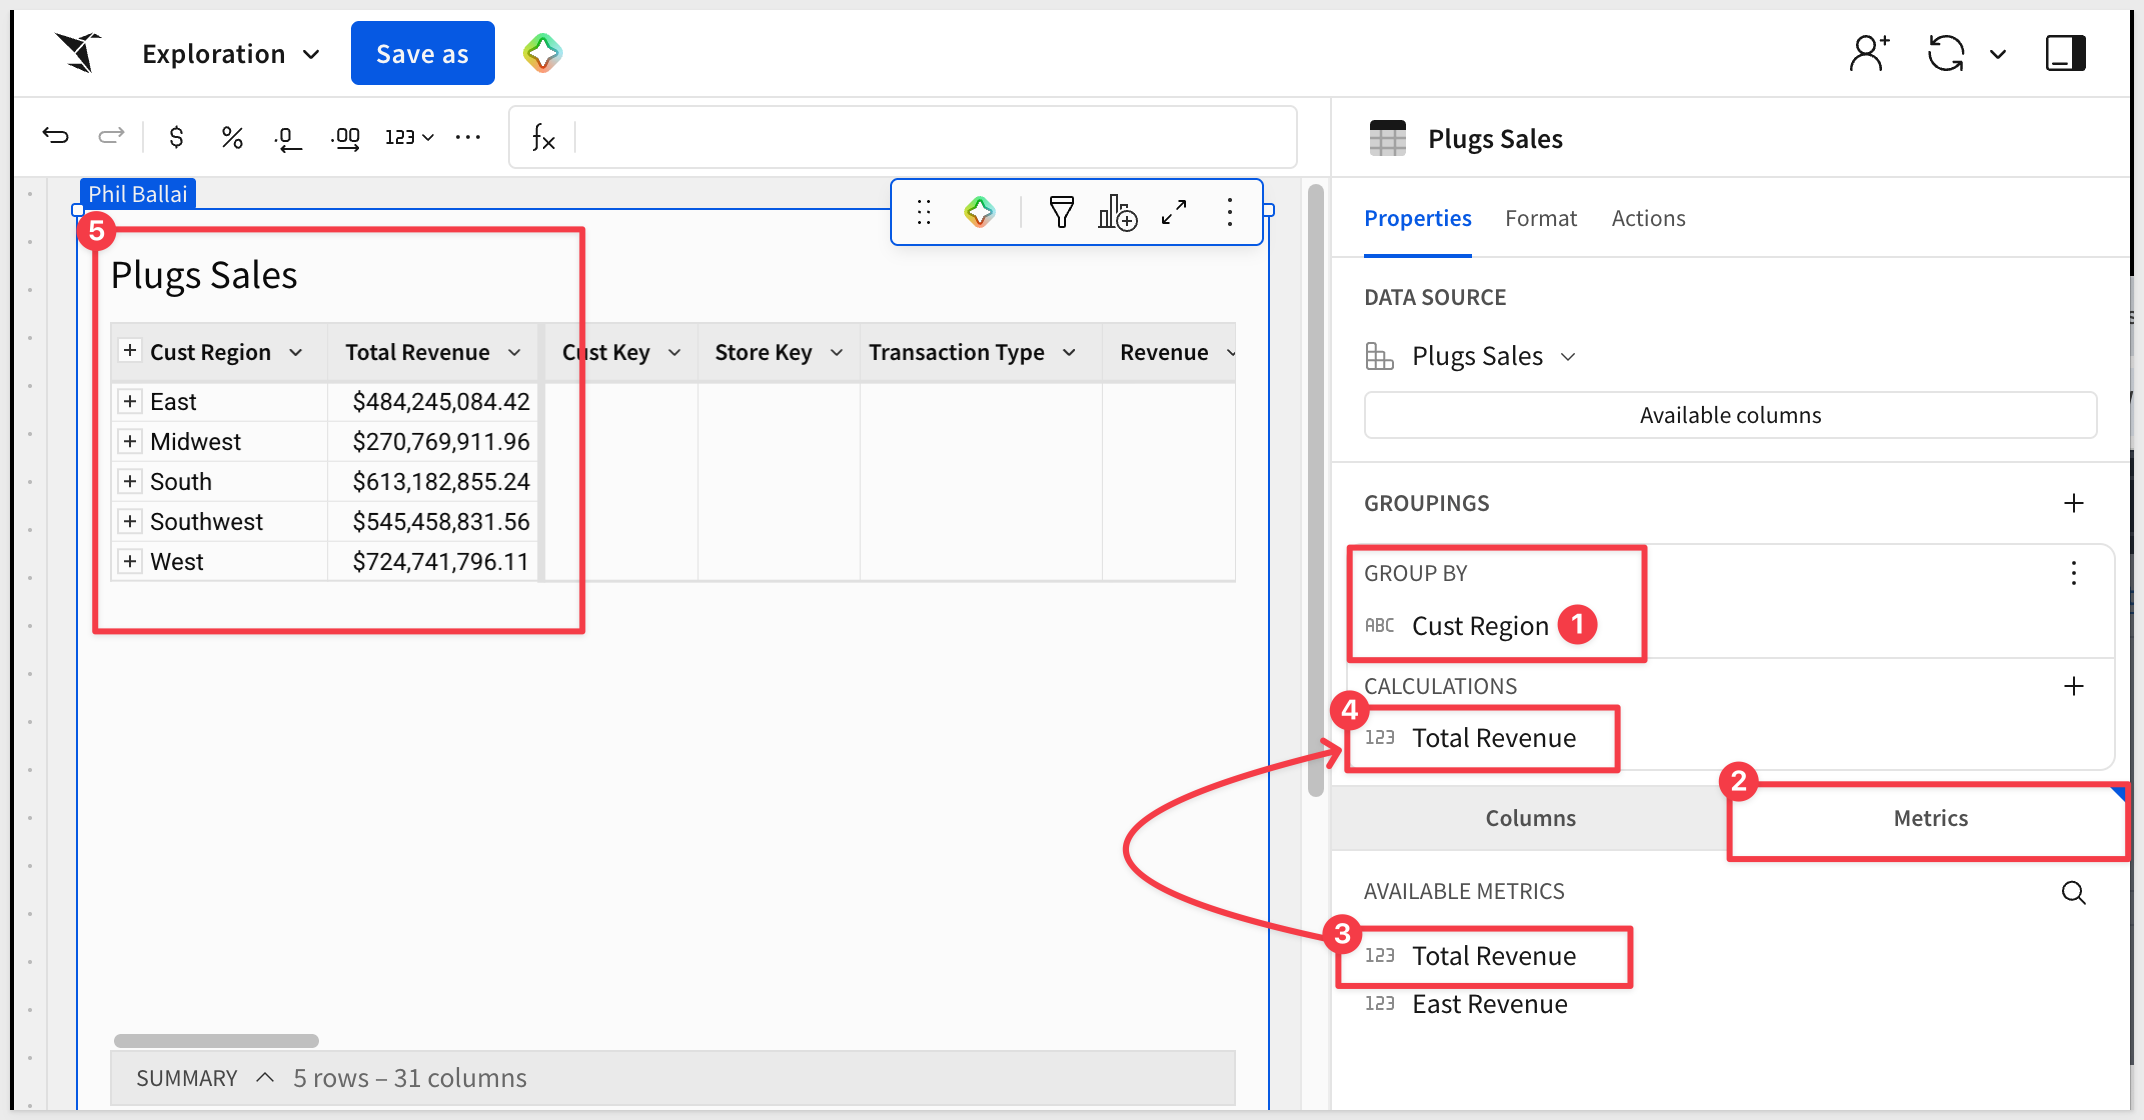
The user does not see the underlying calculation, but knows that since it is a metric, they can trust it as the approved calculation.
Metric best practices:
Define Metrics in Your Data Models:
Establish Metrics within Data Models to ensure uniform calculations across all analyses. When Metrics are created in Data Models (rather than on warehouse tables), users gain significantly more functionality, including a display of metrics at the top of a Data Model, and a centralized browsing UX.
Apply Time Series to Metric Displays:
When creating a Metric, you have the ability to specify a time series field to display the Metric value over time in all Metric previews. This provides users with more context around the KPI. You can also choose to compare metric values to previous periods if desired.
Use Descriptive Naming Conventions:
Name Metrics intuitively and provide clear descriptions to aid user understanding and adoption.
Use Aggregations in Metrics:
Metrics are meant to serve as aggregations over dimensional columns. They'll always calculate at the correct level of aggregation, no matter how many groupings you use. Be sure to use aggregations in your Metric Formulas.
Column-Level Security (CLS) in Sigma allows builders to restrict access to specific columns within a data model, ensuring sensitive information is accessible only to authorized users.
Configuring CLS in data models enforces consistent security policies across all downstream analyses and workbooks.
When CLS rules are updated in a data model, they automatically propagate to all downstream references.
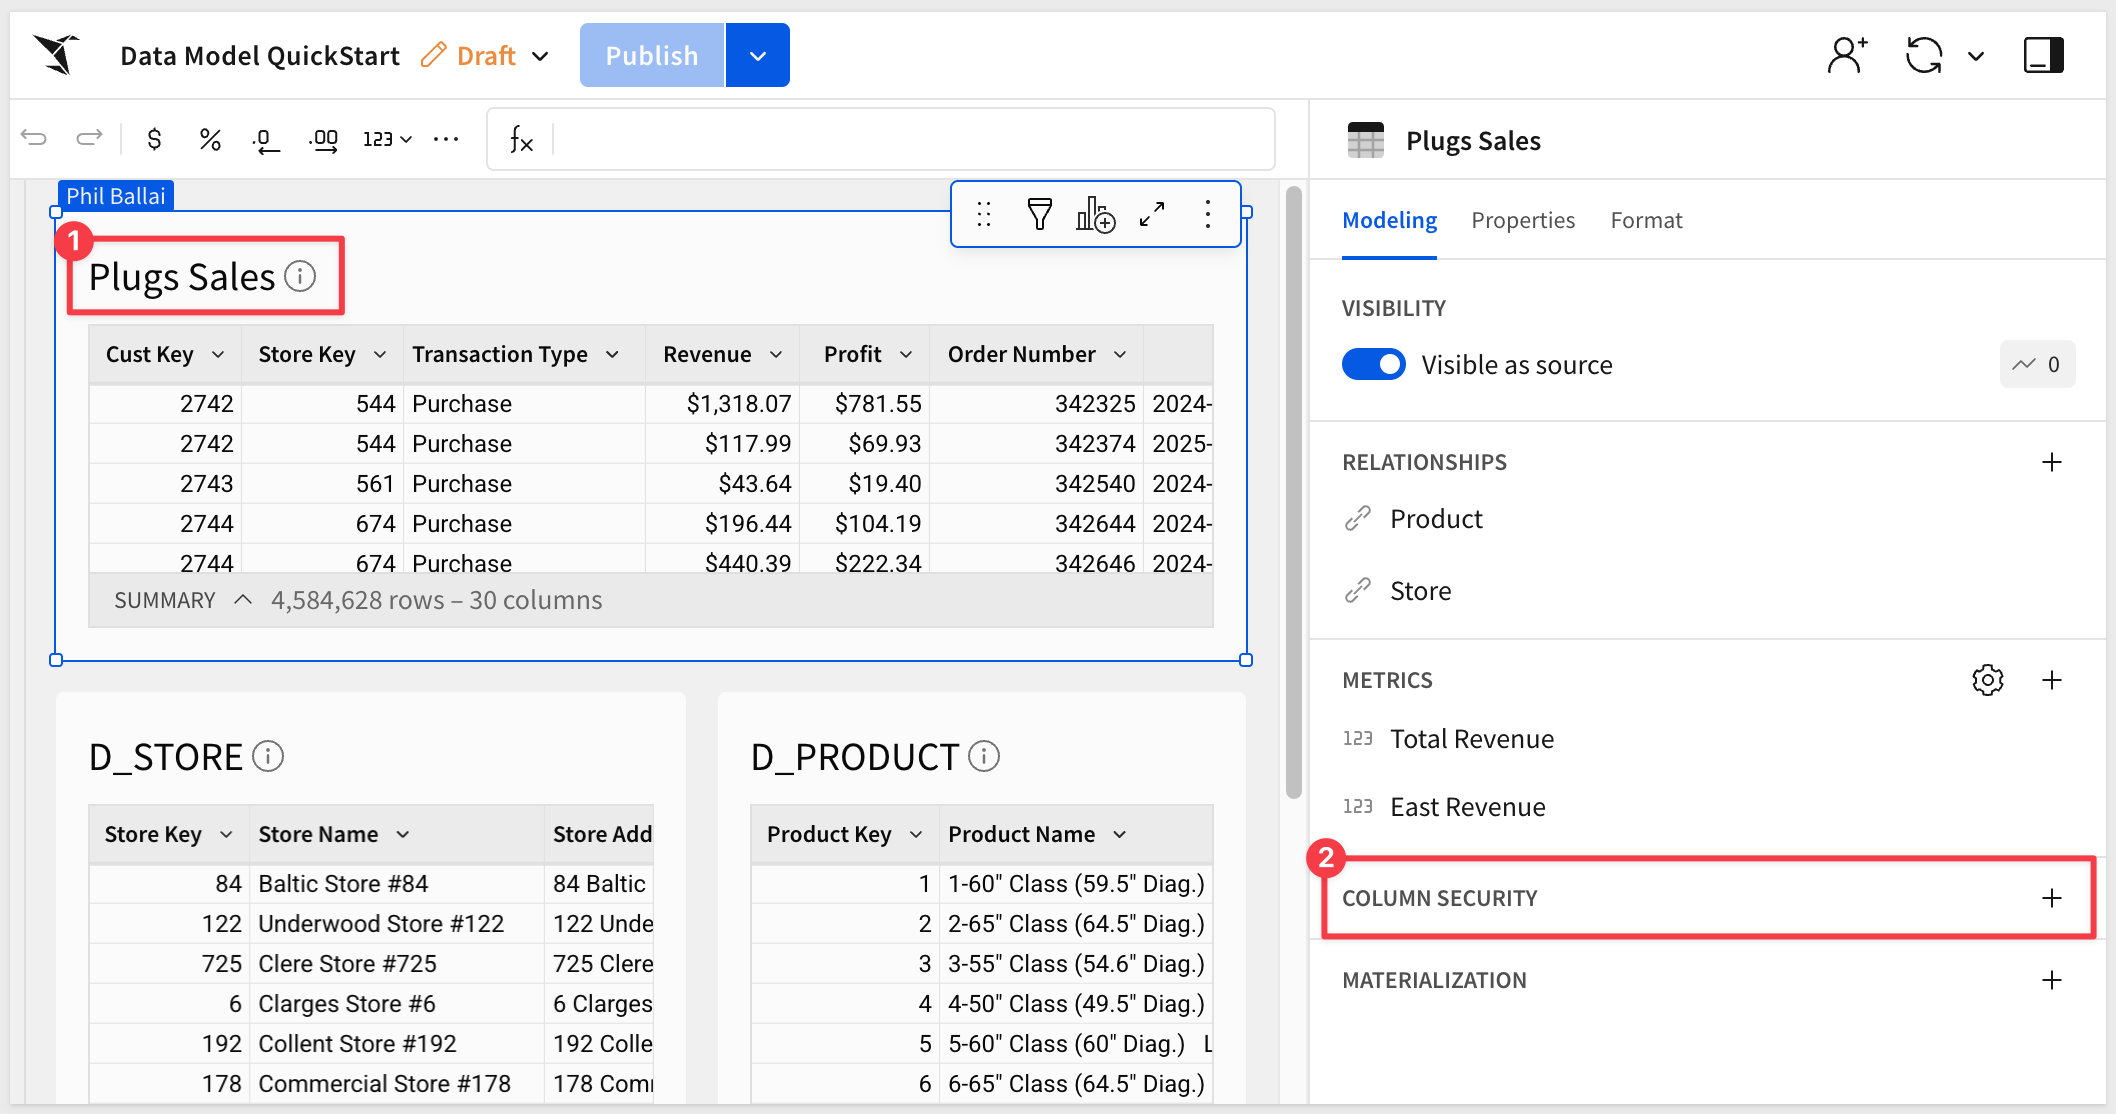
Return to the Data Model QuickStart, place it in Edit mode and select the Plugs Sales table.
Select the + for column security:
Select the Cust Name column and choose the method we want to use to secure it:
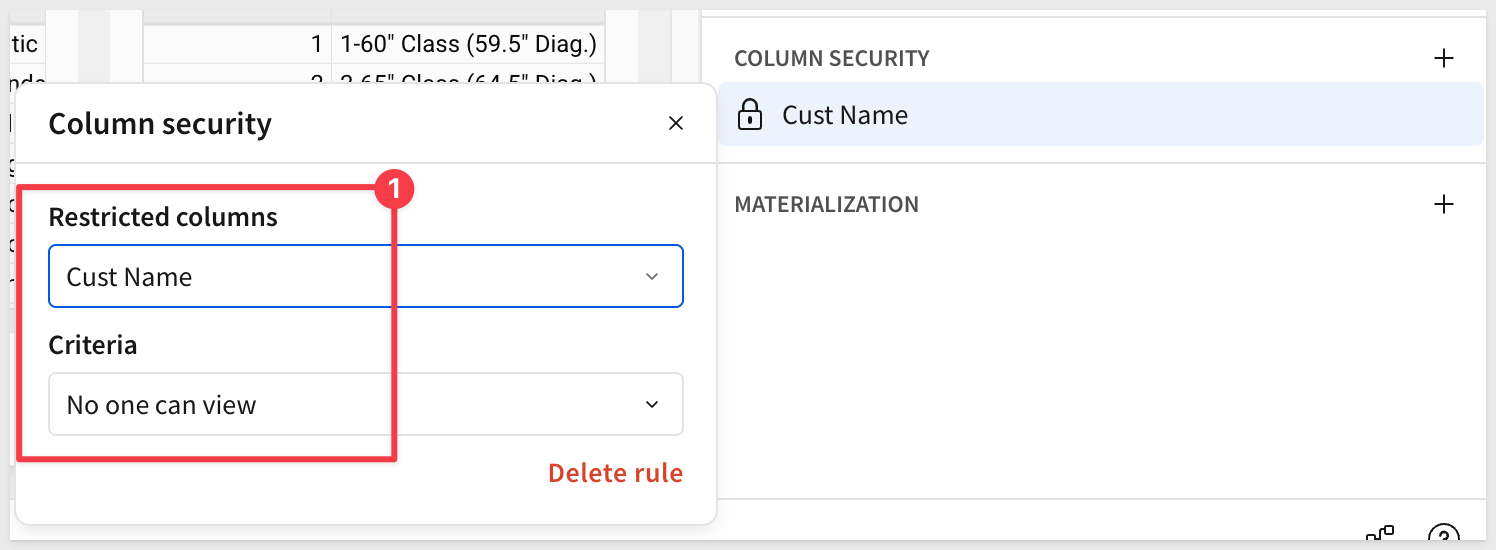
When set to No one can view, the column will not appear—even if the data model is accidentally shared with a non-builder.
Click Publish.
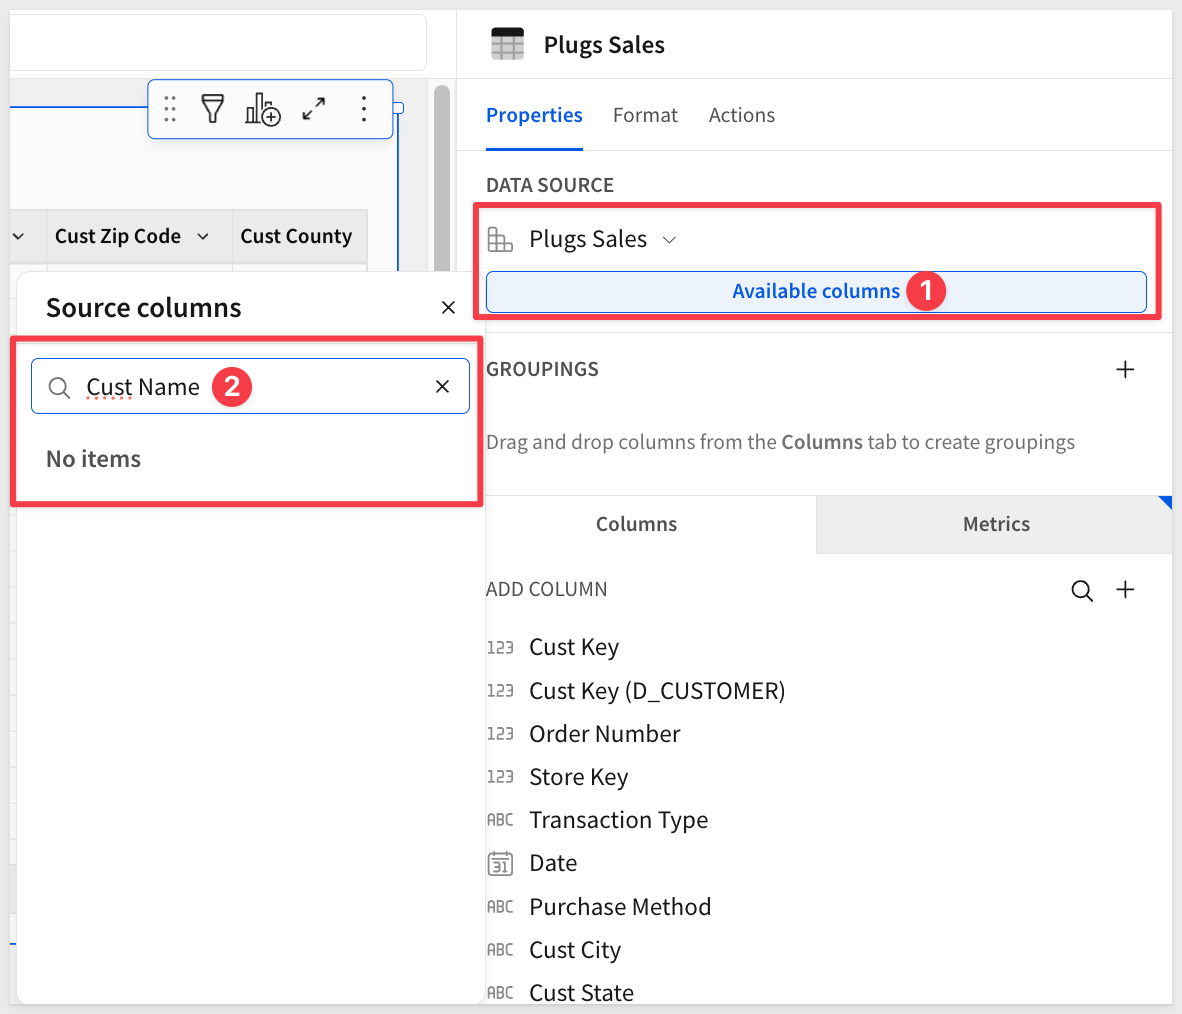
If we view the data model in the Published version and Explore it, we see that the restricted column does not appear in the column list and is not available via Source columns:
CLS best practices
Apply CLS at the Parent Level:
Column-Level Security policies are inherited from parent to child elements. Therefore, to ensure that any given column is secured on all downstream elements, it's best to apply CLS at the root or original parent element.
Utilize Teams for CLS:
Instead of assigning CLS on a per-user basis, it's quicker and more scalable to apply CLS rules on a team basis. New team members automatically inherit CLS policies.
Regularly Review Permissions:
Regularly audit and update CLS settings to stay aligned with organizational changes and compliance requirements.
When changes are made to a published data model, those changes can impact downstream workbooks and other documents that reference it. Sigma's content validation feature prevents these breaking changes from cascading silently.
When you delete elements, columns, metrics, or relationships that are referenced in downstream documents, Sigma detects the impact and provides a workflow to map replacements before publishing.
What triggers content validation
Content validation is triggered when you publish a data model that contains any of these breaking changes:
- Deleting an element
- Removing a column (including calculated columns)
- Deleting a metric
- Modifying or removing a relationship
Set up a downstream reference
For content validation to trigger, at least one downstream workbook must reference a column from the data model.
Open a new workbook and add a table using Data Model QuickStart as the source, selecting the Plugs Sales table.
The Revenue column is already included.
Save the workbook Fundamentals 10 QuickStart.
Simulate a breaking change
Return to the Data Model QuickStart in Edit mode.
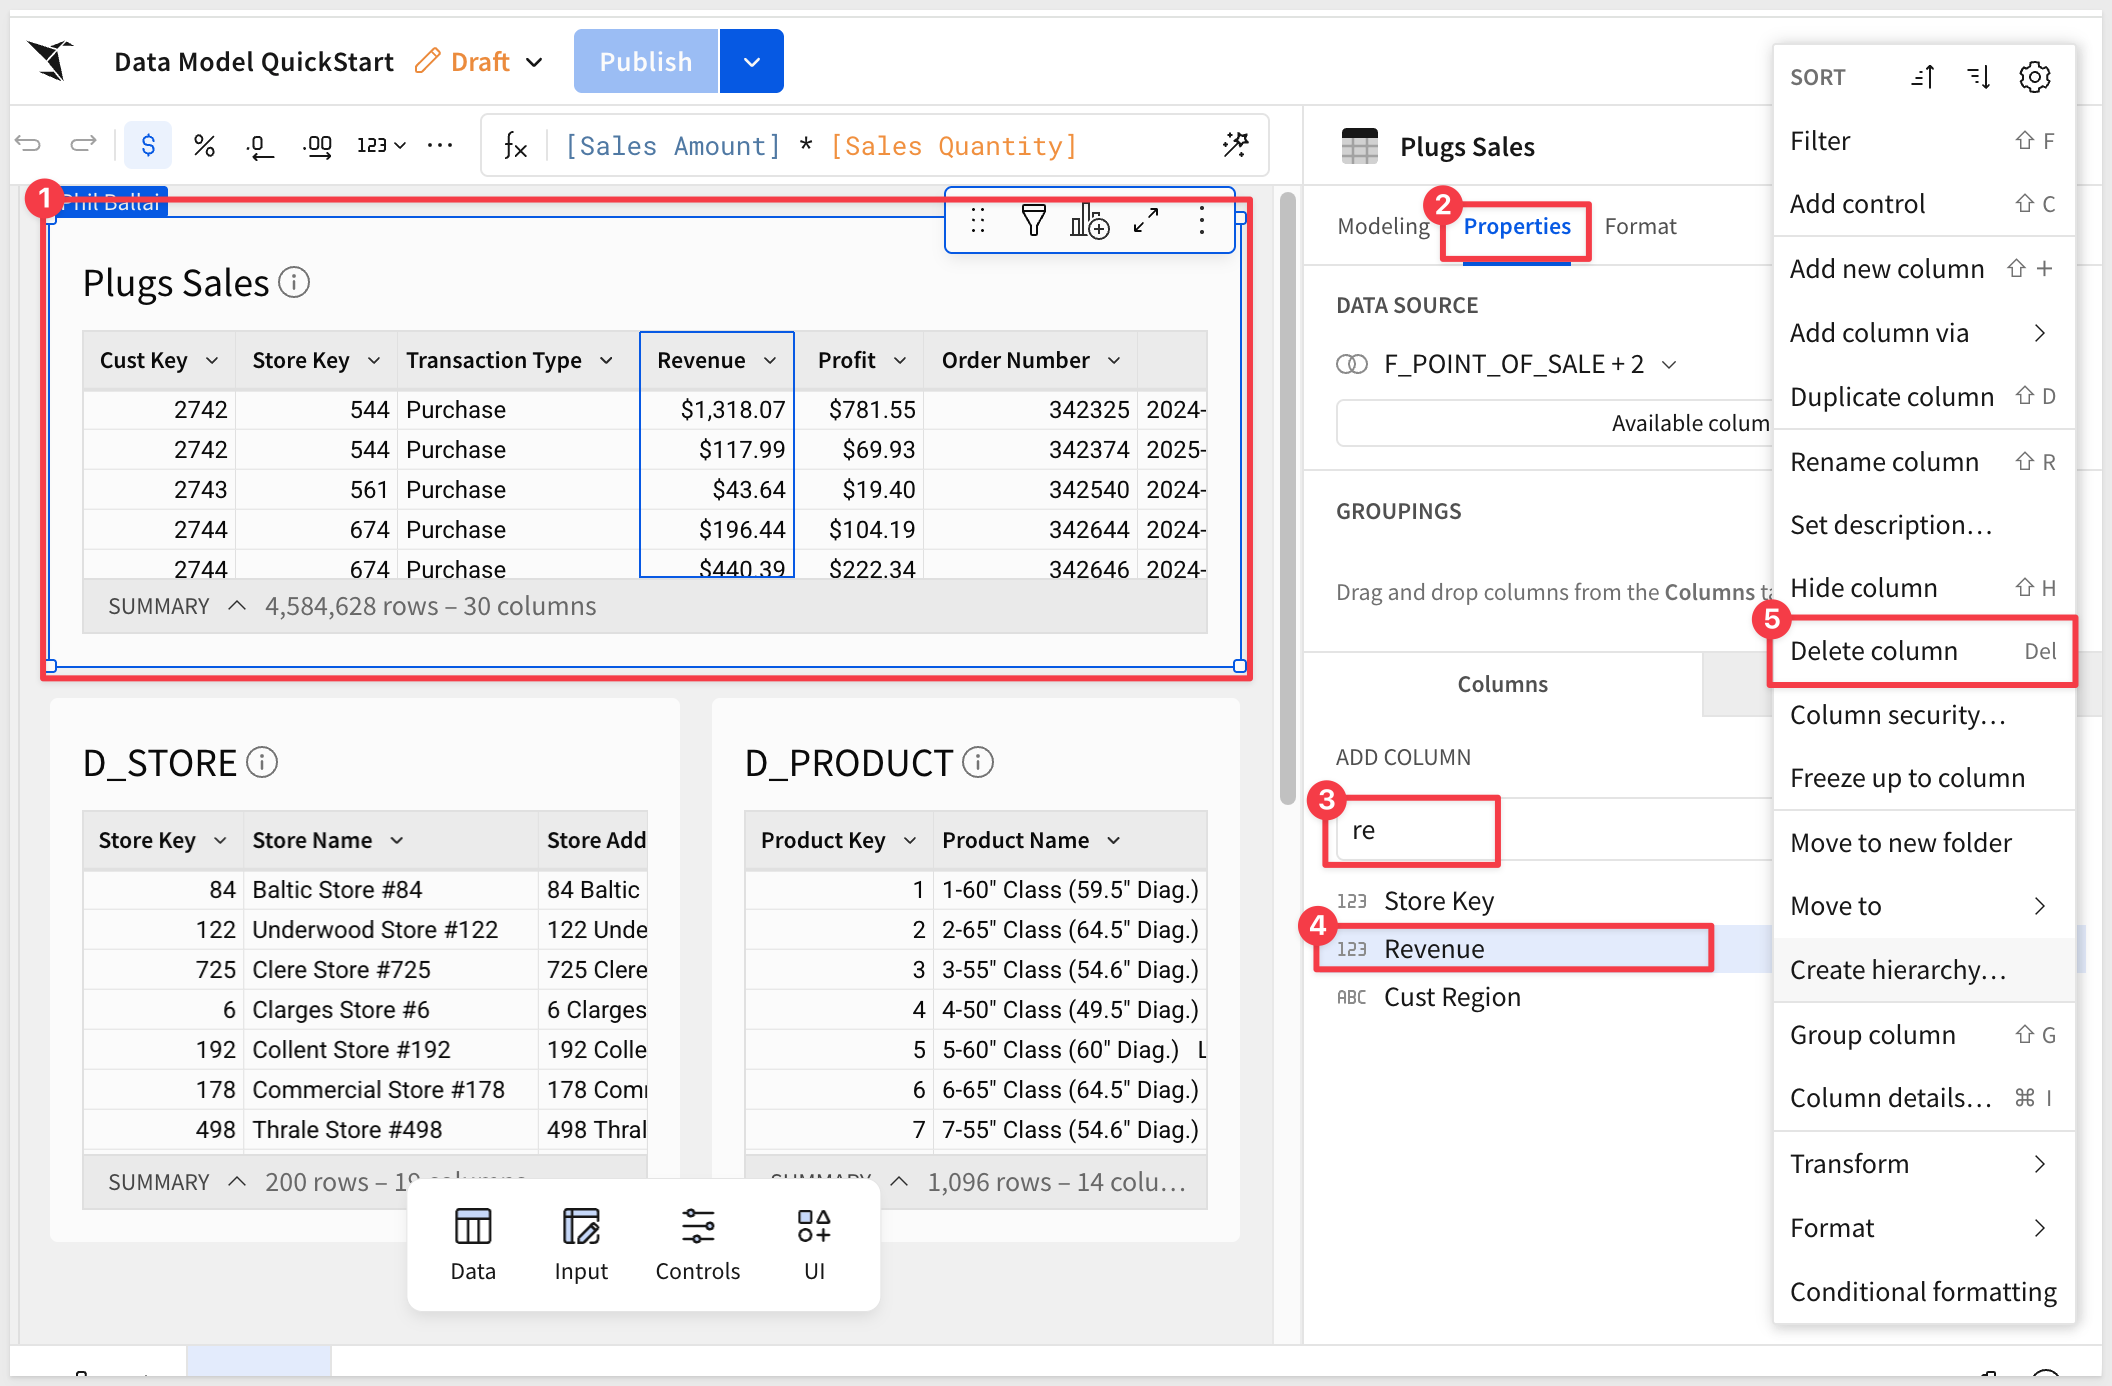
In the Plugs Sales table, right-click the Revenue column and select Delete column:
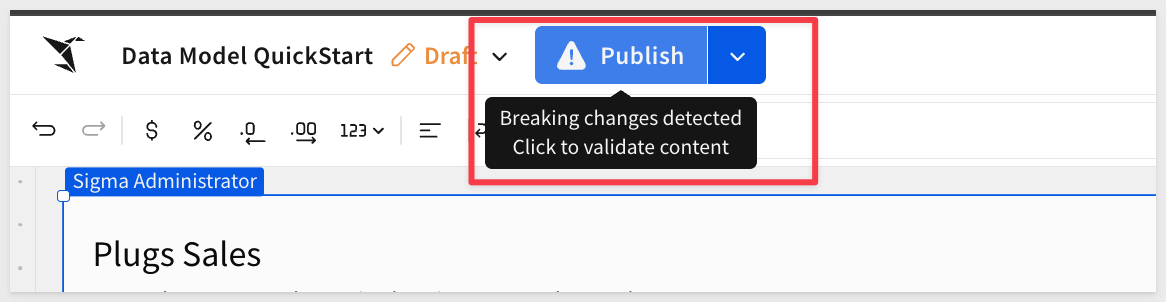
Notice the Publish button now displays a warning icon, indicating that breaking changes have been detected:
The validation modal
Clicking Publish opens the content validation modal, which lists all affected downstream elements, columns, and metrics.
We have the option to Publish without validation but let's not do that as we have broken columns.
From here you have two options:
Auto fix: Click Auto fix to have Sigma attempt automatic replacement mapping using name matching. This works well when a column has been renamed but is structurally equivalent:
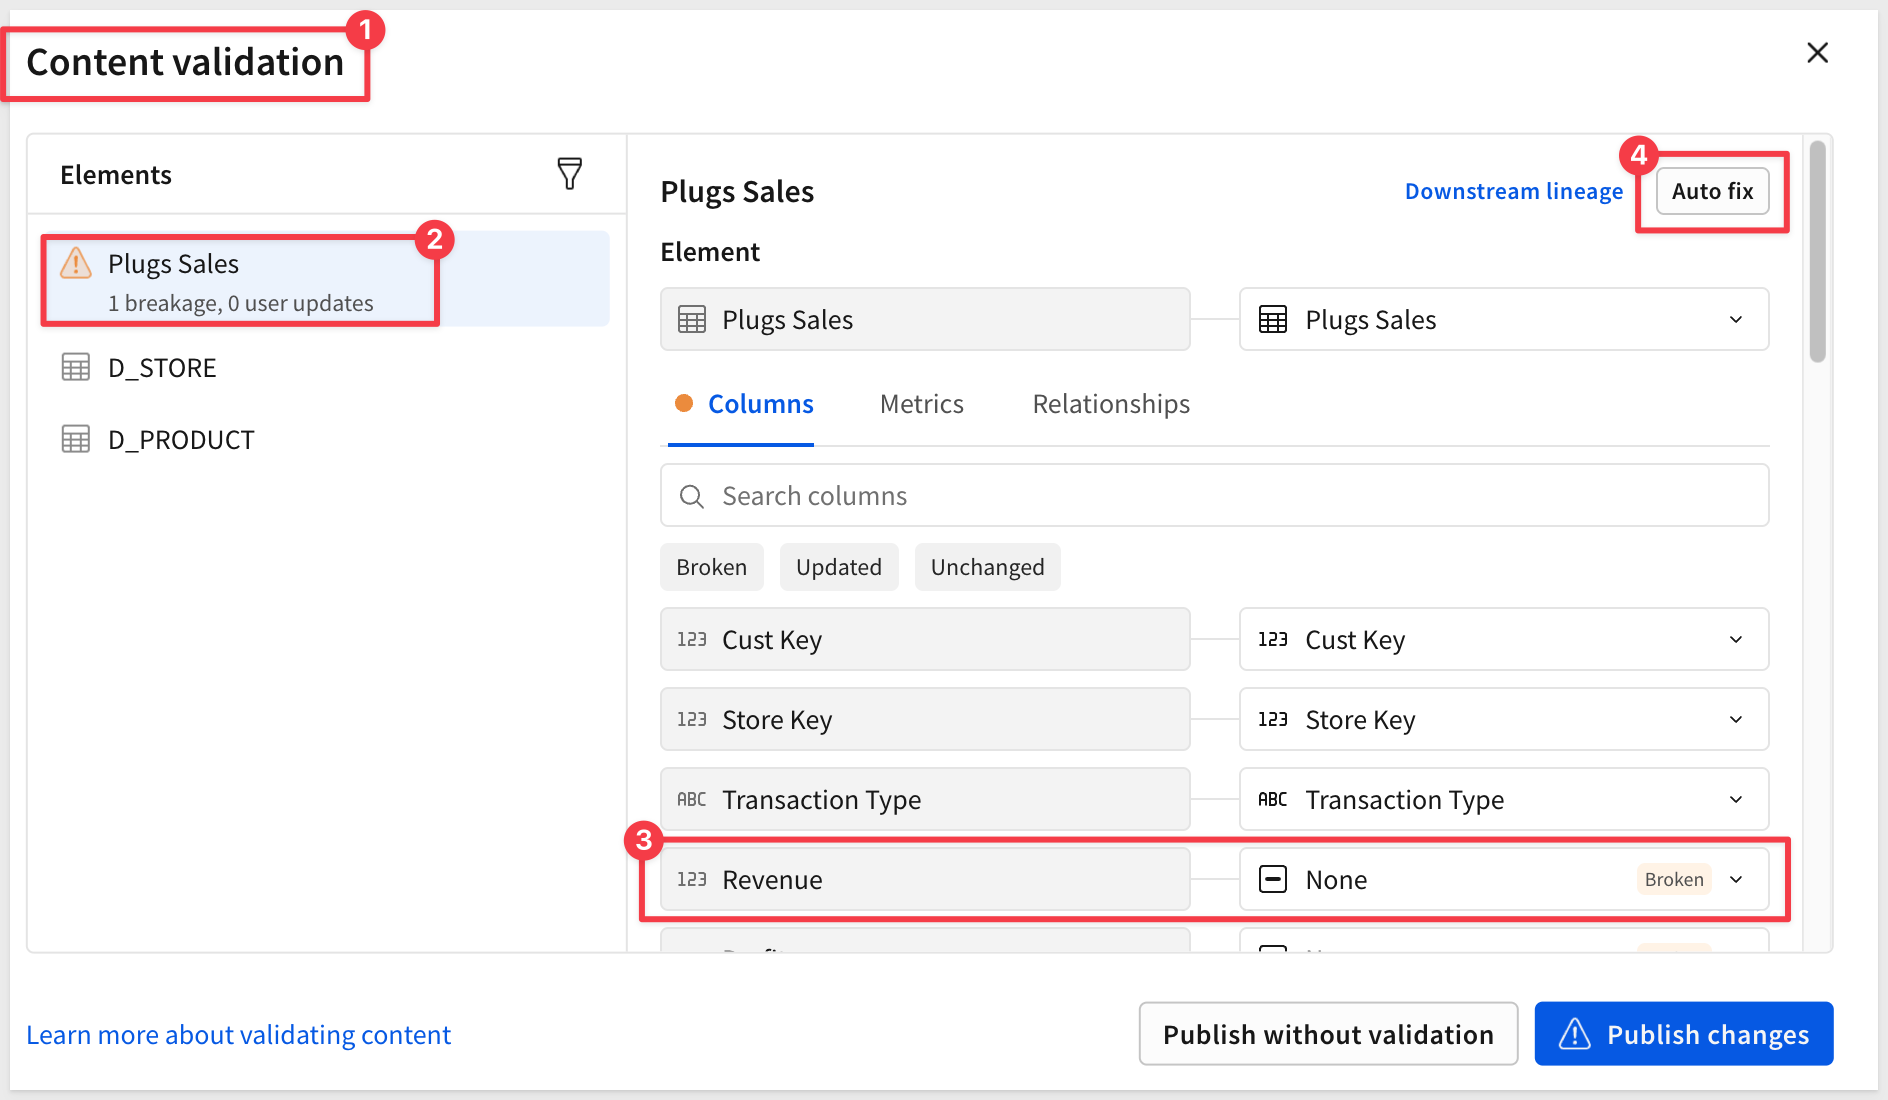
Manual mapping: For each broken item, use the dropdown to select a replacement from the available options. Choosing None removes the item from affected downstream documents.
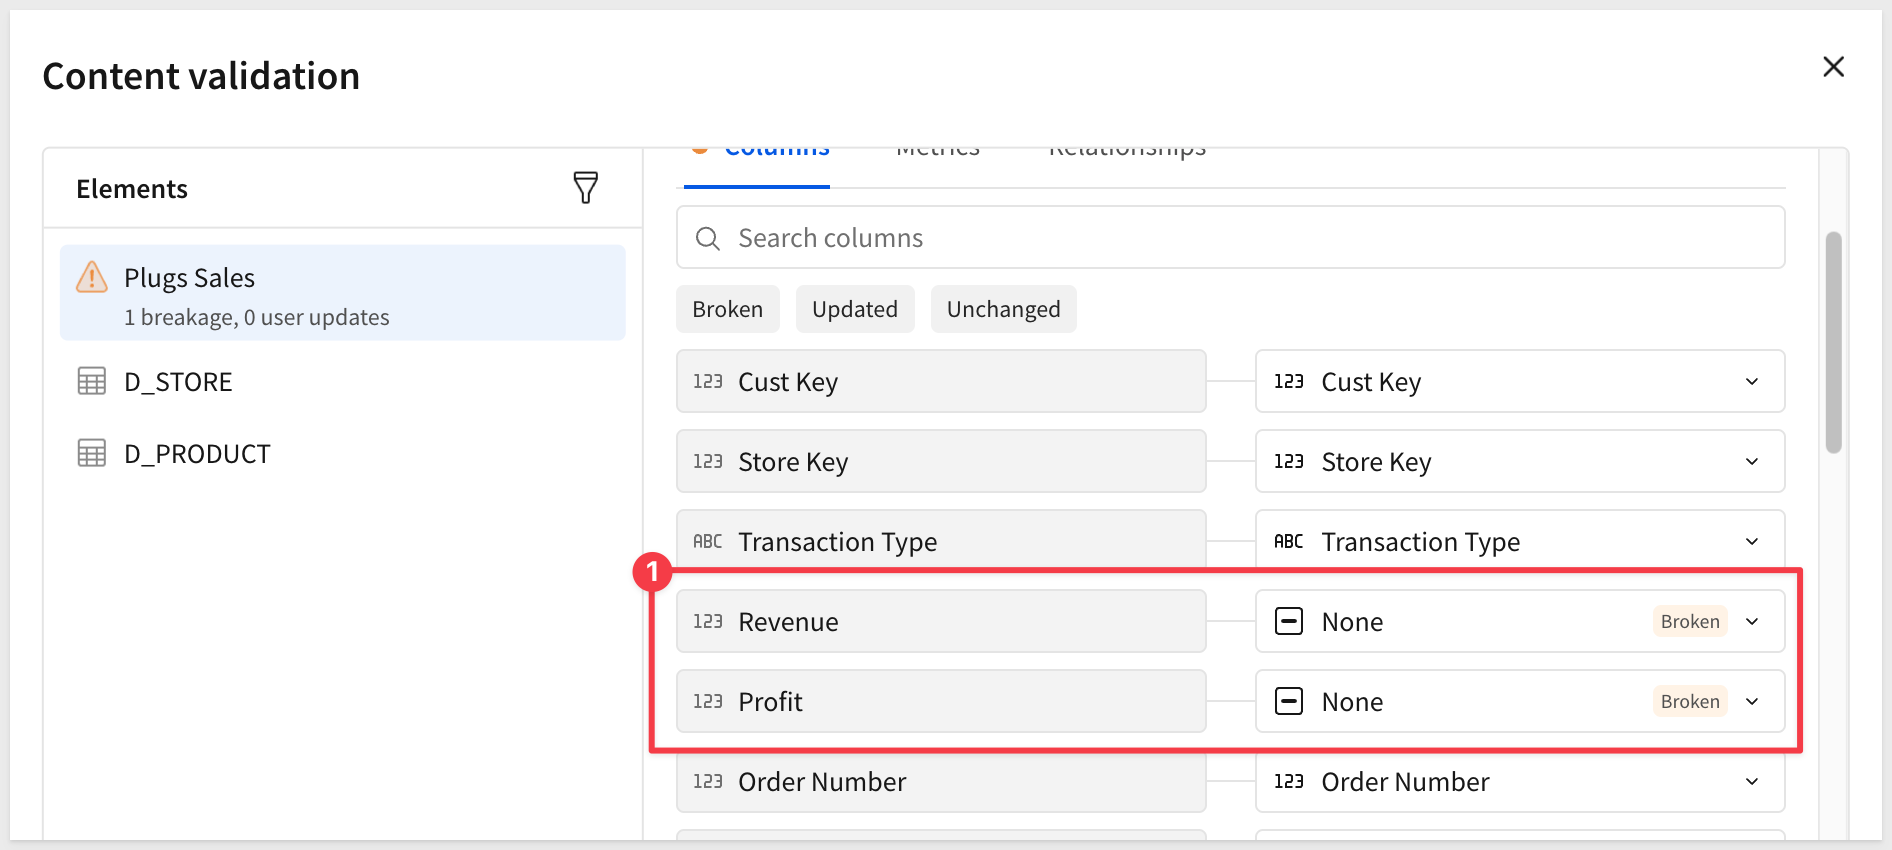
Scroll the column list to see that the Revenue column is "broken":
You can also click Downstream lineage to review exactly which documents will be affected before committing.
Since we physically deleted the Revenue column, autofix or manual mapping will not resolve it but there is another method.
Close the Content validation modal.
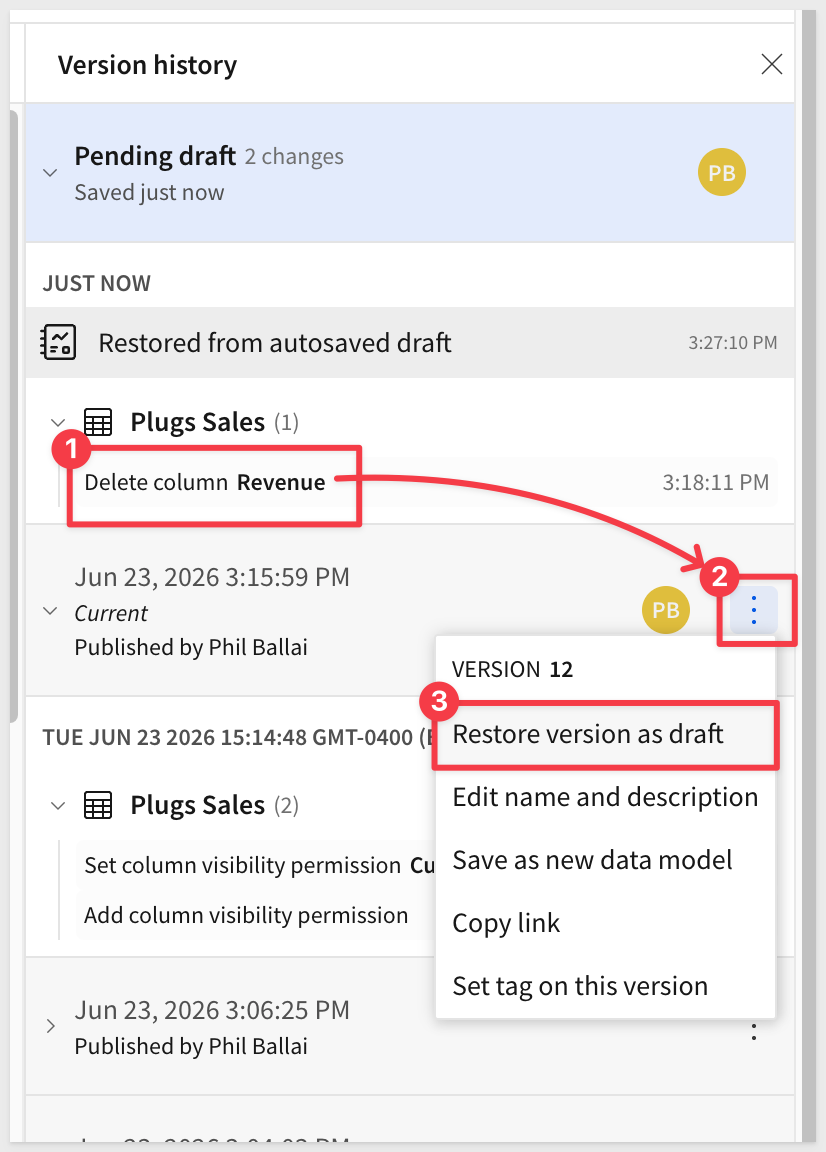
Data models and workbooks maintain a detailed version history that allows us to revert the column delete (in this case):
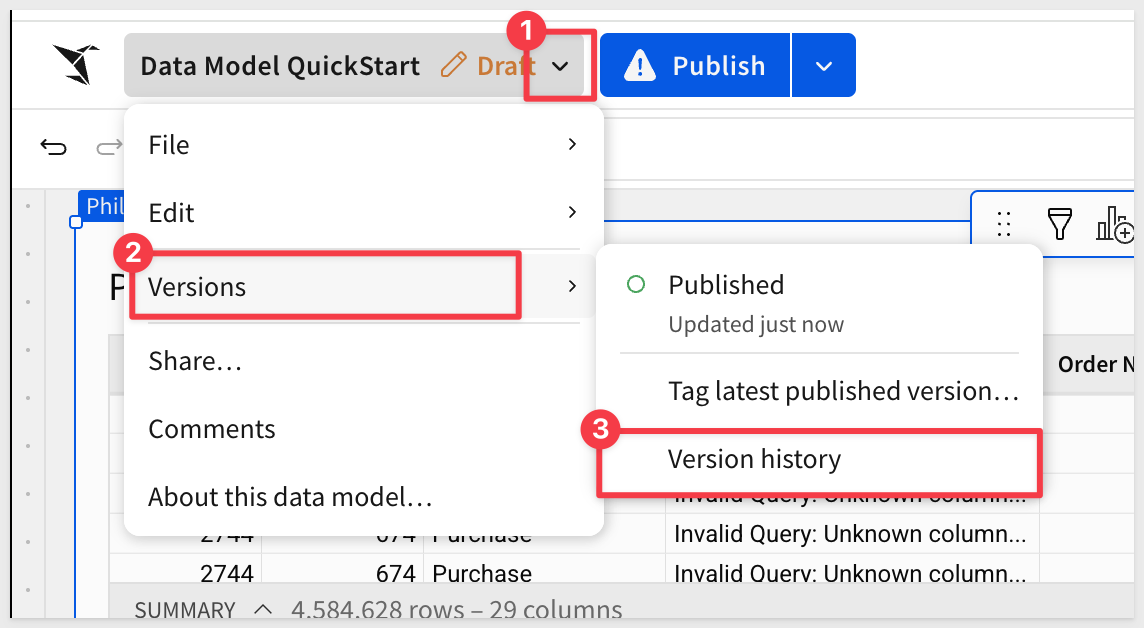
We can see where we deleted the Revenue column so we want to revert to the version that came just before that (yours may be a little different based on the order of operations performed):
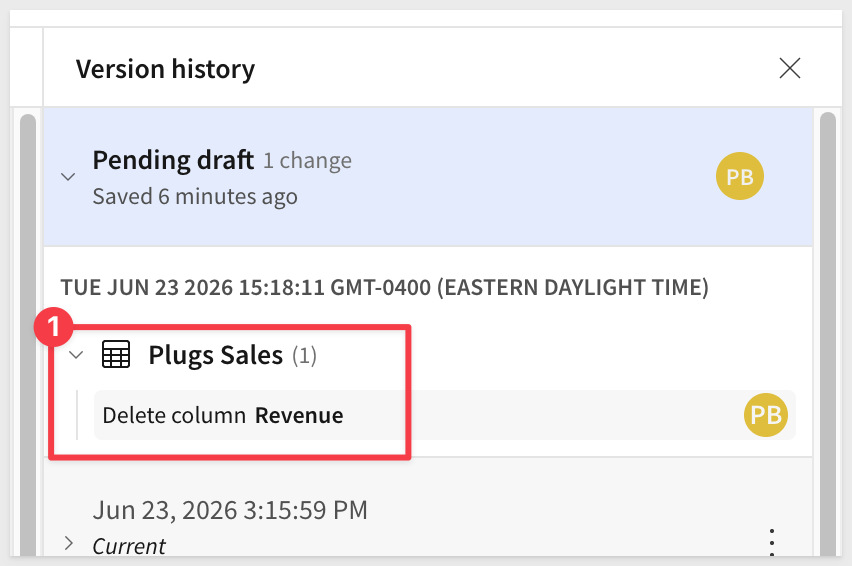
We can simply select to Restore version as draft from the version just before we deleted the column:
Once reverted, the Revenue column is back and Profit also is working:
Sigma sequentially updates the published versions of all affected downstream documents. Users with open drafts are prompted to sync with the latest published version.
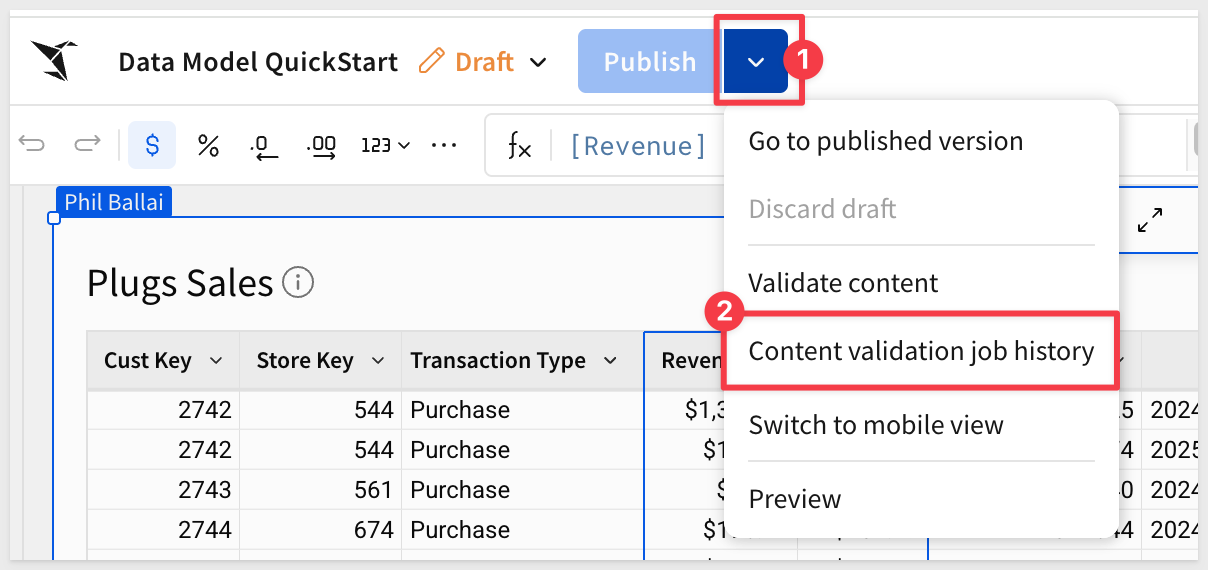
In more complex data models where many downstream documents are affected, it can be useful to see the job log.
This is available by clicking Publish > Content validation job history:
What content validation cannot fix
Content validation operates only at the document level. It cannot repair:
- Changes made directly in your data platform (such as
CREATE OR REPLACEoperations on warehouse tables) - Broken configurations within the data model itself
- Explorations — these must be updated manually
- Unpublished embedded workbooks whose published versions don't reference the data model
For more information, see Validate content in a data model
Sigma data models support built-in materialization.
For data models that use expensive or long-running queries — such as complex joins between data elements, or data with high cardinality, multiple grouping levels, and calculated columns — setting up materialization can enhance query performance and reduce compute costs.
Back in the data model again and in Edit mode, click the + icon next to MATERIALIZATION to create a new job:

Sigma provides a simple form that enables builders to avoid the complexity of setting up materialization in the warehouse directly.
Simply select the table(s) to include and set a schedule:

For more information, see About materialization
There is also a QuickStart; Materialization with Sigma
Some customers work with very wide tables containing dozens of columns, which can be a hassle for builders who would otherwise need to scroll through the column list or use search to locate a specific field.
Sigma simplifies this by allowing columns to be grouped into logically named folders.
For example, in the Plugs Sales table, we may want to group all customer-related columns into a folder called Customer Details:
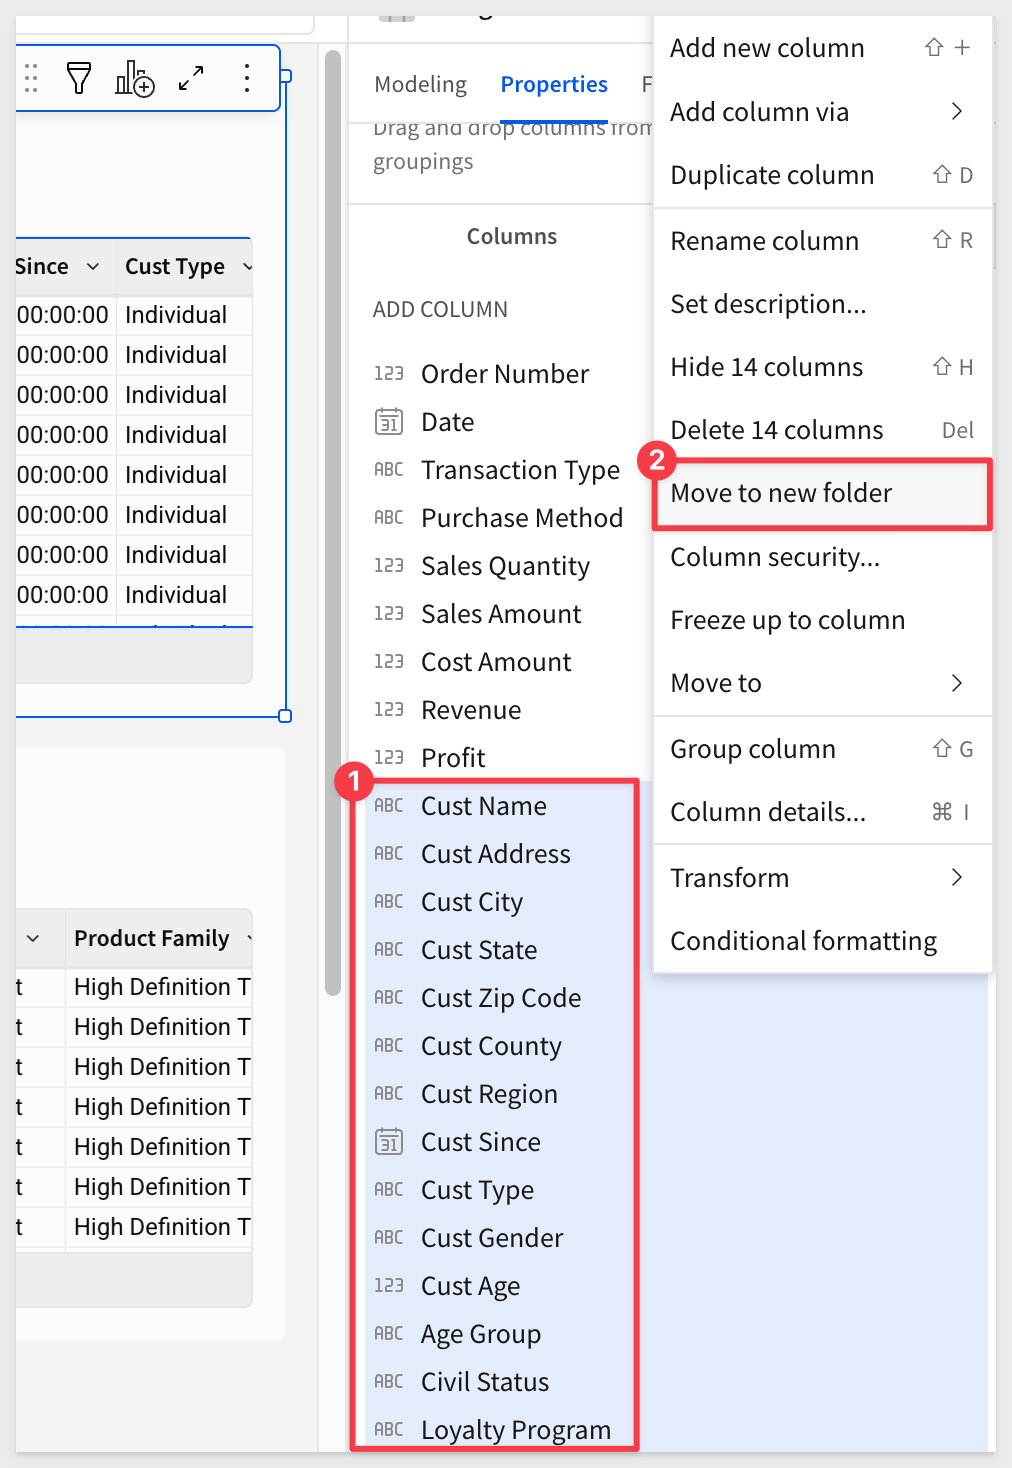
It's impressive how such a small feature can improve the user experience. At Sigma, we call these "quality-of-life improvements" and we are adding more all the time:

In this QuickStart, we explored how to build a Sigma data model, join and organize tables, create calculated fields and metrics, apply column-level security, use content validation to protect downstream workbooks, and improve usability through folders and materialization. With these tools, you're ready to deliver clean, consistent, and secure data to your users—all without writing SQL.
Additional Resource Links
Blog
Community
Help Center
QuickStarts
Be sure to check out all the latest developments at Sigma's First Friday Feature page!


