Sort, filter, group, and build calculations on live warehouse data in Sigma — no SQL required.
All exercises use the Fundamentals workbook and the Sales Transactions table created in Fundamentals 1: Overview.
If you're coming from a spreadsheet tool like Excel, one key difference to understand upfront: Sigma manages data at the column level, not the individual cell level. Calculations and formatting changes apply to every row in a column automatically. This ensures consistency across large datasets and eliminates the risk of cell-level errors that are common in traditional spreadsheets.
For more information on Sigma's product release strategy, see Sigma product releases.
If something isn't working as expected, here's how to contact Sigma support.
Target Audience
This QuickStart is for anyone working with data in Sigma — analysts exploring datasets, builders creating workbooks and reports, or anyone who completed Fundamentals 1 and wants to go deeper with tables and calculations.
Prerequisites
- A computer with a current browser.
- Completion of Fundamentals 1: Overview.
- Access to a Sigma environment. A Sigma trial is acceptable and preferred.
What You'll Learn
- How to sort, filter, and search data in a Sigma table
- How to group data and create summary calculations
- How to add custom columns using Sigma's formula library
- How to work with dates, text, and conditional logic
- How to use lookup functions to join data from multiple sources
Our starting point is the Fundamentals workbook created in Fundamentals 1: Overview.
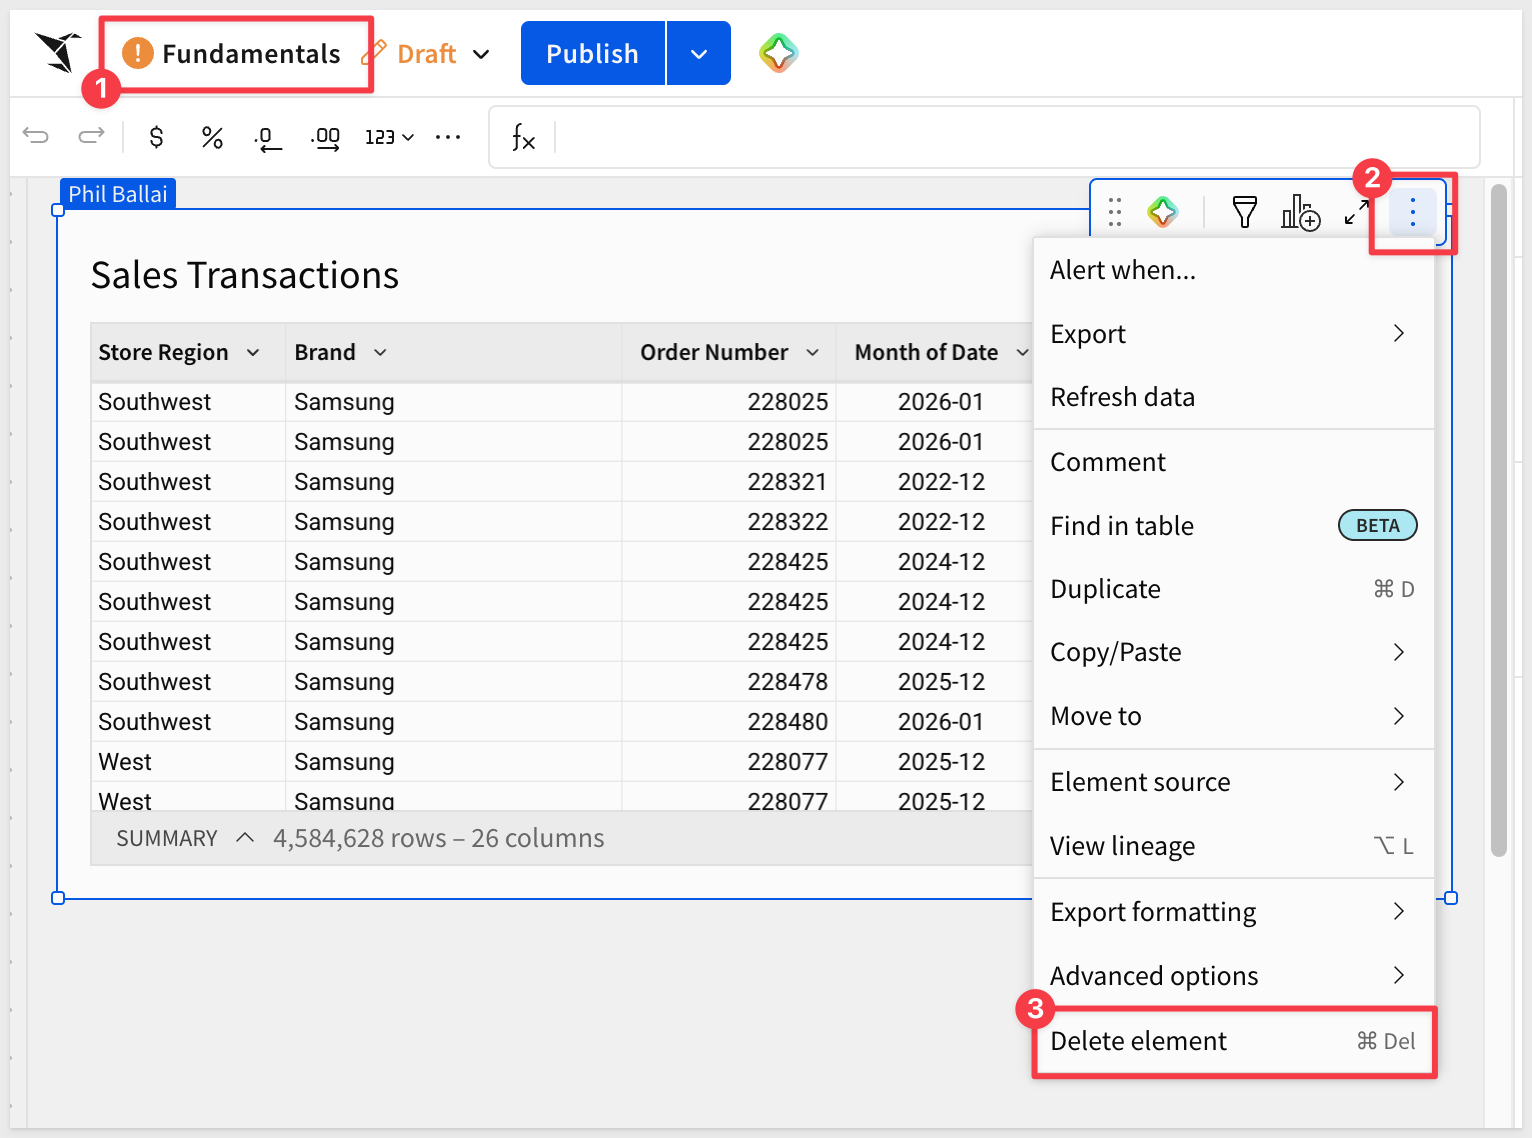
Open the Fundamentals workbook and click Edit. Navigate to the Data page — the Sales Transactions table from Fundamentals 1 should already be there.
Delete that table:
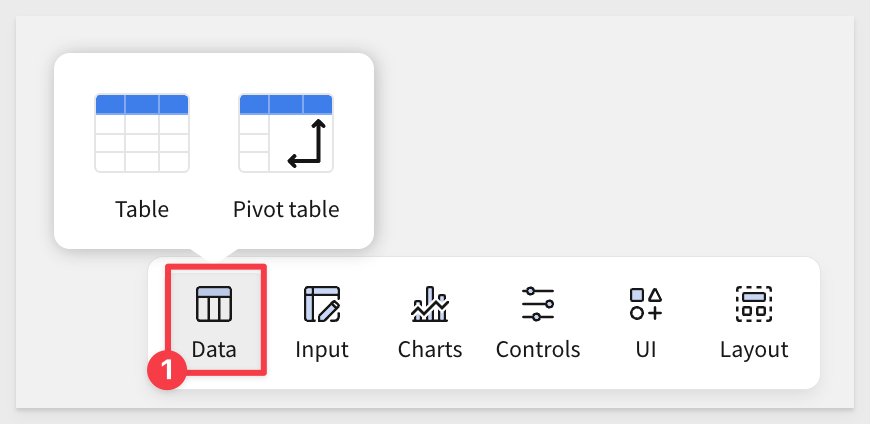
Add a table with the element bar
We can add "Elements" to the page using the element bar. Click the Data group on the element bar and choose a Table:
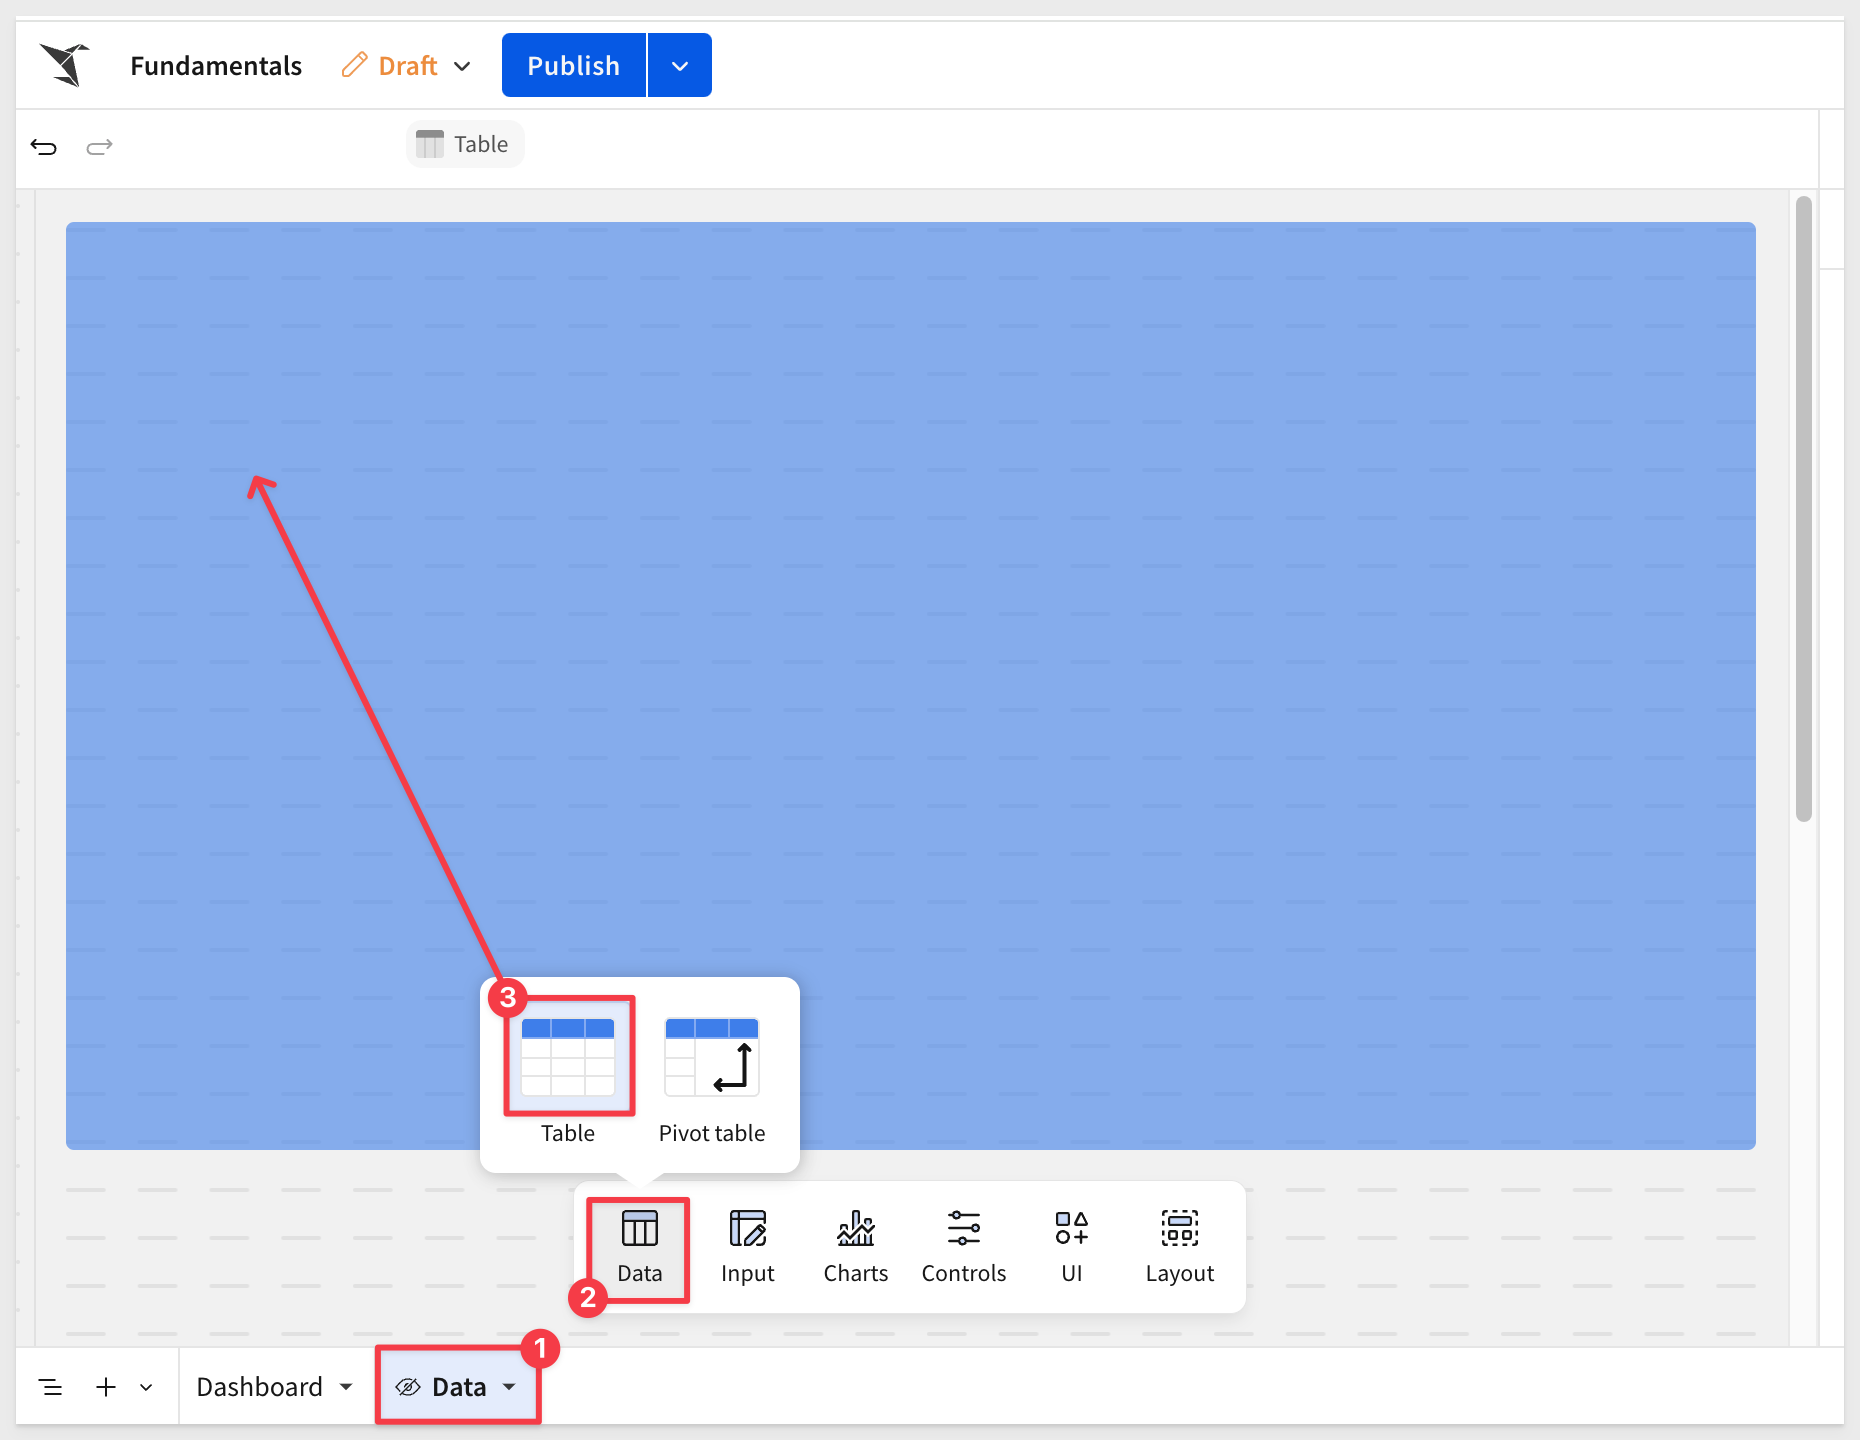
Drag a Table onto the Data page.
Sigma asks us to Select source. Click that button.
We then are presented some options:
- Search: by name from connections
- Suggested: Sigma will present options from most used tables
- Element: These are tables that already exist in this workbook
- Data sources: Connections you have access to
At the bottom there are some icons:
- CSV: Allows you to "bring your own data" in the form of a text file
- SQL: Write your own SQL query
- Join: Create a join from existing tables
- Union: Create a union from existing tables
- Transpose: Select a table and switch from rows to columns, or columns to rows
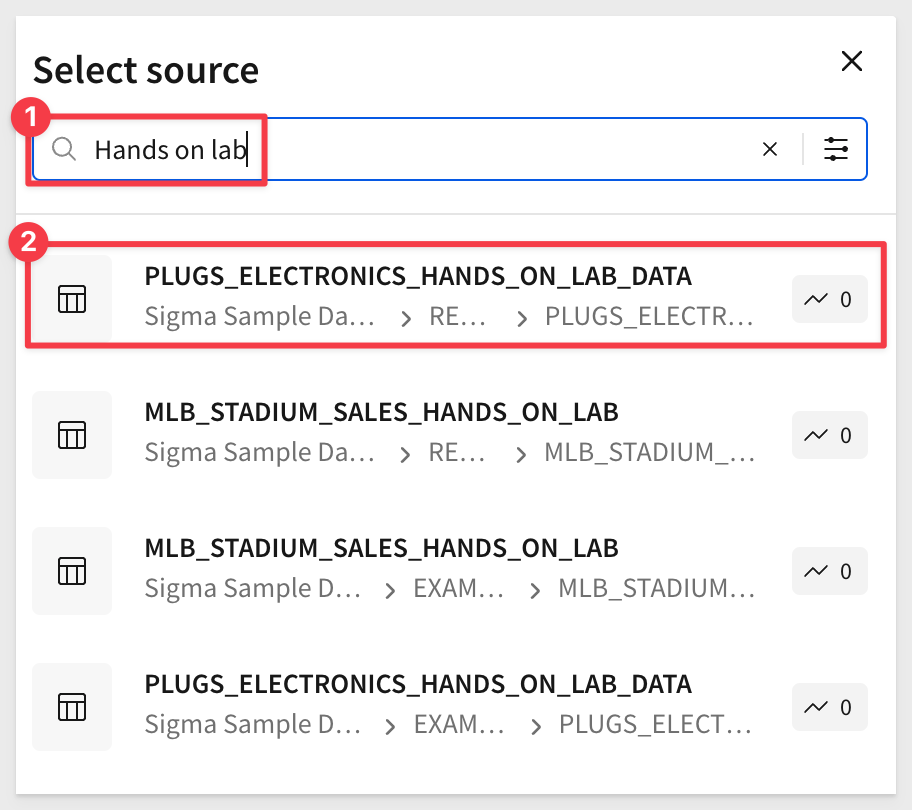
Use the search option to search for Hands on lab, and select the PLUGS_ELECTRONICS_HANDS_ON_LAB_DATA > Retail schema:
With the table added to the page, double-click on its name and shorten it to Plugs_Store_Sales.
Adding columns
Our source data in Snowflake is missing a few columns that users need.
Instead of users making calculations themselves, we will do that for them so that we control how the column values are calculated.
For more information, see About metrics
The missing columns are Sales, COGs (cost of goods sold) and Profit.
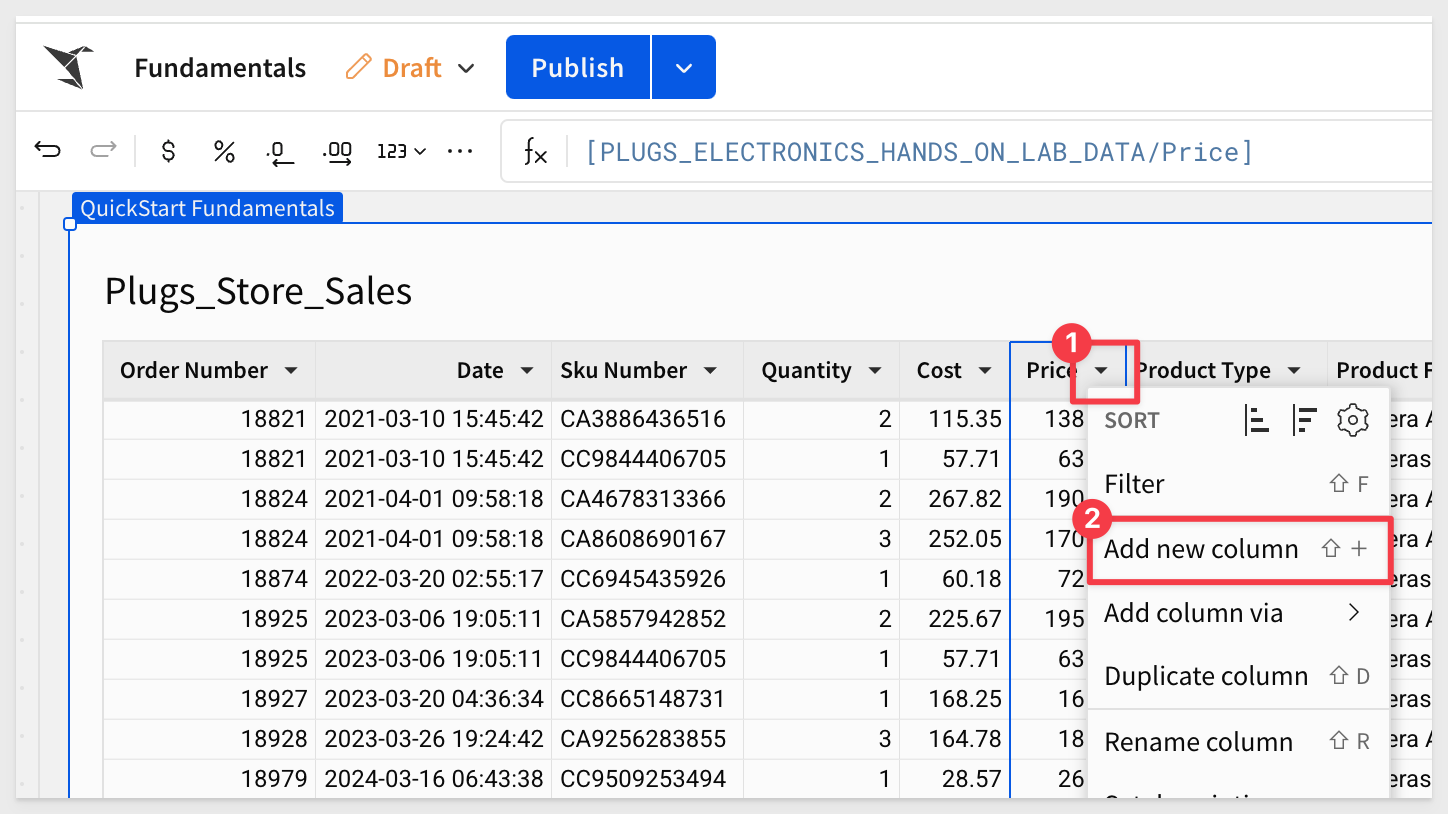
Click the column dropdown from the Price column and select Add new column:
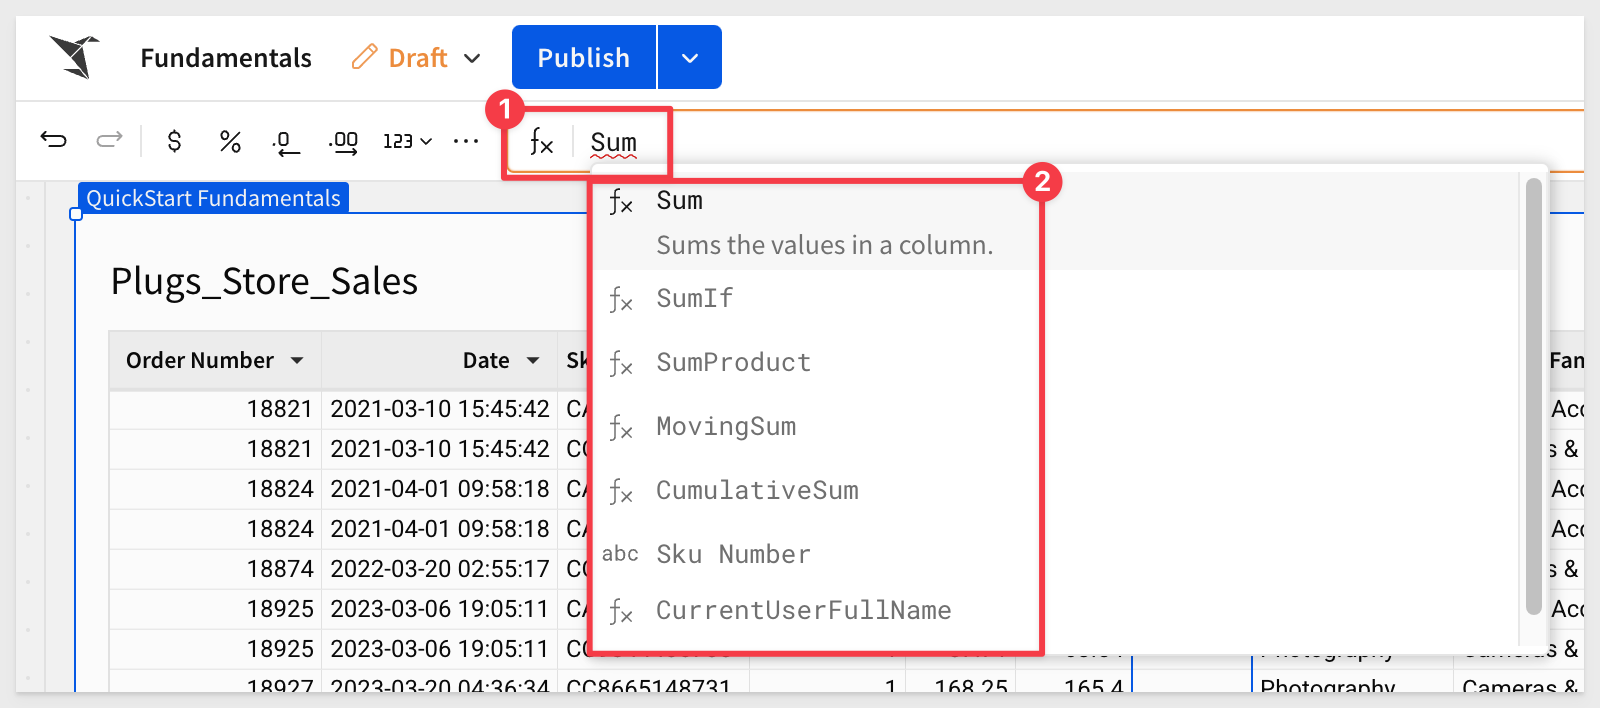
Double-click to rename the new column Sales.
In the formula bar, start typing Sum. Sigma tries to provide all the possible functions as you type to save you time:
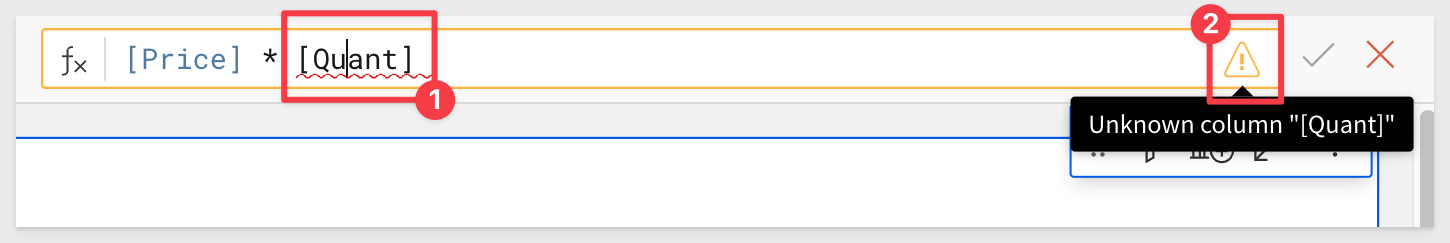
With the Sales column selected, enter the formula:
[Price] * [Quant]
This is an intentional mistake in our formula; Unknown column "Quant"; it does not exist anywhere else in the workbook. What happened?
Sigma makes you immediately aware that the formula has a problem:
Easy to fix, just adjust the column name to Quantity and click the checkmark at the end of the formula bar. Simple!
Now that we have our Sales, we should be able to calculate our COGs.
You can do this one yourself now:
[Quantity] * [Cost]
Do the same to add the Profit column:
[Sales] - [COGs]
We know the profit made for each transaction, but we also are interested to know the Profit Margin percentage on each item.
Add a new column (next to Profit), and use the formula:
[Profit] / [Sales]
Rename the column Profit Margin. In this case, change the formatting to a %.
Some of these functions have been pretty easy, but Sigma is capable of performing the most commonly used functions available in Excel/Google Sheets or SQL.
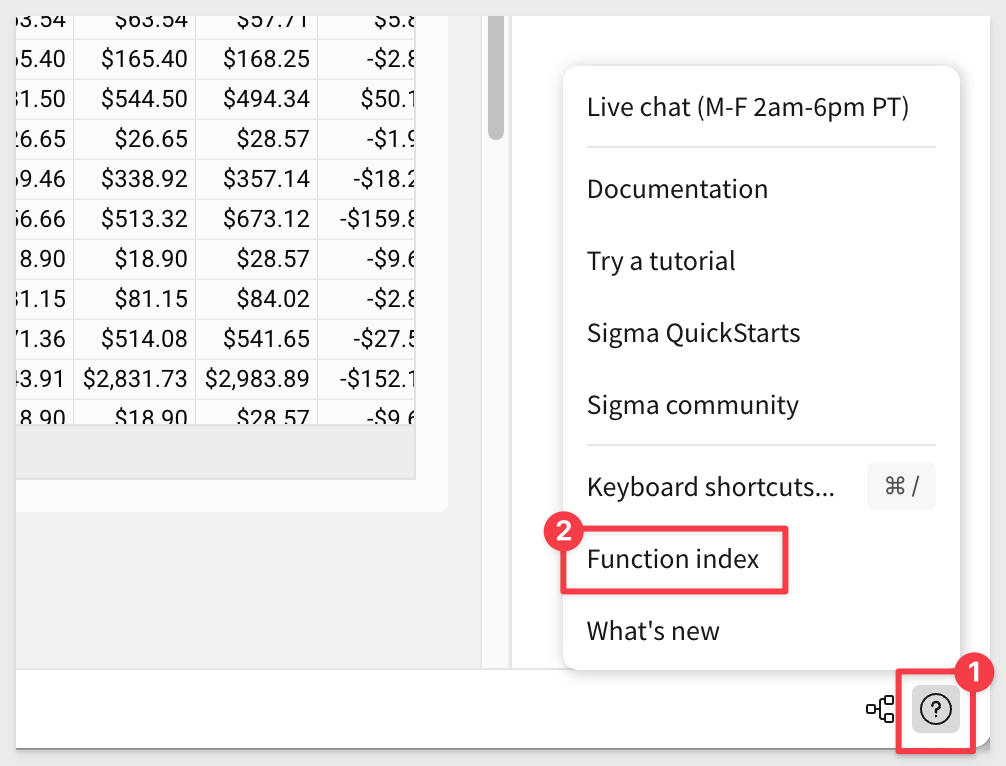
We will get into some more advanced functions later, but you can always check out the complete list by clicking the Help button in the lower right-hand corner and selecting Function Index.
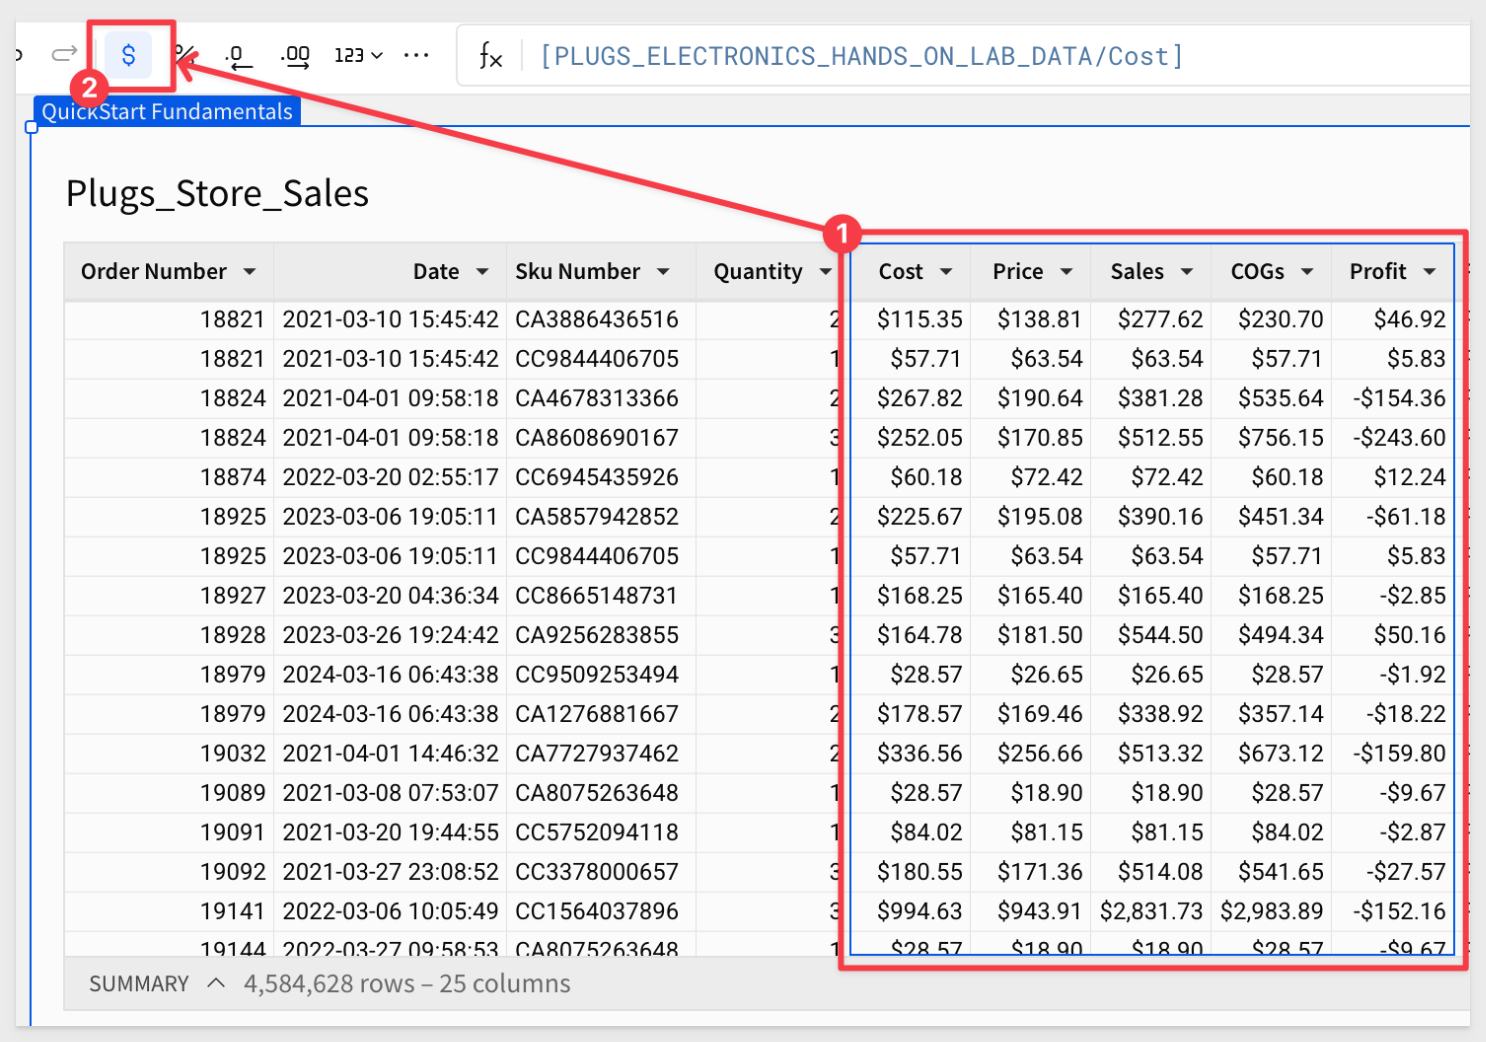
Click the Cost column, hold down the shift key and click the Profit column.
With the five columns all selected, click the $ icon in the toolbar to change them all to currency format:
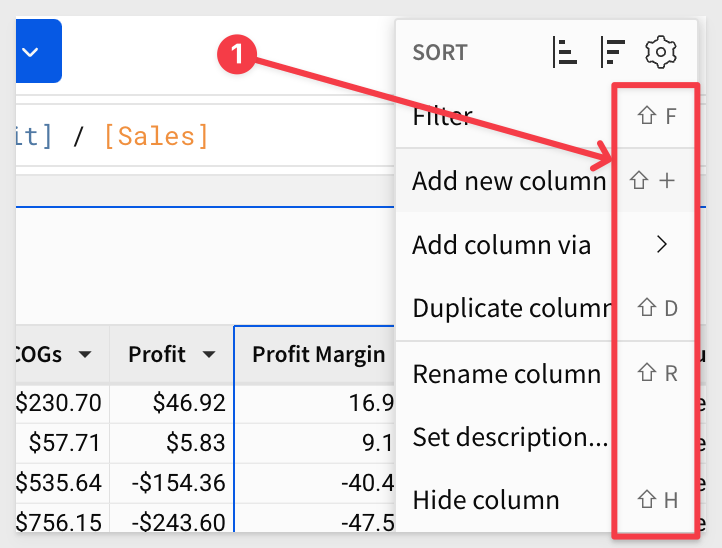
This is a good time to mention that there are many keyboard shortcuts that are available. Users find these incredibly useful for repetitive tasks like adding new columns. Check them out and pick your favorites.
If there is a shortcut, it will also show in the UI like all of these:
Keyboard shortcuts: Microsoft Windows
Click Publish.
Simple Date Handling
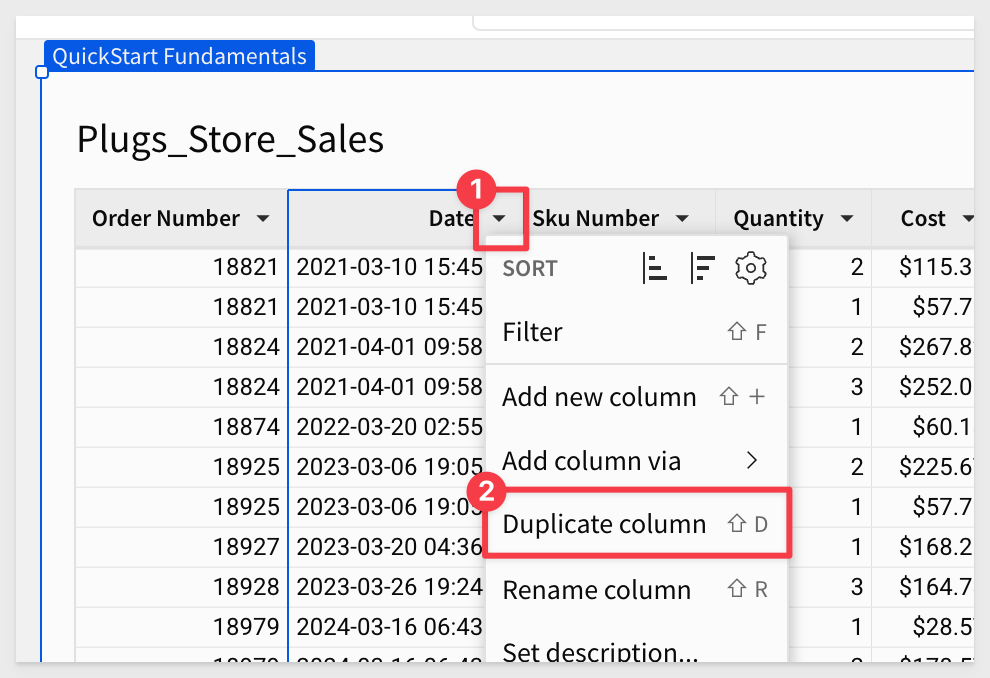
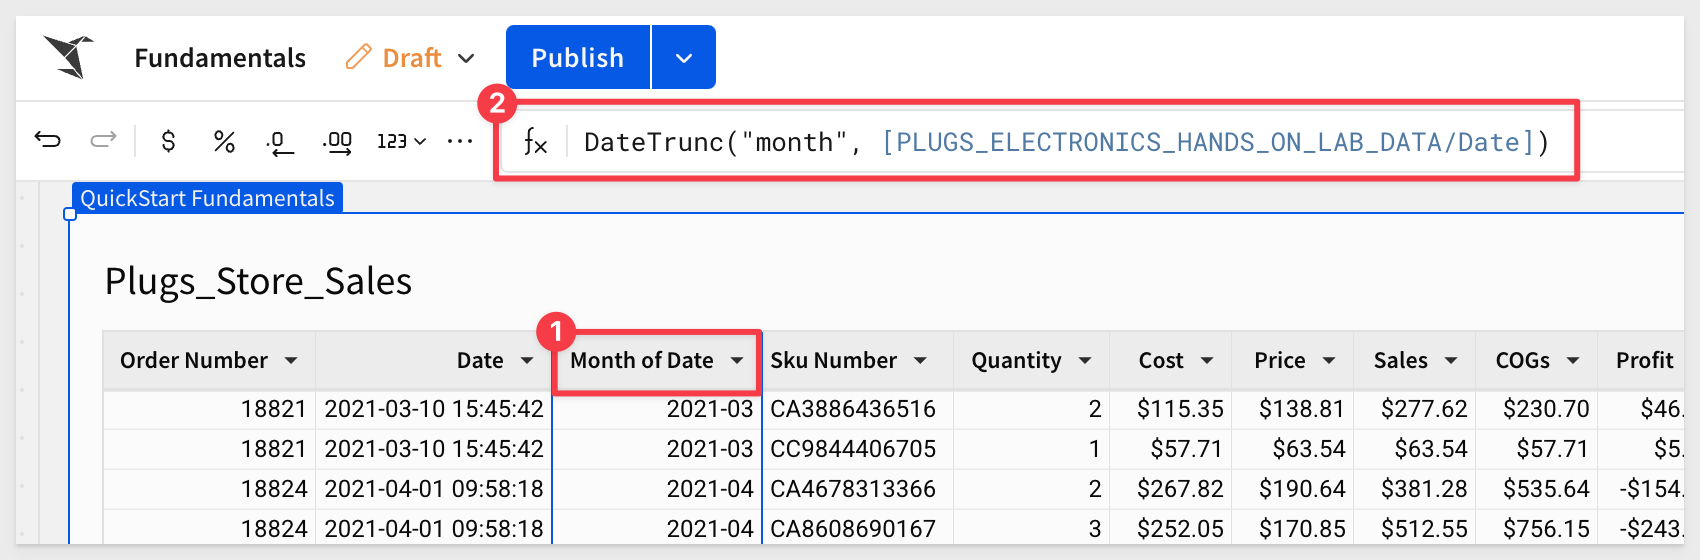
Open the Date column's menu and select Duplicate column:
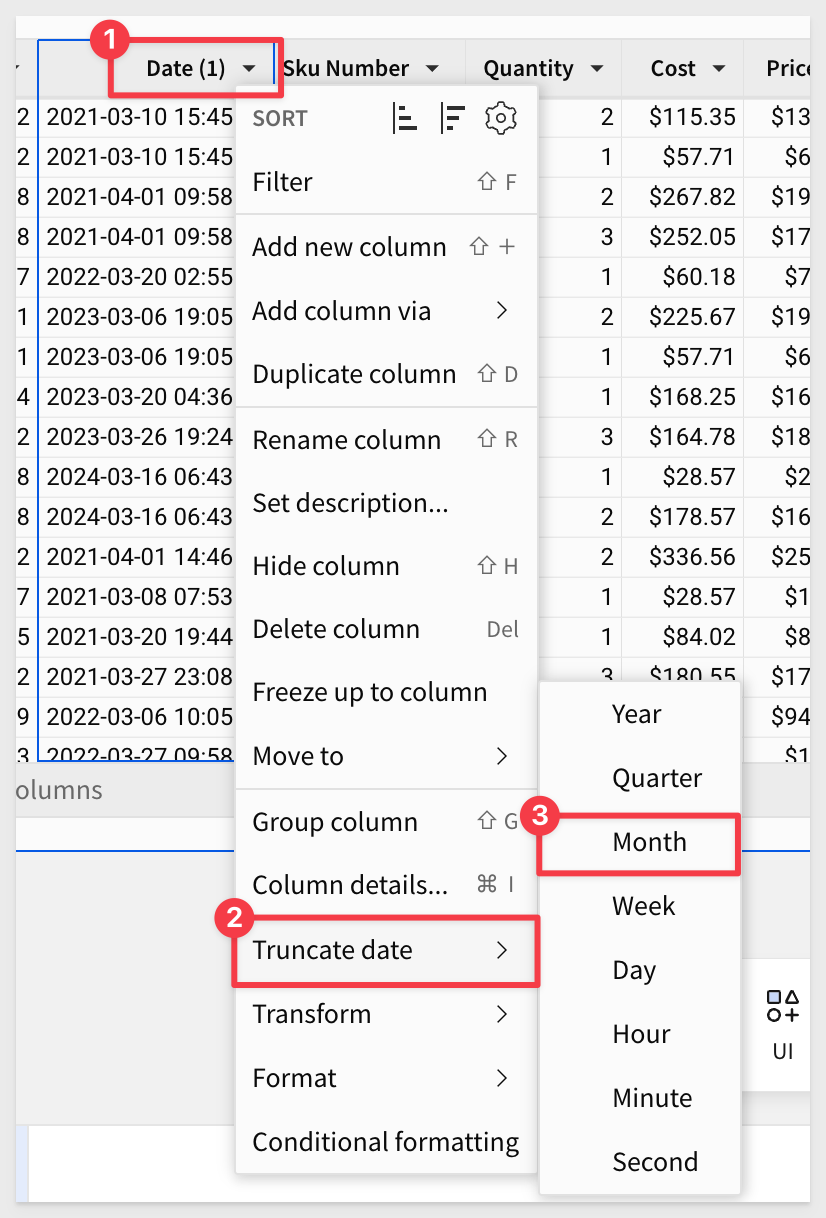
Sigma names the new column Date (1). Open the menu for Date (1)'s and select Truncate date > Month:
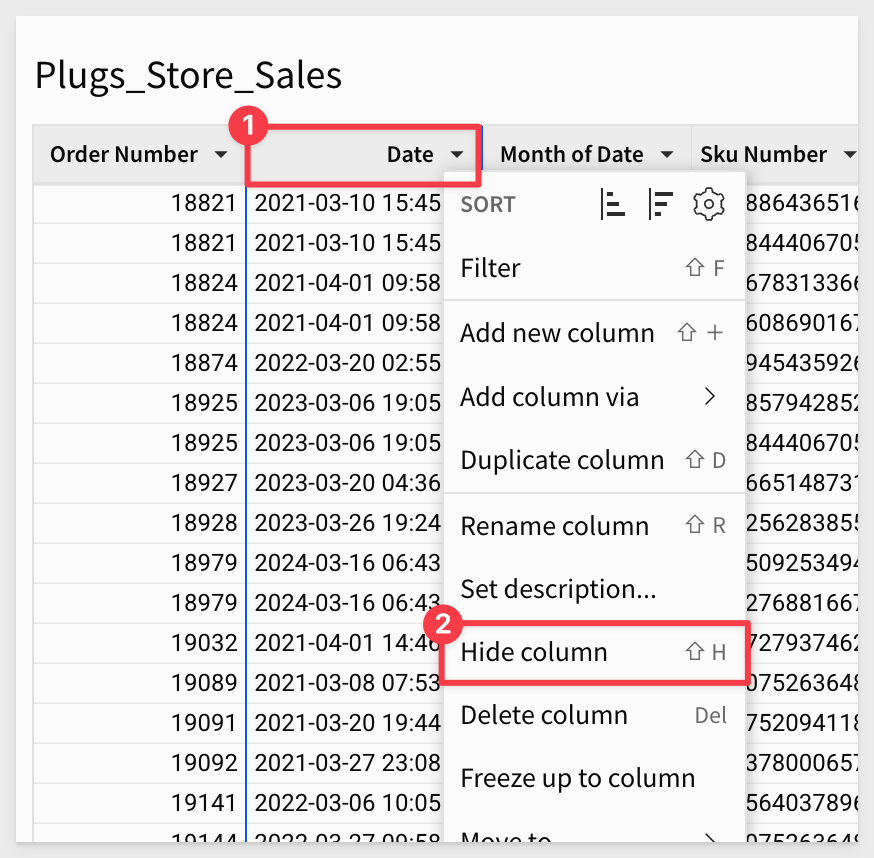
We are not really concerned with the original Date column, so let's just hide that:
Up to now we have not done anything in the Element panel but all the same operations (adding columns, configuring them, etc.) can be done there as well.
We will use the element panel to reorder a few columns. This can also be done using the table itself; your choice:
The final column order doesn't matter since this table serves as the source for other pages. As long as it contains the necessary data, we can use it however we like on any page in the workbook.
Column details
Let's say we want to see the average sale value and the largest sale.
Open the Sales column menu and select Column details to see:
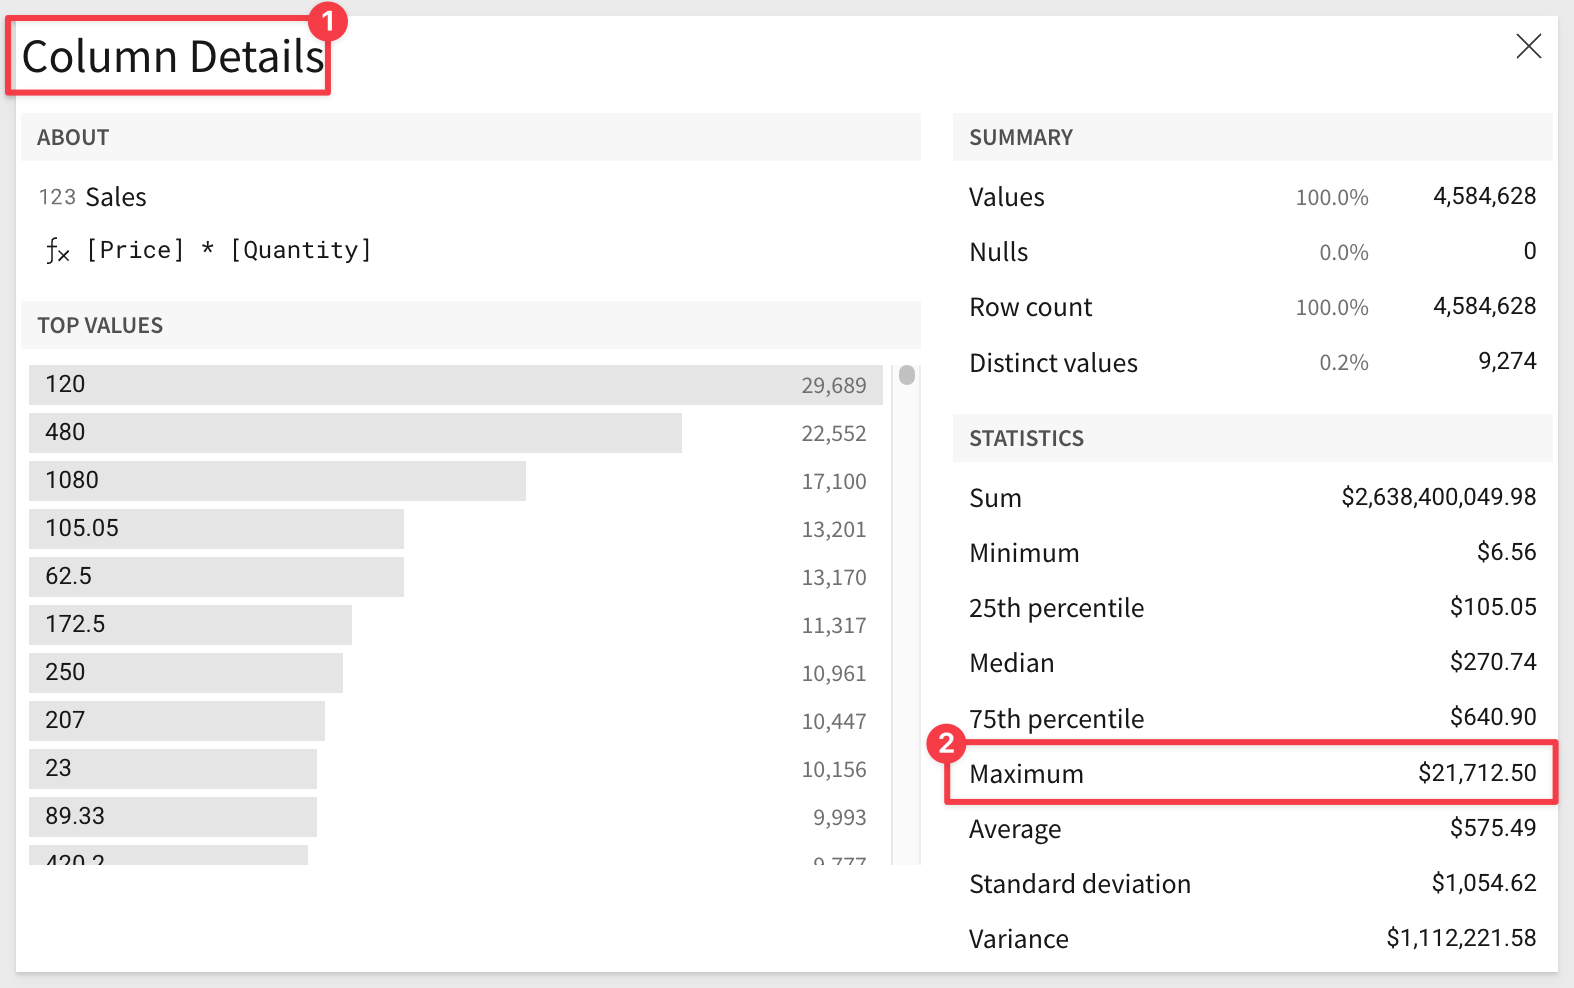
This is a really useful feature that quickly uncovers some of the key values of interest, with minimum effort.
Click Publish.
Organize columns into folders
Many customers have tables that are very wide (many columns). We can make columns easier to find by using [Folders]() to organize them logically.
For example, our table has several columns related to product:
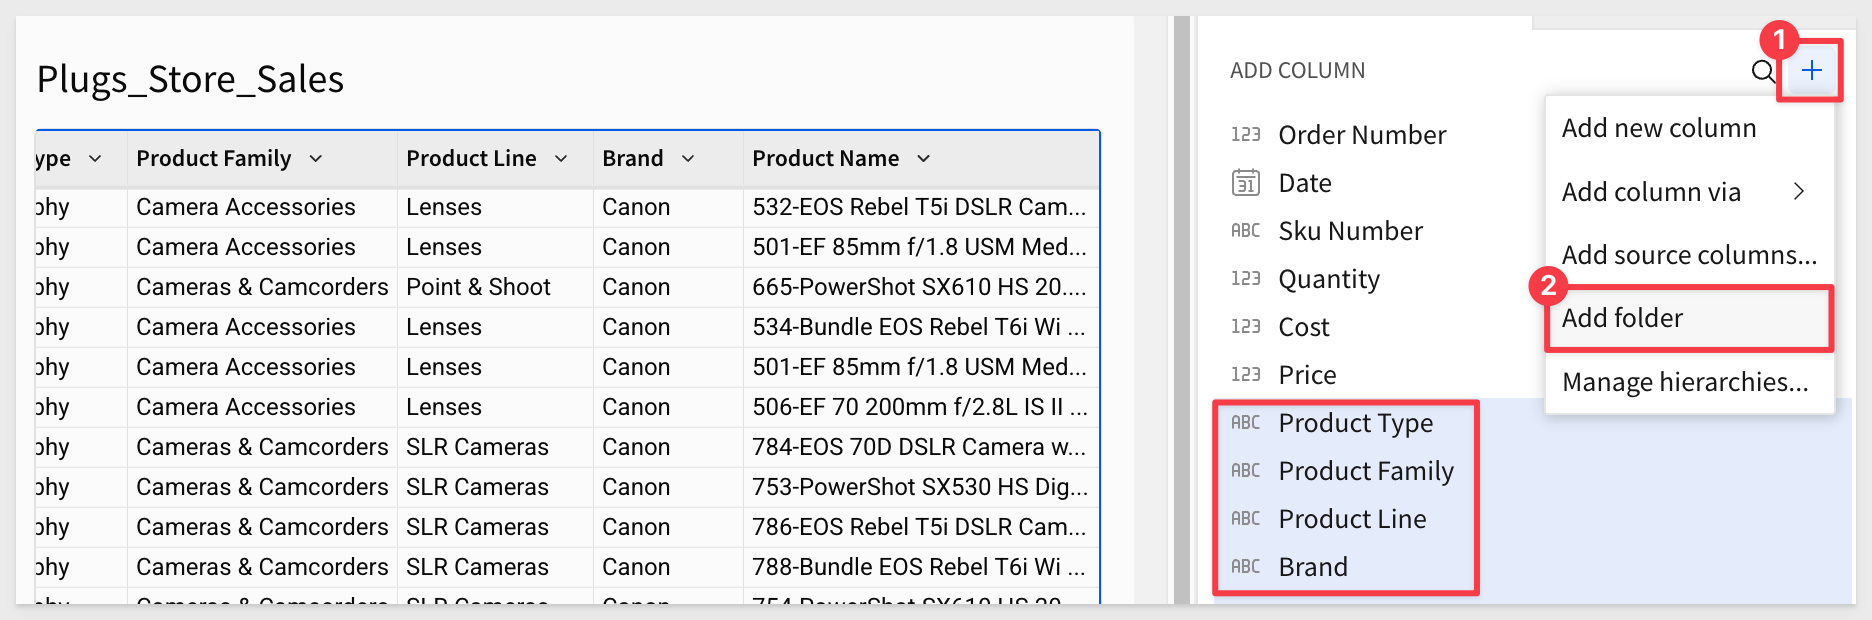
We can add a new folder named Product and move (drag and drop) all the related columns into the new folder:
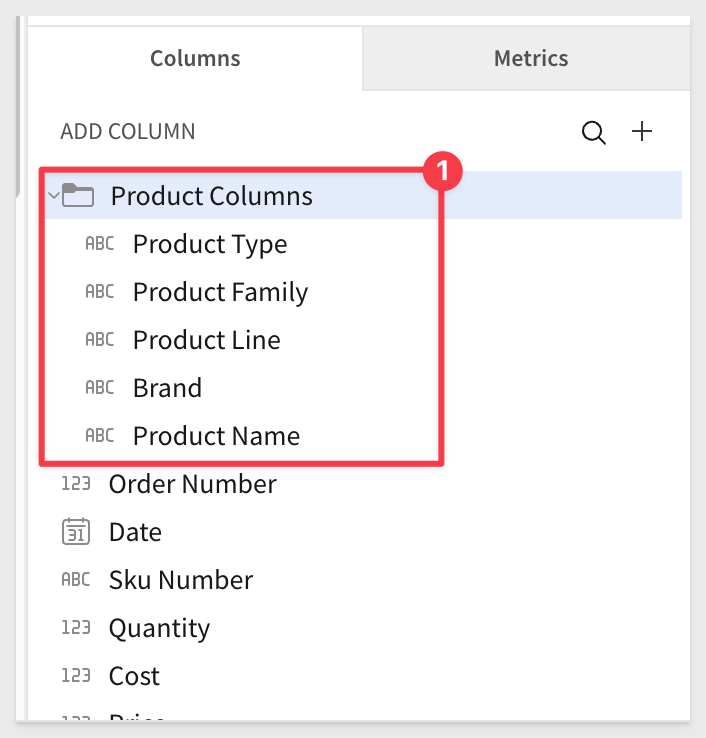
Now that we know some of the basics, let's look at the common ways tables are used in Sigma.

Sigma also has the ability to easily filter any type of data.
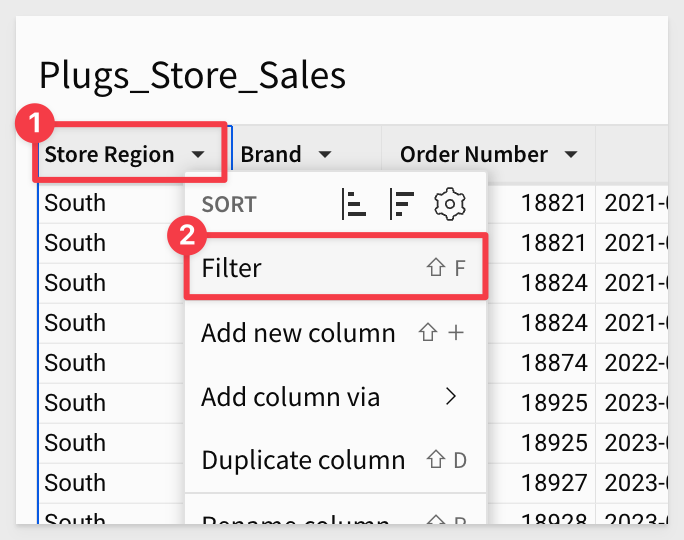
Let's filter for only stores in the East region.
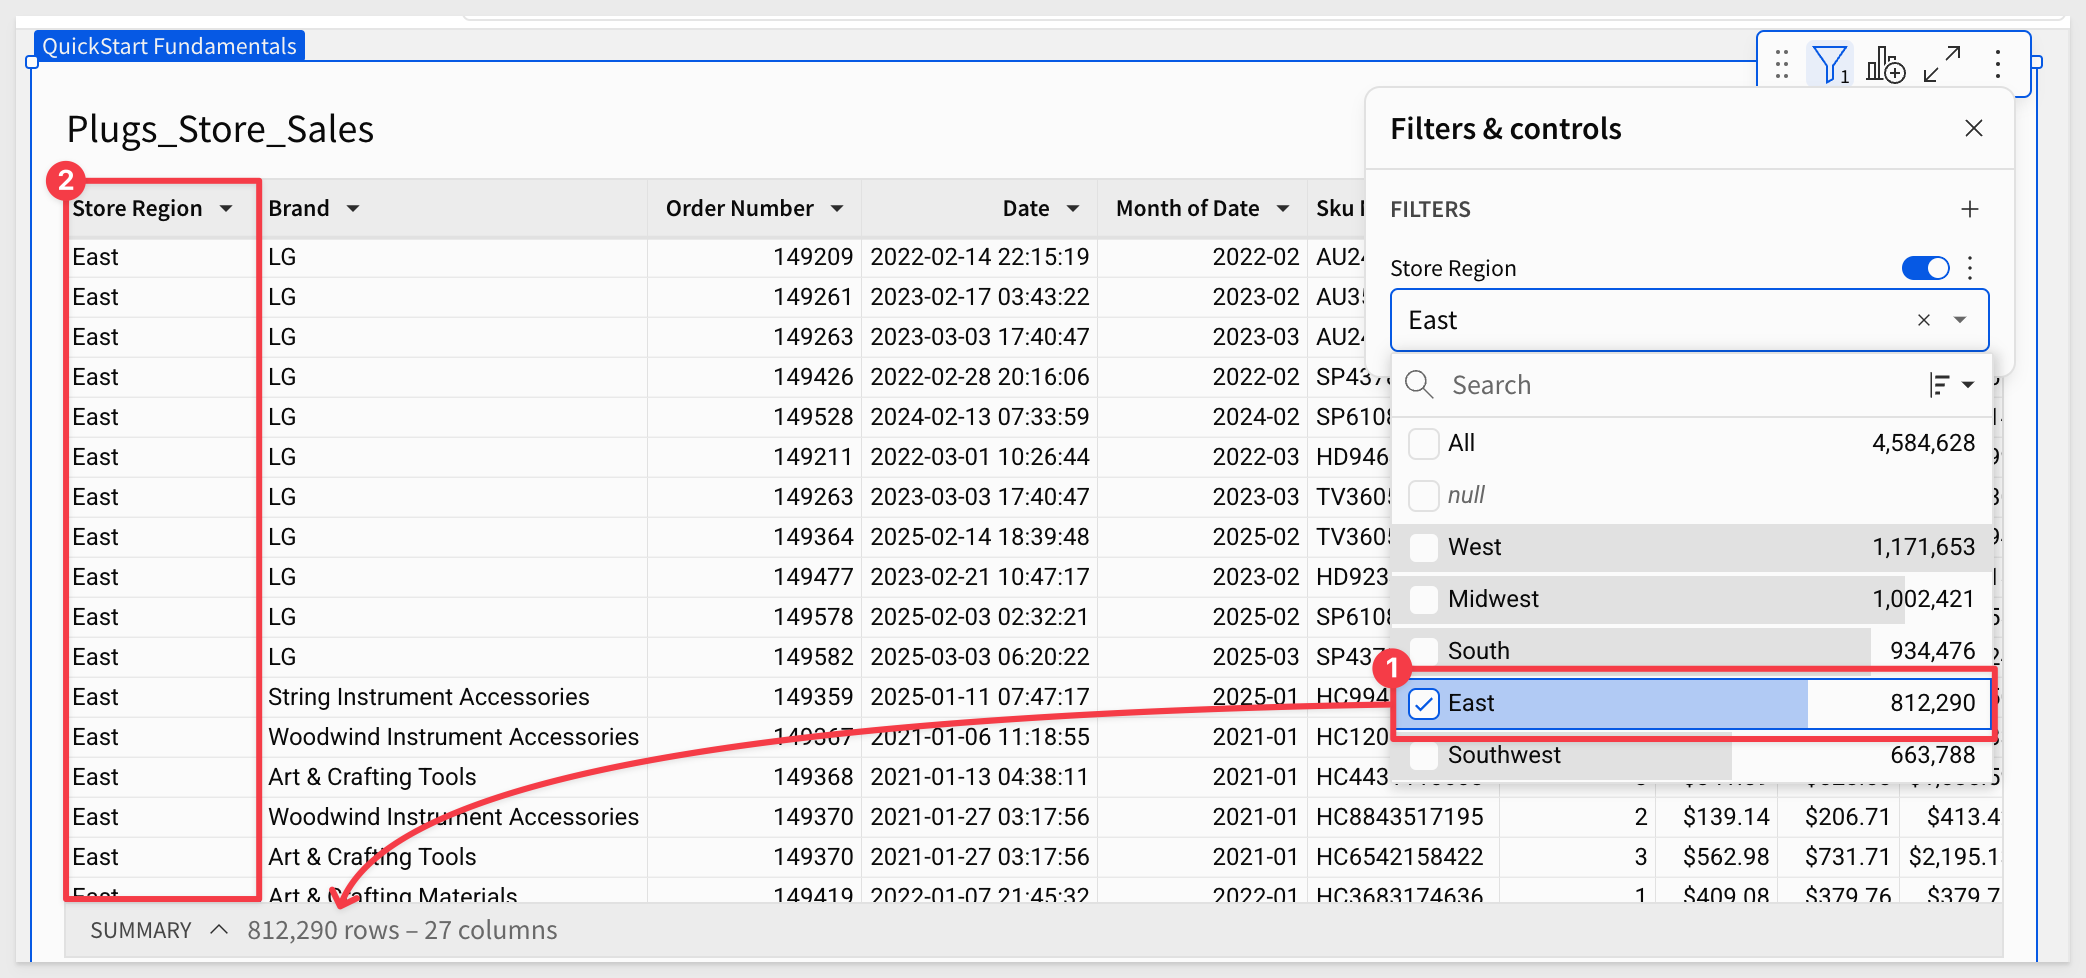
Click on the Store Region column and select Filter:
Notice that a FILTERS & CONTROLS panel opens and it auto-populates with the available distinct list of Store Regions:
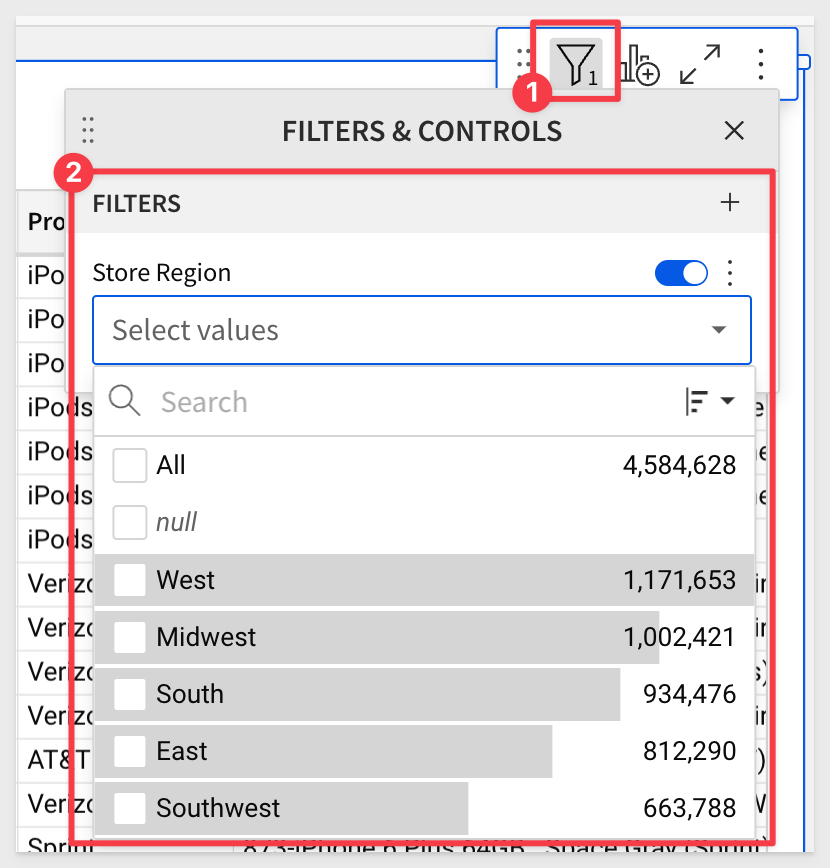
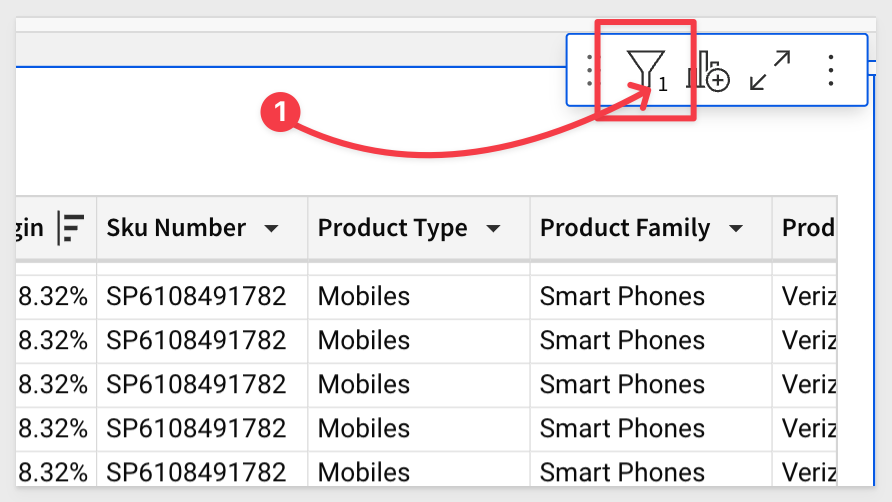
Also notice that there is a small filter icon (#1) with a 1 next to it. This lets you know that the table has a filter set against it. This will come in handy as we work.
Click the checkbox for East and see the table update for just the East region:
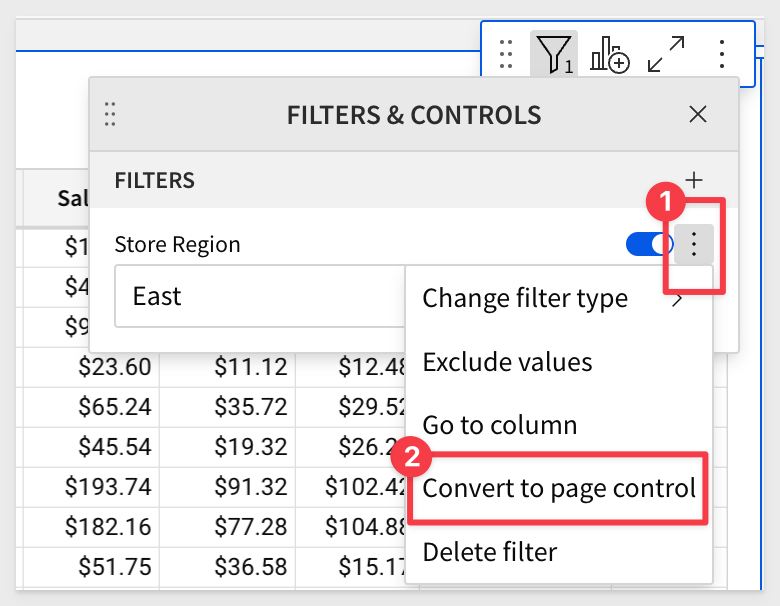
Wouldn't it be great if I could just have this filter as a dropdown on the page? No problem.
Just click the vertical 3-dots and click Convert to Page Control.
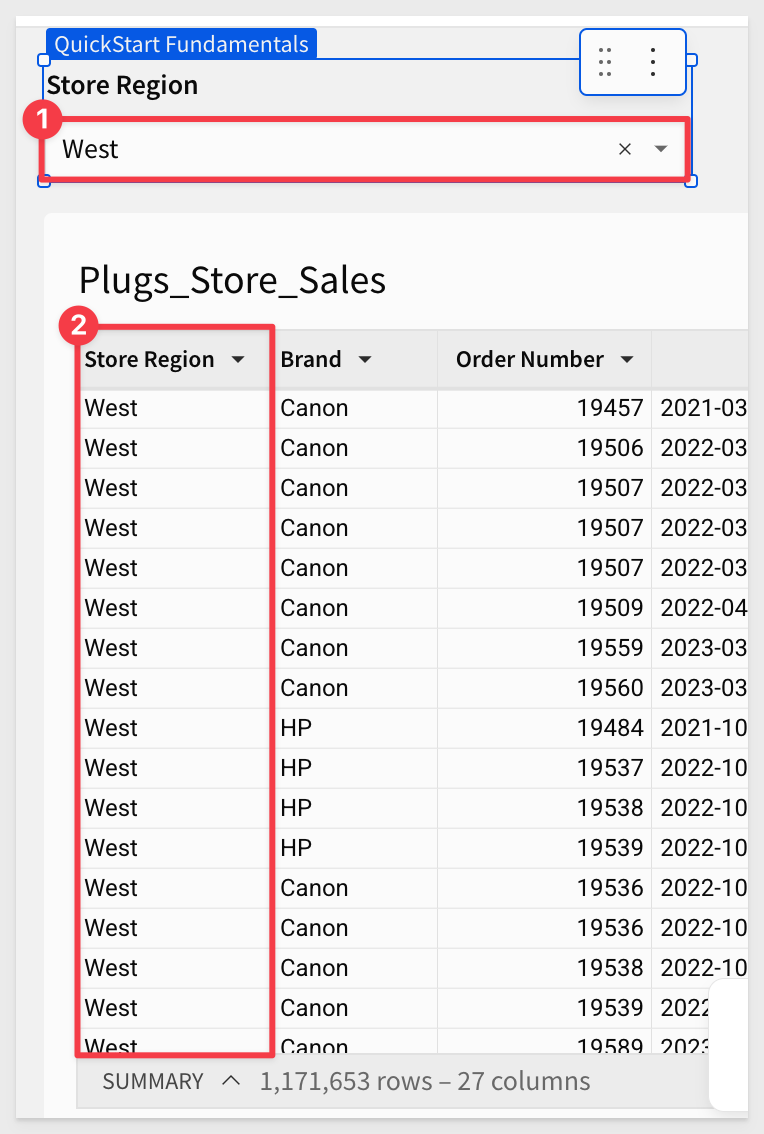
Now the table can be filtered from East to West by using the dropdown filter list as shown below:
It is really easy to resize elements and move them around on the canvas. Feel free to explore doing that until you get comfortable.
More Filters
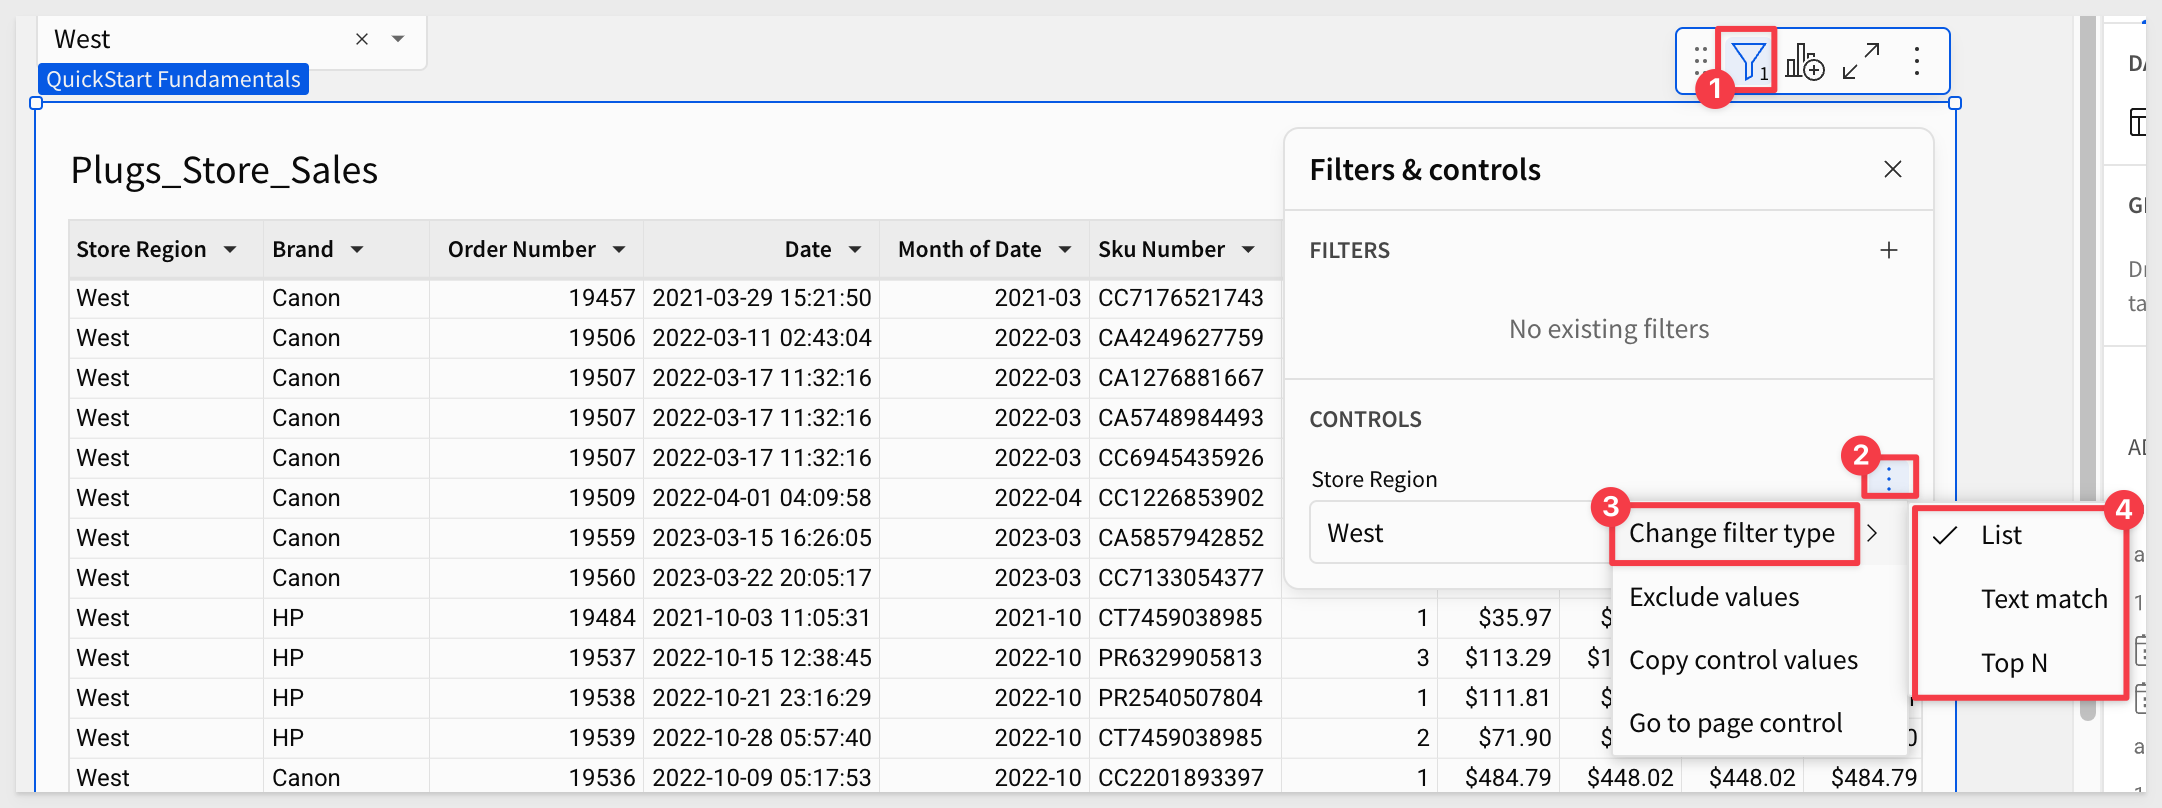
The filter control provides more functionality we want to touch on.
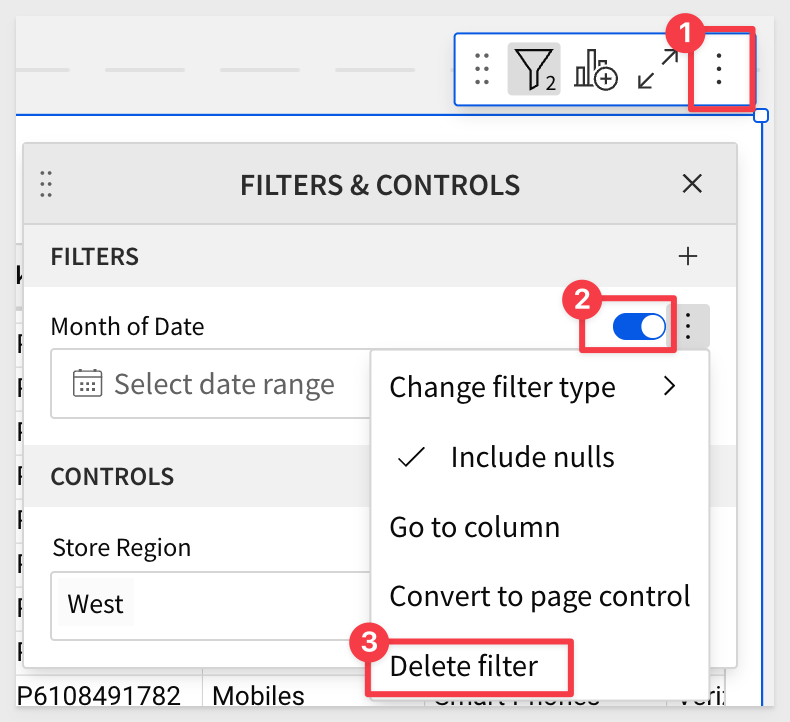
Setting different filter types is really easy by accessing the filter menu:
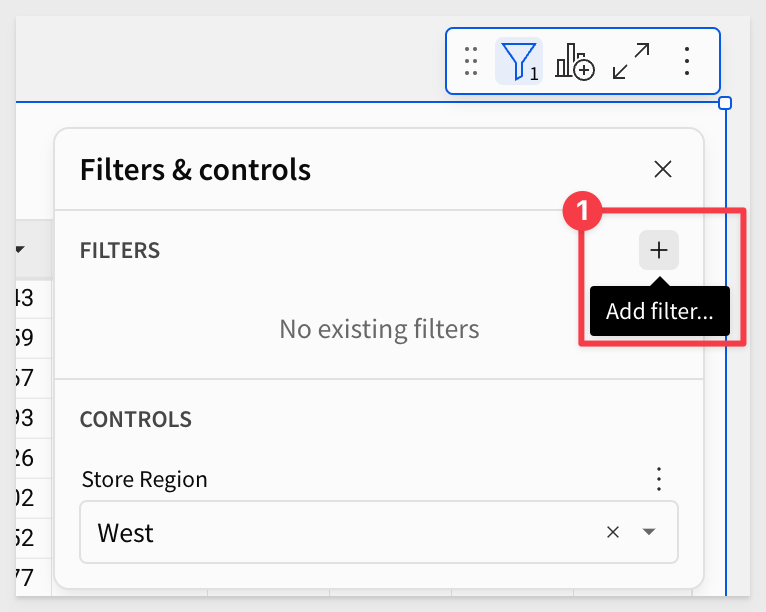
You can add more filters by clicking on the + button here:
For example, if we select the hidden column Date in the element panel, open its menu and select Filter, Sigma knows that is a date column, and provides filtering options based on that.
Let's set the table to just show year-to-date rows:
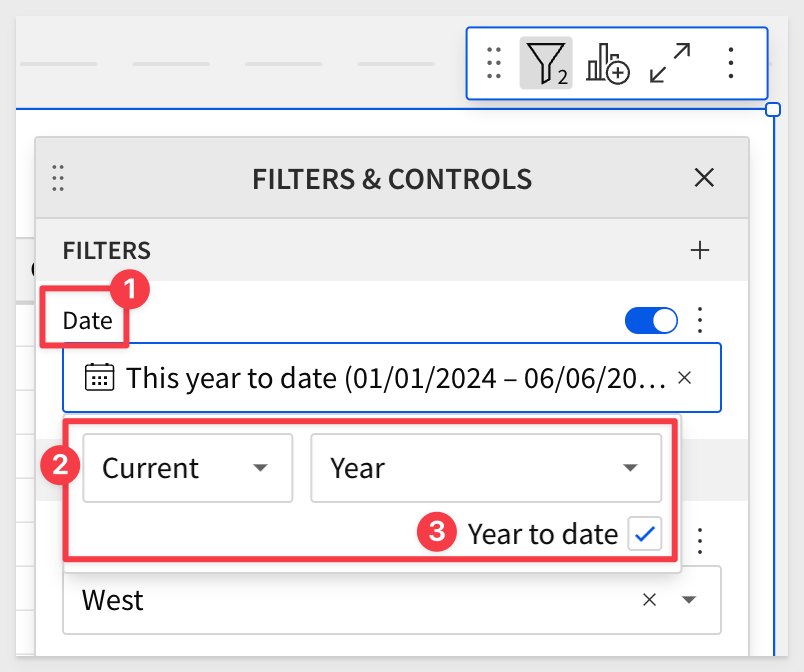
Filters can be deleted (#3) or disabled temporarily (#2) easily:
Go ahead and click the x in the Store Regions control to show all regions:
For more information, see Filter data in data elements
There is also a great community post that details some ways to best use filters in Sigma.
Click Publish.
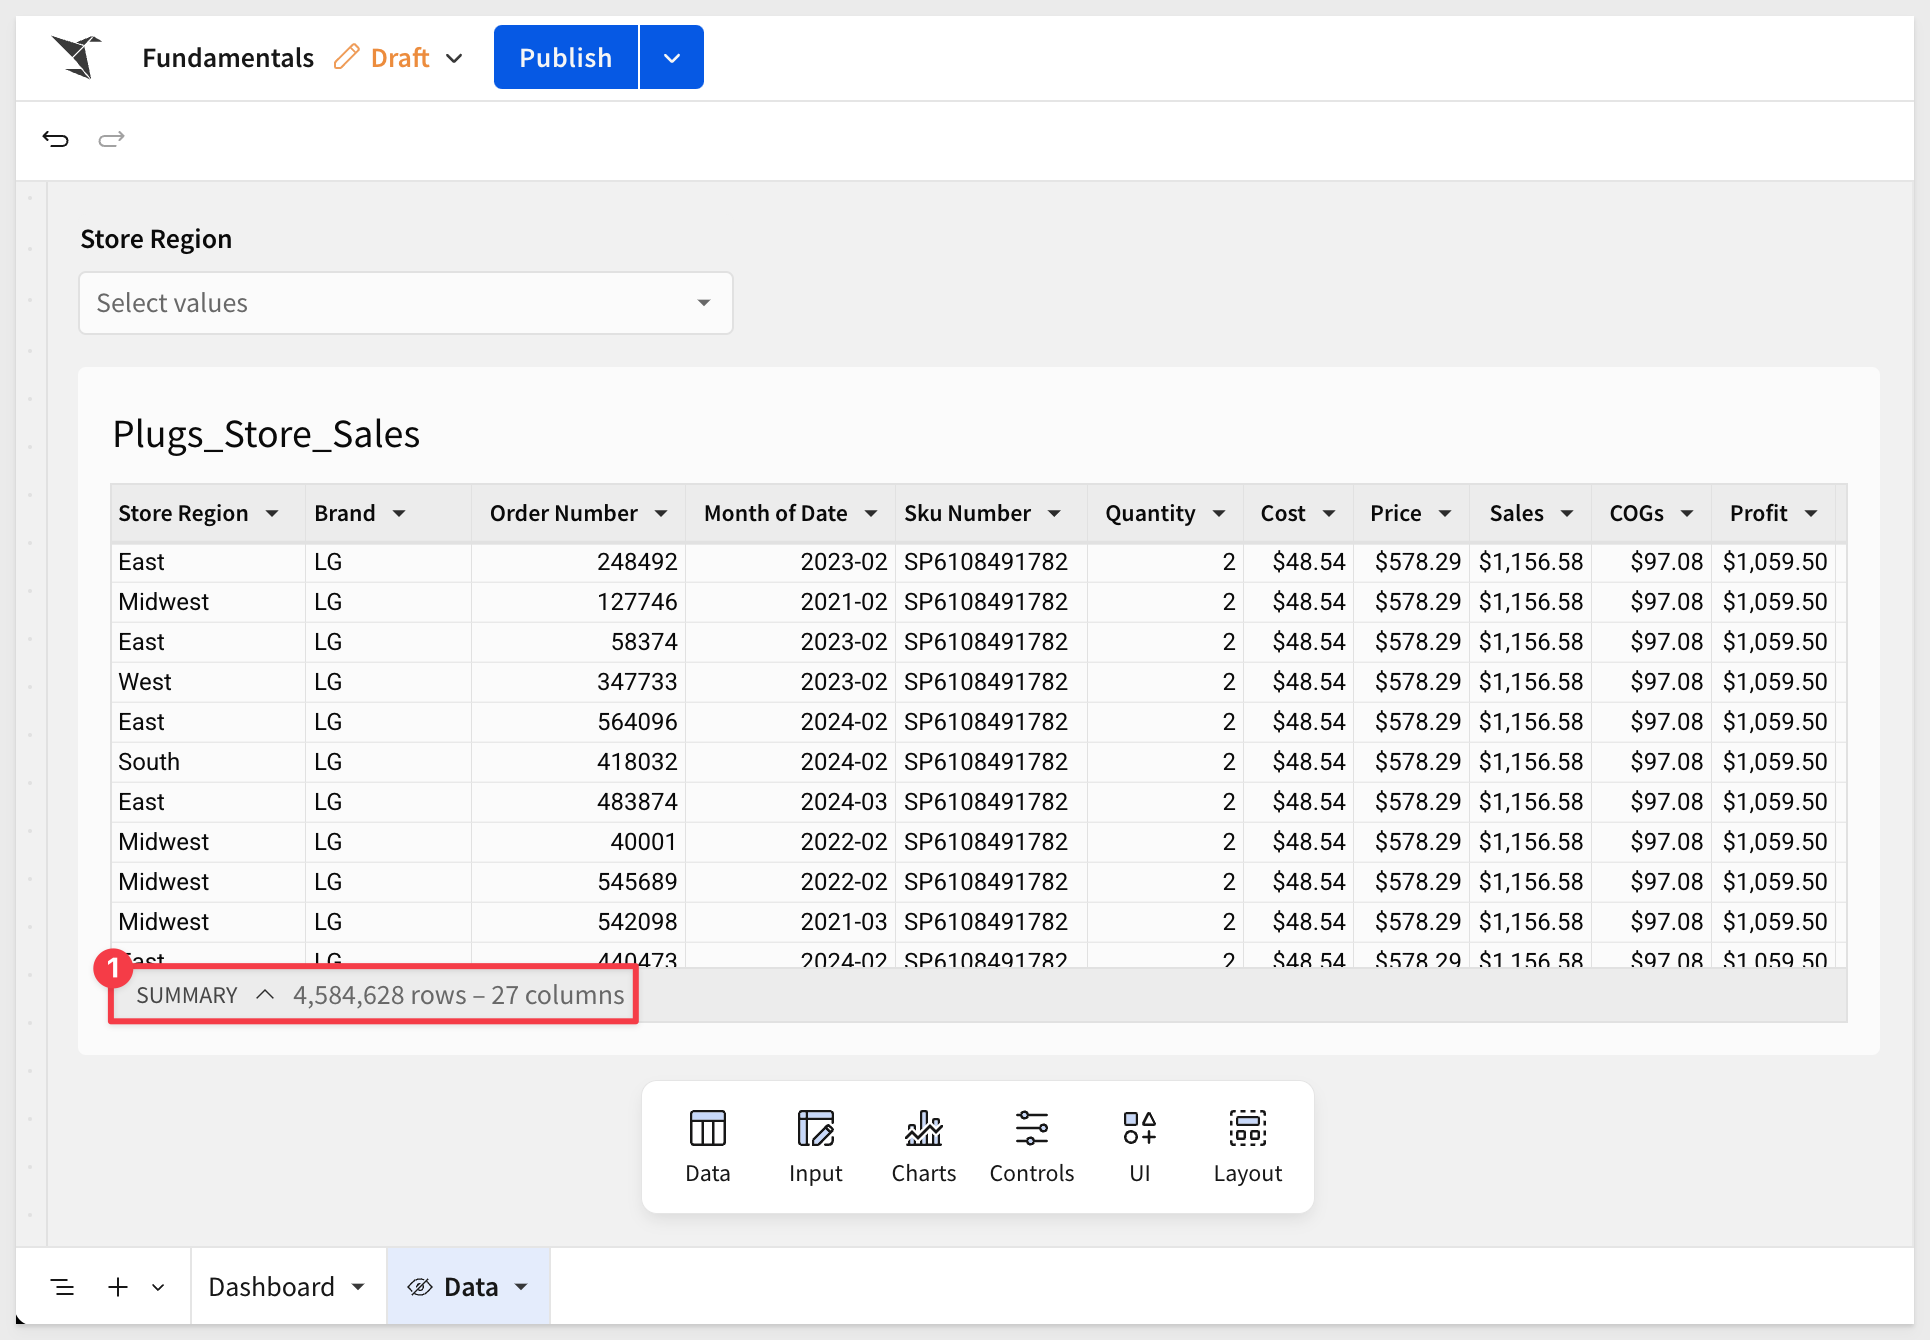
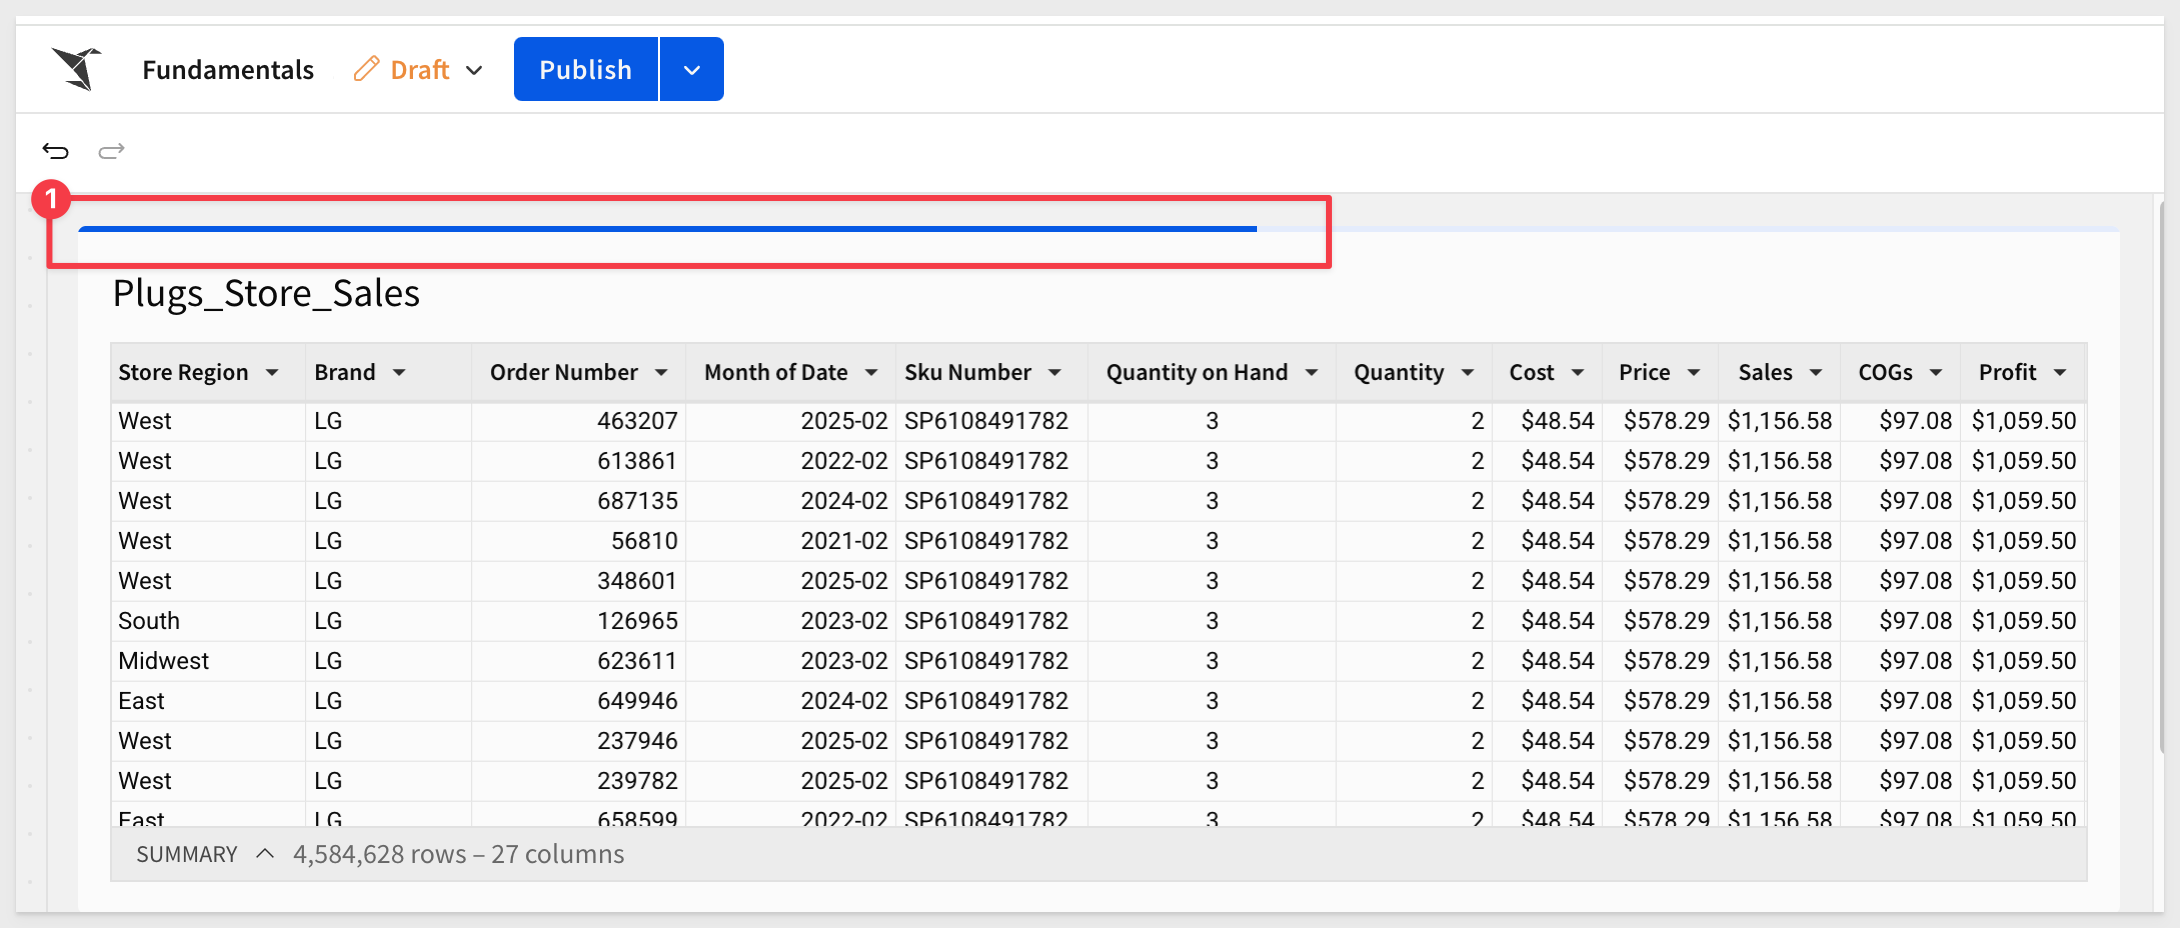
At this point, our data page looks like this (still in edit mode), with about 4.58M rows:
Before we make any other changes, let's rename the Dashboard page to Fundamentals 2. This will allow us to have a page for each of the fundamental QuickStarts, and be able to refer to them if you need to later.
We don't want to make any more changes to the table on the Data page. Instead, we want to use it as the source for other elements we create in the workbook.
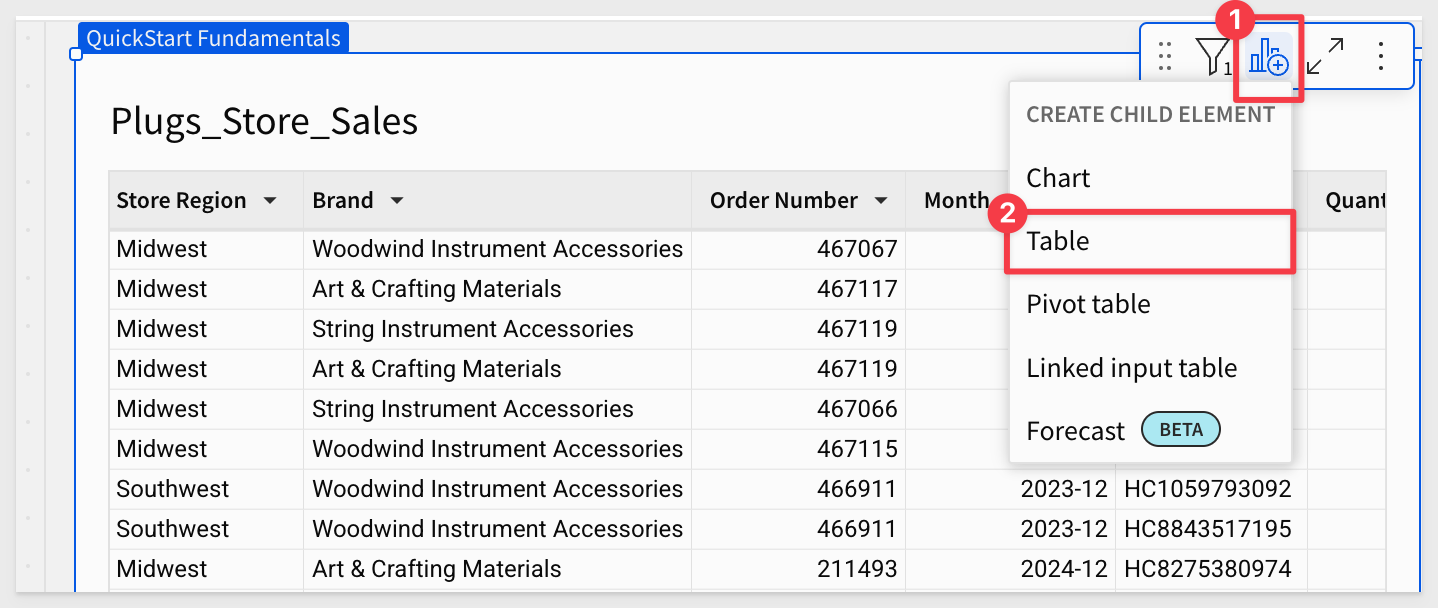
On the Data page, open the Plugs_Store_Sales table menu and create a new Child table from it.
Move the child table and the Store Region control to the Fundamentals 2 page.
Now we can make changes to the elements on the Fundamentals 2 page and these will simply reference the table on the Data page, which in turn is connected to the warehouse.
There are several ways to sort data in Sigma.
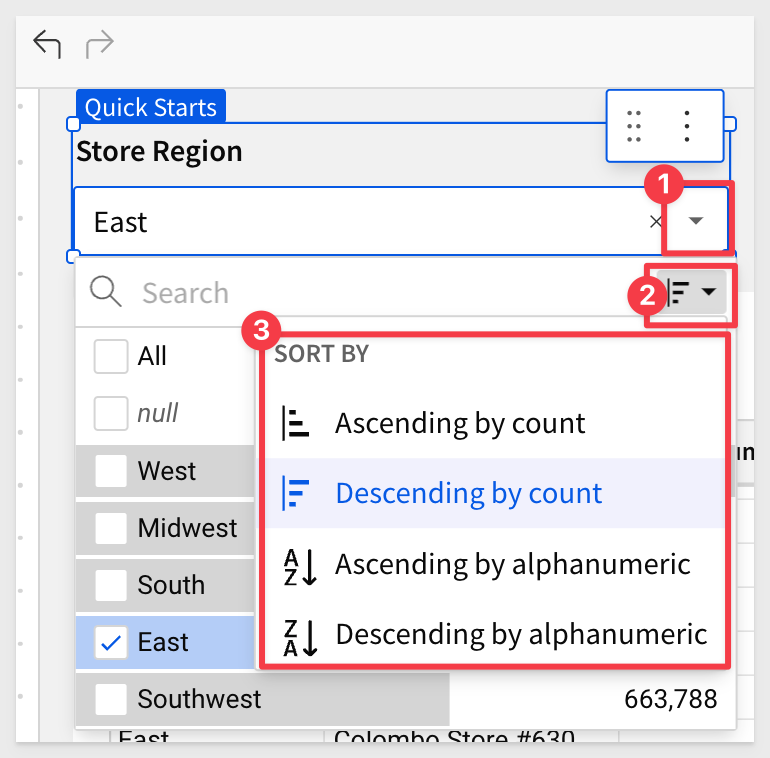
Since we have a page control for Store Regions on the page, we can access the sort options it provides:
Sorting on any column is available by accessing the column's menu:
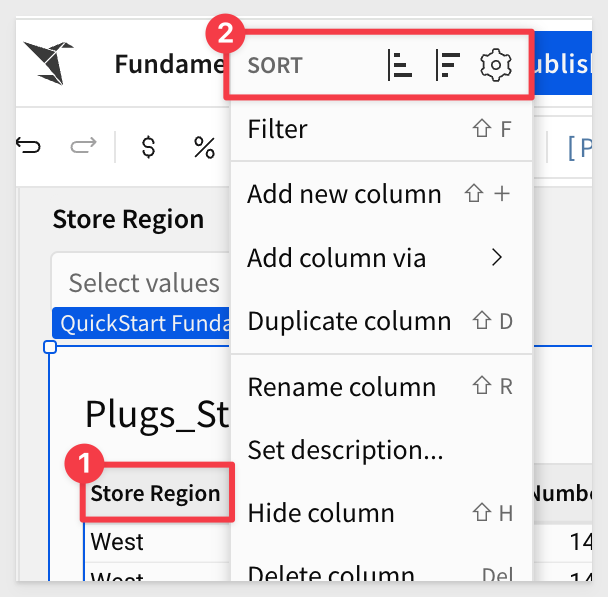
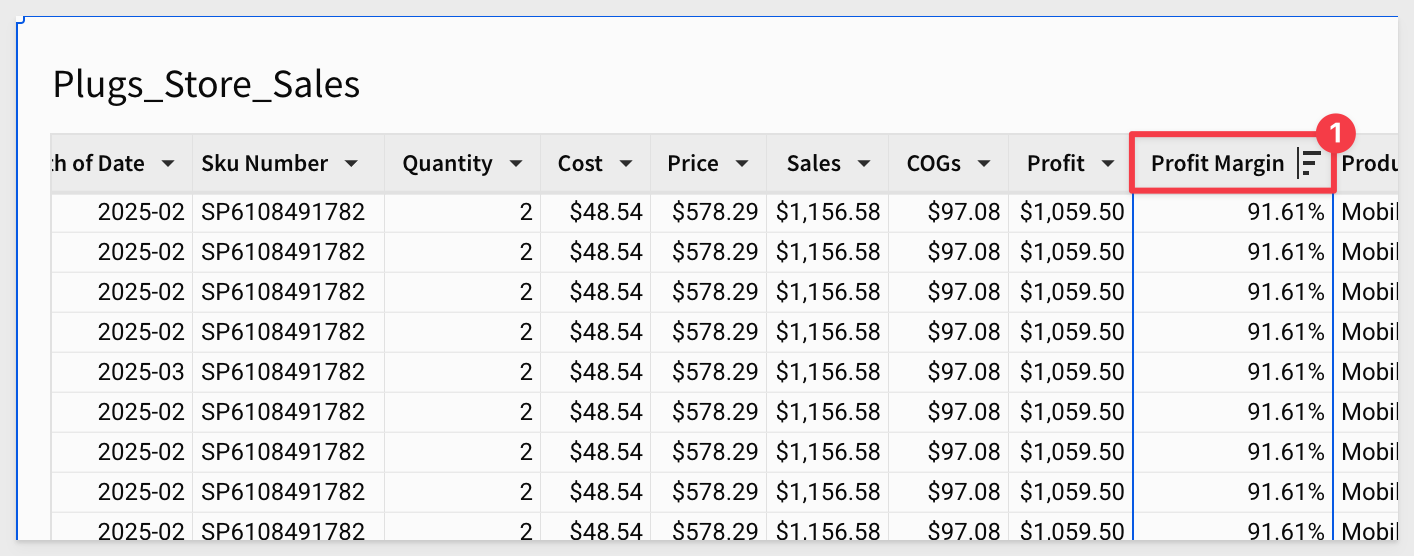
When a column sort order is set, it will display an icon:
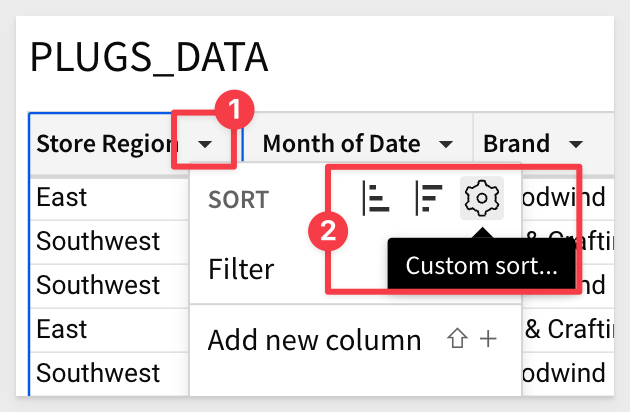
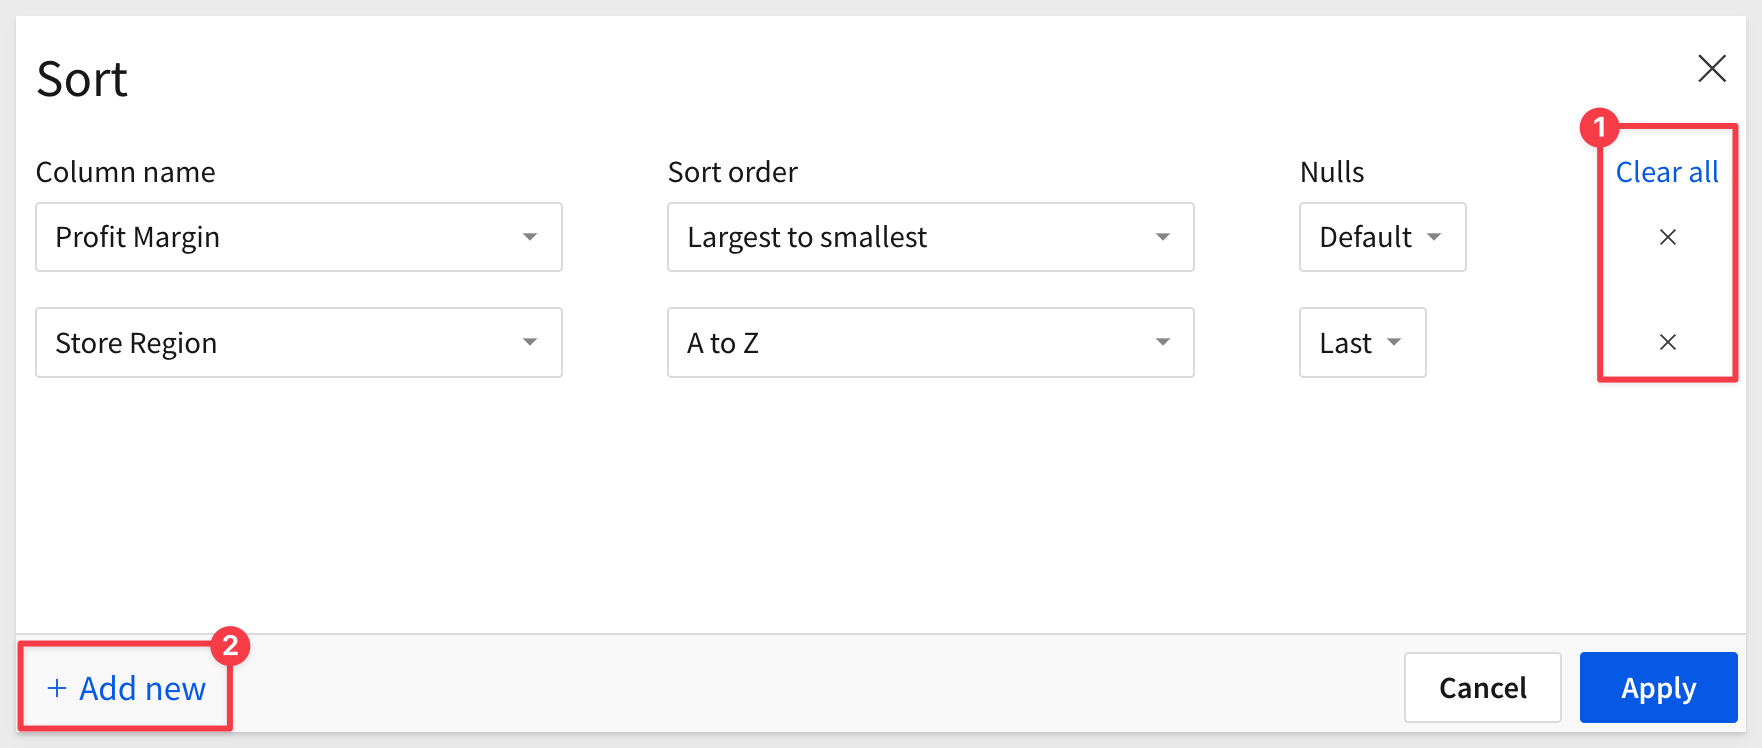
Along with ascending/descending options there is a custom sort that provides a way to create sorts based on multiple columns and orders:
Custom sort example:
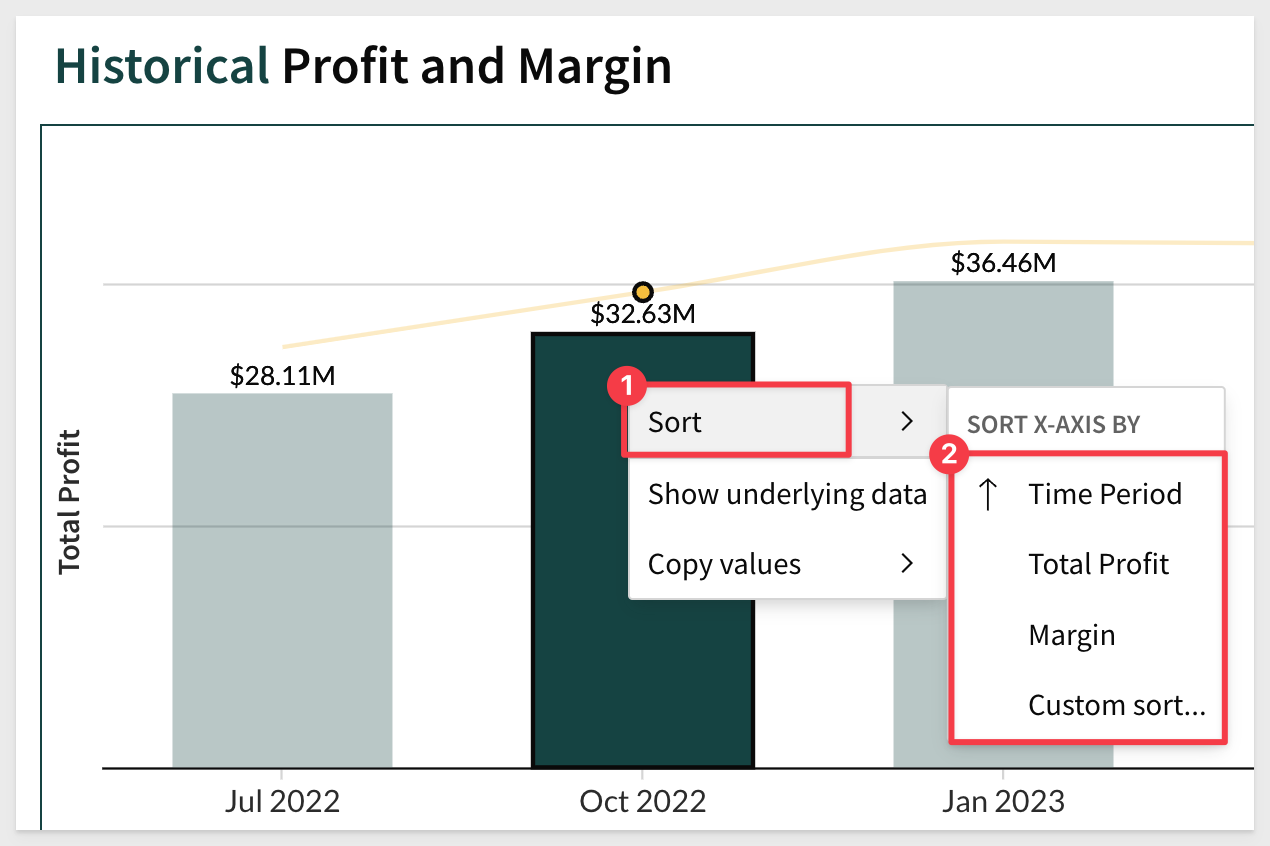
While we have not gotten to charts yet, it is good to know that sort can be applied there as well. Just right-click on any chart bar (for example) and select sort:
At this point (with filters removed), our Fundamentals 2 page looks like this:
So far we have done some pretty simple operations.
Let's go a bit deeper and group the data.
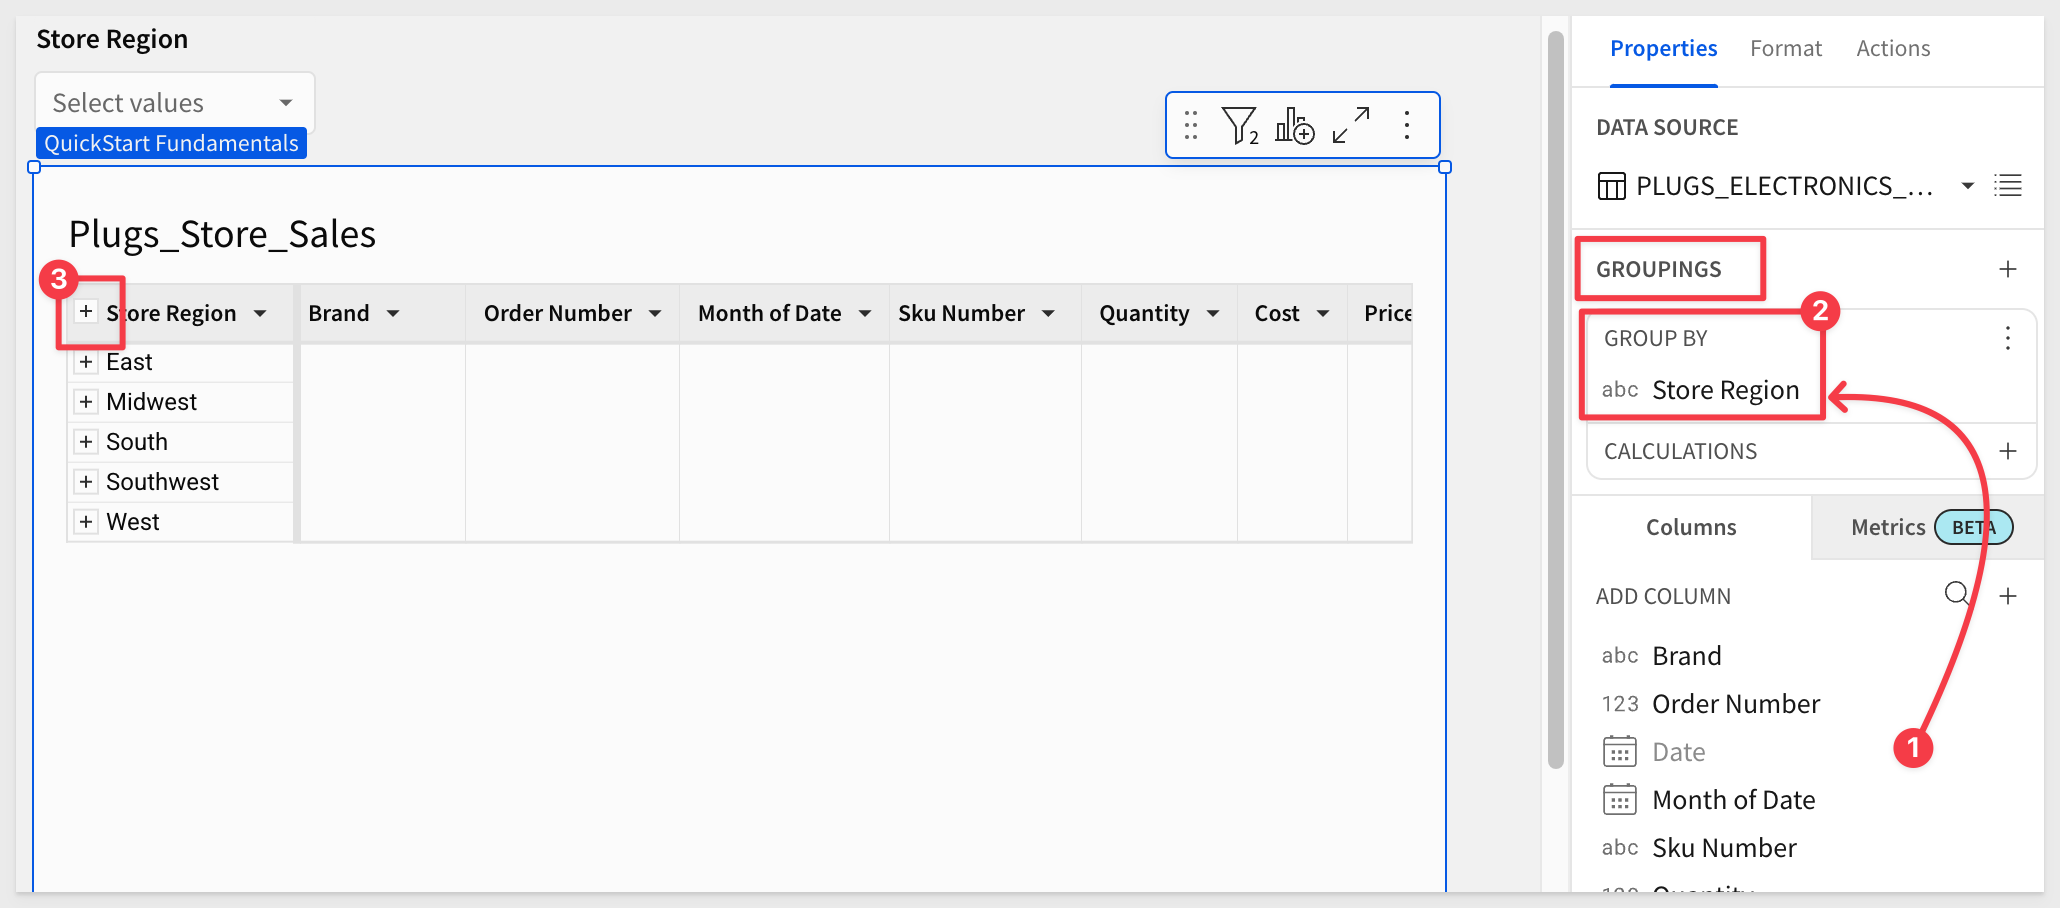
There are a few ways to group data.
- 1: The specific column's menu in the table.
- 2: Drag and drop a column using the element panel.
- 3: Click the
+icon in theElement panel>GROUPINGSto add a column.
Group by Store Region
Group the Store Region column using one of these methods, or use one method, undo that and try another.
Whichever method works best for you is fine.
After grouping, you can collapse the groupings by clicking the - to the left of the Store Region column name (#3).
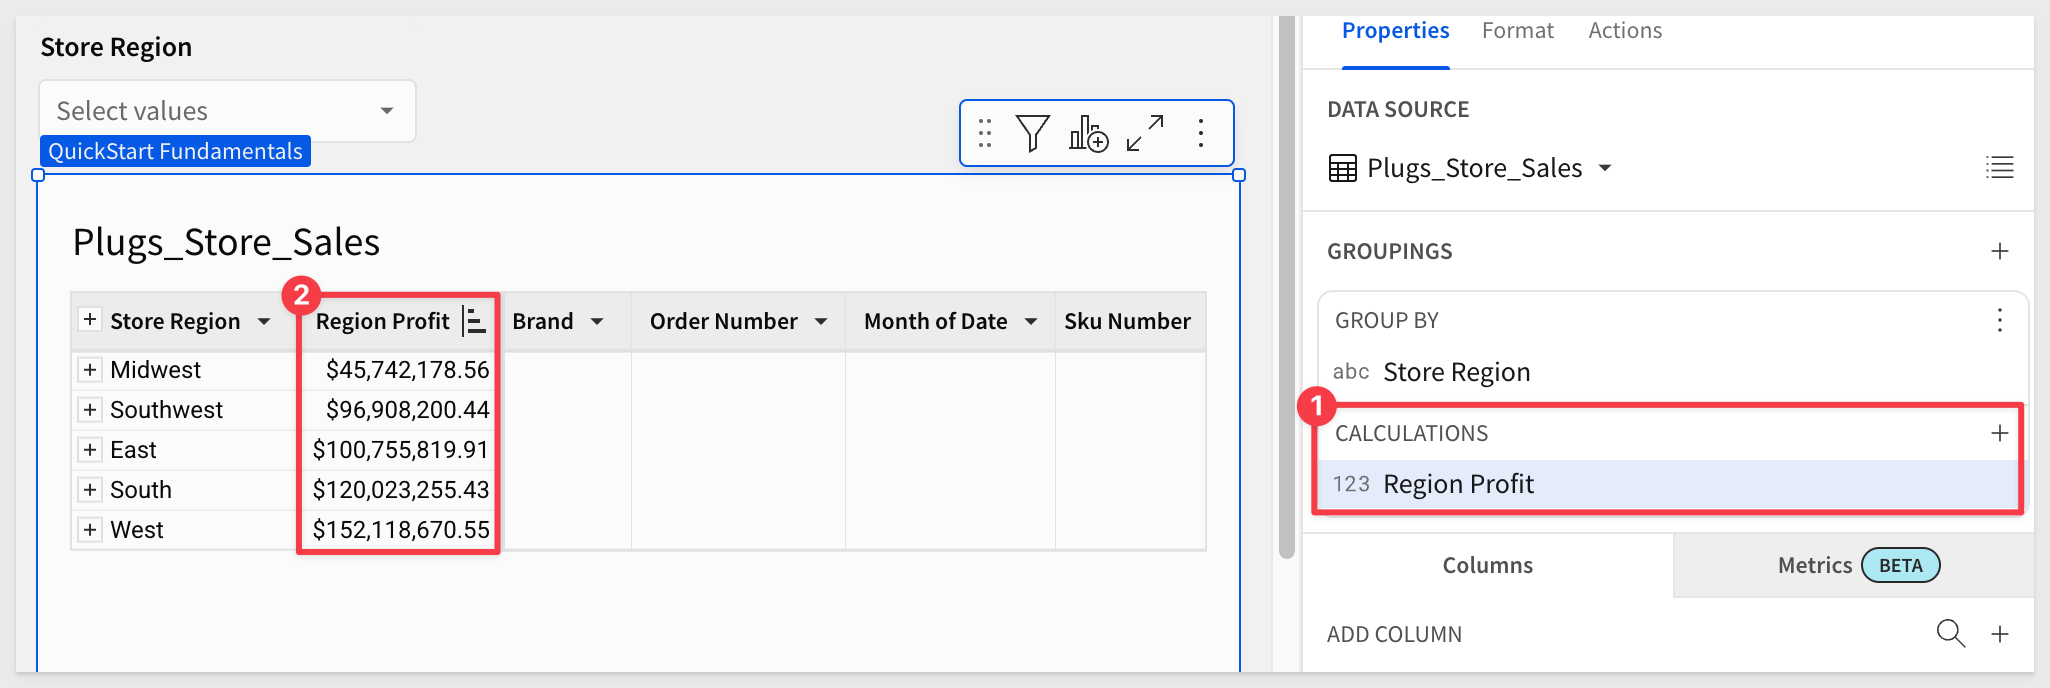
Summarizing Profit
We want to show the sum of profit for each region, and we already have added a calculated column that shows profit per row.
To add this rollup, we simply drag and drop the Profit column in the Element panel and place it in the GROUP BY > CALCULATIONS section of the GROUPINGS panel for Store Region.
Rename the calculation column to Region Profit:
We can add as many groupings and calculations as required.
For more information, see Create and manage tables
Click Publish.
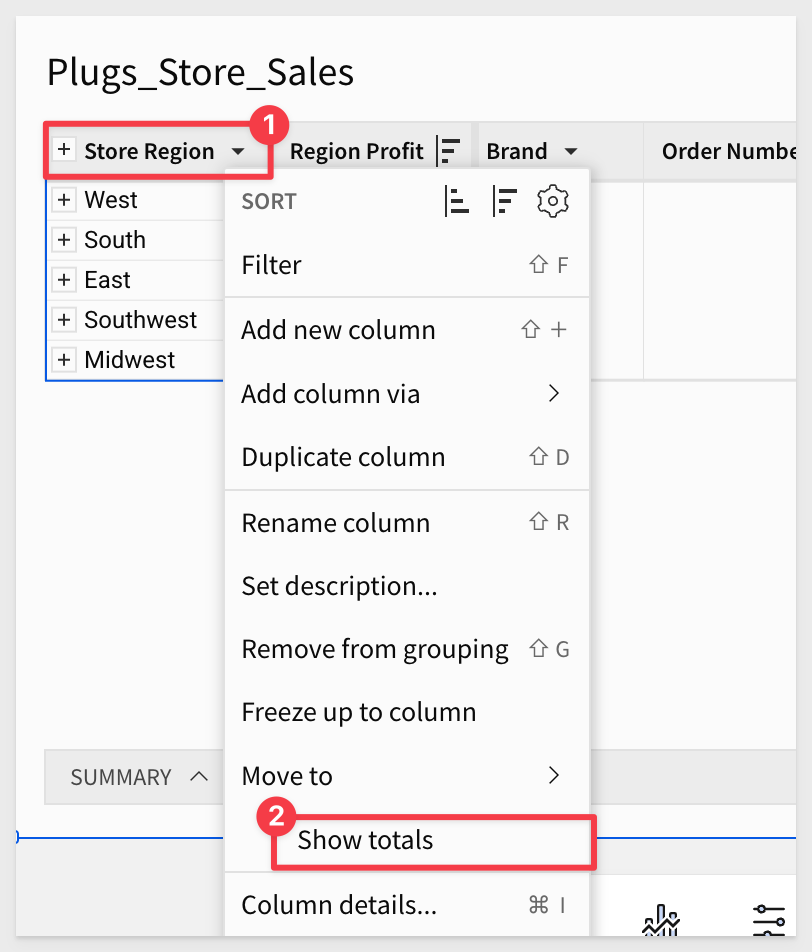
Sigma workbook tables provide a simple way to get totals and subtotals.
From the Store Region column header dropdown, select Show Totals:
We now have the total for all Store Regions:
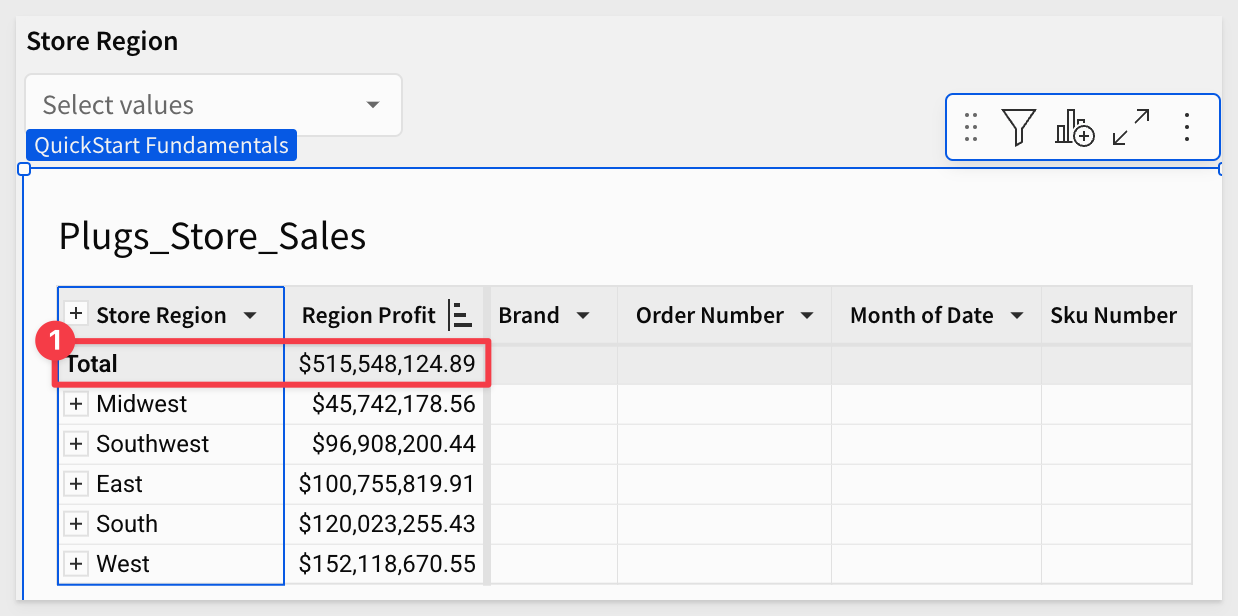
Click Publish.
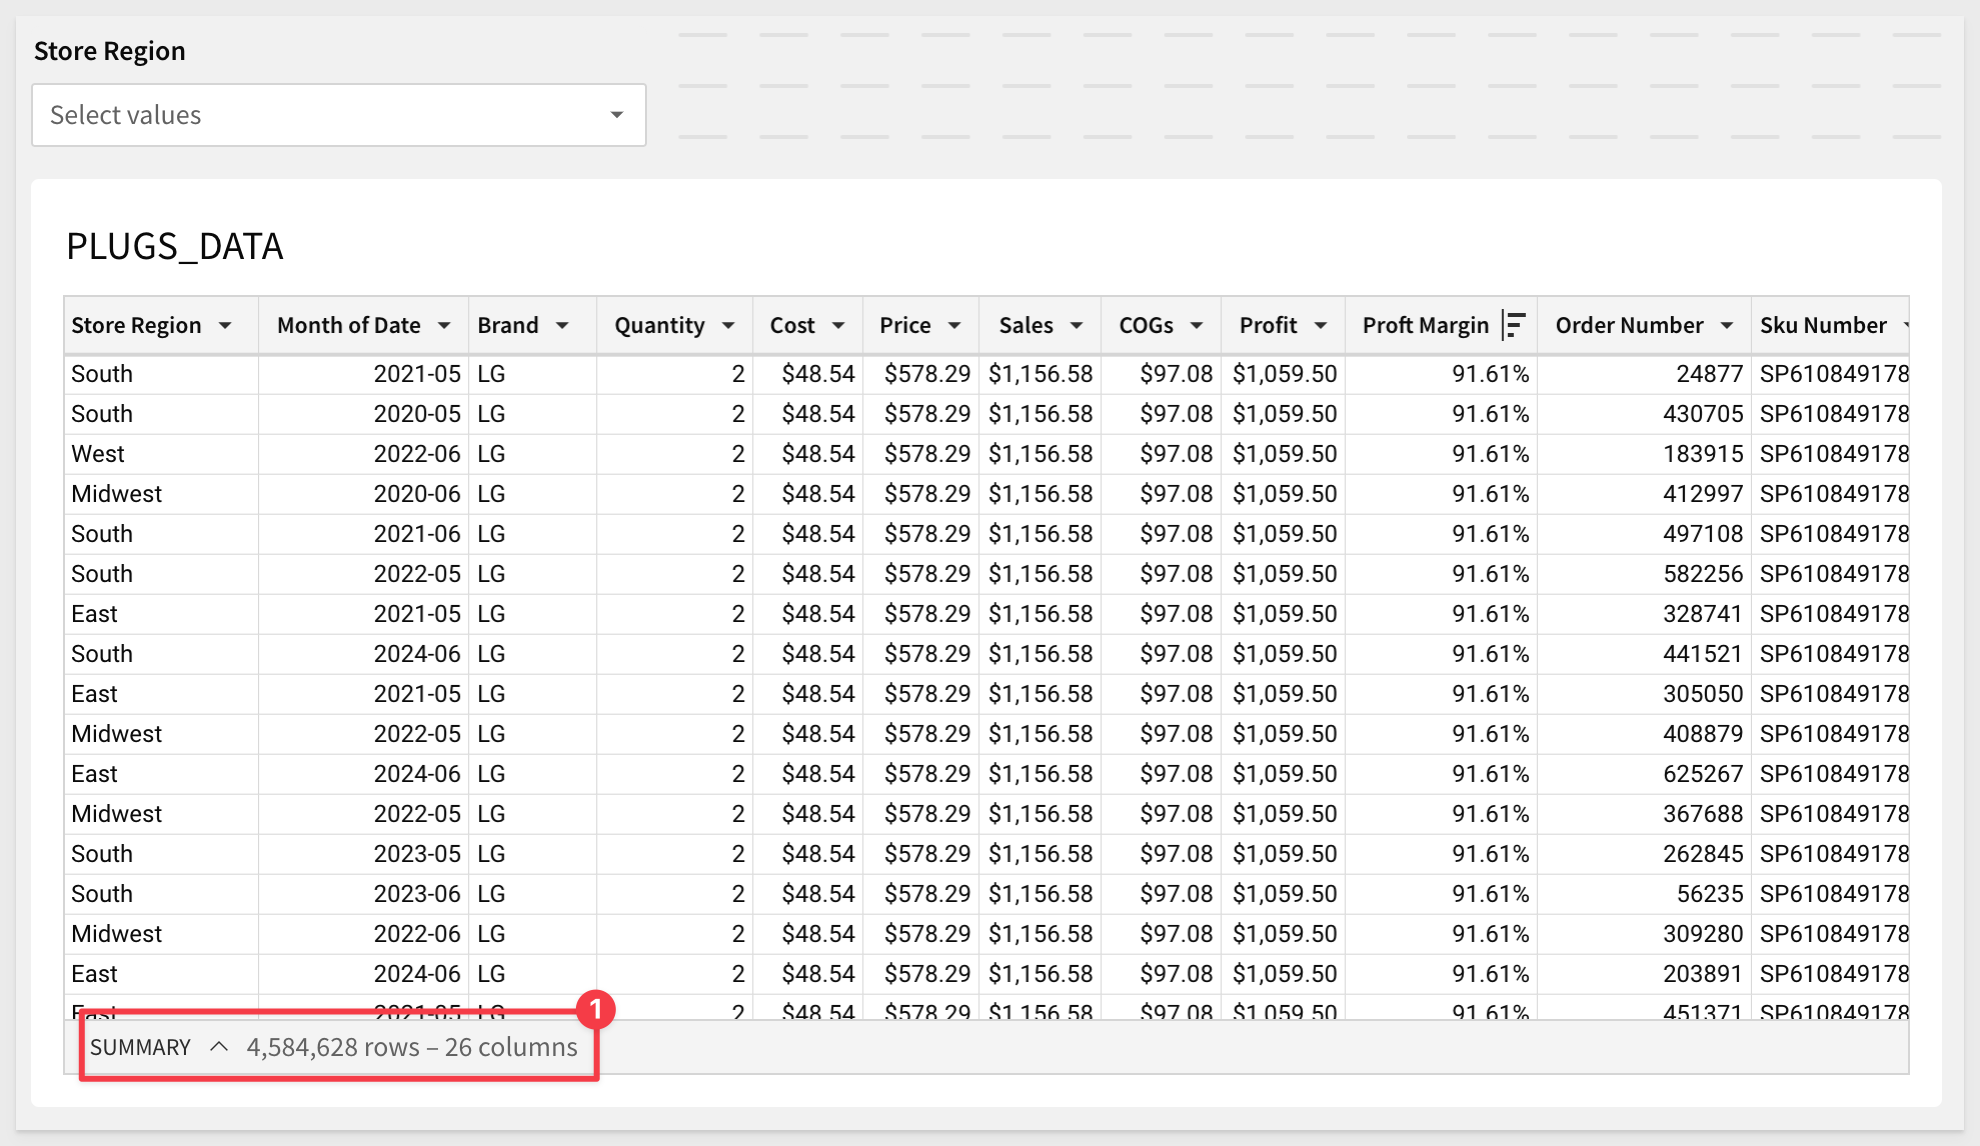
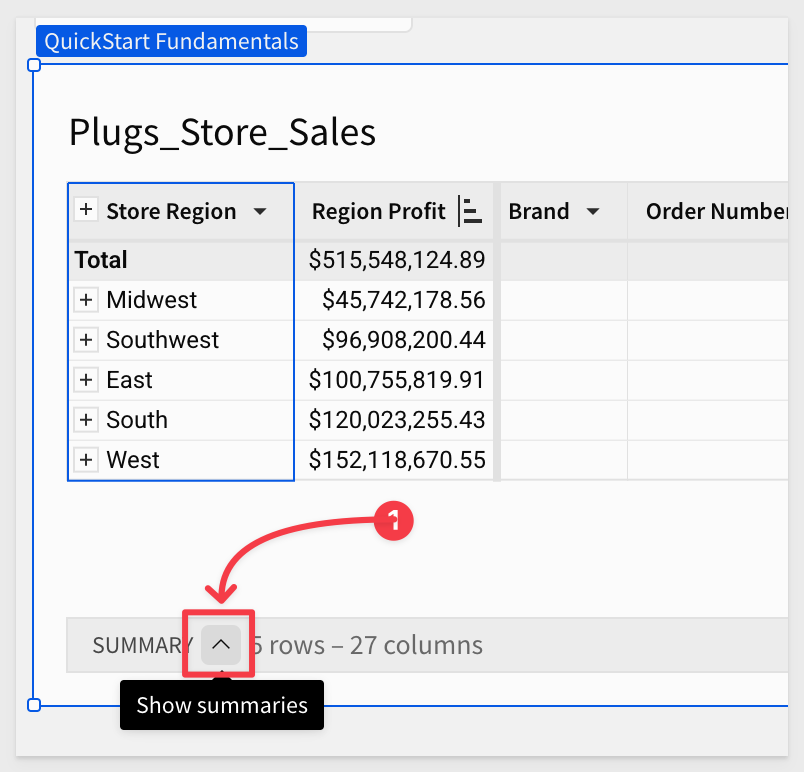
Sigma also has the ability to create Summary Values across the entire table.
At the bottom of the table you will see a line that says SUMMARY, which shows the number of rows as well as the number of columns.
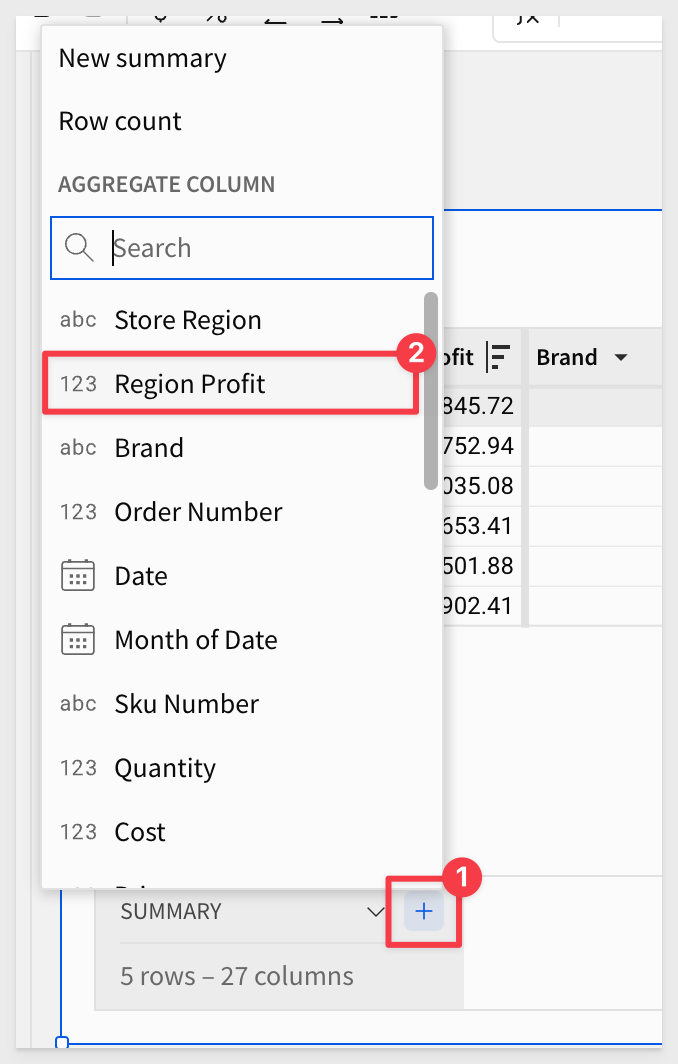
At the bottom left corner of the table click on the caret:
Then click the + button:
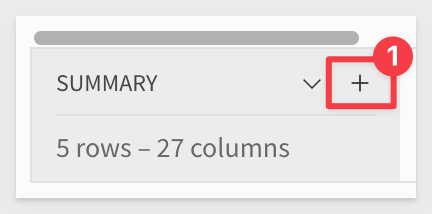
Select the Region Profit column. Sigma will automatically sum the column.
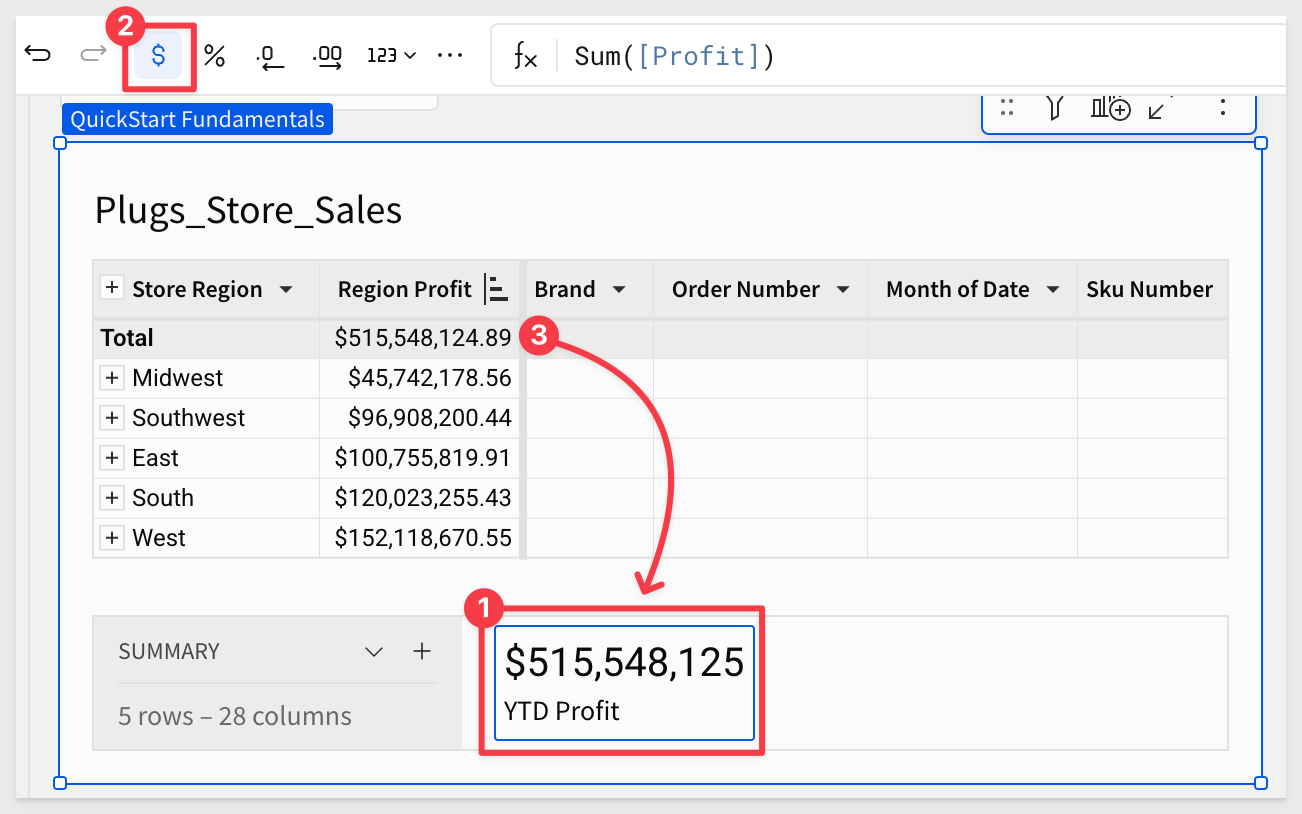
Remove the extra decimals and rename to change it to YTD Profit:
If your value is not the same as shown, you probably have some filters set from the earlier steps. That is no problem just disable them.
In the recent summary exercise, we have a filter set for year to date, so the values may be lower than yours. Ignore that and keep going.
The new summary should match the Total in the table from the previous section.
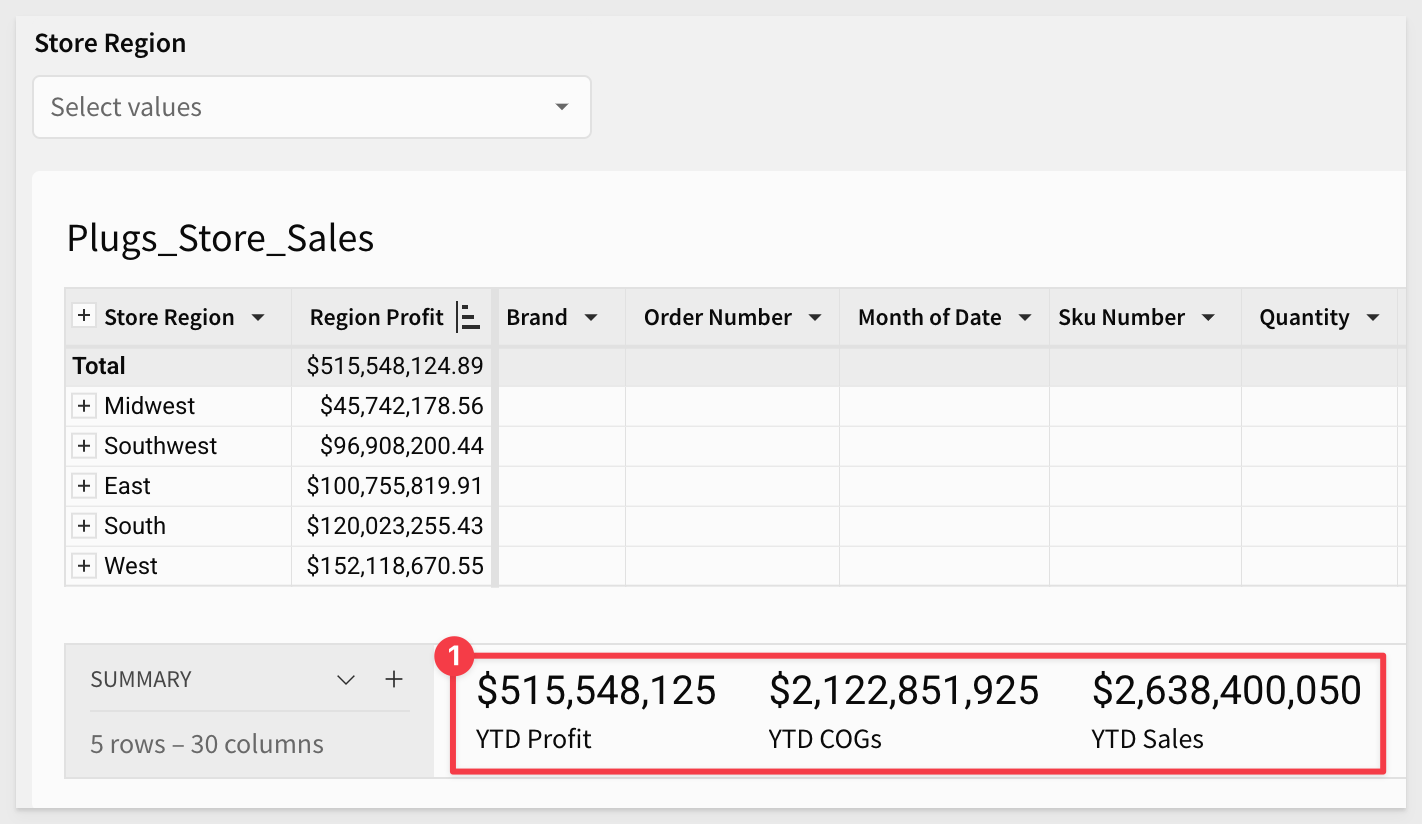
Go ahead and add two more summaries based on the COGs and Sales columns.
Publish the workbook.
Accessing summaries in formulas
We can also create a New summary (instead of selecting a column) that will be based on some formula we write.
Click the + > New summary:
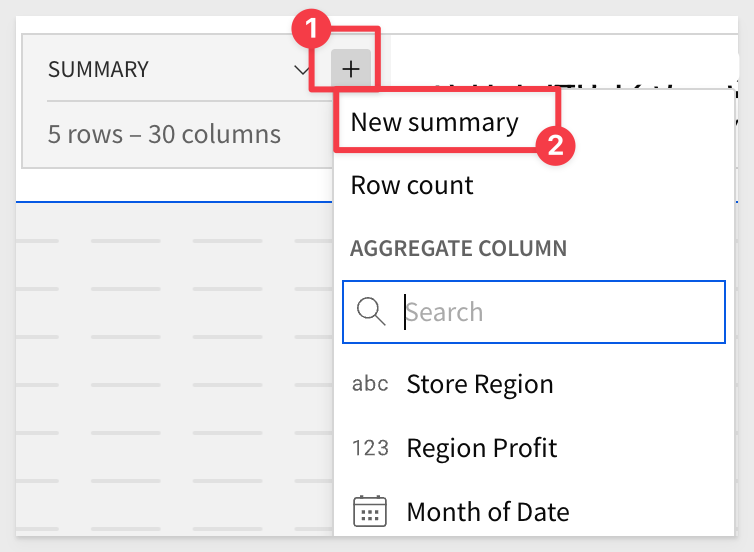
Let's create one more summary value by clicking on the caret ^, and selecting the + button. This time select New Summary.
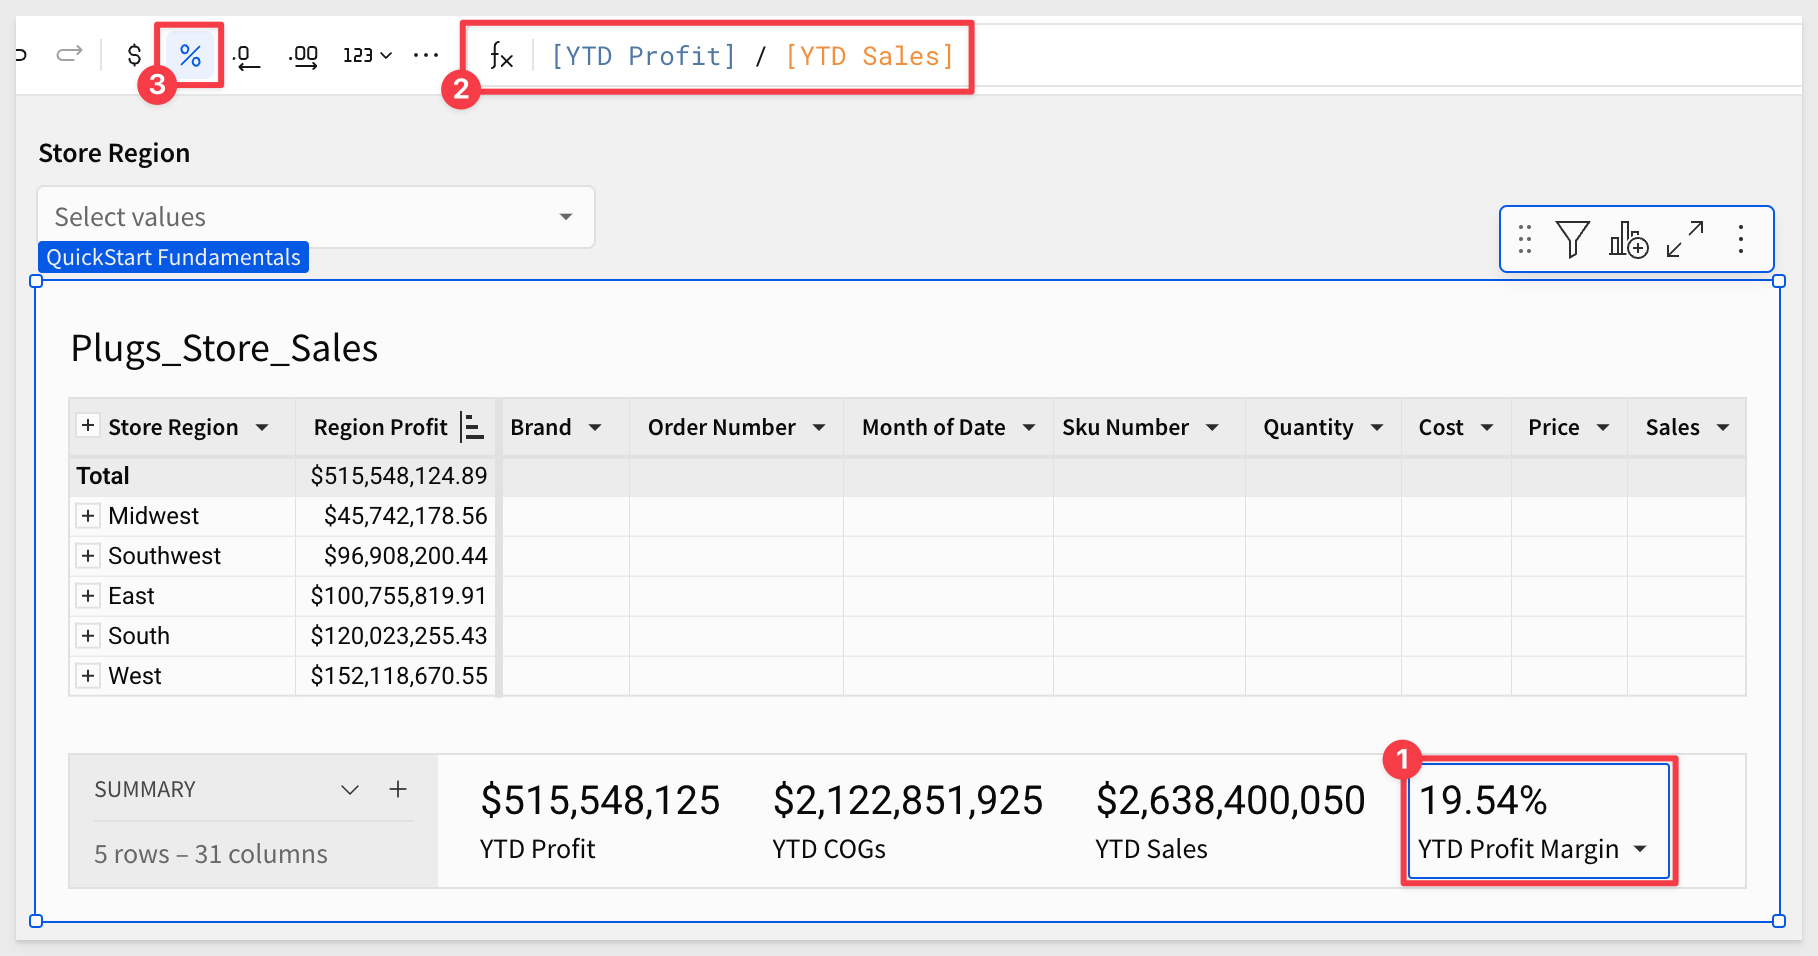
This will give us a blank summary which we can write a function for.
In the formula bar, enter:
[YTD Profit] / [YTD Sales]
It will initially show $0, so we need to change this to be a percentage.
Also rename this summary to YTD Profit Margin.
Grand Total
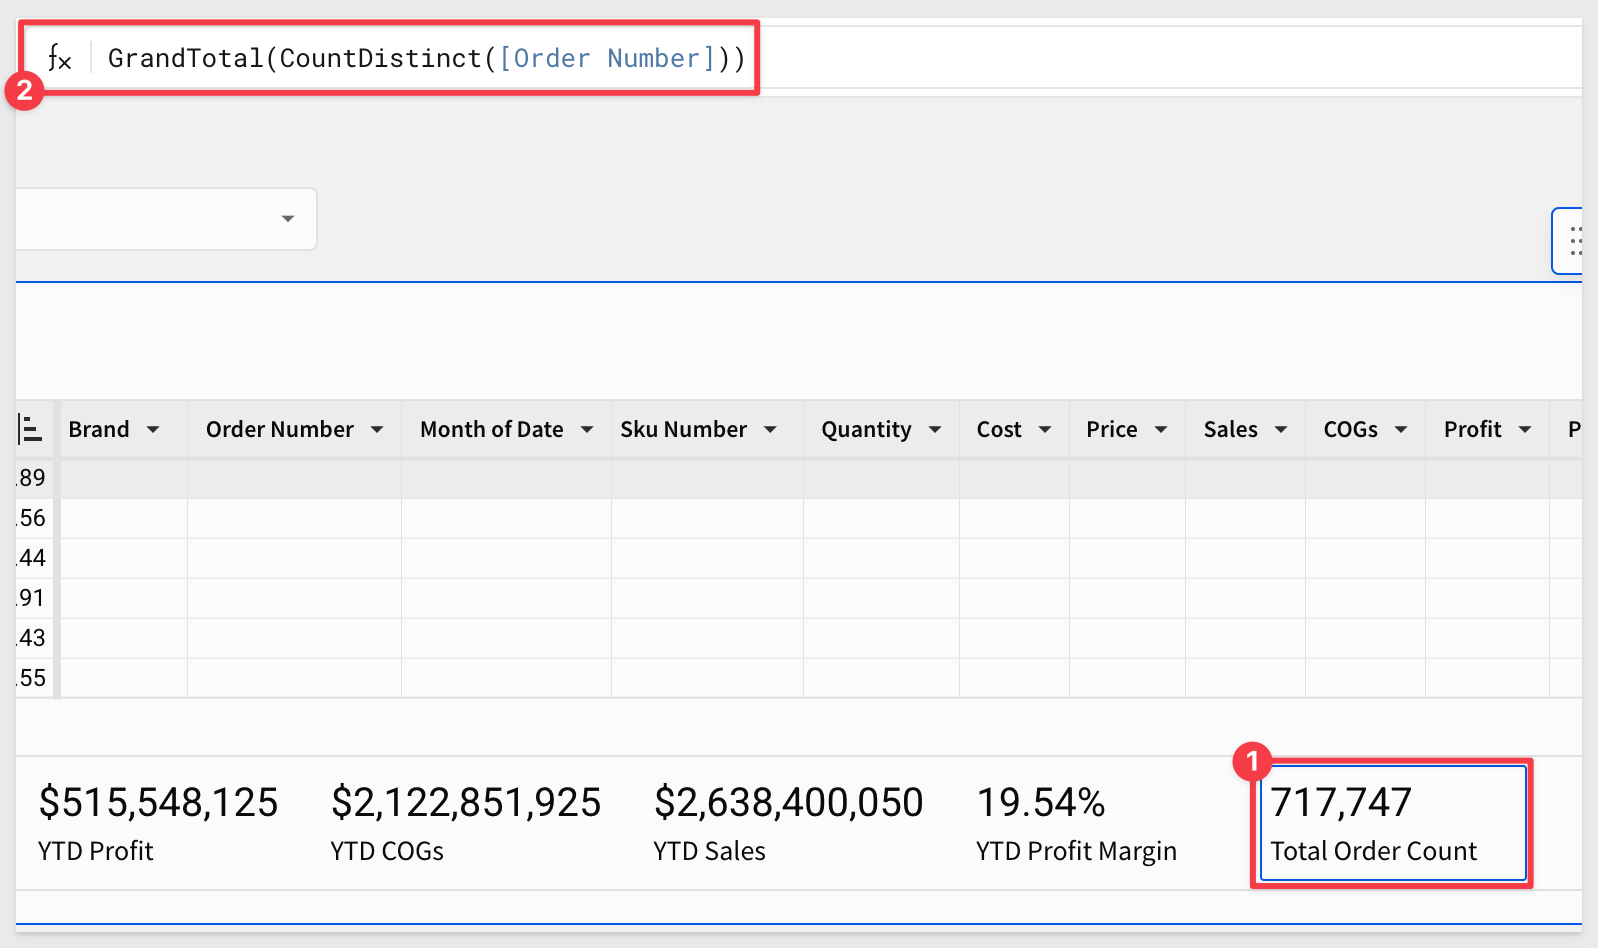
It may also be helpful to have the total number of orders represented in the data. Sigma has a function for that.
Add another New summary and set the formula to:
GrandTotal(CountDistinct([Order Number]))
Rename it to Total Order Count:
It is easy to reorder the summaries by just dragging them into the order you prefer.
The table should now look similar to this:
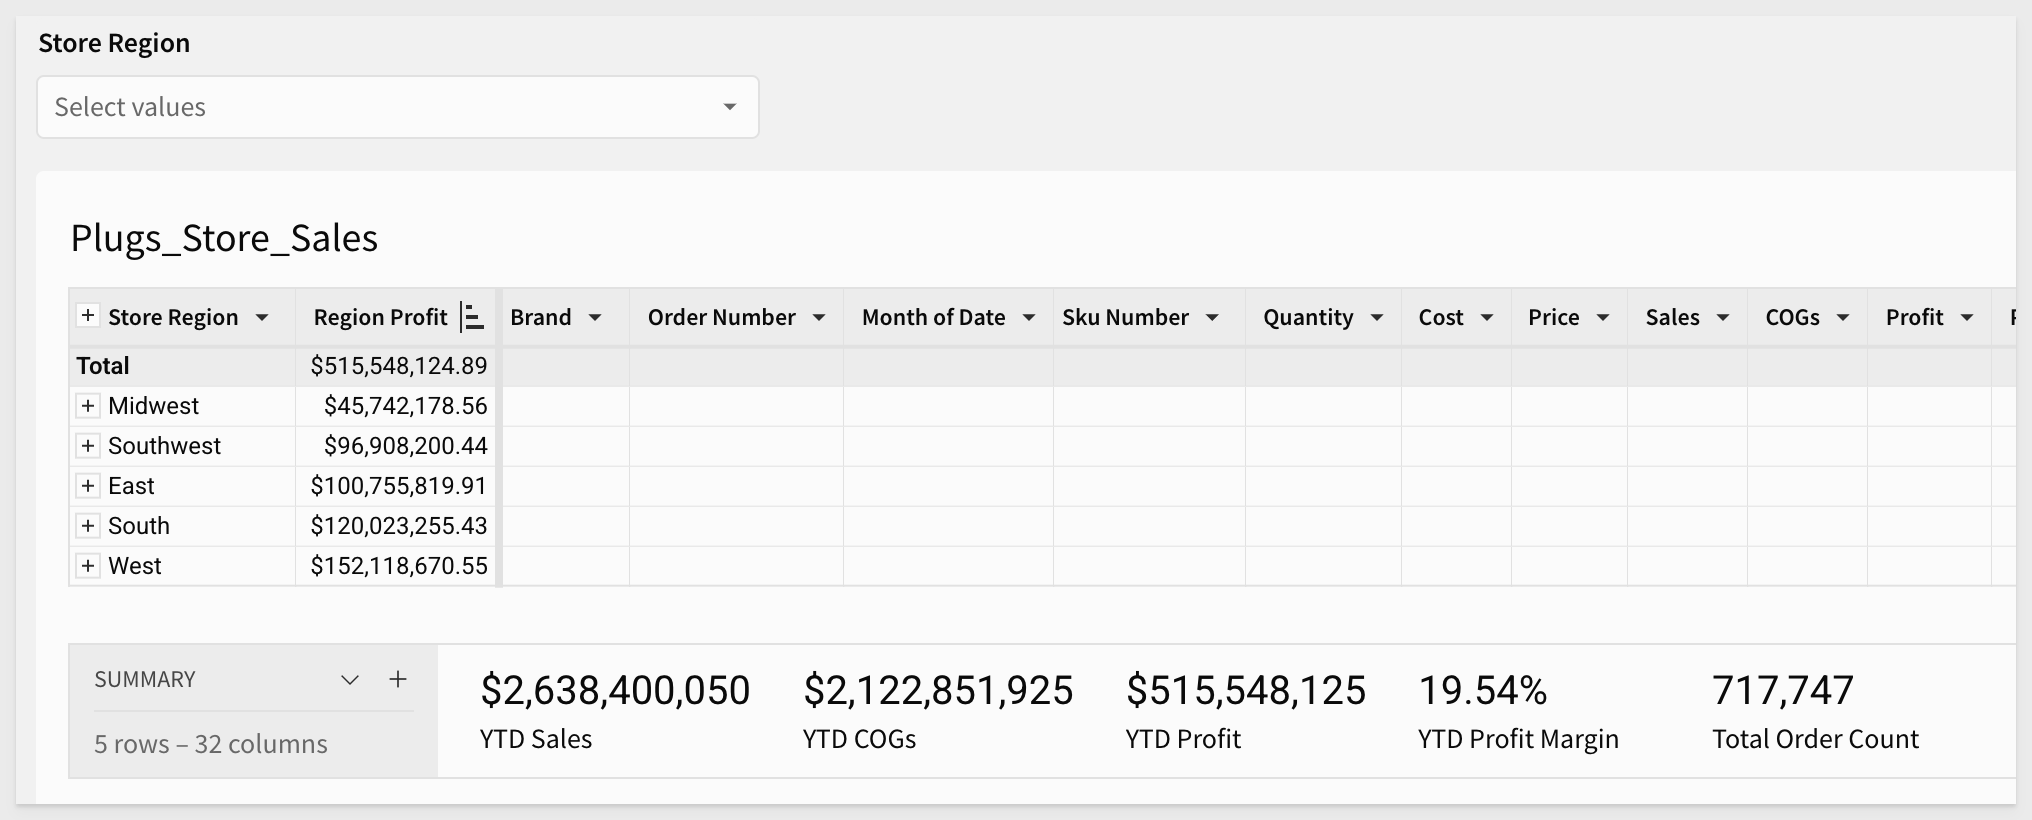
Click Publish.
Up until now, we have been using one table, but in practice, it is often necessary to do some "lite" data modeling.
Data modeling is a broad topic, and in order to make this section ‘fundamental,' we will join a sample table from our Sigma Sample Database connection as before.
For those looking for a more comprehensive data modeling solution, see Fundamentals 10: Data Modeling
We will also move a little faster now that we have been oriented in Sigma.
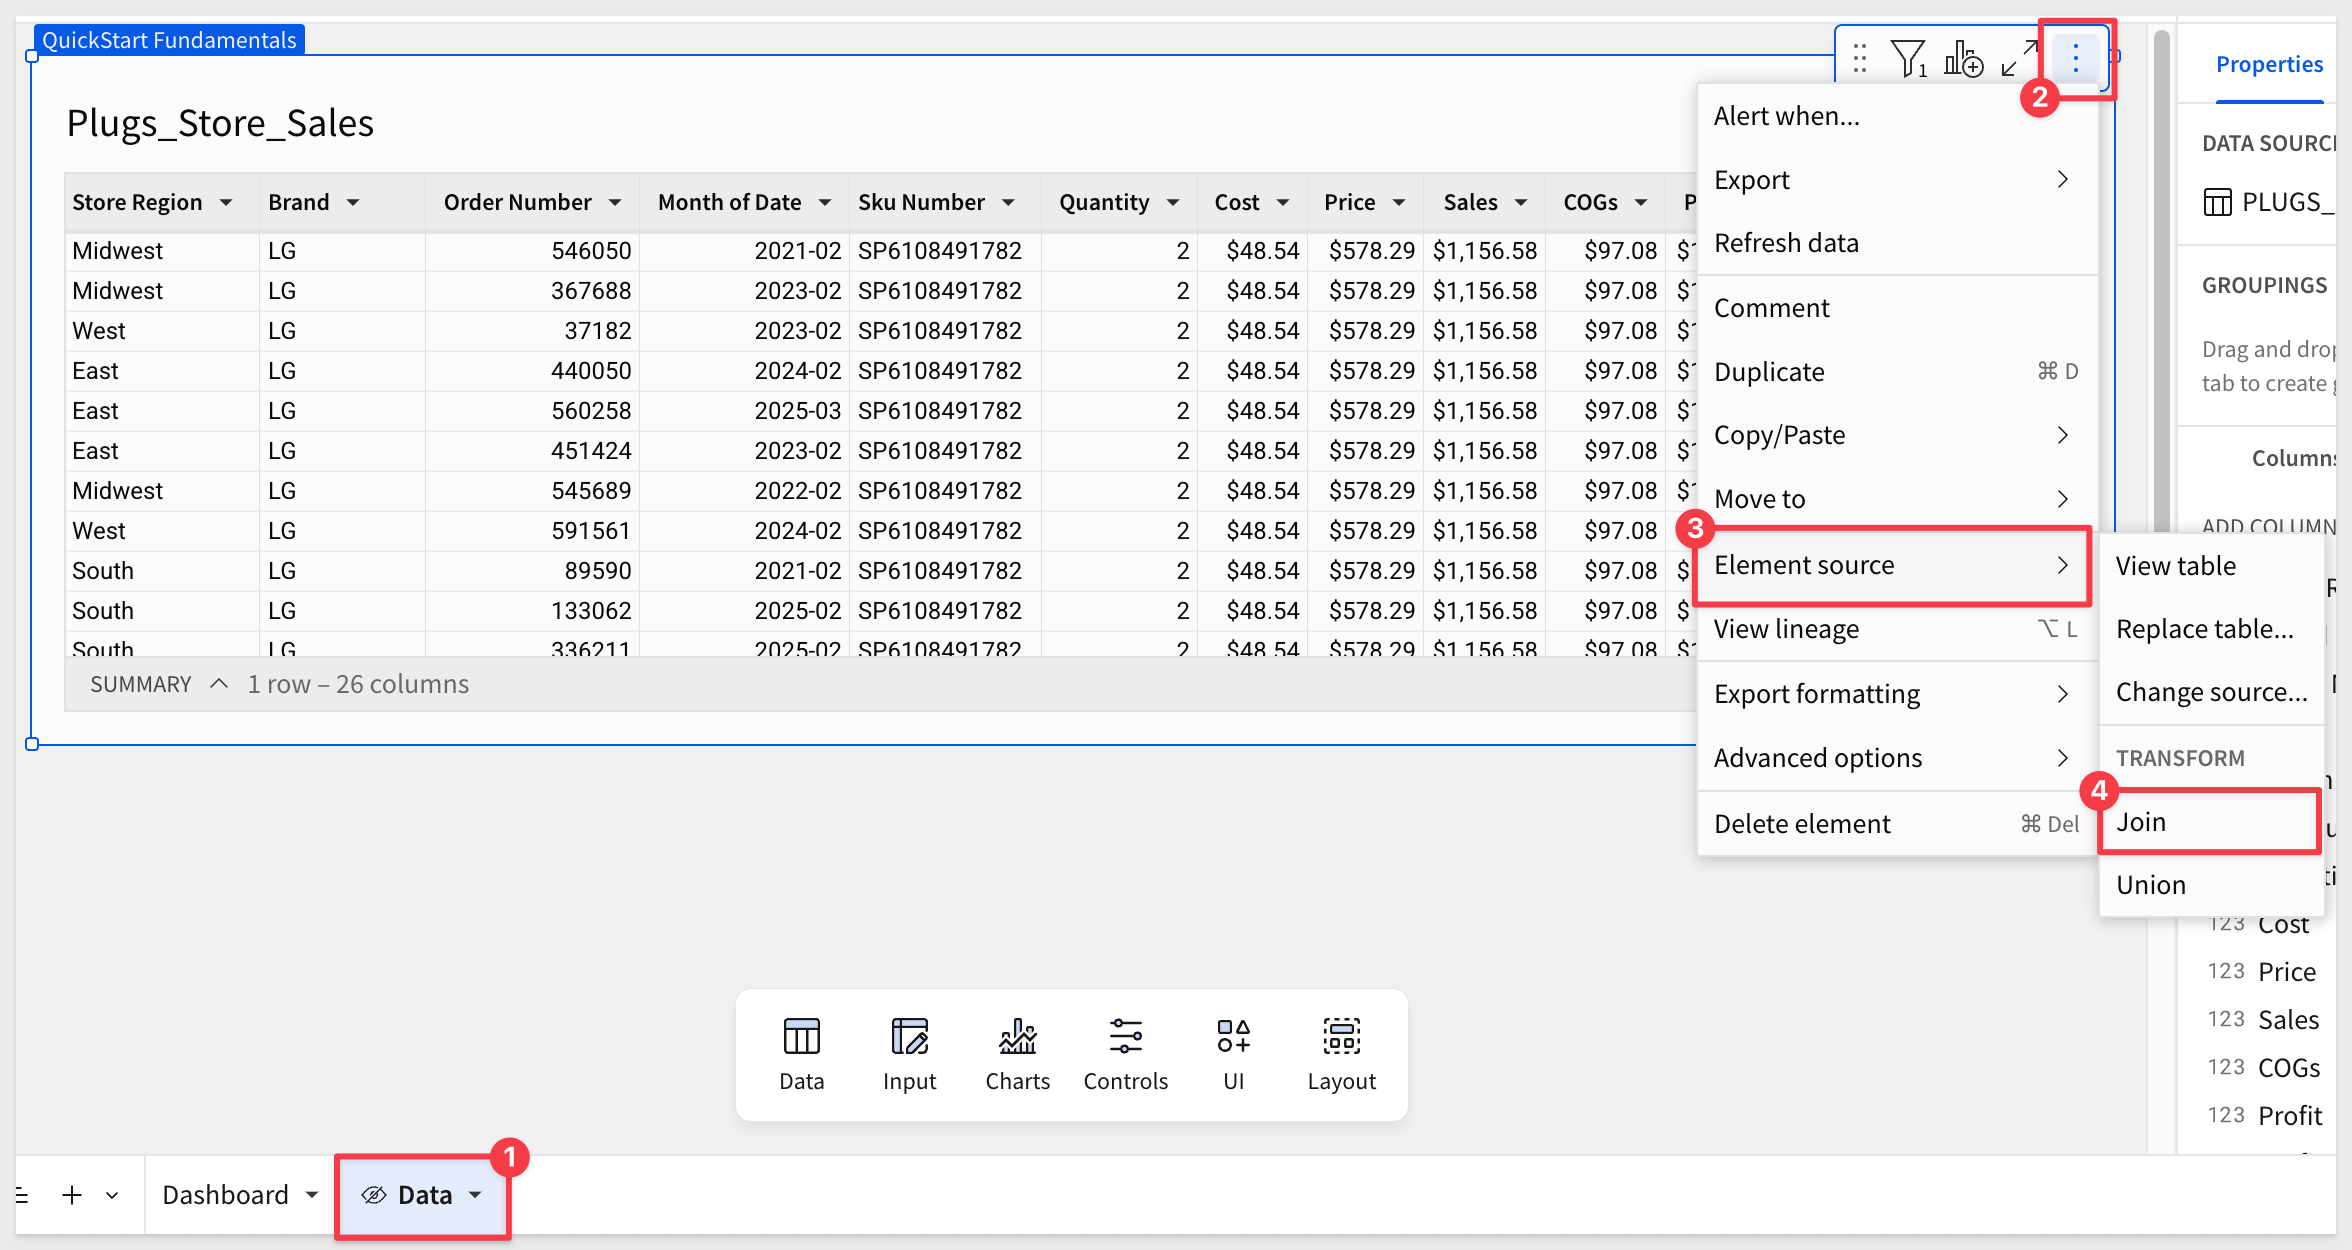
We want to add a column to show inventory on-hand, from the F_INVENTORY_ADJUSTED table by joining it to the existing Plugs_Store_Sales table, on the Data page.
Add an Element source > Join from the Plugs_Store_Sales table, on the Data page:
In the Source selector, search for F_Invent and select the one in the Retail schema:
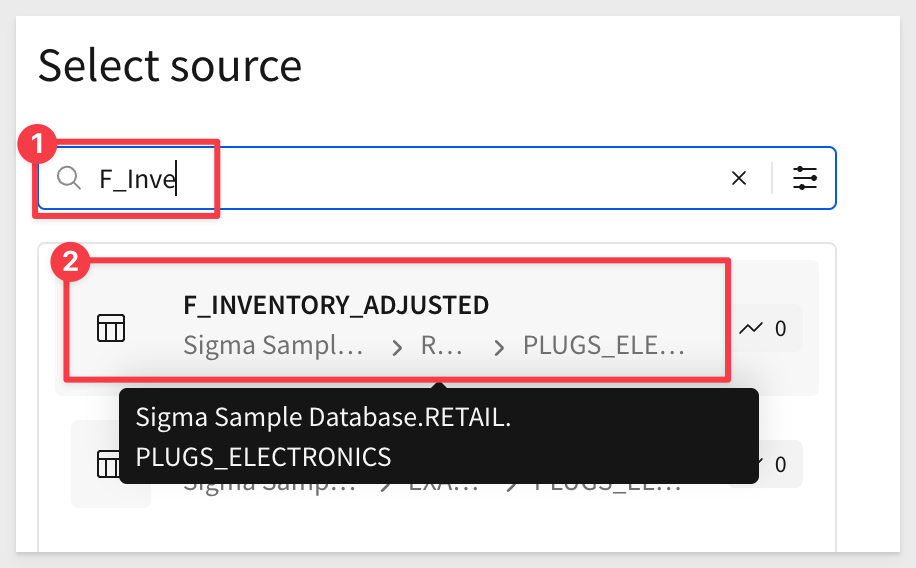
When you click it, a preview of the data is shown.
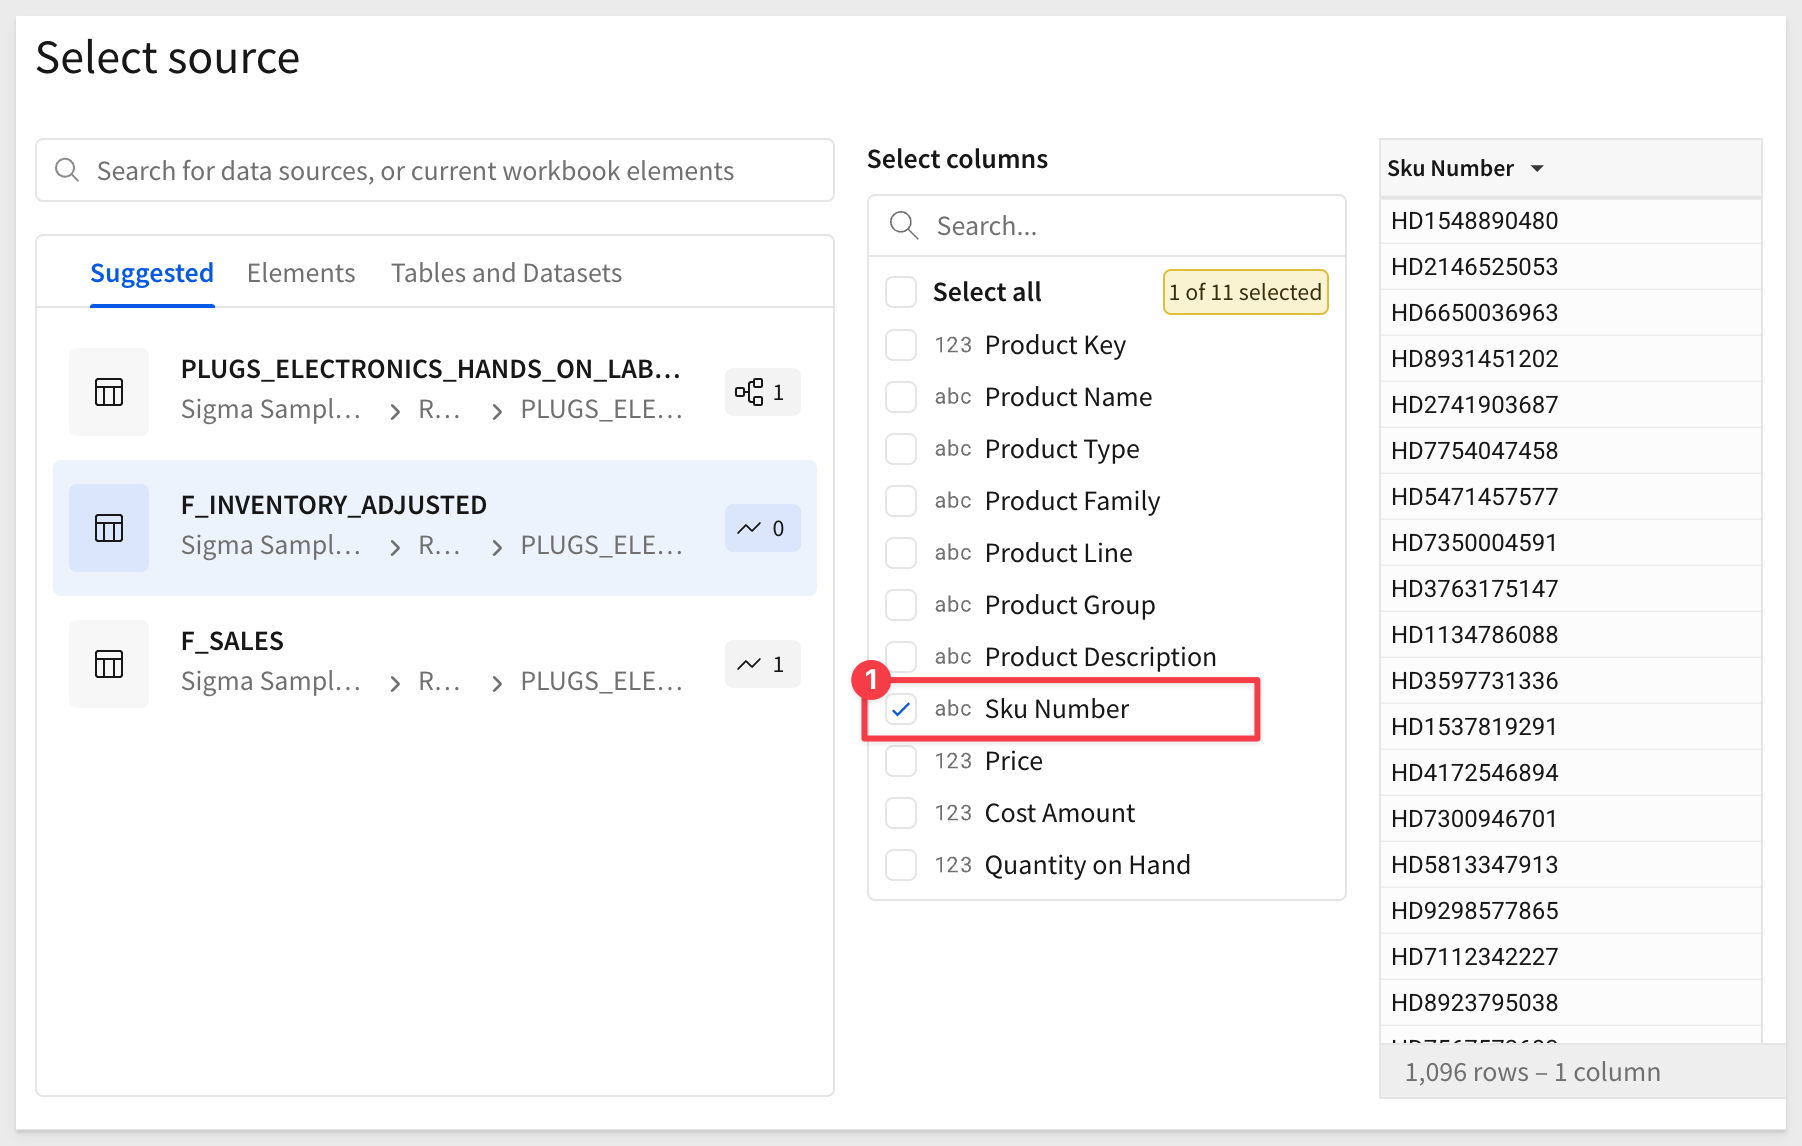
Here we only need to select the column(s) that will allow us to create a proper join.
Select only the Sku Number column and click Select:
Next we need to configure the join keys and type. In this case, we are joining on Sku Number in each table.
In this example, having no Keys with no matches means that every record in our base table has a matching row in the F_INVENTORY_ADJUSTED table:
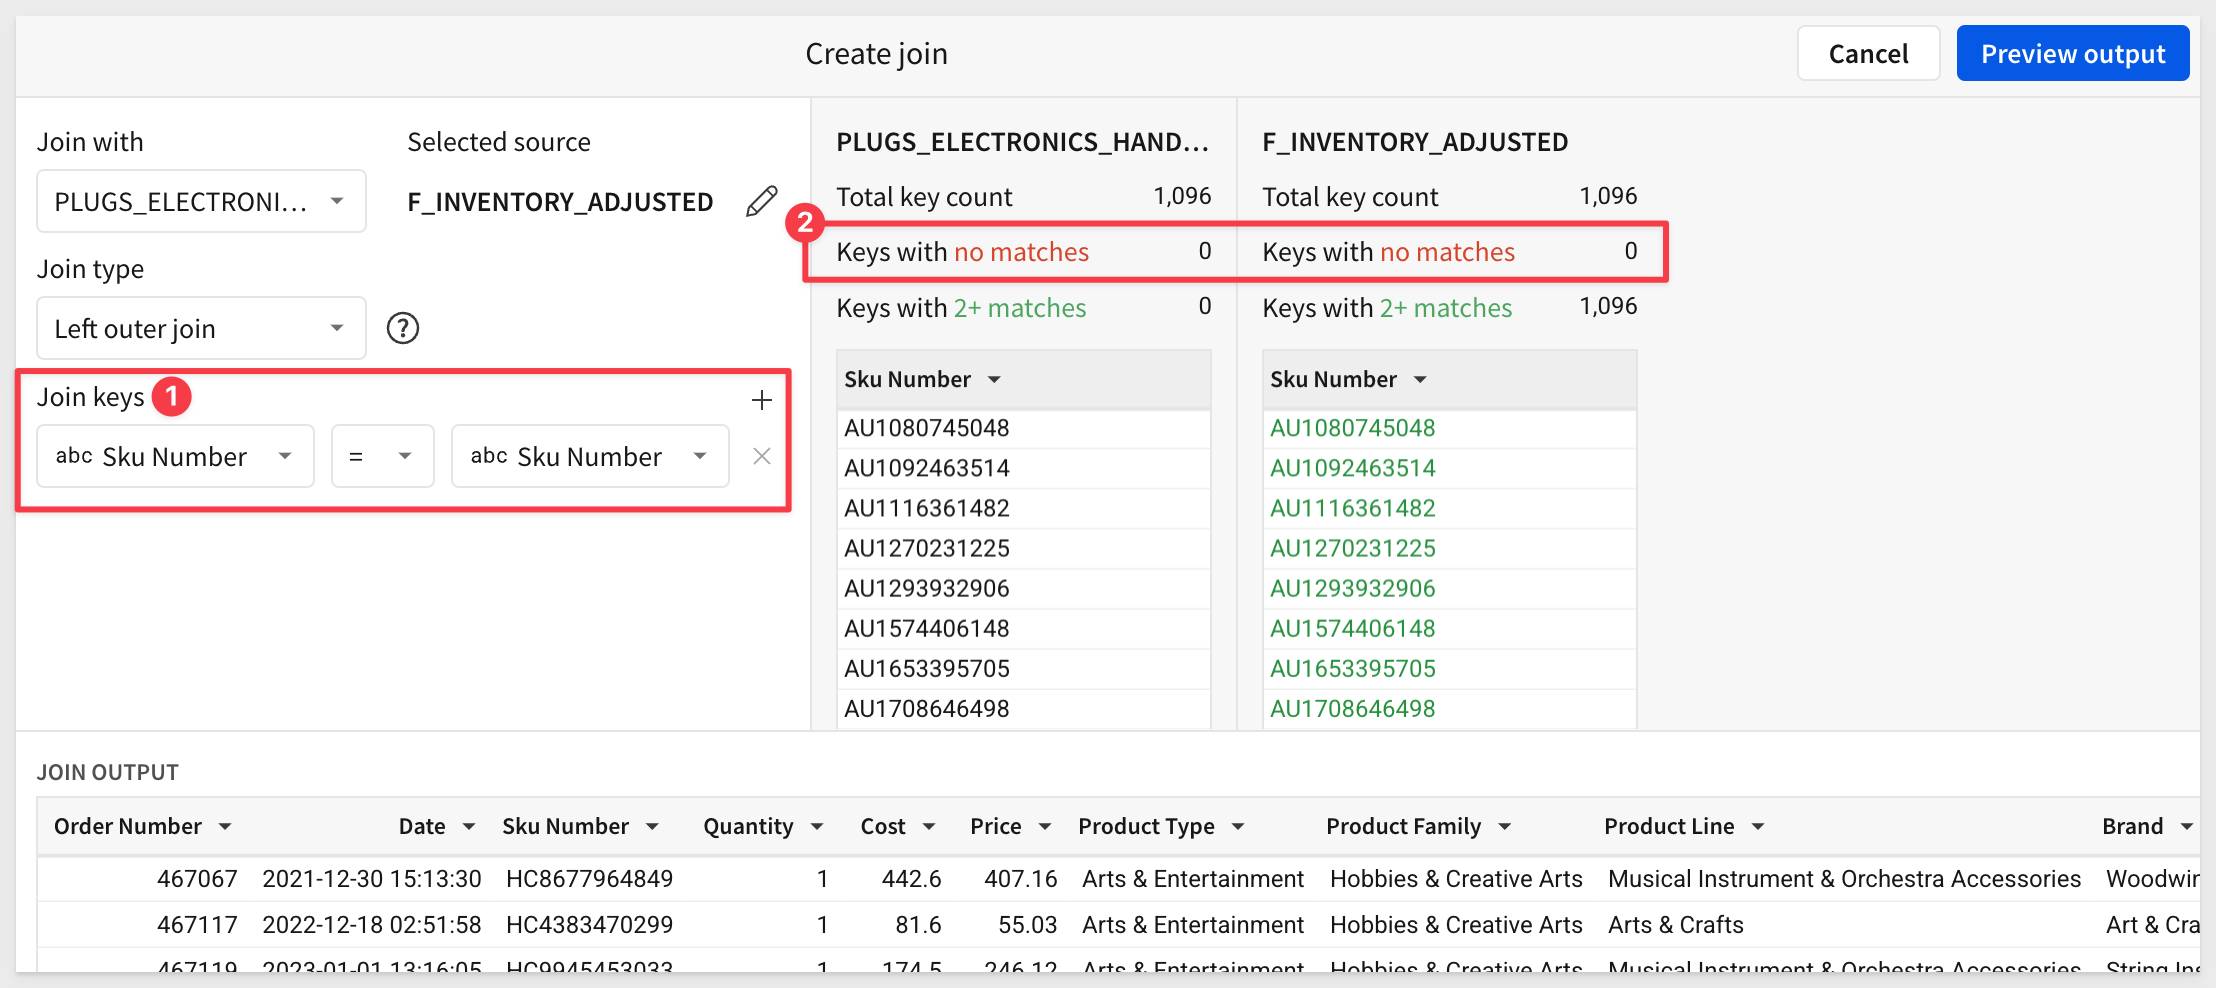
Click Preview Output.
Sigma does not know which columns from the join we want; we need to tell it.
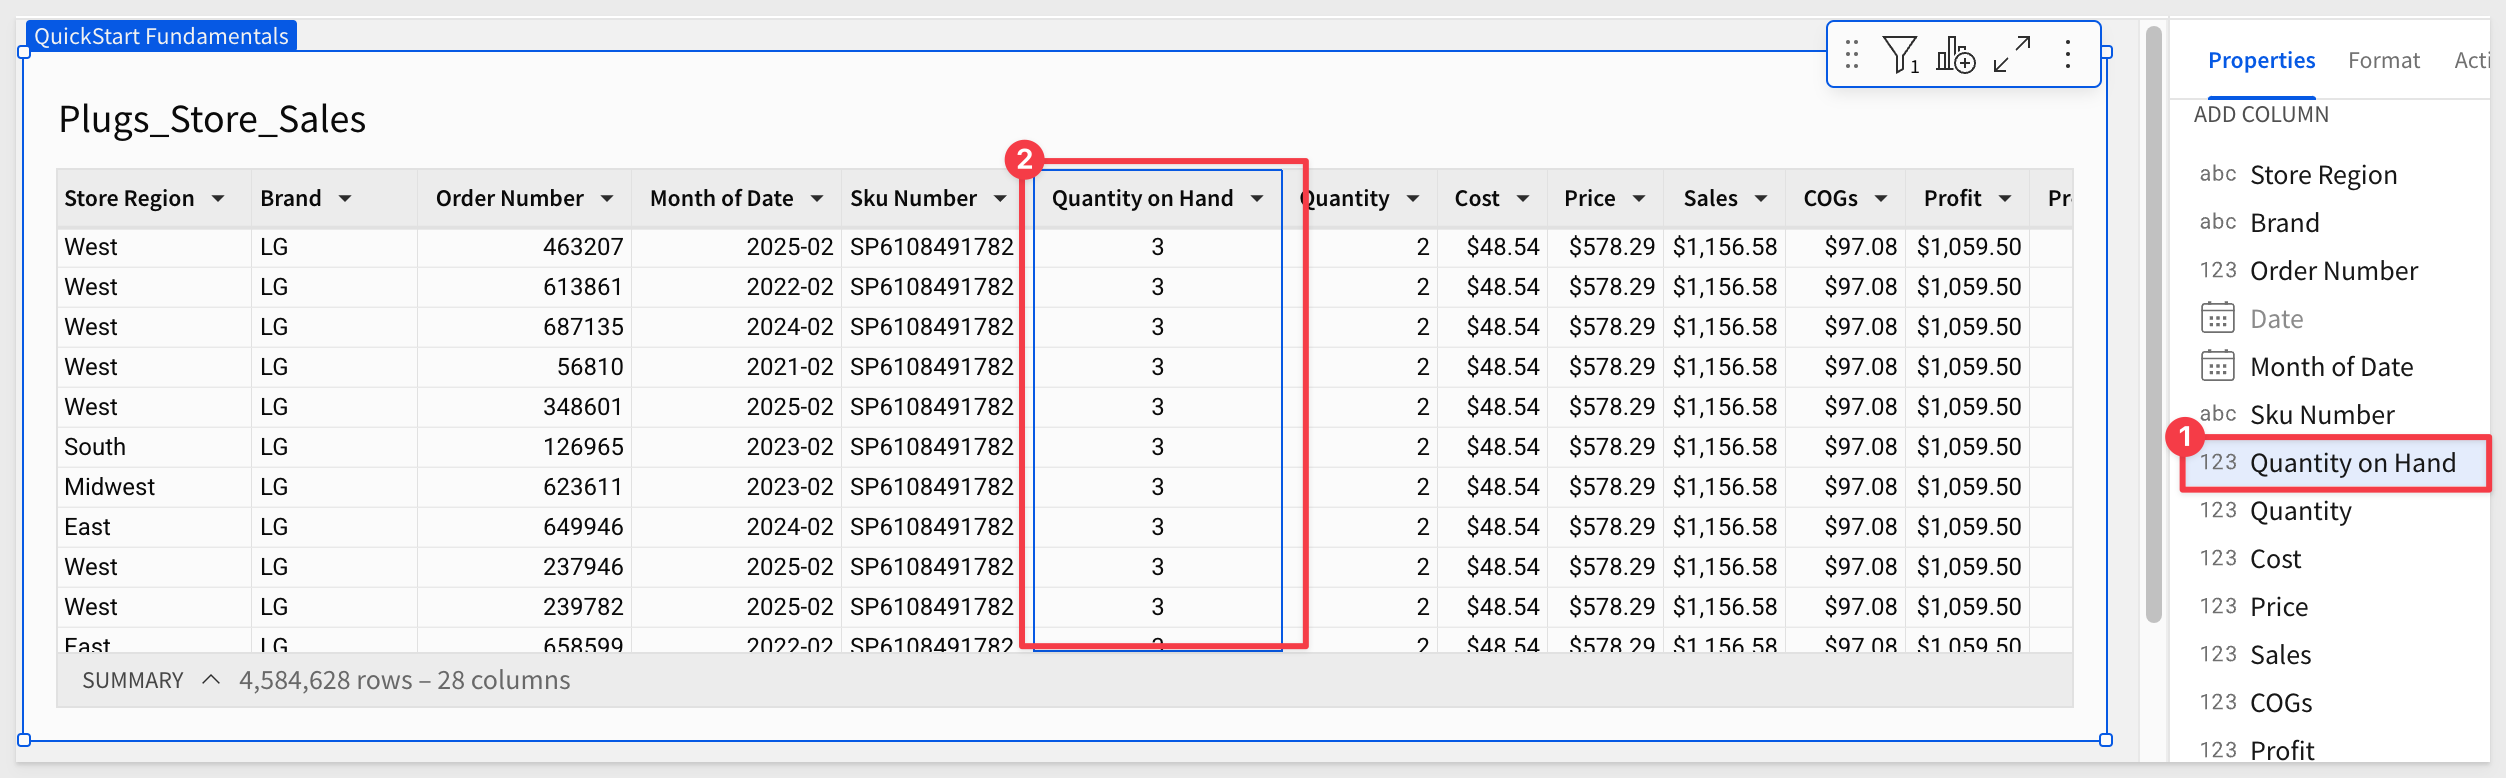
We will take all the columns from the PLUGS.... table (they should already be selected) and only the SKU Number and Quantity on Hand columns from F_INVENTORY_ADJUSTED:
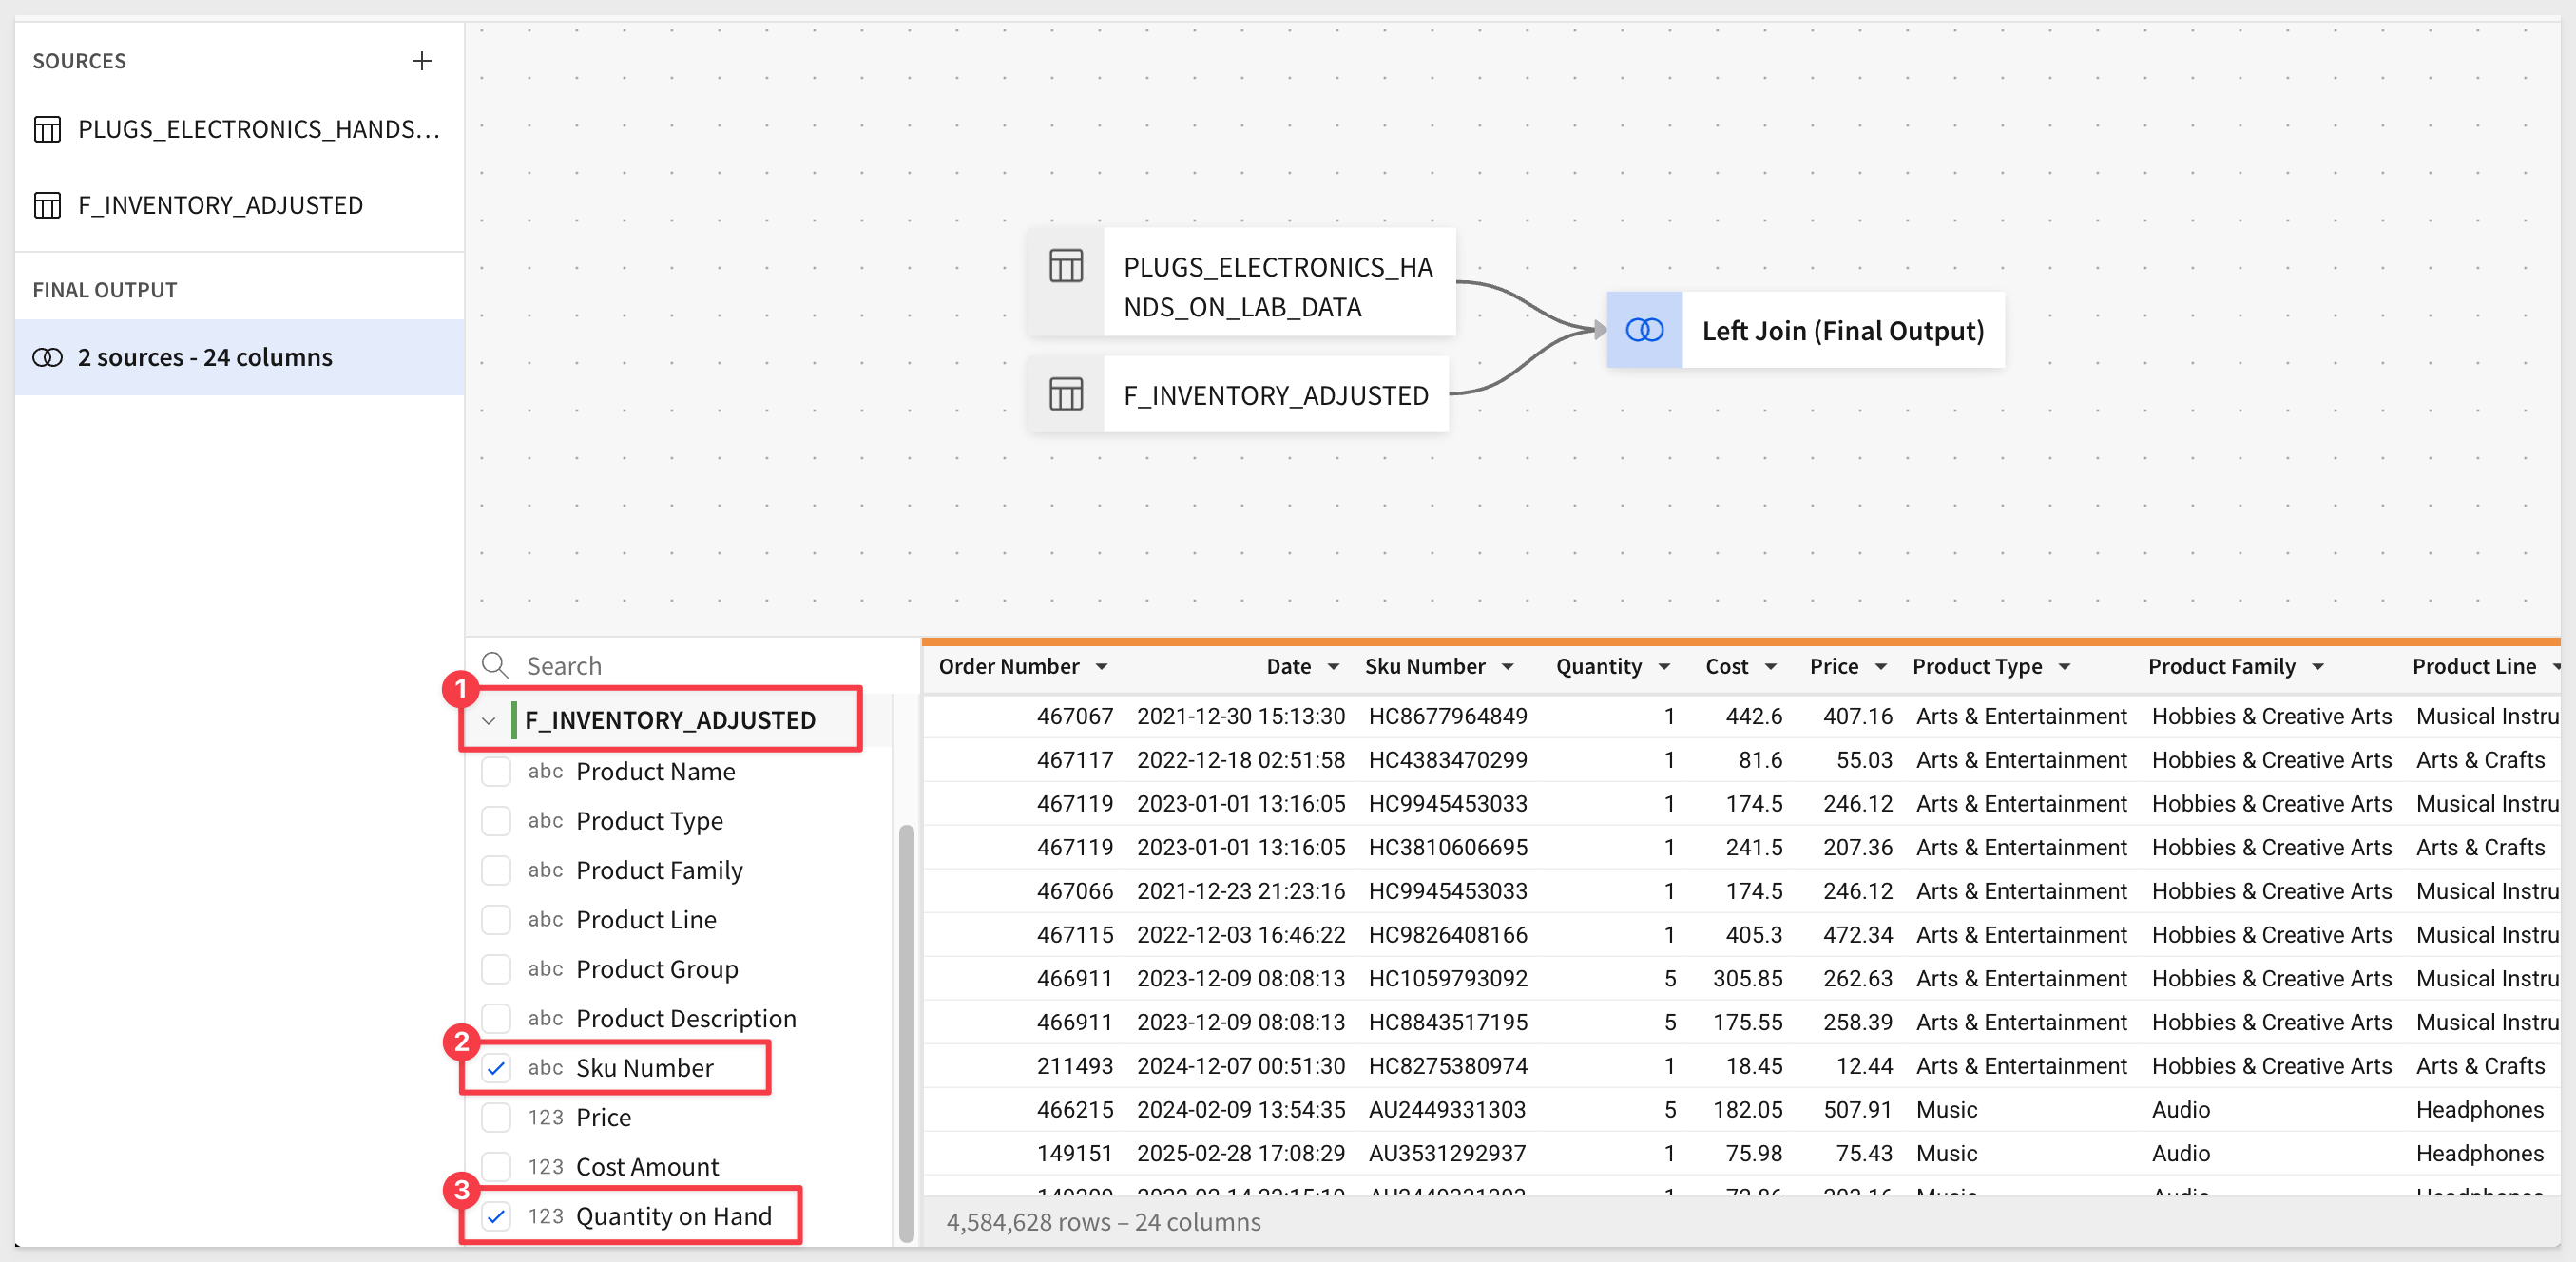
Click Done and Publish.
We can see that the Quantity on Hand column is now shown in our table (we moved it up for the screenshot and centered the value in the column):
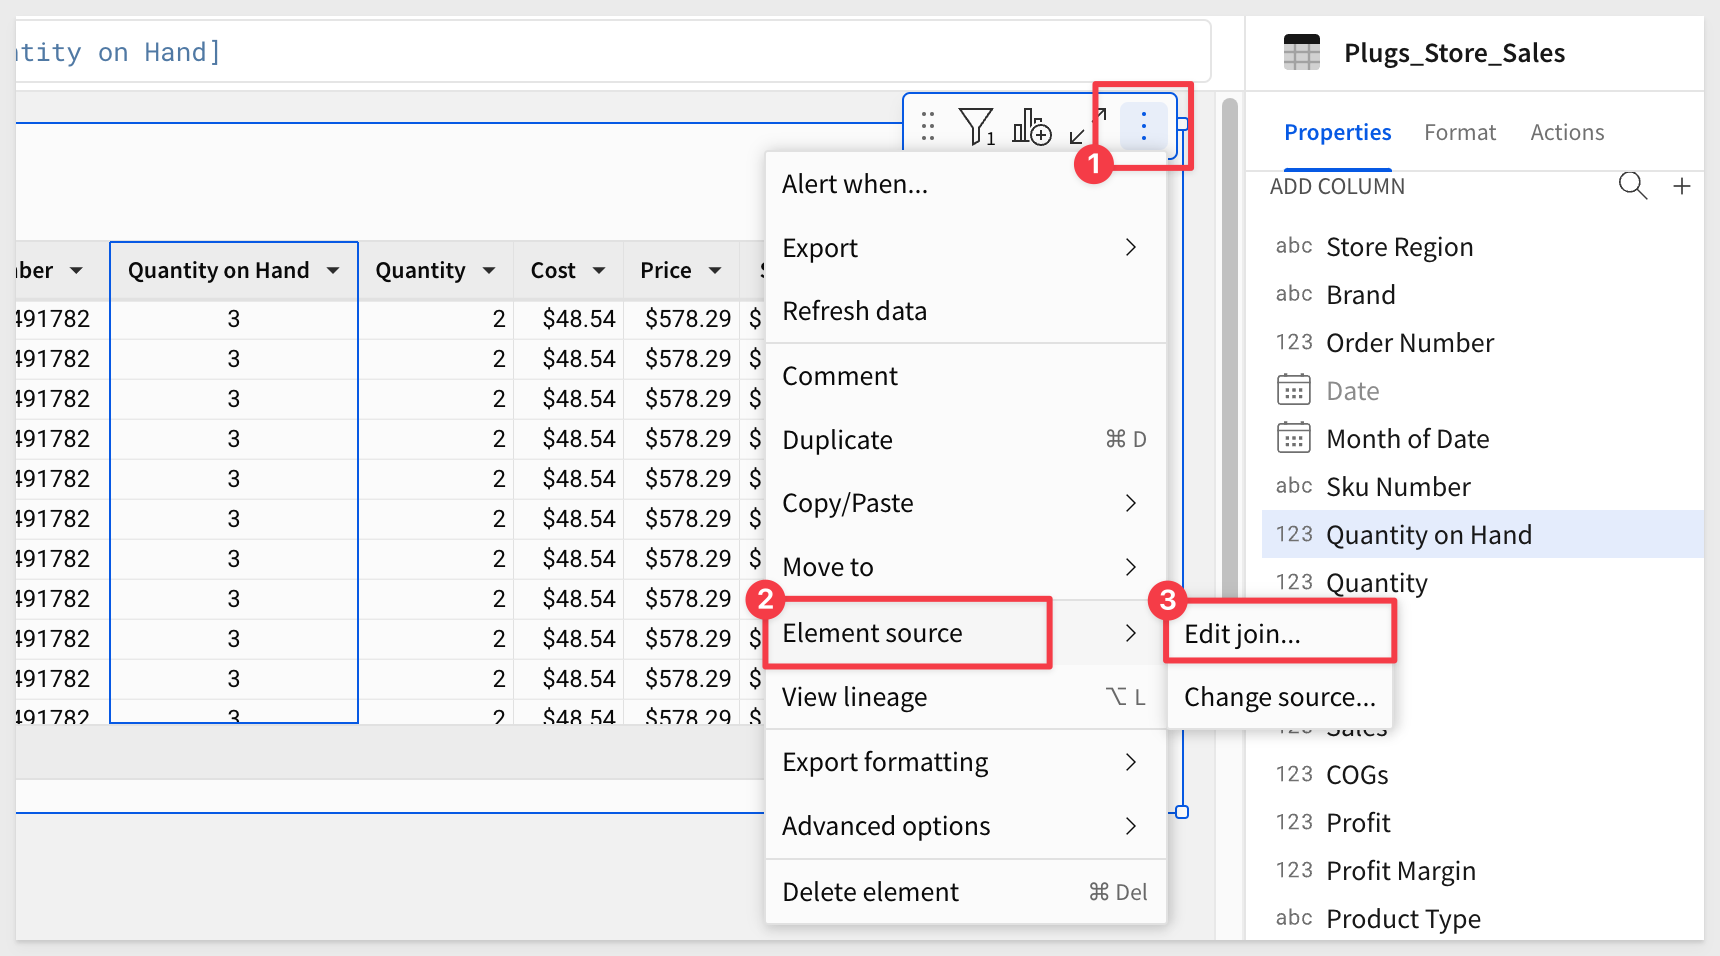
We can edit the join at any time by returning to the Data page and:
Last, we can search in the column list, using the magnifying glass icon, for sku:
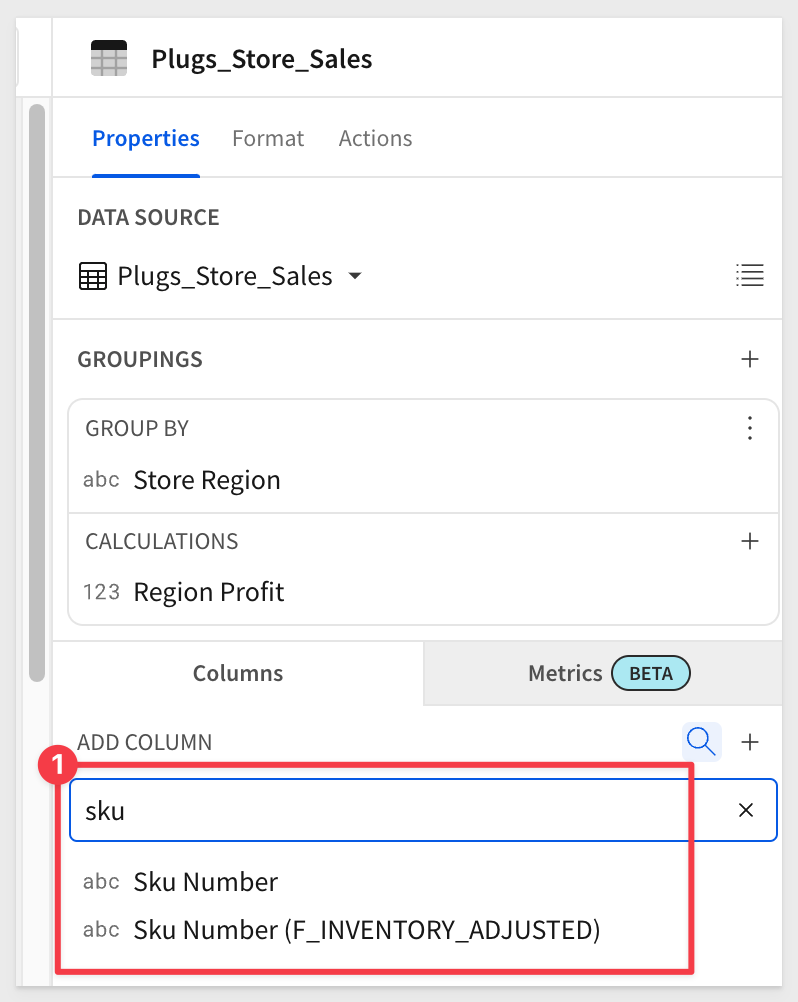
There are two columns, and one is clearly identified as coming from the F_INVENTORY_ADJUSTED table. We need this column as it drives our join, but we don't have to display it if we don't want. Simply hide it if preferred.
There are many ways to join data in Sigma workbooks. To learn more, see Join data in workbooks.
For those interested in more sophisticated data modelling, see Create and manage data models.
In the last section, we joined two tables from our warehouse, selected join keys, join type and saw the results. We never wrote SQL or any other proprietary code to make that happen, although we can if we wanted to.
For more information, see Write custom SQL
Sigma makes things easy for you, with a ton of power applied in the background to ensure efficiency.
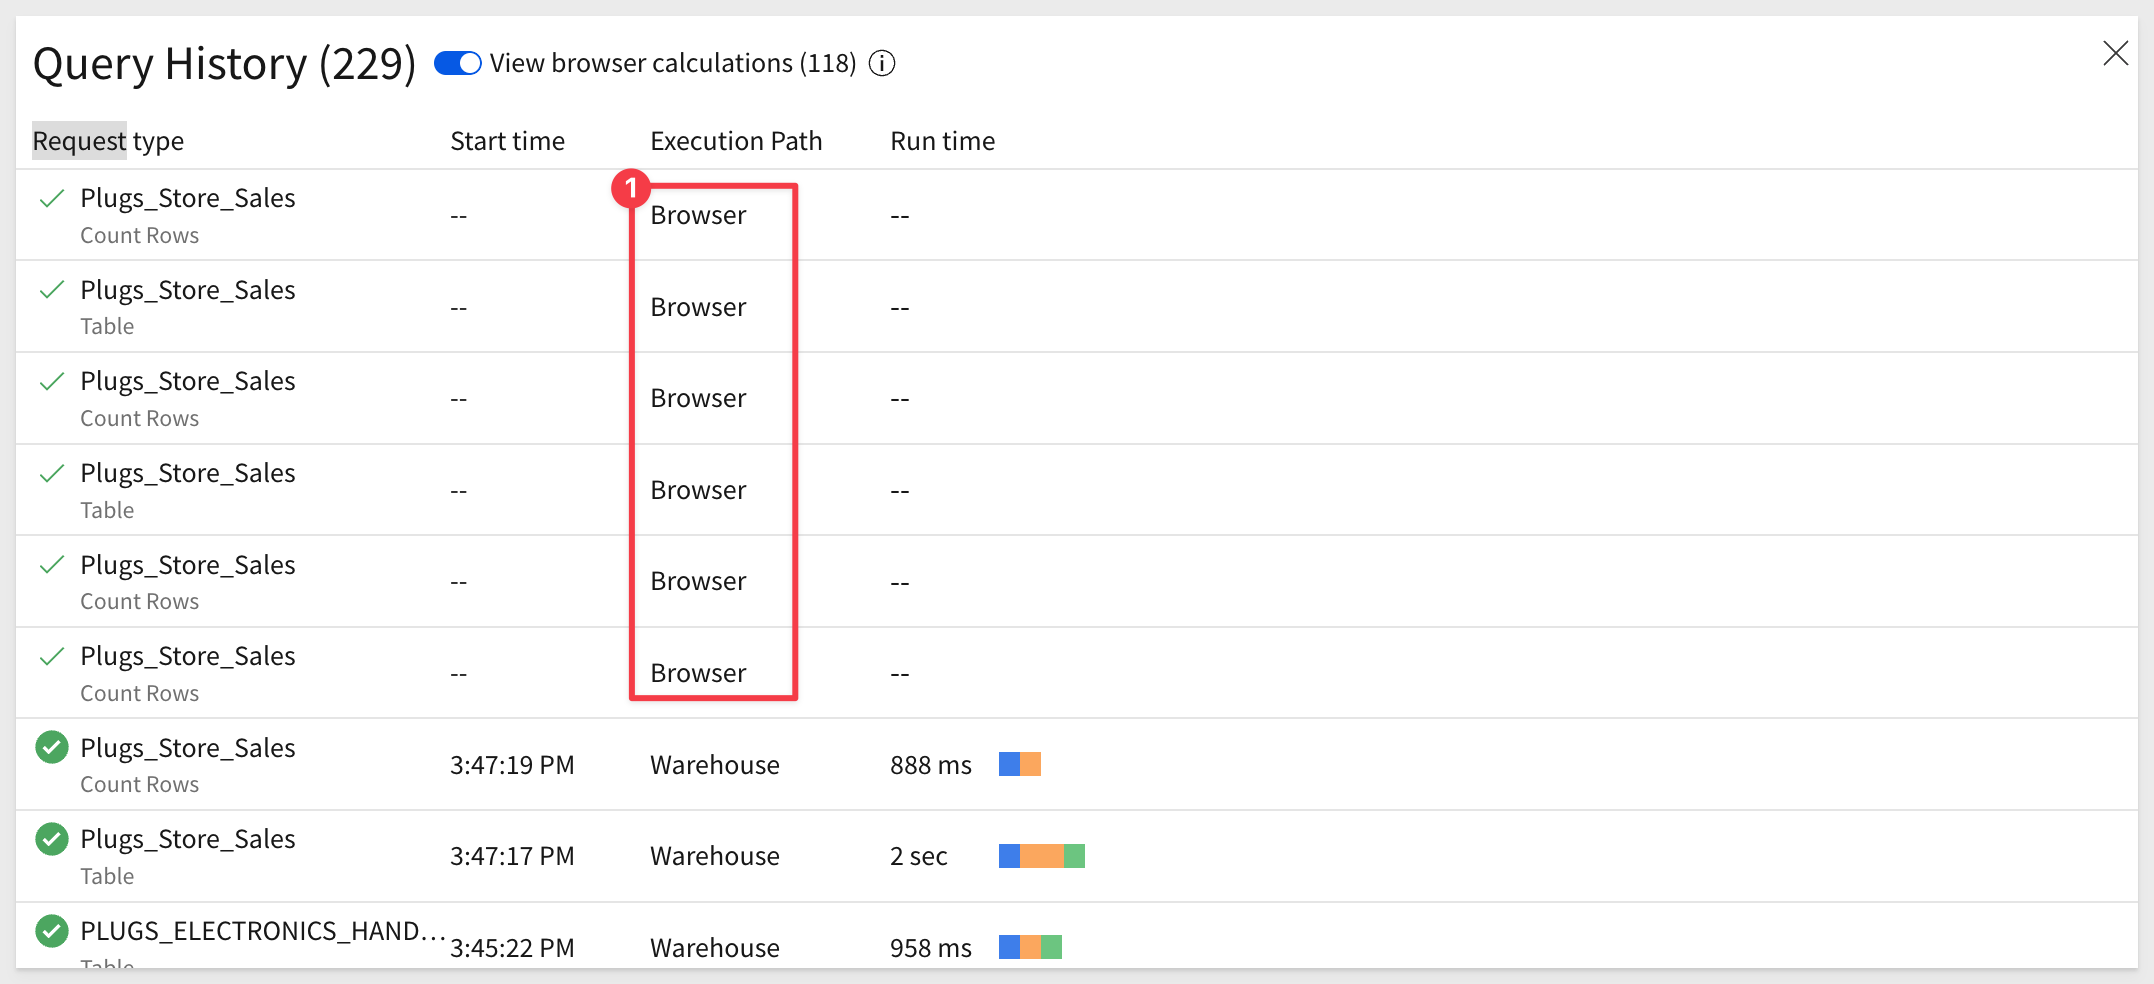
Click on the dropdown next to the refresh icon and select Query History to see exactly what is being run each time a change is made. This can be very useful for those with knowledge of SQL.
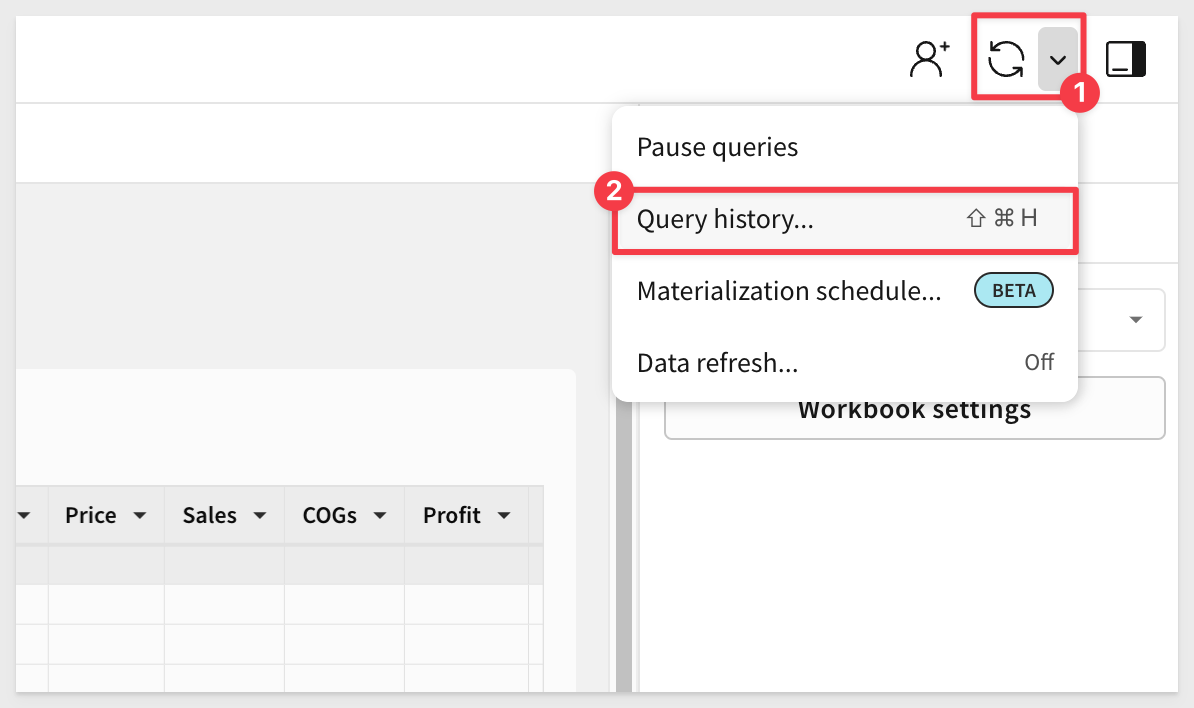
In this Sigma instance, there are many rows that have an Execution Path of Browser. This means that Sigma was able to generate the requested element without making a request to the warehouse. This is both efficient and saves warehouse costs too.
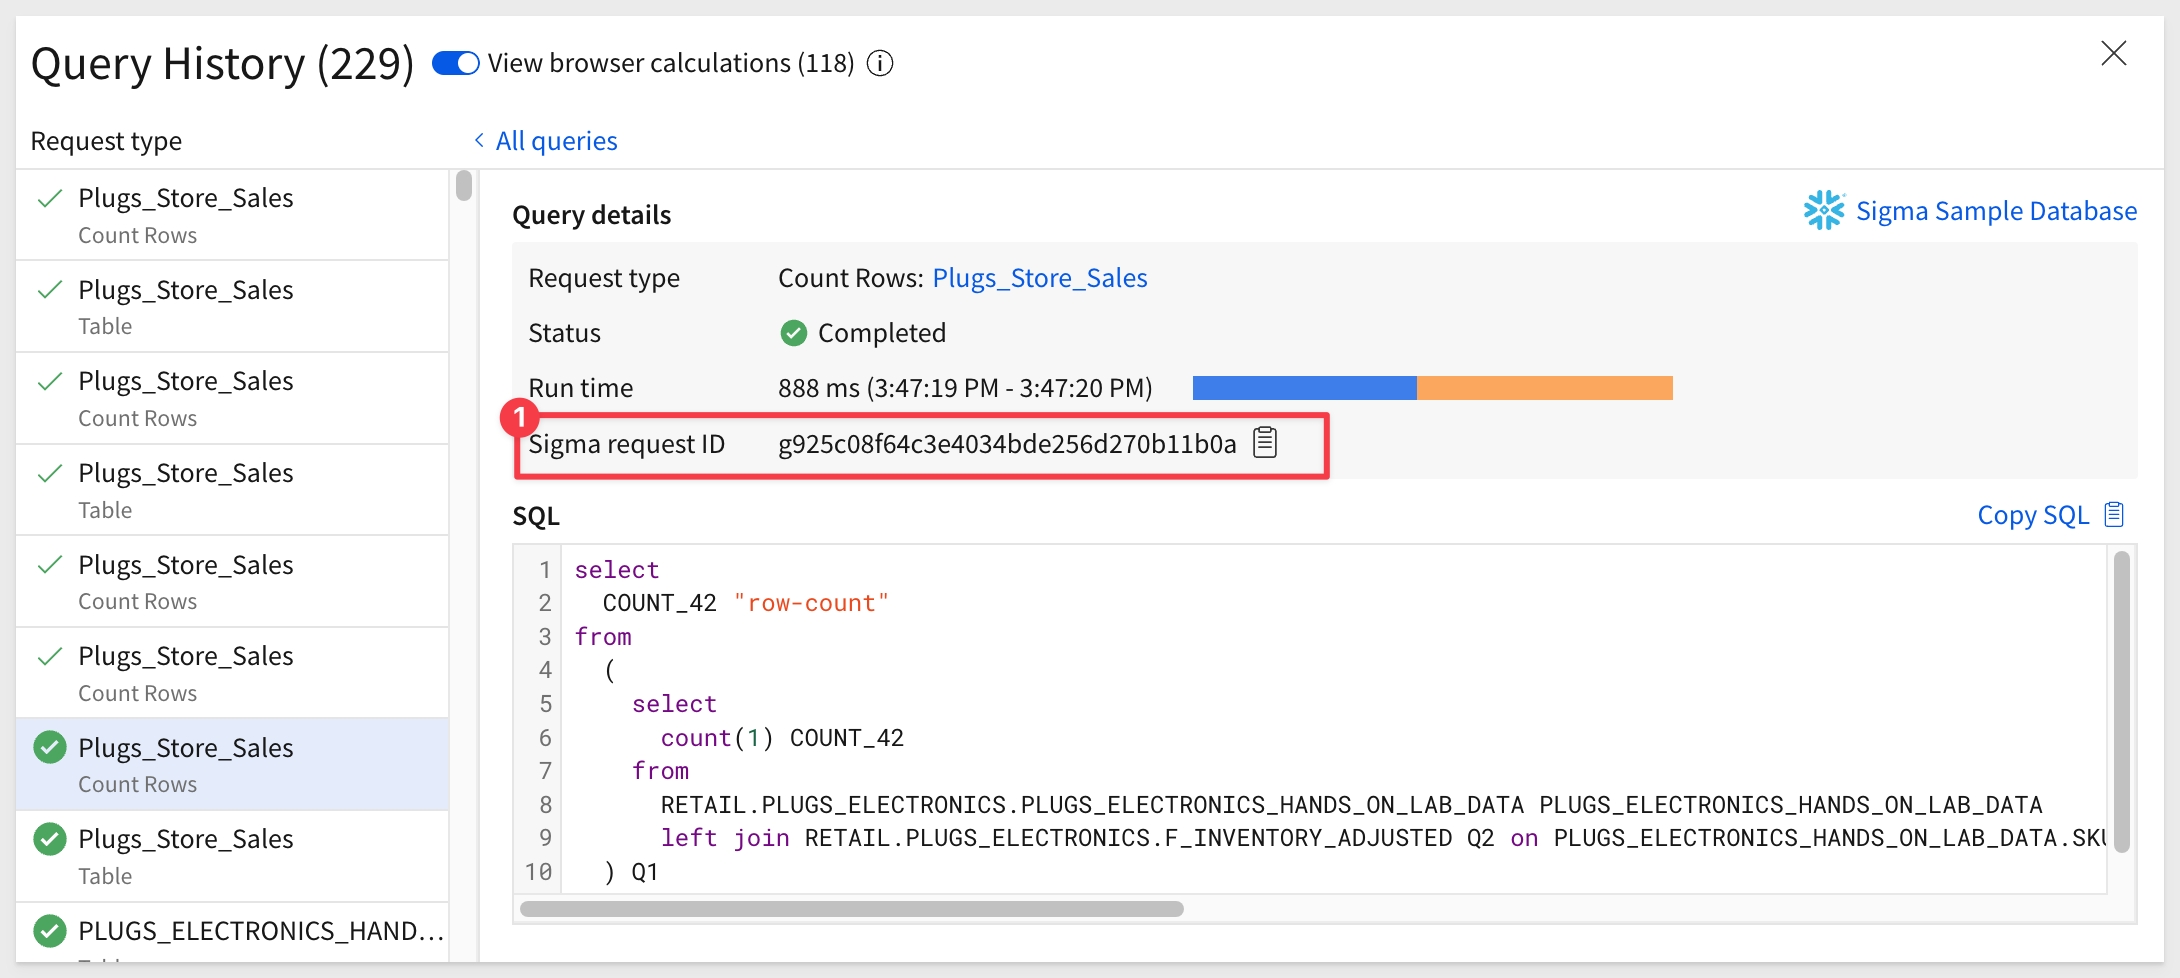
Clicking into a row that has an Execution Path of Warehouse gives every lots of details including the SQL that Sigma generated on your behalf.
If you ever have a deeper issue with Sigma, we provide the specific Sigma request ID. This value allows Sigma support to isolate an issue more quickly, so this is important to be aware of:
If you are interested in the low-level workings of Sigma's unique approach to data retrieval, read this QuickStart.
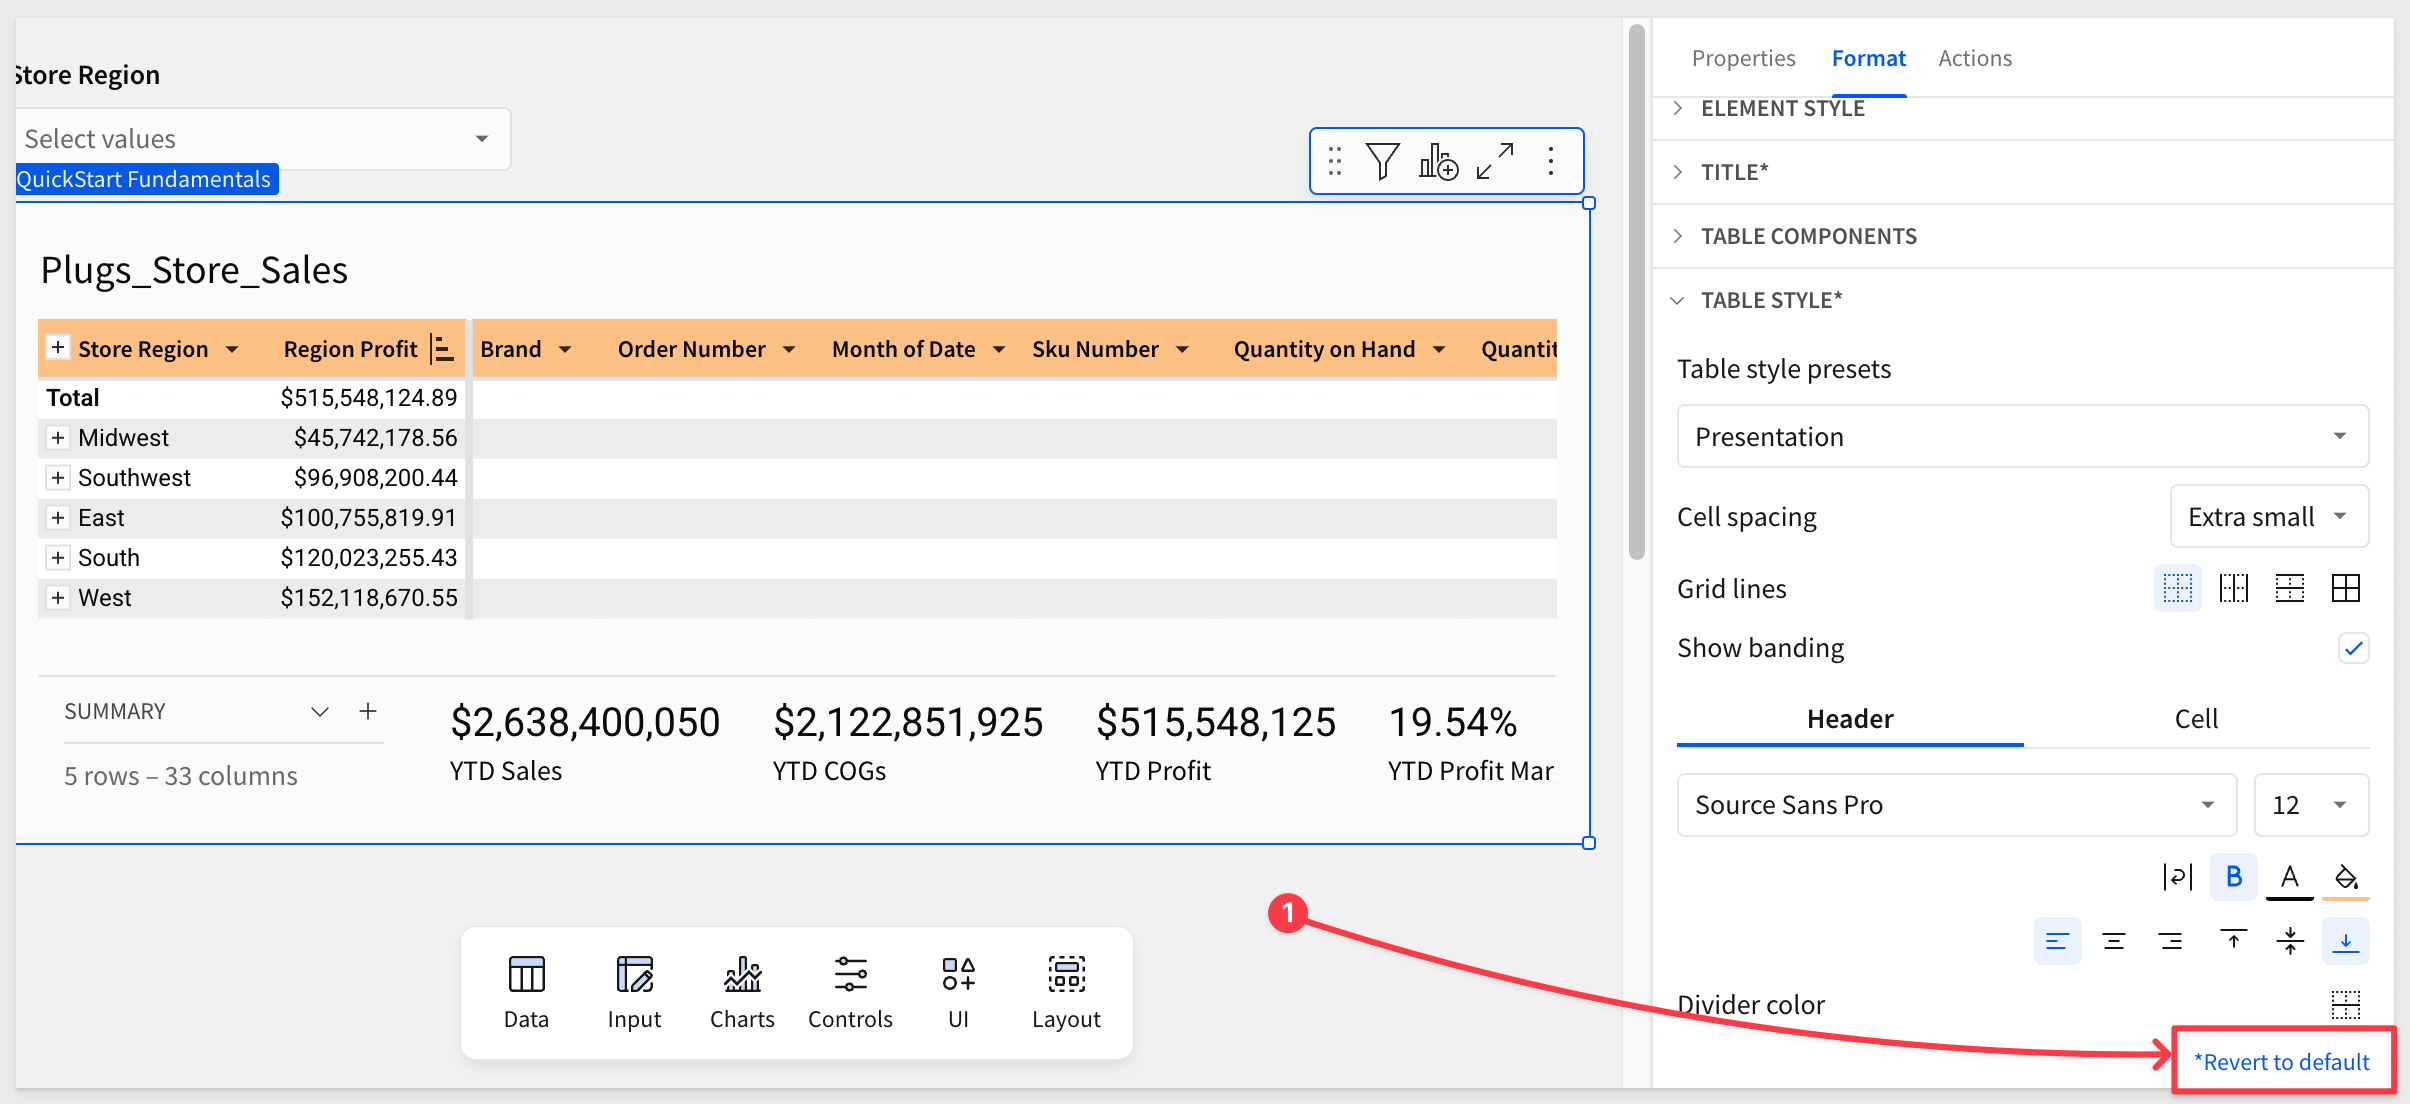
When working with tables, Sigma provides style presets for out-of-the-box aesthetics and readability. You can customize all style components independently for more personalized table designs.
There are two table presets that can be quickly set and then further customized to suit your needs, Spreadsheet and Presentation.
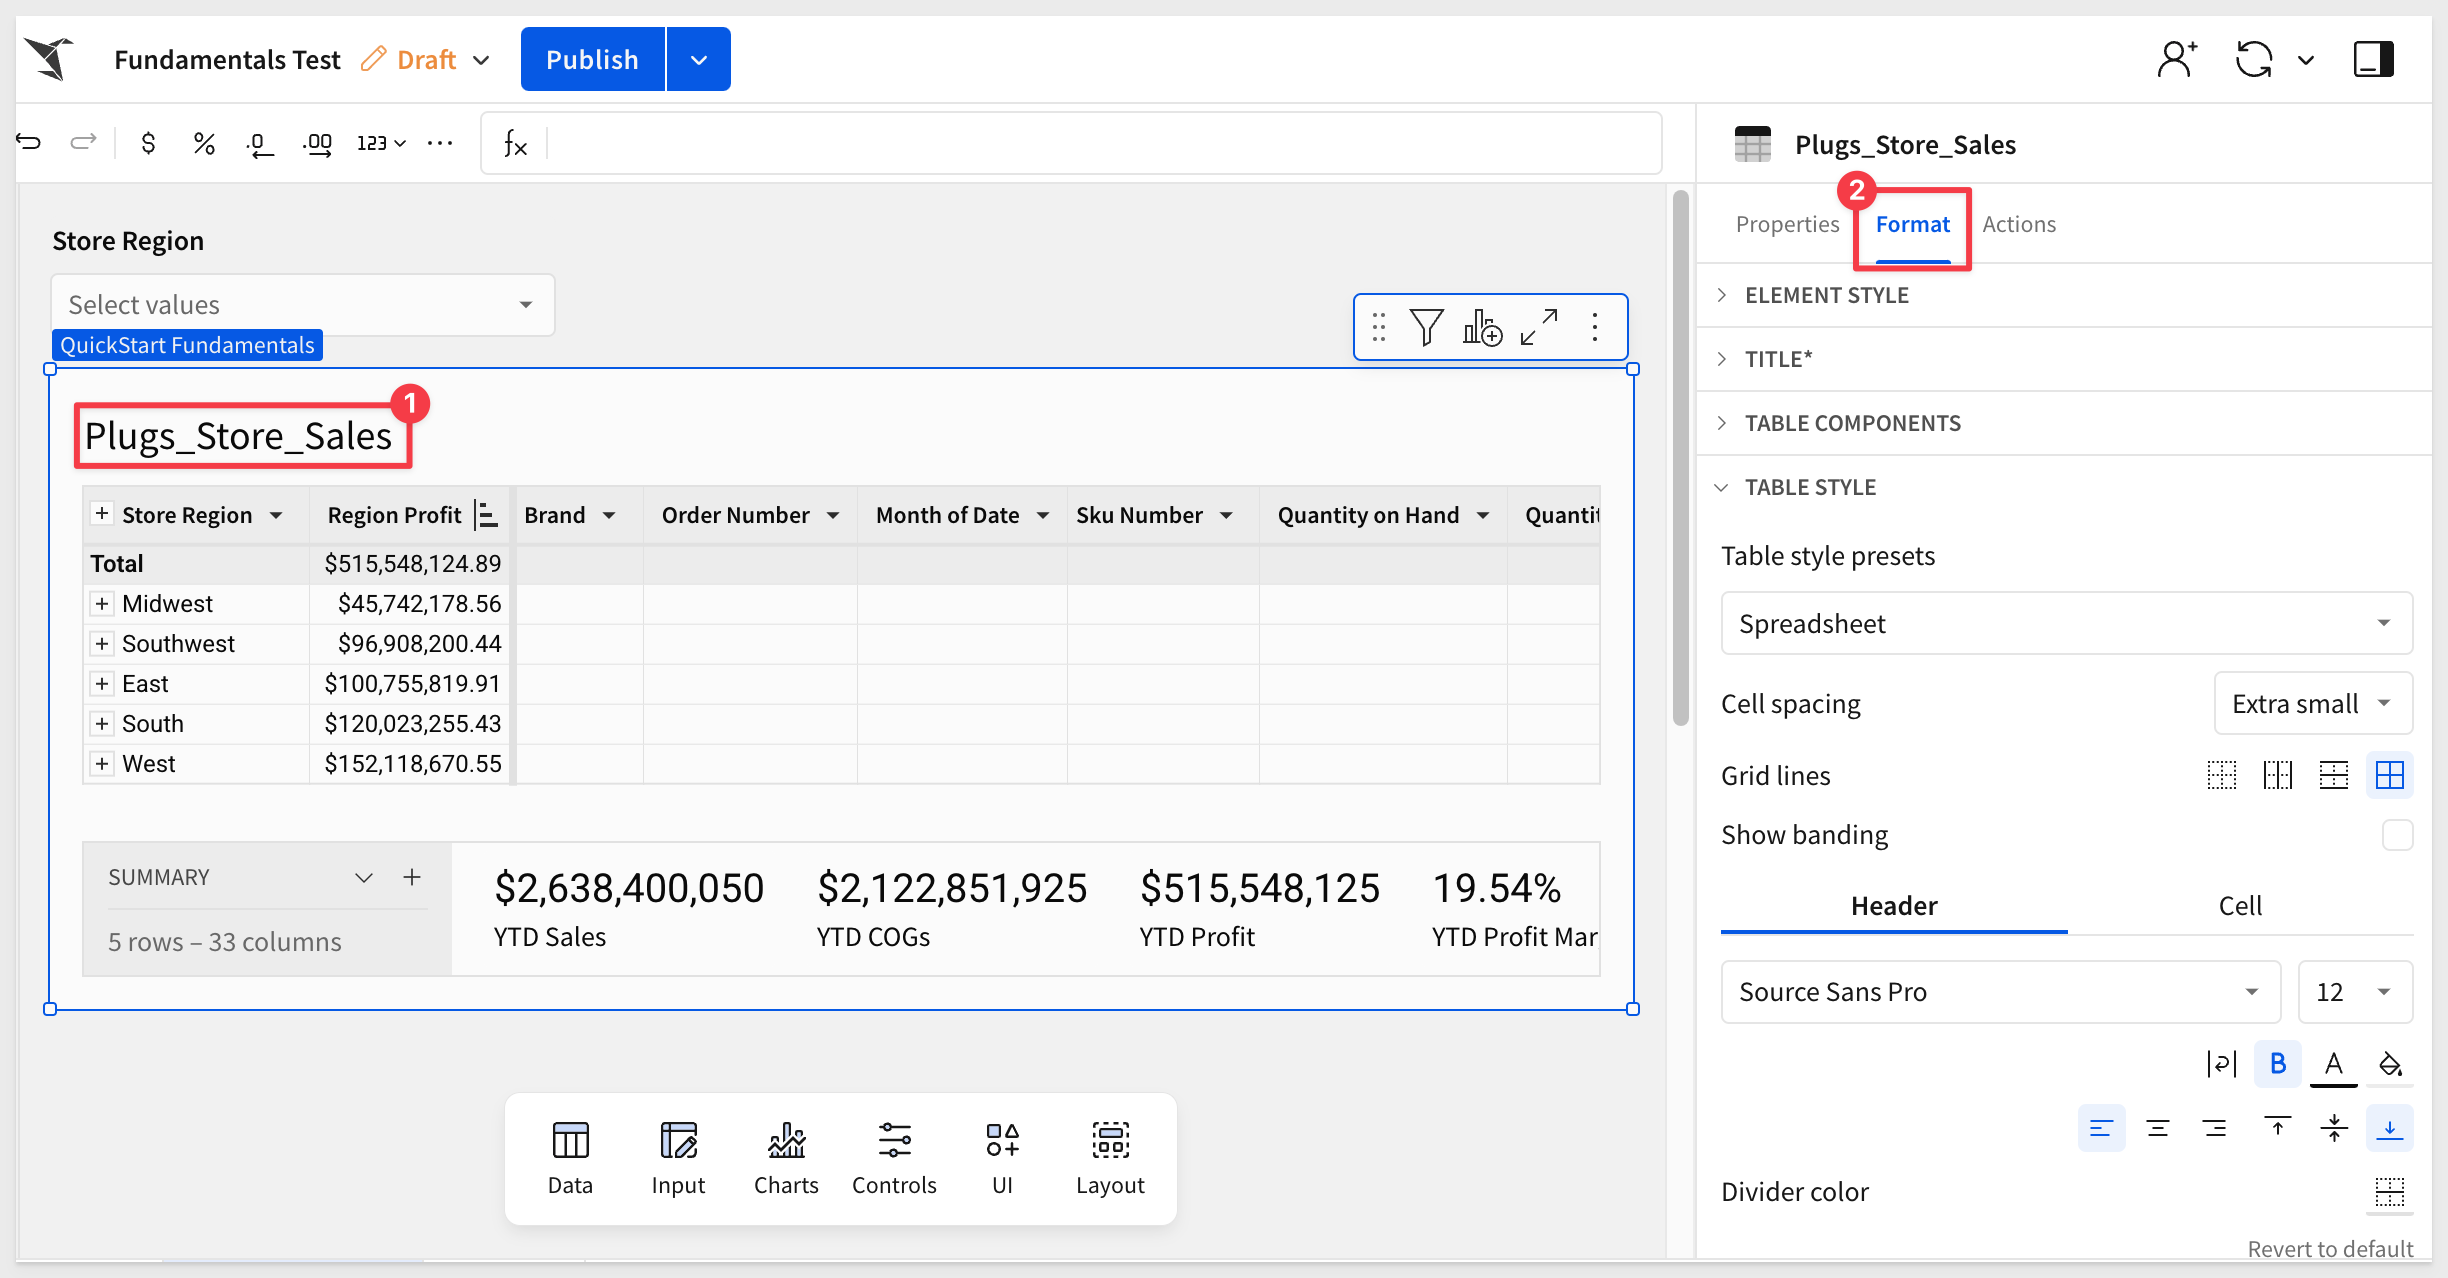
On the Dashboard page, click the table to select it, and then click Format in the Element panel.
This exposes the many options for styling the various aspects of the table.
Experiment with them to find a style that pleases.
There are many possible customizations to enhance tables. It is really easy to experiment and see what the results are.
Revert to default anytime:
Sigma will warn you if the styling set is problematic for some people. For example, if we set the table header to a black background with black text, Sigma lets you know that Text has low contrast:
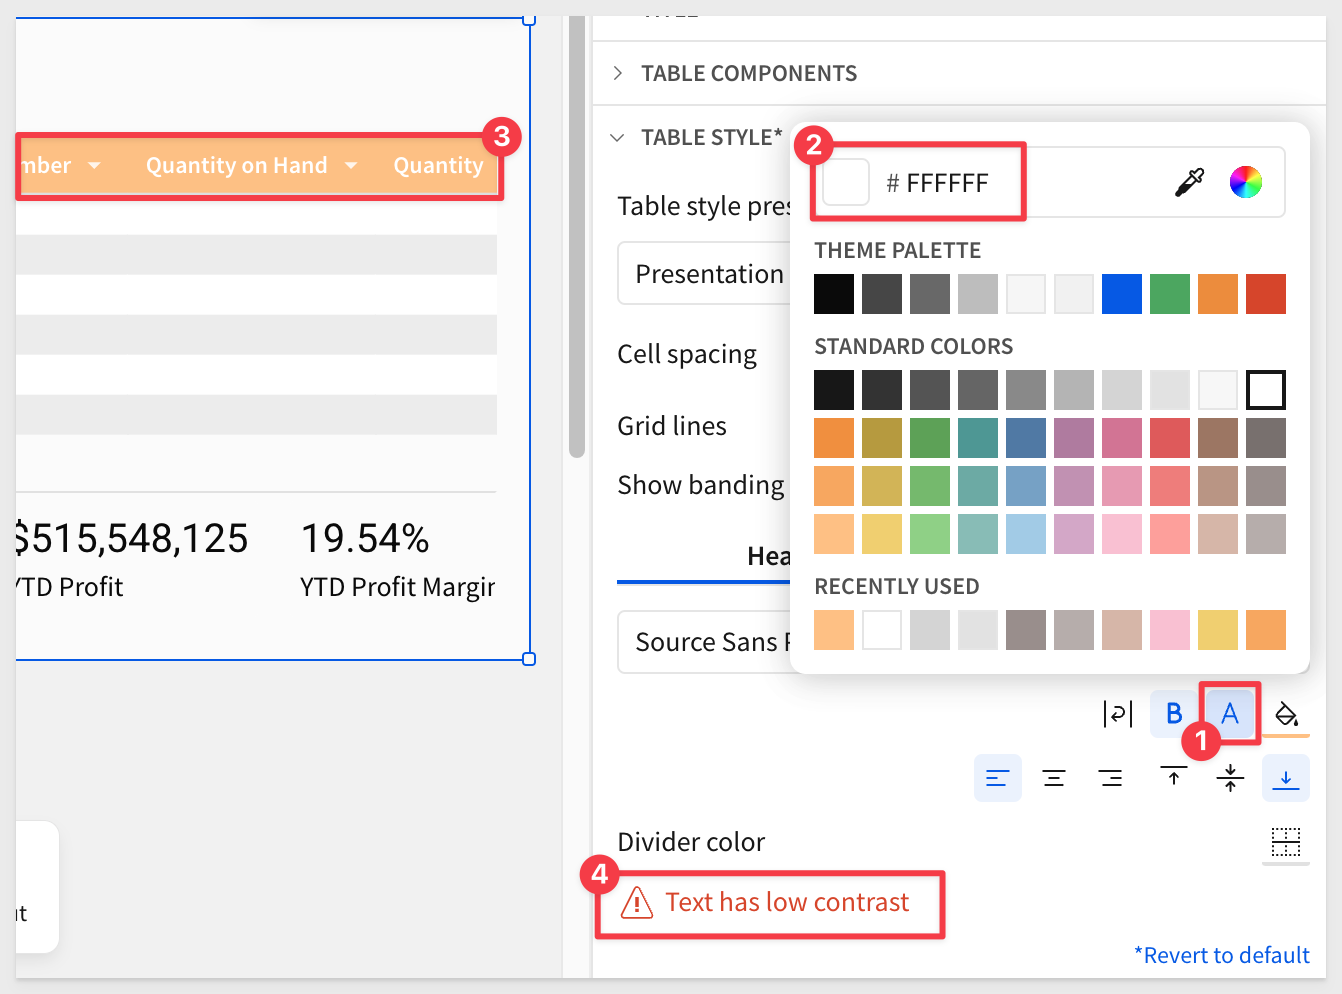
Once satisfied, click Publish.
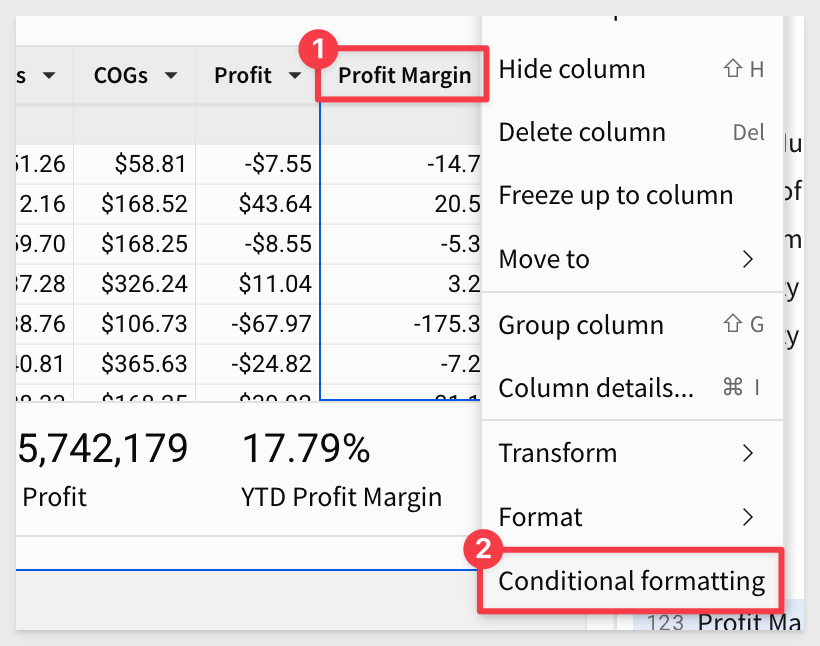
Sigma workbook tables can use colors to give the user a more comfortable experience, drawing their eyes to important information through the use of Conditional Formatting.
Using the Store Region control, filter the table to show only the Midwest.
We want to apply a Conditional Formatting to the Profit Margin column:
In the left-hand pane, configure the conditional formatting rule for the values as shown below.
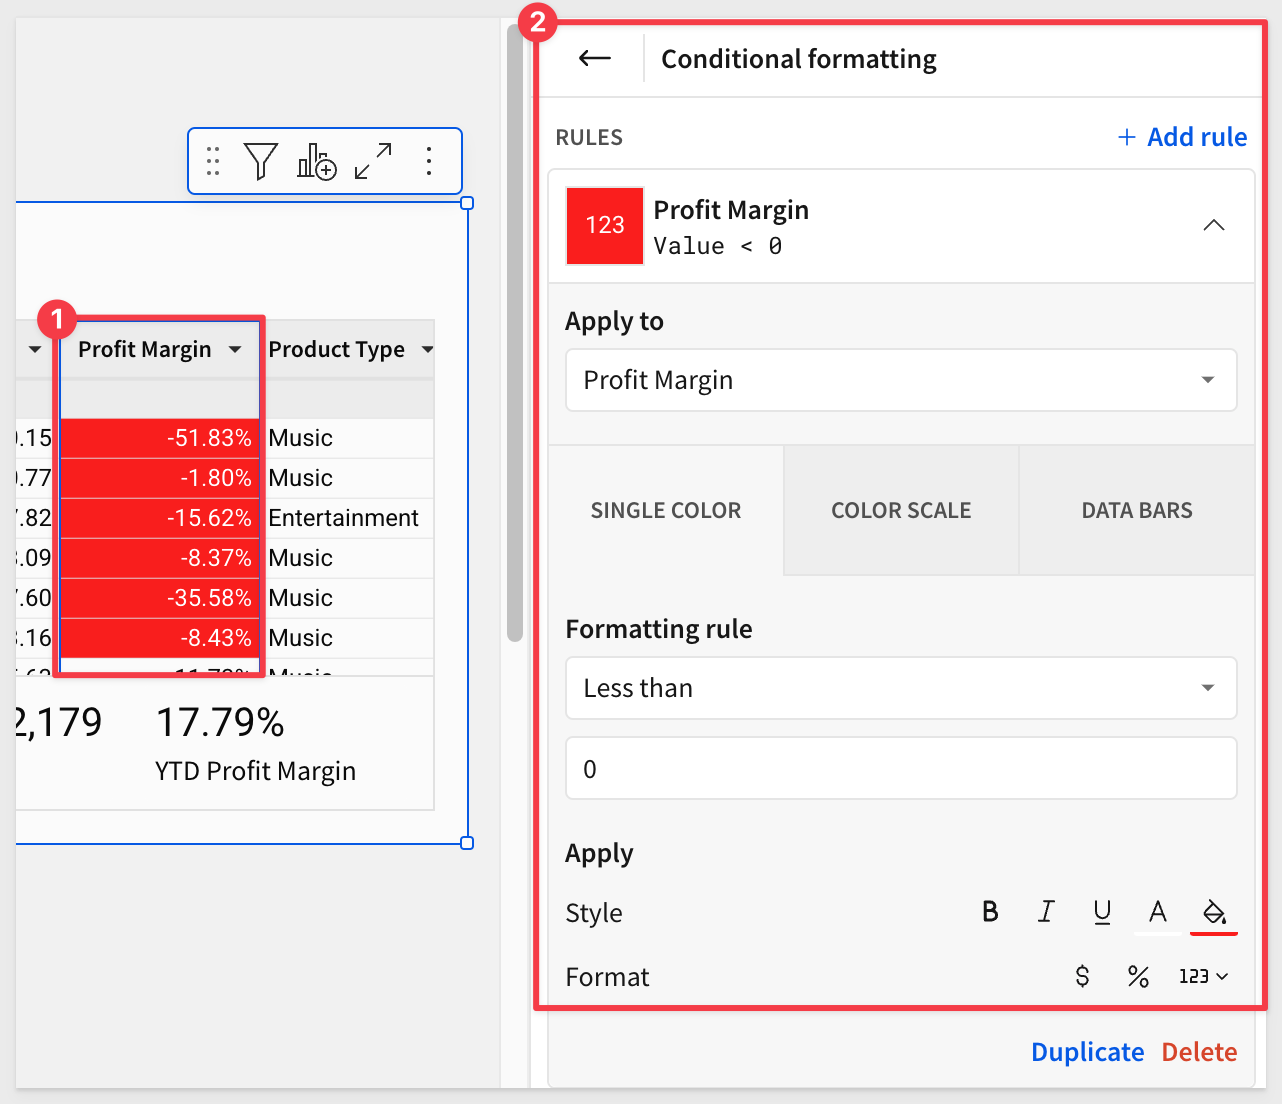
We can now see which transactions have a negative profit margin in red (changing the sort on the Profit Margin to ascending, if needed).
Add as many rules (and customize each rule) by clicking + Add rule.
There are many things you can do to enhance your table; feel free to experiment and see what you can come up with.
For more information, see Apply conditional formatting to table columns and cells
Clear the Store Region control.
Click Publish.
In this QuickStart, we covered how to access sample data to build a table, join other tables, add calculated columns, group and filter data, add table totals and summaries, and apply conditional formatting.
The next QuickStart in this series covers using pivot tables in Sigma
Additional Resource Links
Be sure to check out all the latest developments at Sigma's First Friday Feature page!
Help Center Home
Sigma Community
Sigma Blog