This QuickStart walks you through connecting Sigma to Google BigQuery and using live warehouse data in Sigma workbooks and data models. Sigma queries BigQuery in real time, letting teams explore, join, and model large datasets without extracts or local copies.
You'll configure a secure service account connection, validate access, and run a simple workbook to confirm that Sigma is issuing live SQL to BigQuery. From there, you'll be ready to build governed data models, create workbook explorations, and publish analytics directly on your BigQuery environment.
This QuickStart assumes you already have:
- A BigQuery project and dataset
- Admin rights to create a service account and private key
- A Sigma Admin account
If you use a different authentication or IAM pattern (e.g., workload identities, restricted service accounts), the steps are similar—the goal is to give Sigma a secure, scoped BigQuery identity that can execute warehouse queries.
For more information on Sigma's product release strategy, see Sigma product releases
### Target Audience Customers who are interested in Sigma's cloud analytics and BI platform to tap into BigQuery's virtually unlimited scale and speed.
Prerequisites
- A computer with a current browser.
- Access to your Sigma environment as "administrator"
- Some familiarity with Sigma is assumed. Not all steps will be shown as the basics are assumed to be understood.
- A Google cloud (GCP) account with Administrative access.
What You'll Learn
How to leverage BigQuery in Sigma, connecting to data, creating tables / pivots and visualizations, all using the power of the Google Cloud.
What You'll Build
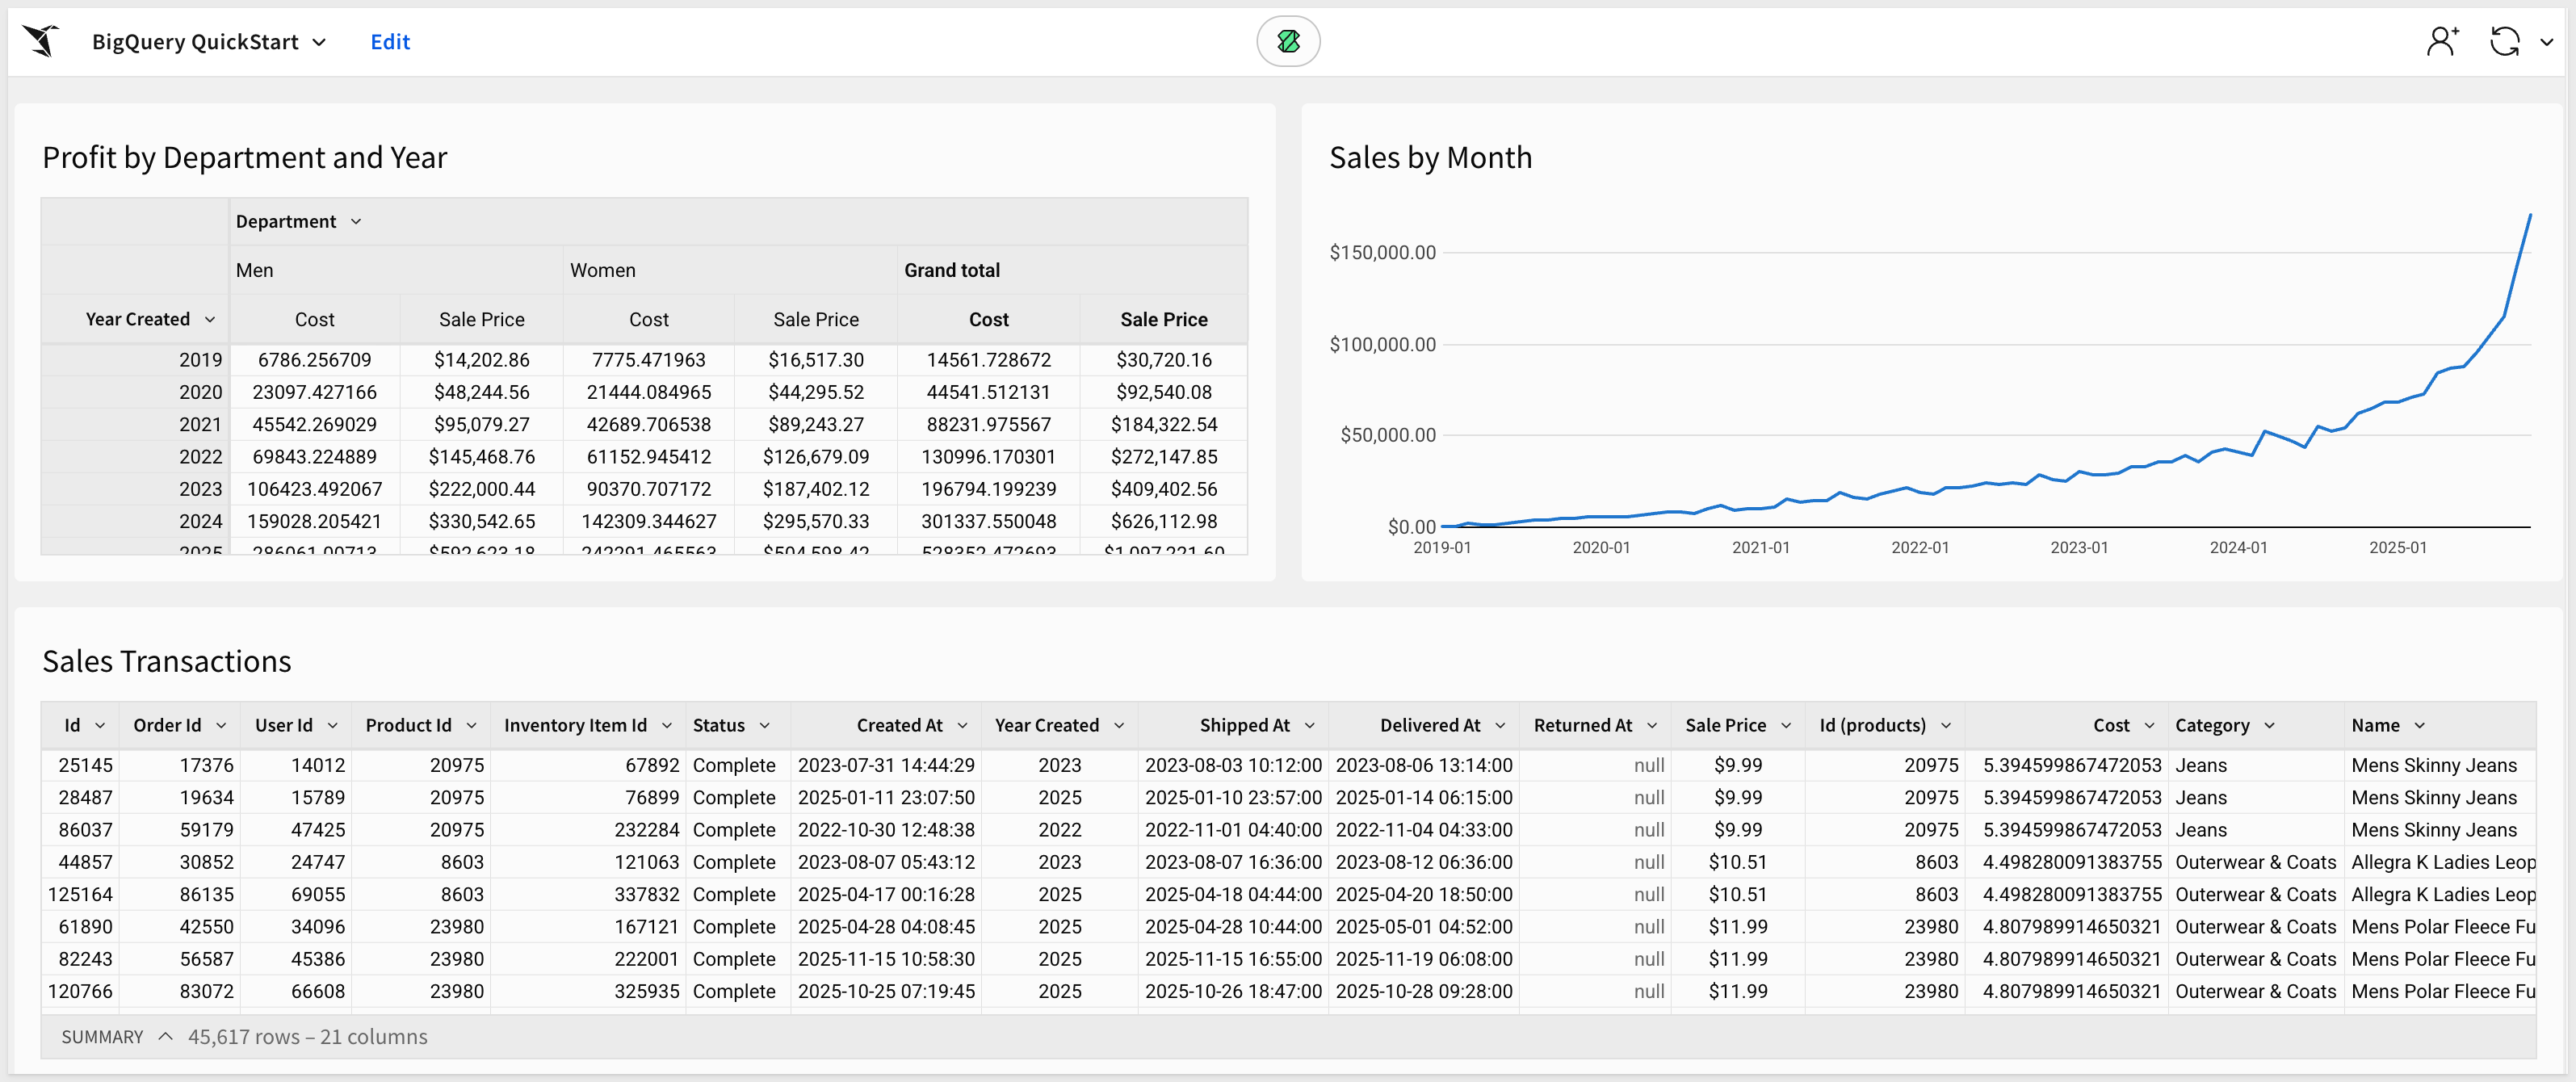
We will use Sigma, BigQuery and Google provided sample data to build a simple dashboard similar to this one:

Spreadsheet UI:
Sigma's self-service tooling is a league beyond other BI tools because it caters to the toolset that almost every data worker knows, the spreadsheet. Google Sheets users can seamlessly transition from asking questions in Sheets to Sigma ensuring that time to implementation stays low.
Additionally, since users can quickly iterate through their analysis on data at any scale, this reduces the overall number of requests sent back to the analytics team.
Sigma's no-code interface creates machine-generated SQL (optimized for every database Sigma connects to) under the hood, so any database engineer can always get right into the data and even test out the results of an analysis directly in their warehouse.
Data Governance & Optional Modeling:
In Sigma, our goal is to allow your analysts and users to leverage the work of your data engineers without any additional work. Whether you're using tools like Matillion, DBT, or modeling in your warehouse, your end users can start analyzing data they've been permitted to access.
Sigma features a robust suite of data governance levers from metrics (to govern KPIs), to team and workspace-based sharing.
Sigma also offers an incredibly flexible structure for row-level security called user attributes which allows you to define unique characteristics for users and the corresponding data they should see within a table. This ensures that data shared internally and externally is always governed by a strict rule set that scales endlessly.
Input Tables:
With Input Tables, your teams can effortlessly incorporate human context into their analysis by bringing their own data directly into the warehouse, all without writing any code. With Input Tables, both your analytics and business teams can remove data roadblocks, reduce repetitive analytics tasks, and make more impactful decisions faster.
This unique capability ensures teams can create detailed forecasts from historical data and future projections, build internal data auditing tools, perform rapid data prototyping with external sources, or build detailed models that can be managed with just a few inputs.
For most BI tools, it's impossible to bring in the human context of data, and, because of this, users default back to tools like Google Sheets because the context they provide is crucial to the overall analysis. Sigma solves this problem by giving your analytics team a way to govern reporting while empowering individual team members to add details and context with Input Tables.
Sigma Alpha Query:
Sigma Alpha Query is an intelligent processing layer that automatically optimizes performance by performing calculations in the browser when possible, rather than querying BigQuery for every operation. This seamless technology leverages cached data to compute results instantly, delivering spreadsheet-like responsiveness while working with warehouse-scale data.
Alpha Query operates automatically in the background—there's nothing to configure. When you're exploring data or prototyping analyses in Sigma, Alpha Query intelligently determines whether calculations can be completed using data already present in your browser. If sufficient data exists locally, computations happen immediately. When additional data is needed, Sigma routes the request to BigQuery.
This capability substantially decreases the total number of queries issued to BigQuery during data exploration and analysis. By reducing warehouse load during iterative work, Alpha Query not only improves performance but also helps optimize your BigQuery costs. Users experience the instant responsiveness they expect from desktop spreadsheets, while still working with the full power and scale of their BigQuery data warehouse.
For more information on, see the QuickStart Sigma's Query Engine
Create Google Cloud Project
The BigQuery sandbox lets you explore limited BigQuery capabilities at no cost to confirm whether BigQuery fits your needs. The BigQuery sandbox lets you experience BigQuery without providing a credit card or creating a billing account for your project. If you already created a billing account, you can still use BigQuery at no cost in the free usage tier.
Log in to your GCP as Administrator.
Navigate to the BigQuery sandbox and follow the instructions for obtaining access.
Log into the Google Cloud console: 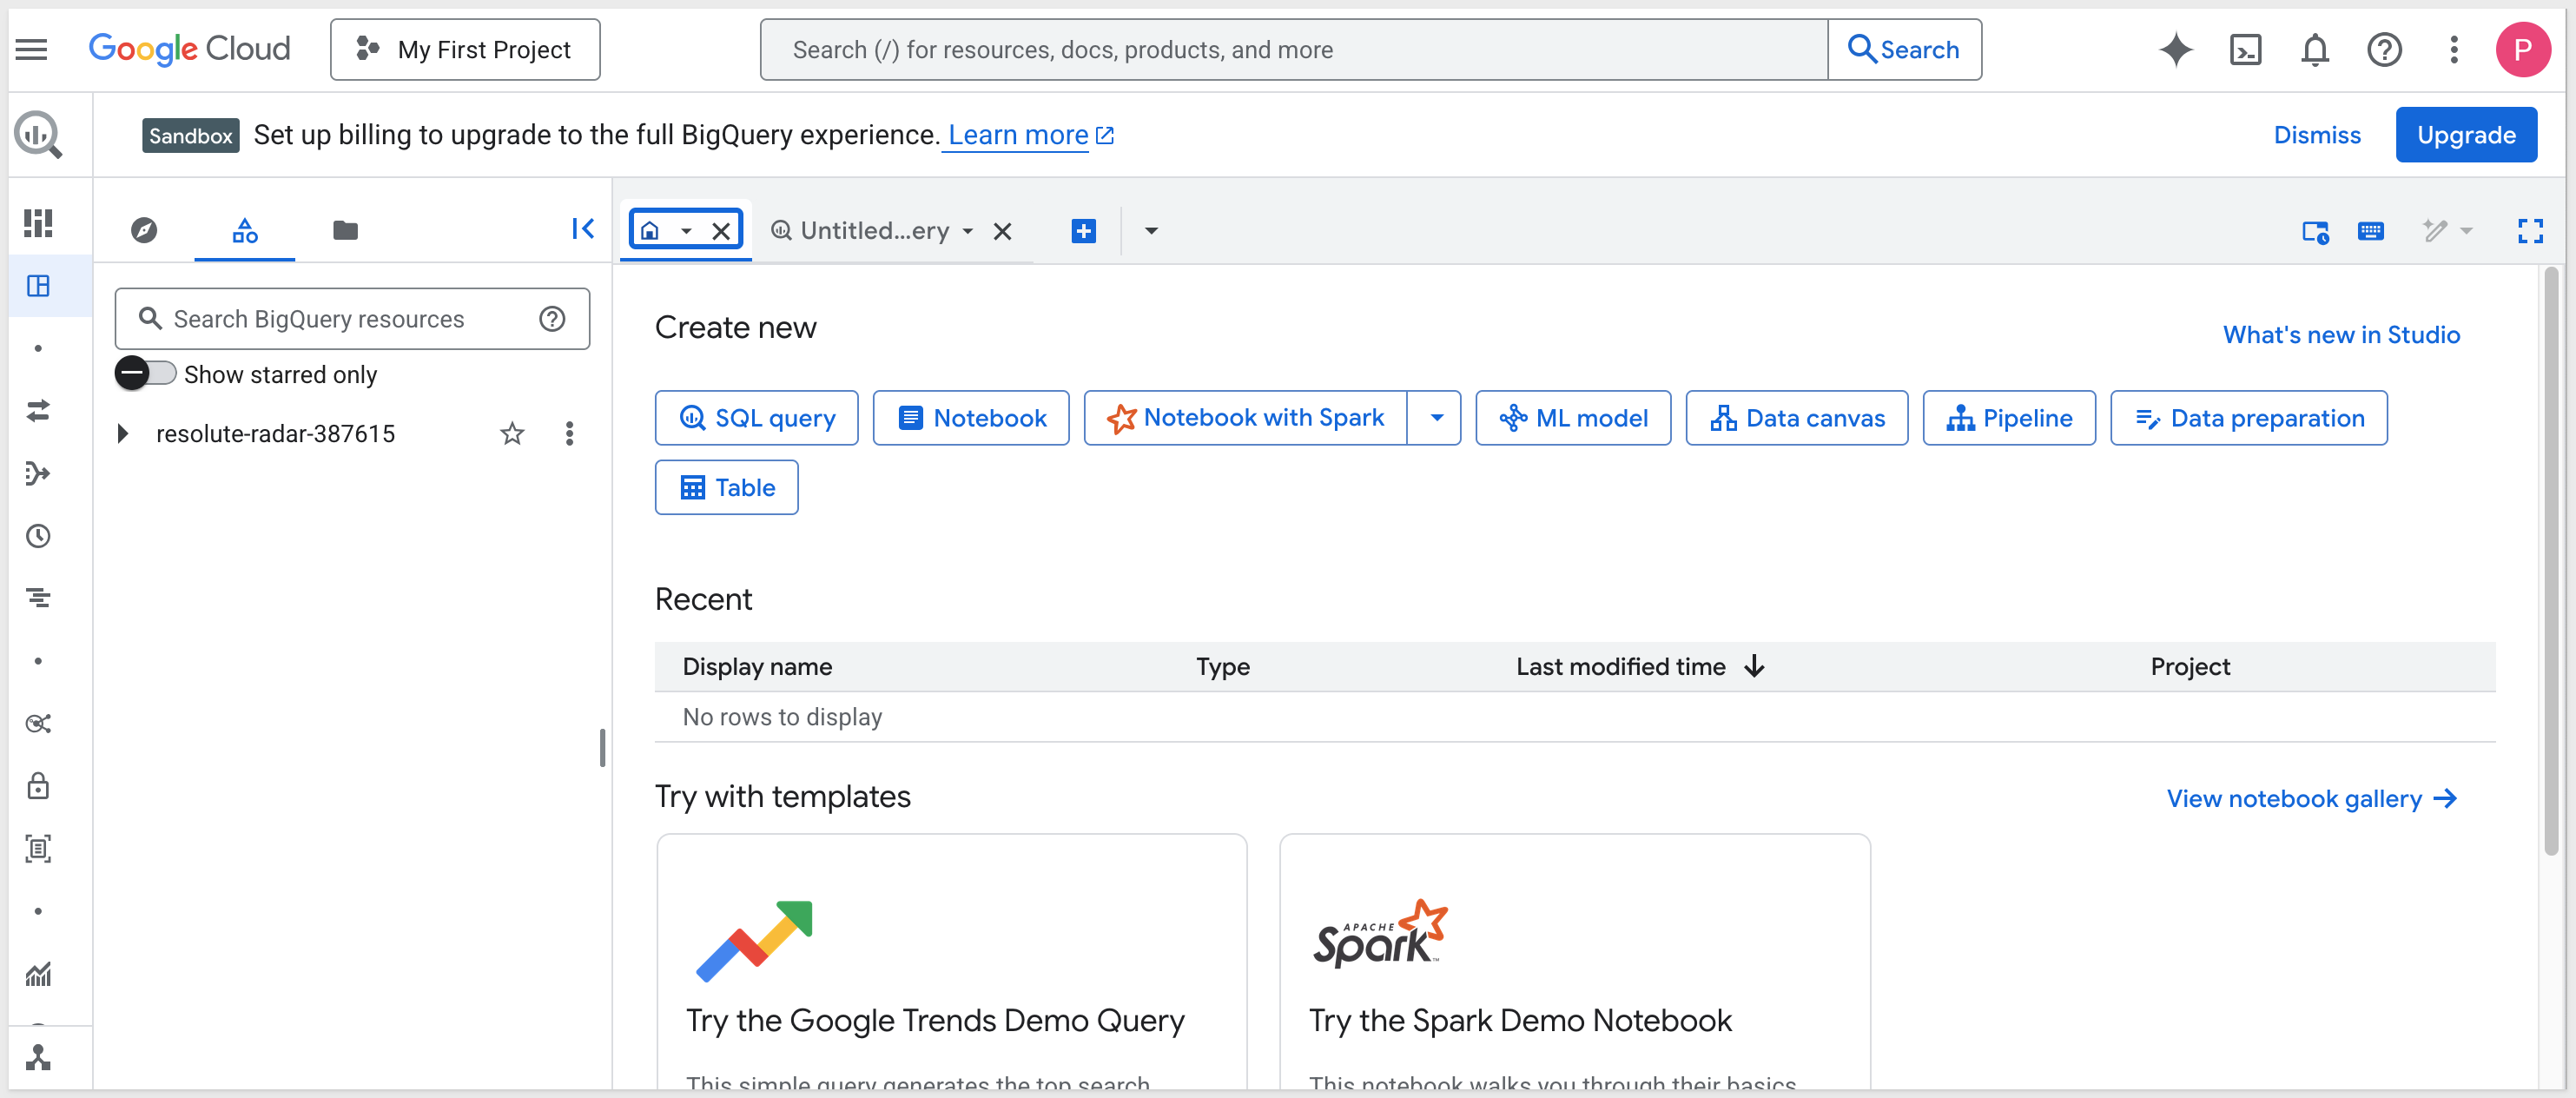
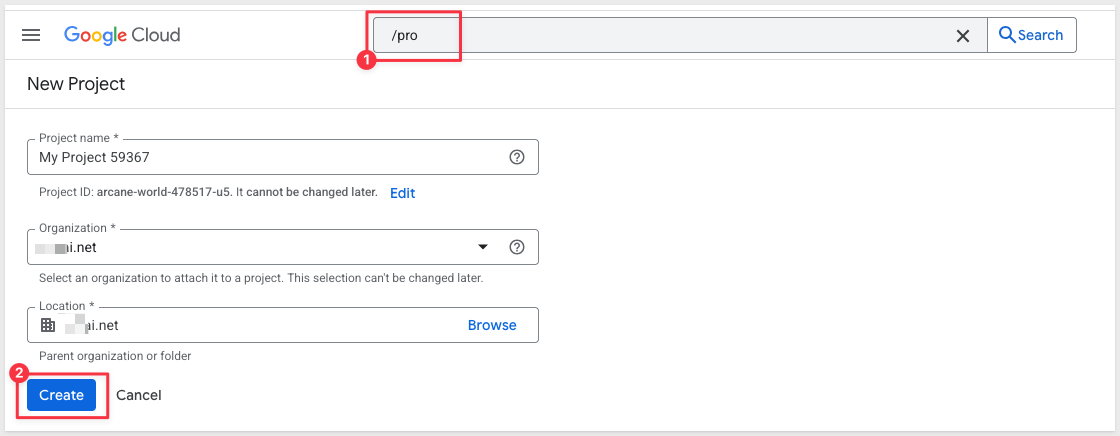
Create a new project:
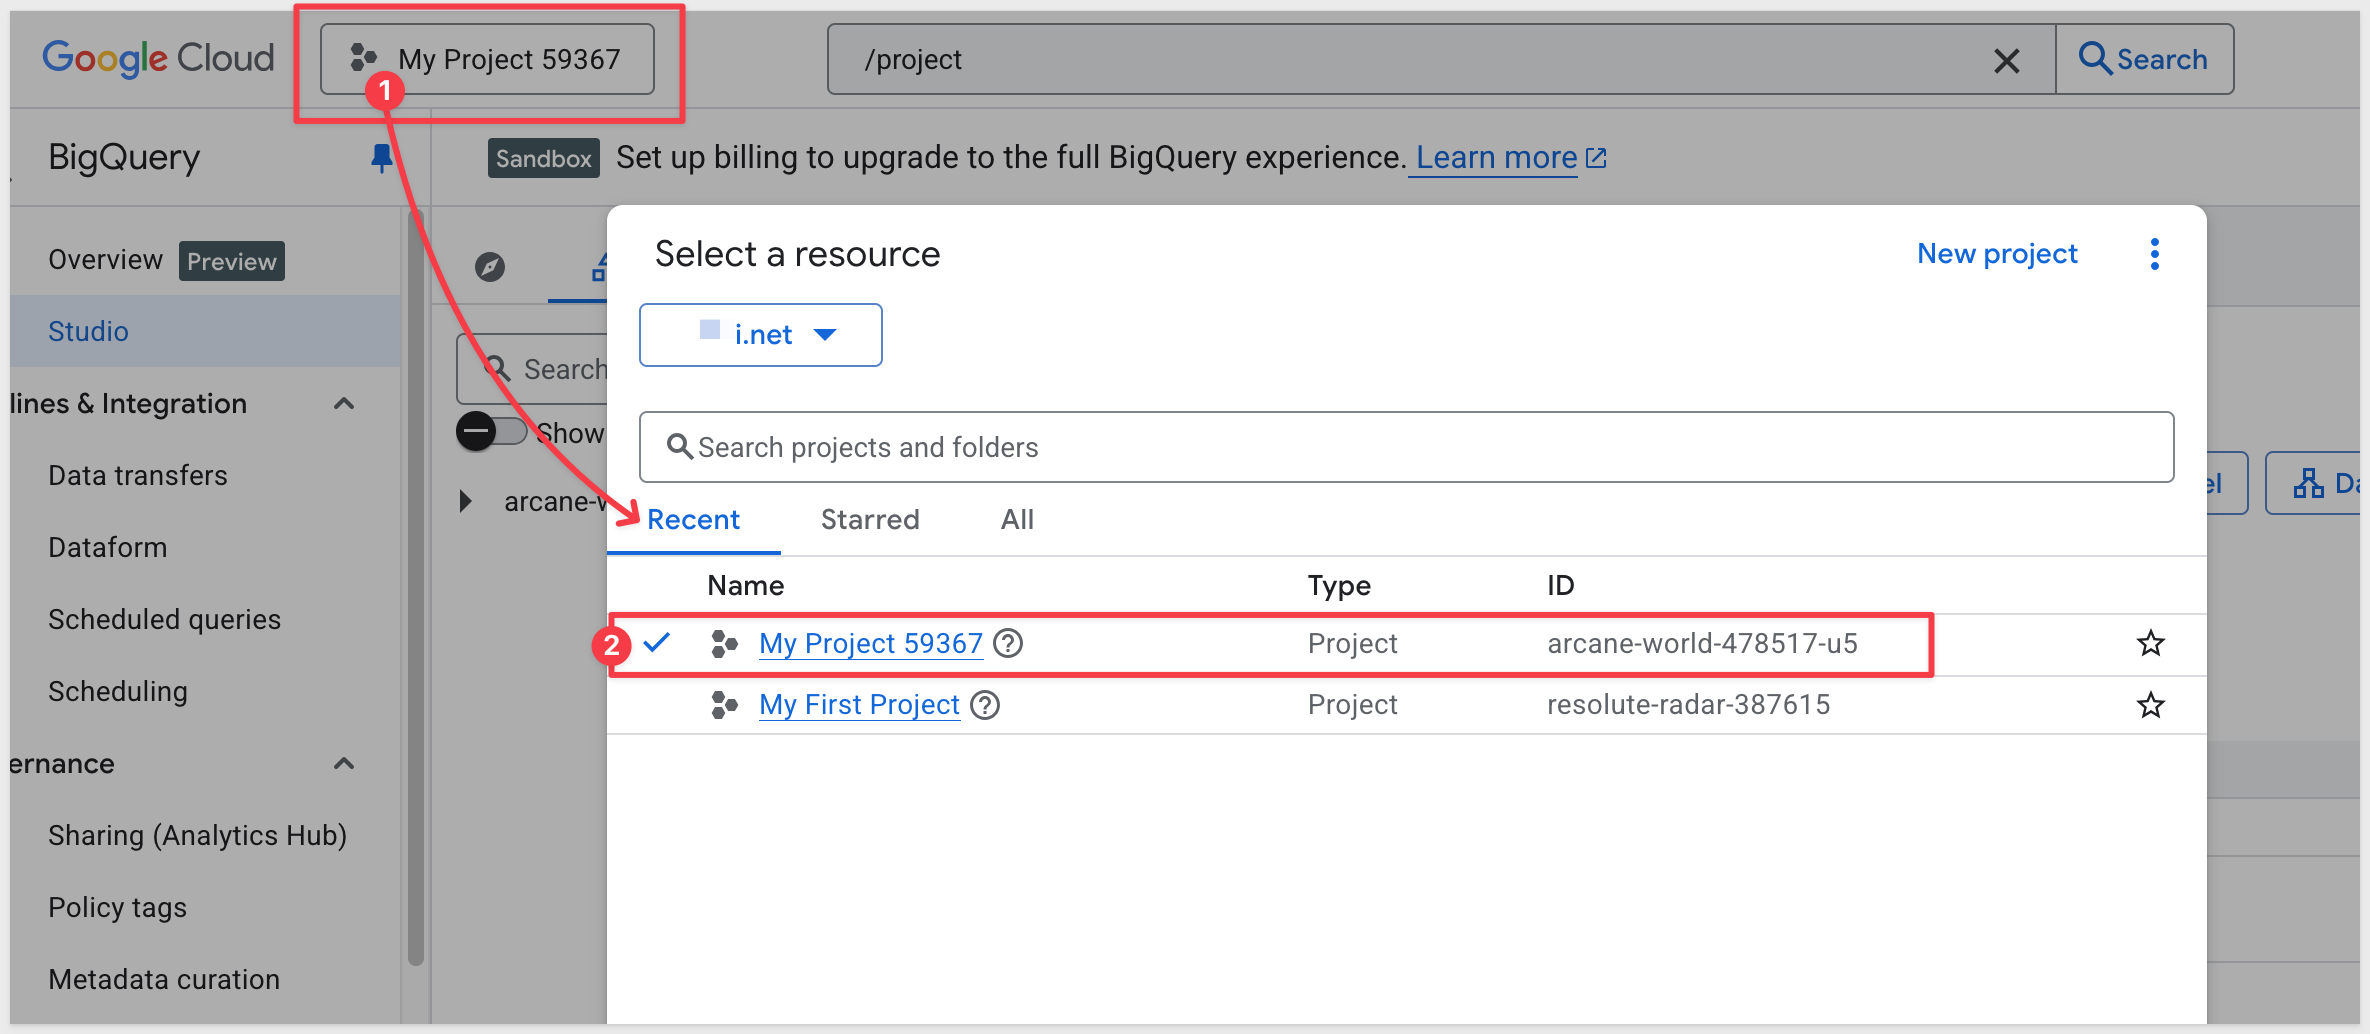
Click the button as shown below to access the resources modal and select the newly created project:
Click the explorer icon and `+ Add data:
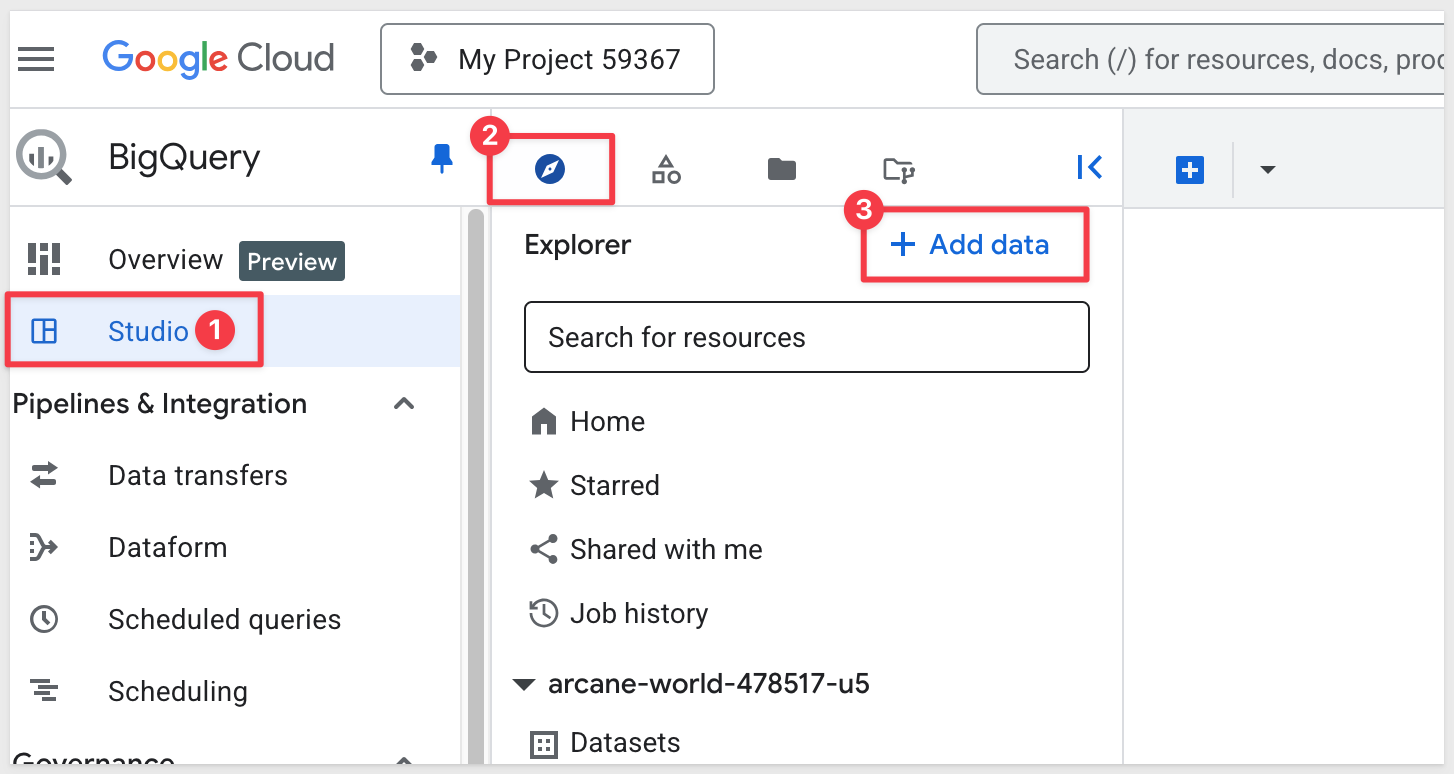
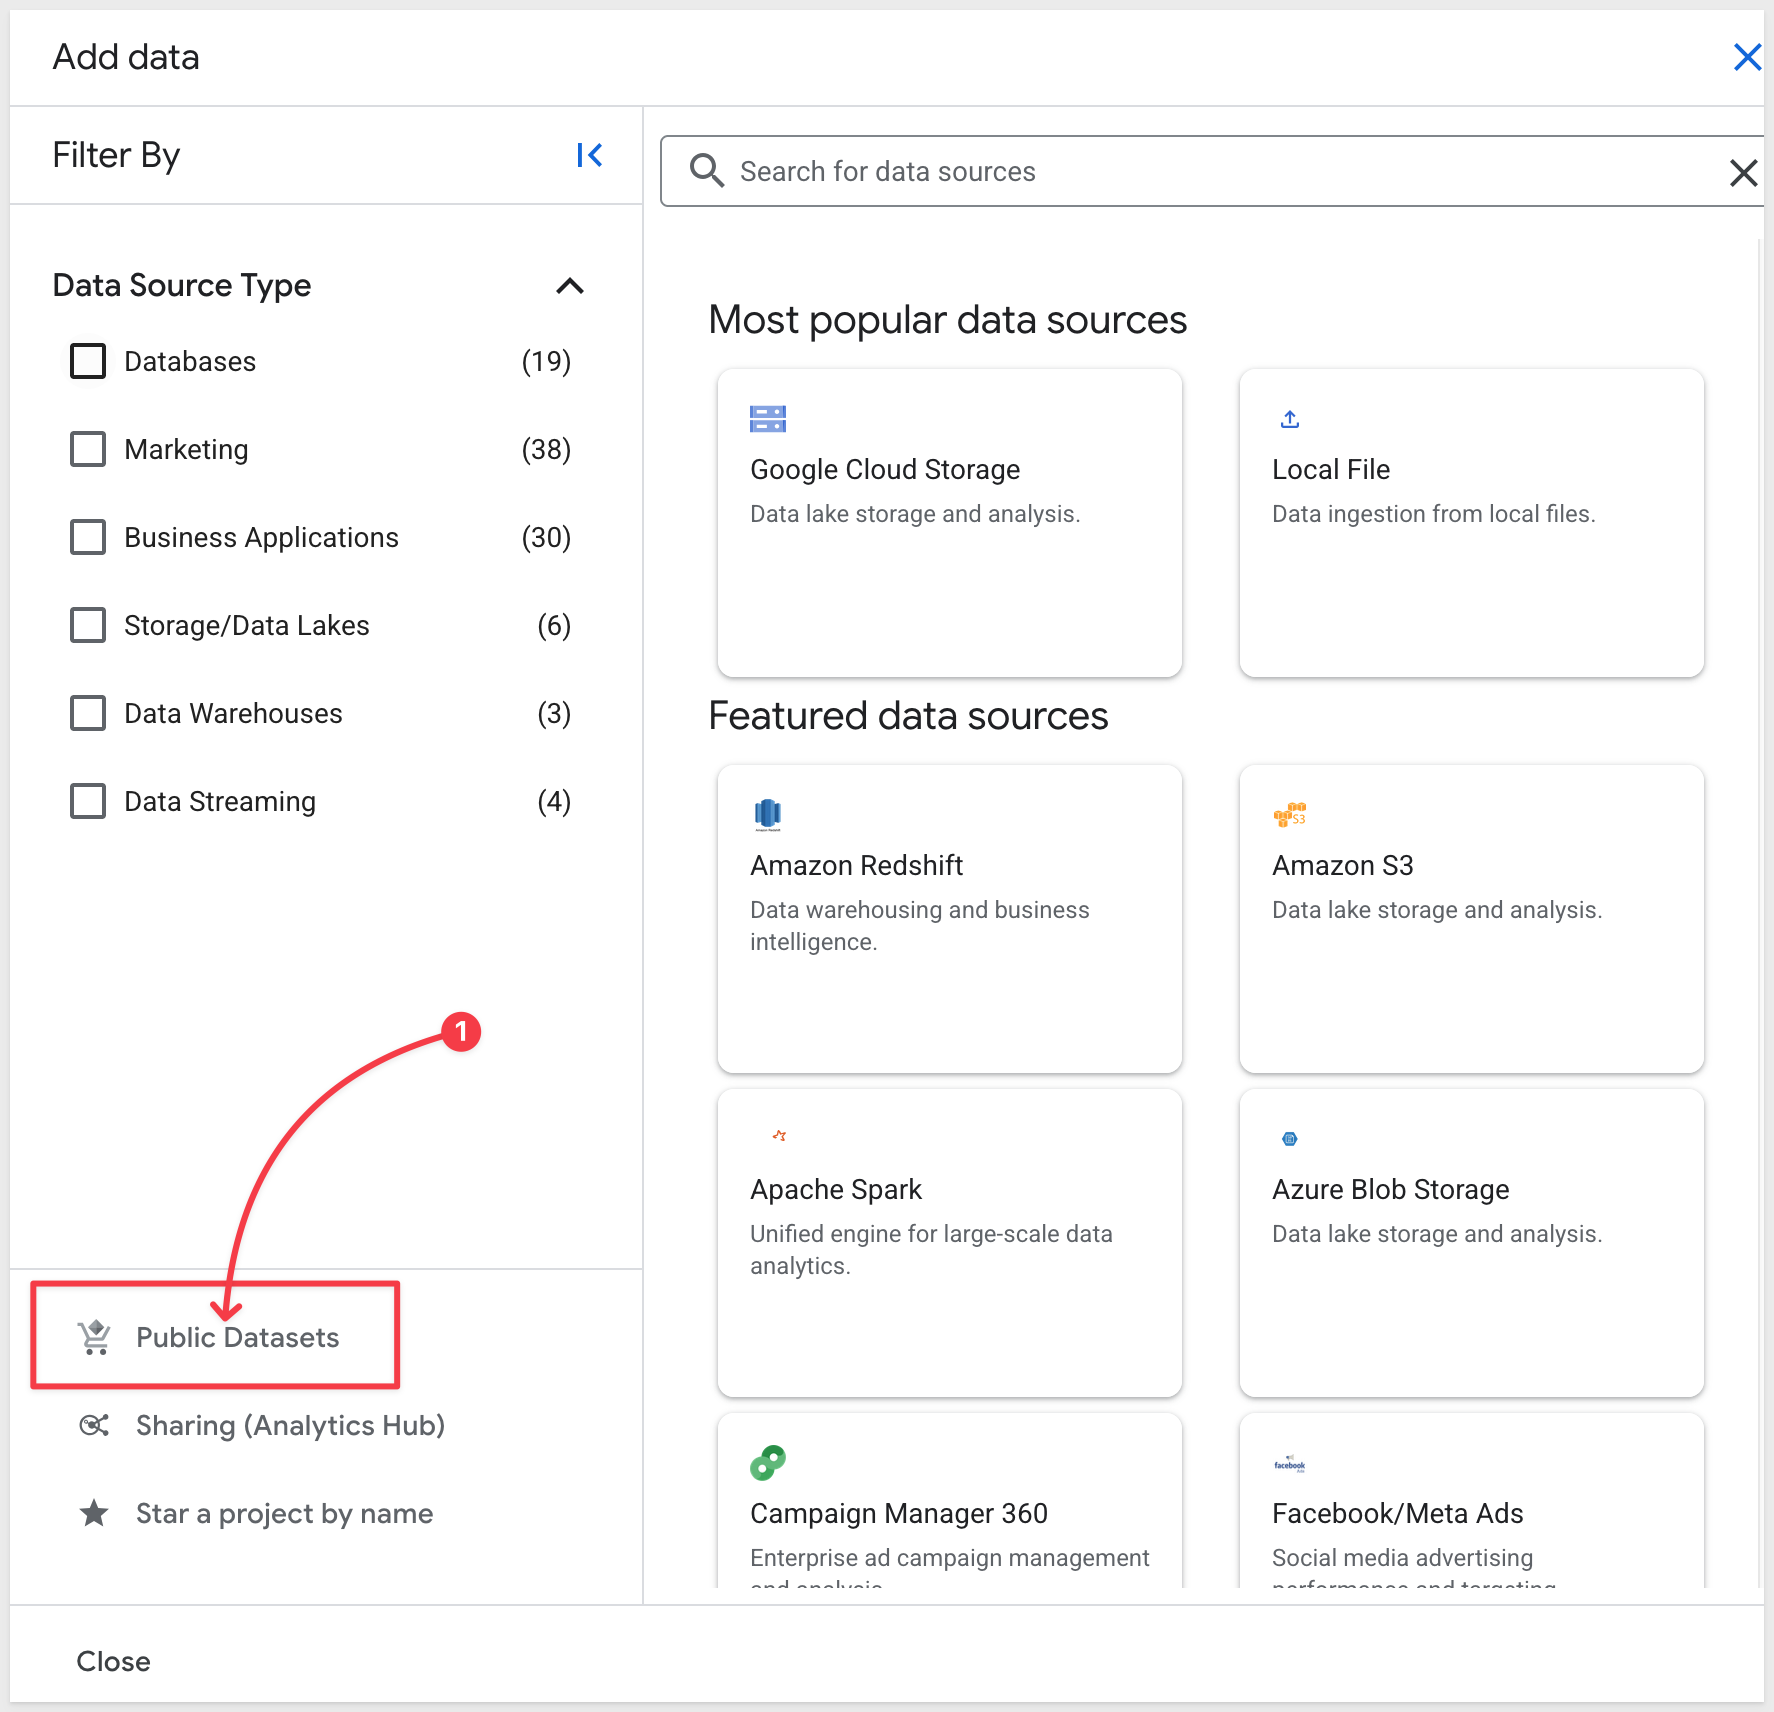
Select Public Datasets:
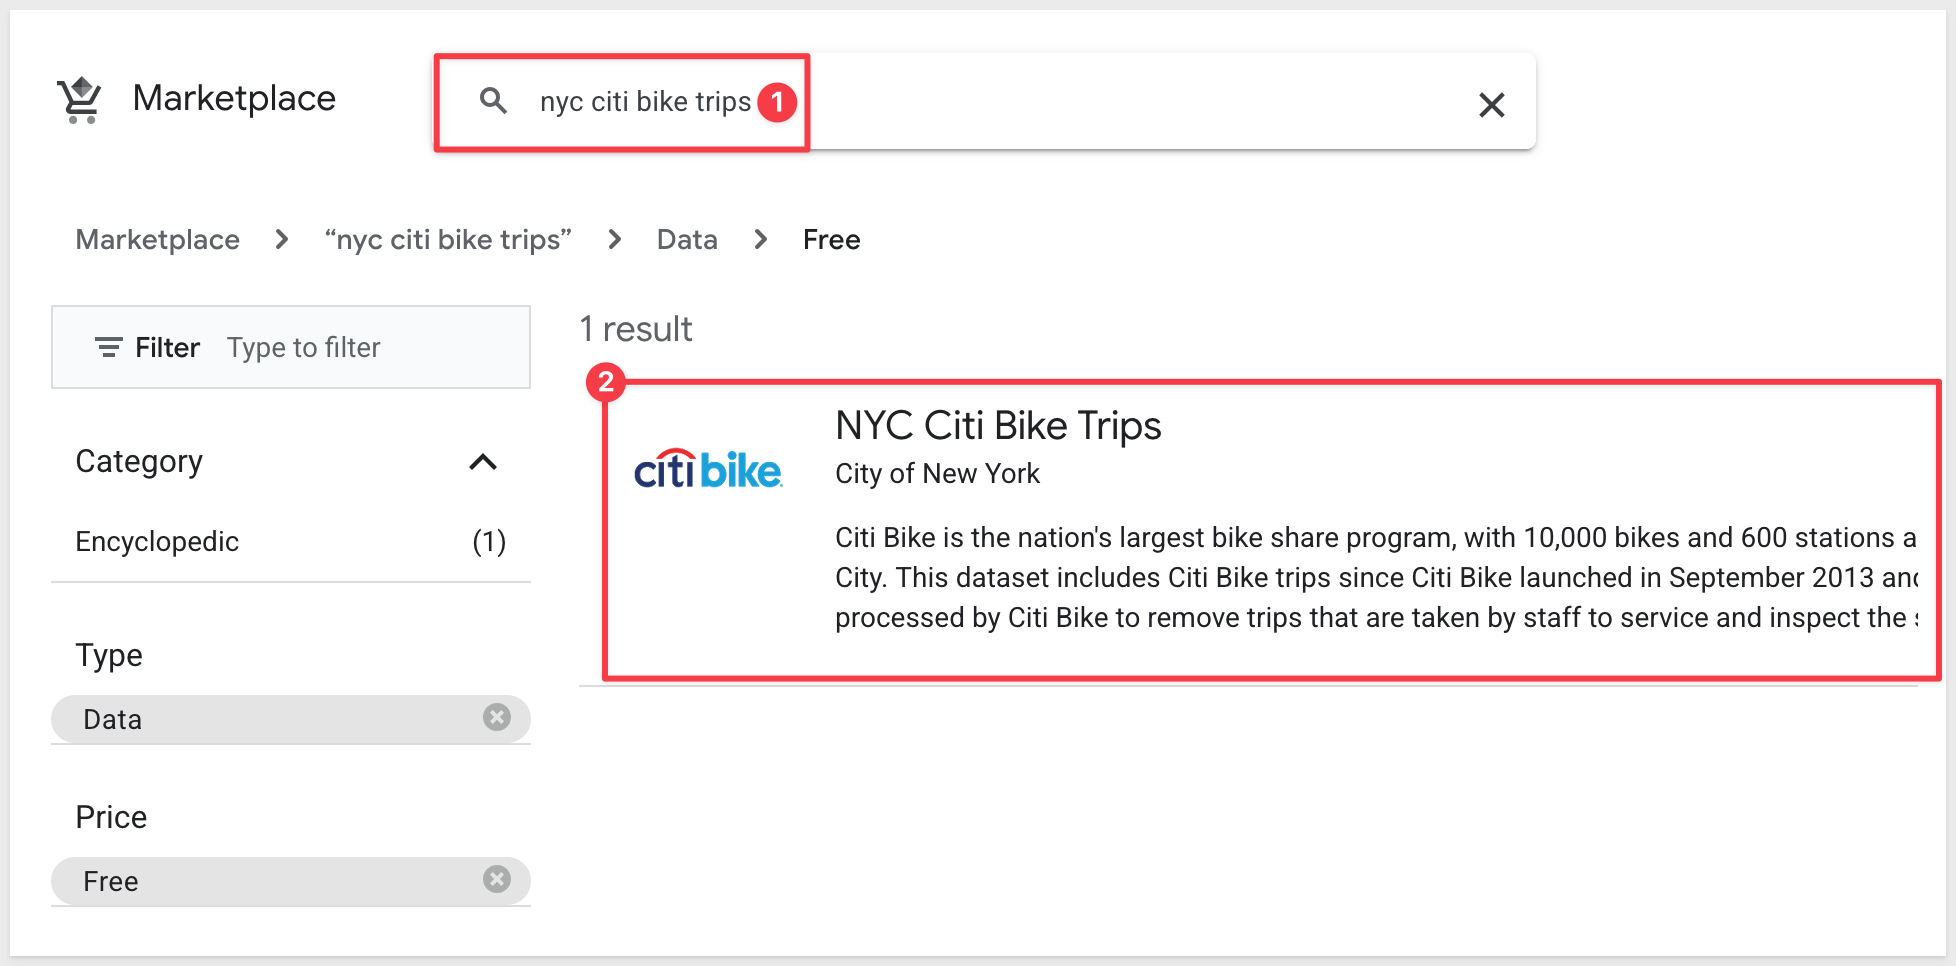
Search for and select NY City Bike Trips:
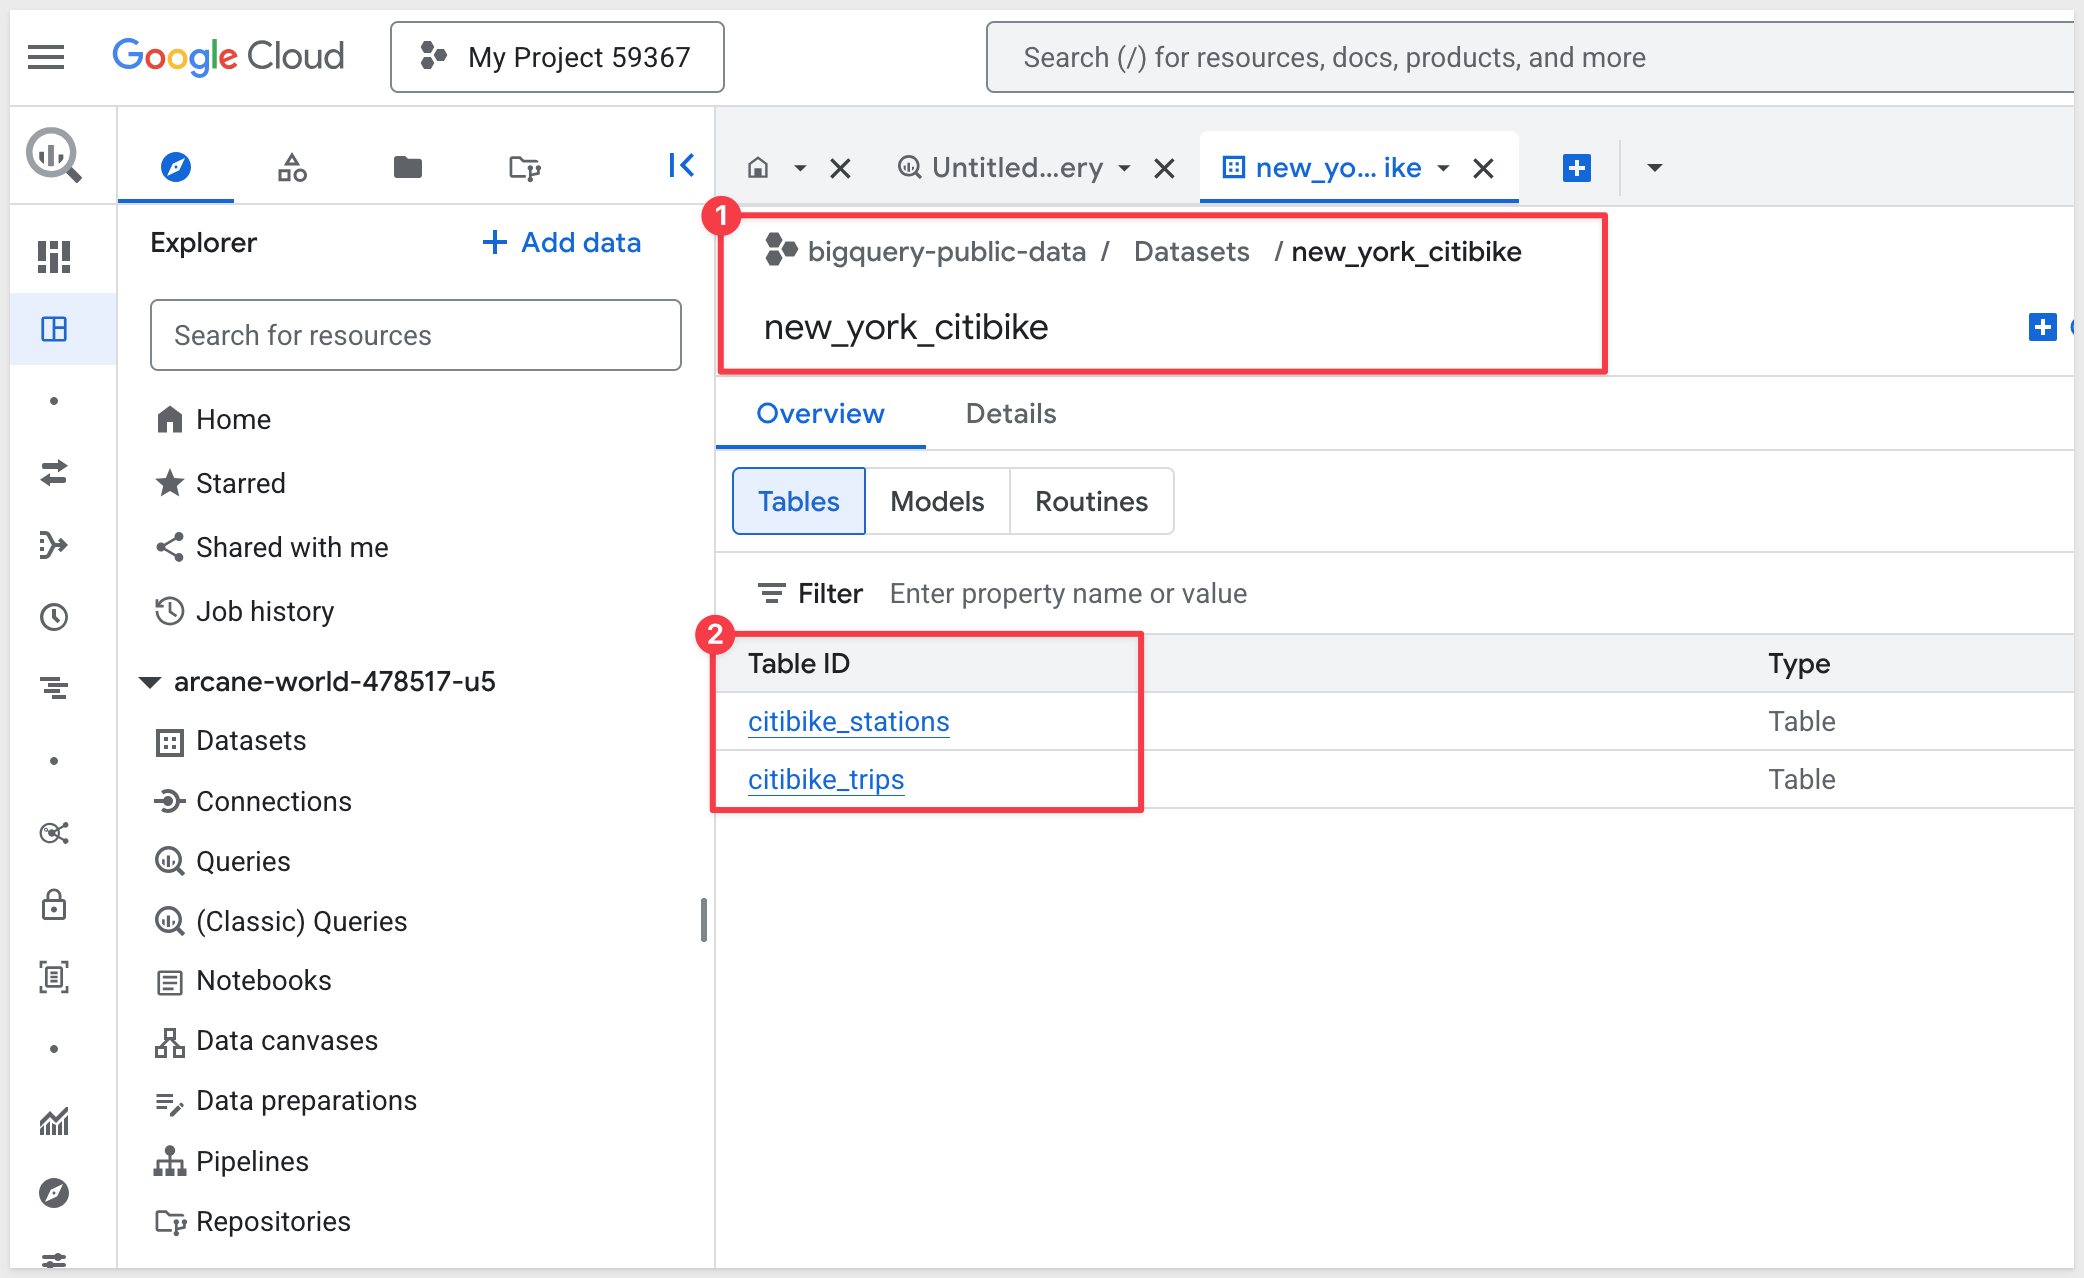
On the Product details page, click View dataset to verify we can see data.
Create Google Cloud Service Account
BigQuery IAM setup:
You must create a Service account with a keyfile if you want Sigma to connect to BigQuery warehouse.
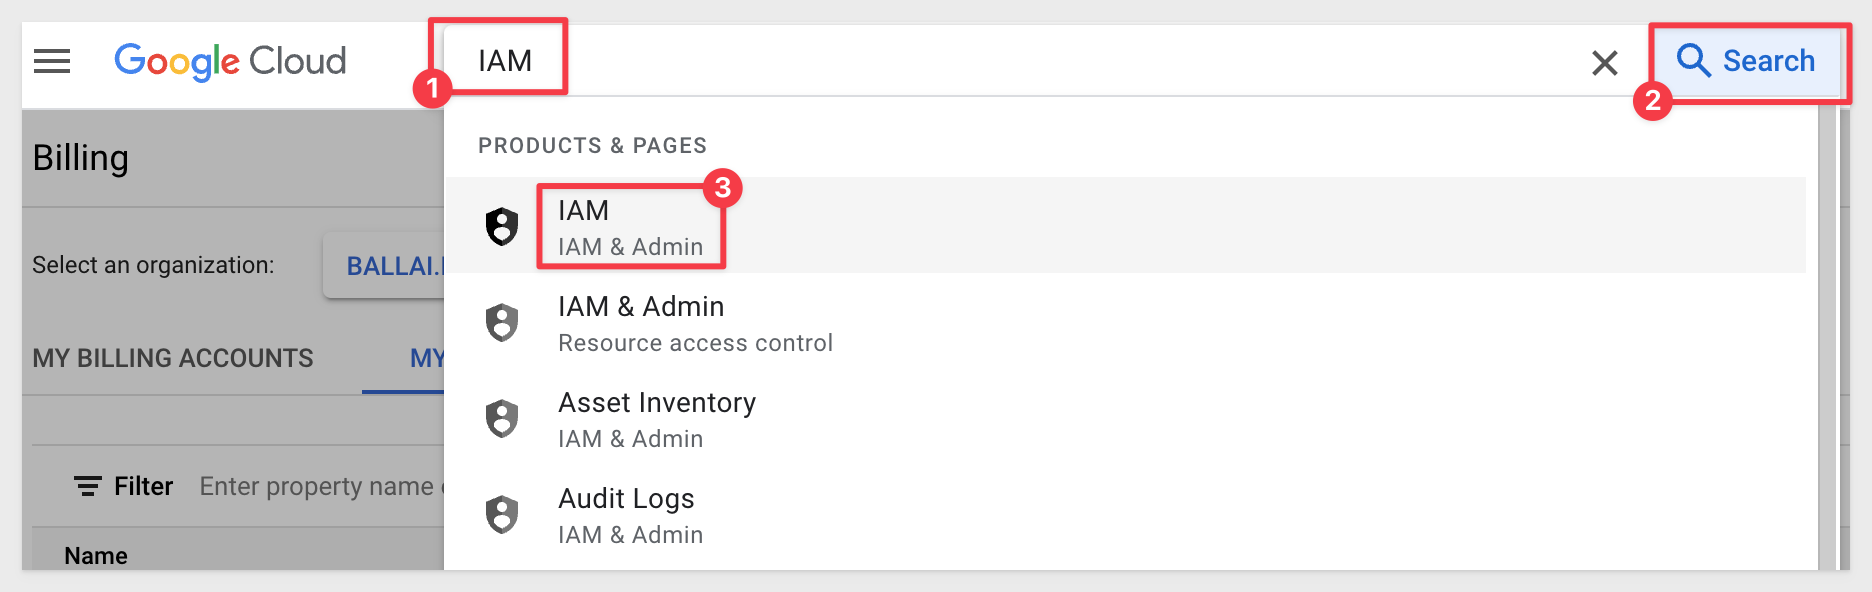
Using the Search feature of GCP, type IAM and select IAM from the list shown:
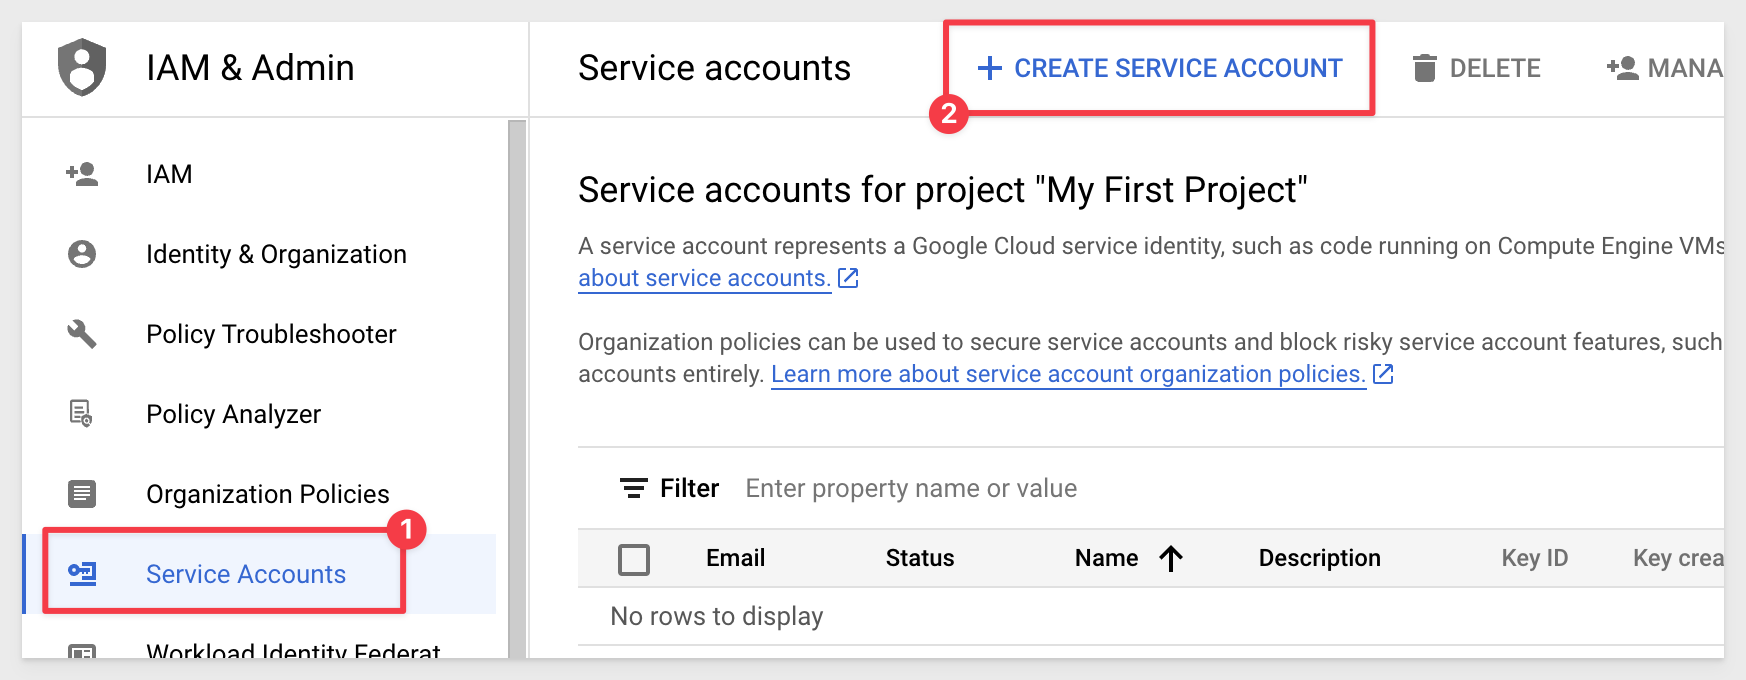
Select Service account from IAM & Admin section, then click create service account:
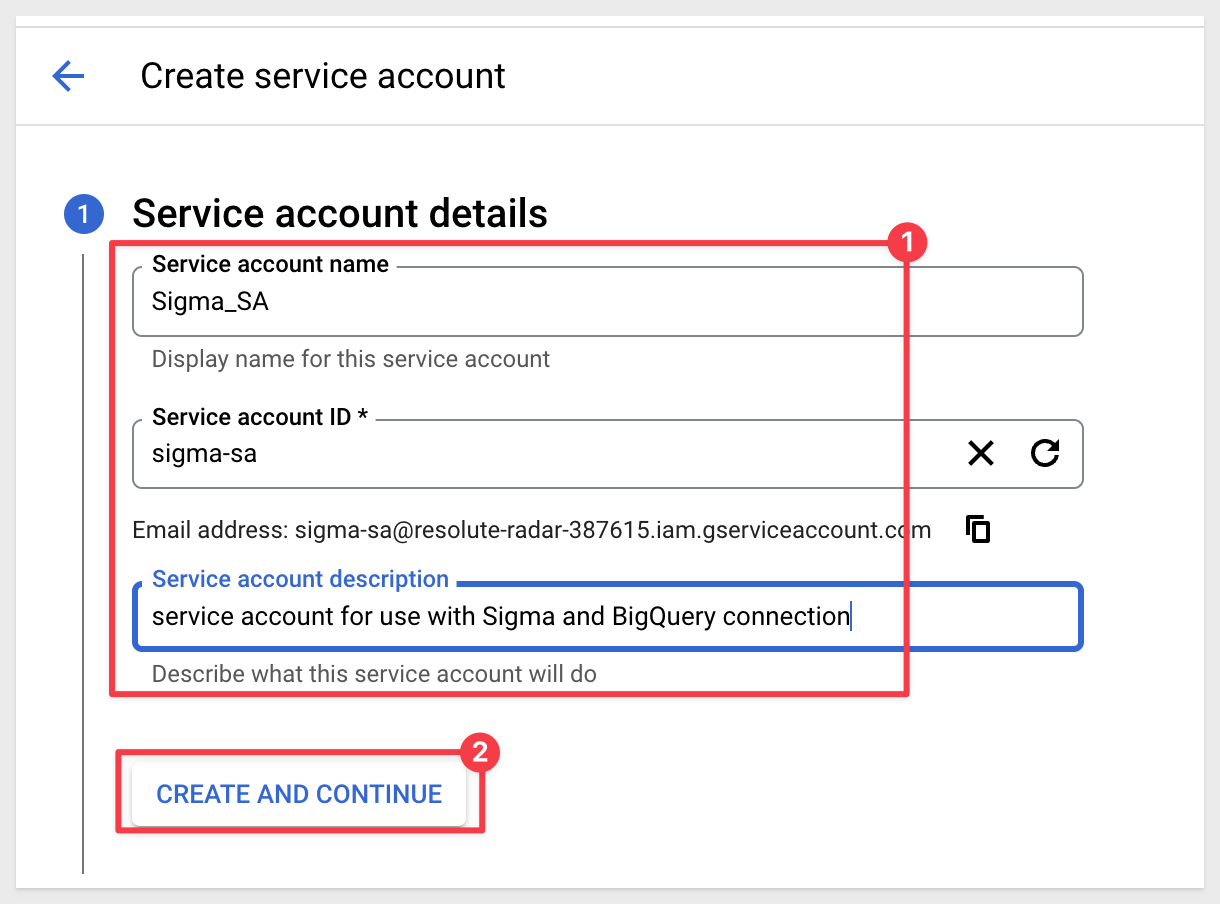
In the Service account name area, enter service account name, then select Create and Continue:
In the Role droplist we need to add the following BigQuery roles:
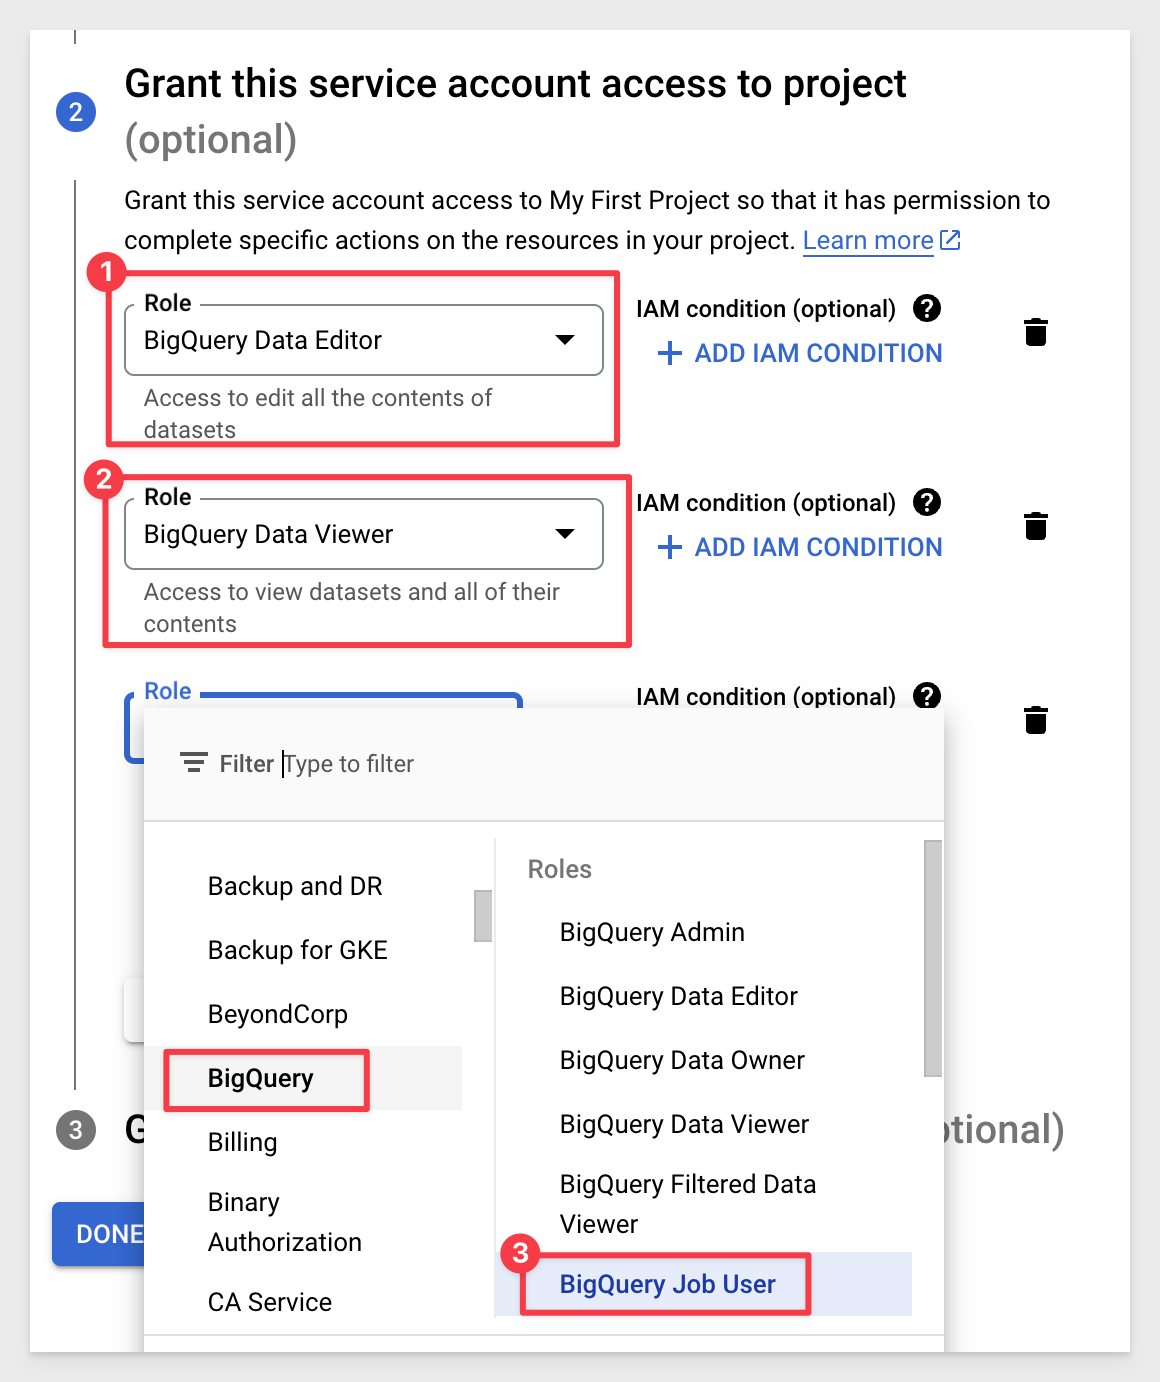
Click Continue and Done (we will not need to grant any users access to this service account.)
For each of these principals, there are a number of roles listed. To learn more, see Understanding roles and Understanding IAM custom roles. Google Cloud scans the actions of these principles and makes suggestions as to those who could have fewer permissions, which generally increases the security of your project. To learn more, see Enforce least privilege with role recommendations.
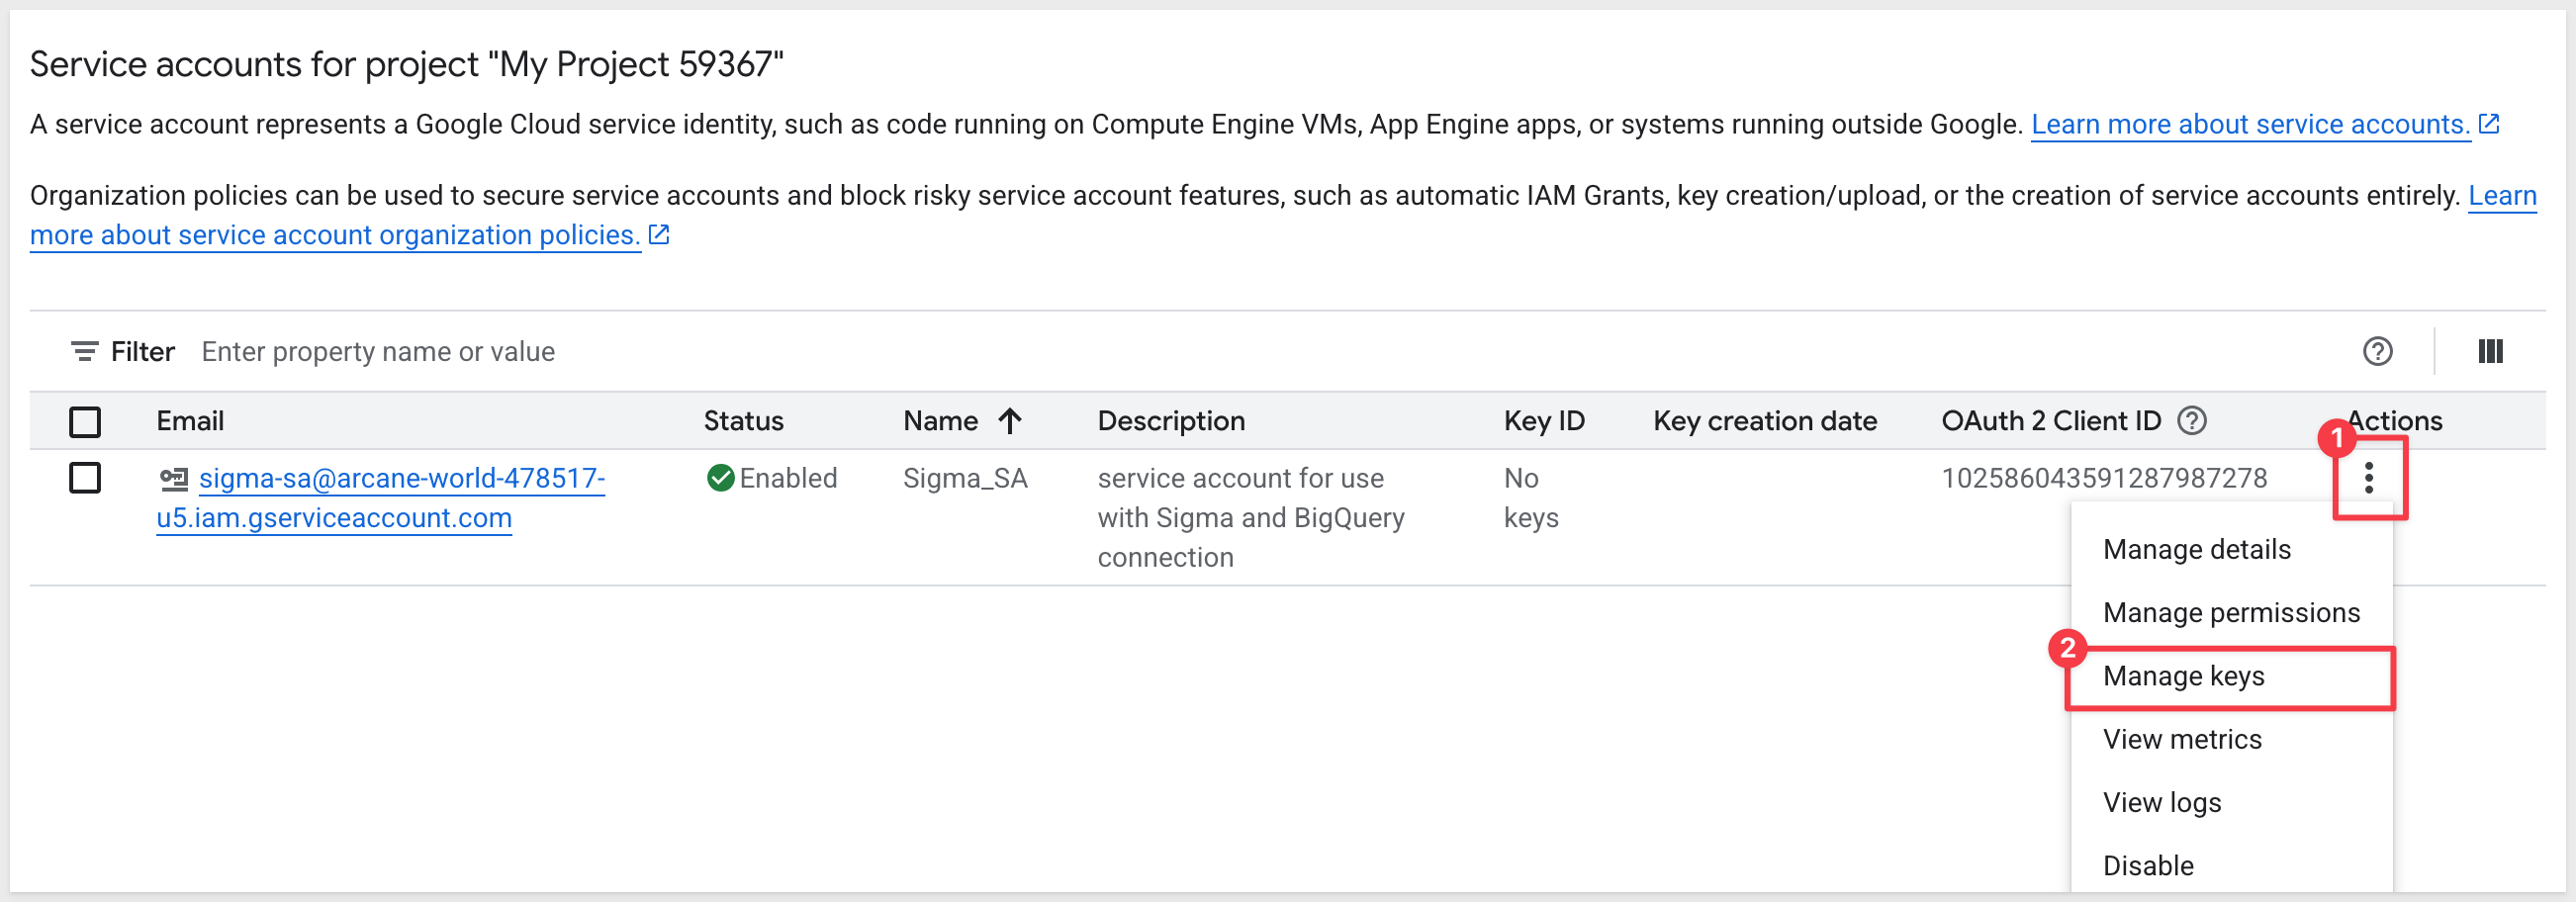
Click the new service account, then Choose Manage Keys:
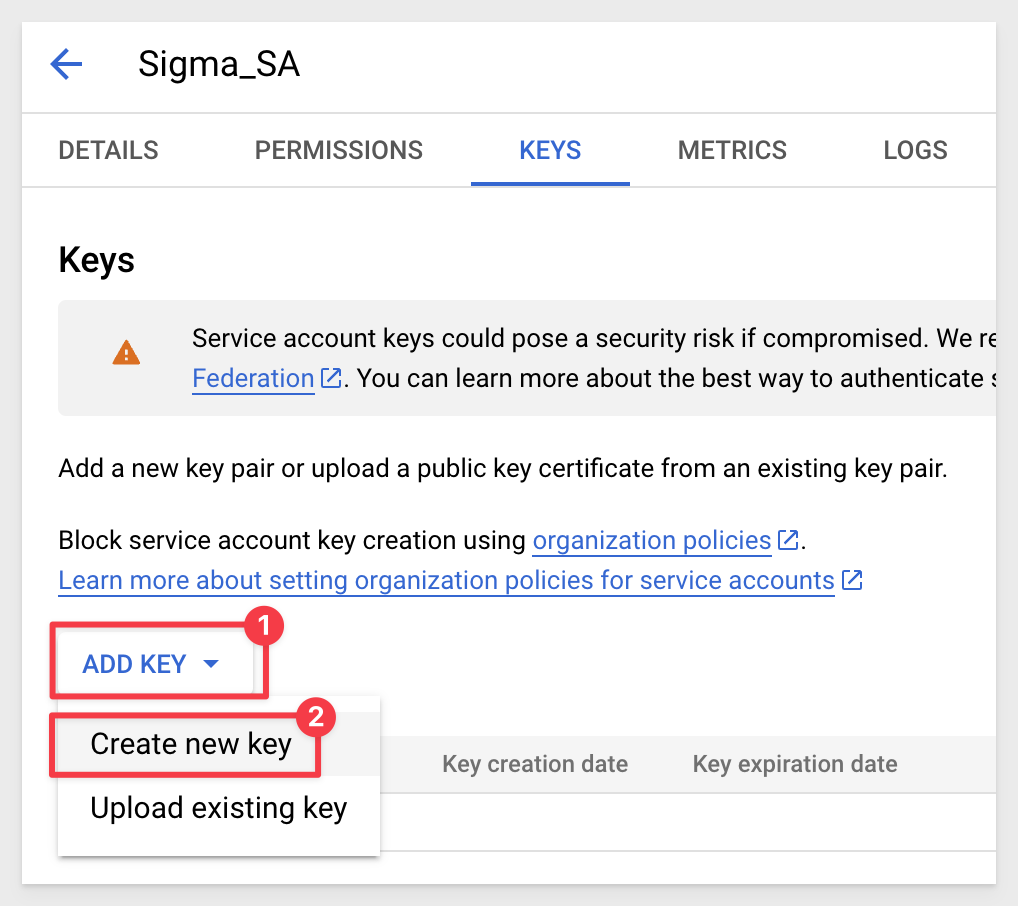
Click Add Key and create a new key:
Select JSON for key type and click Create:
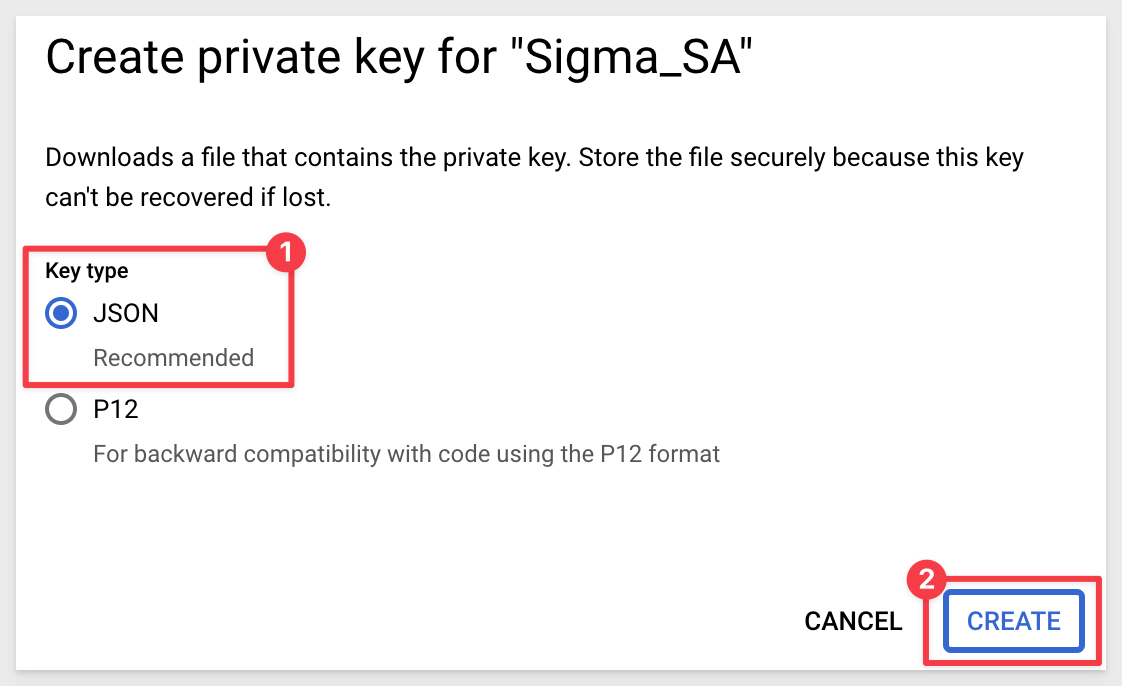
The JSON file is downloaded automatically.
Click Close.
Now we will configure a connection in Sigma to BigQuery.
Log in to Sigma as an Administrator.
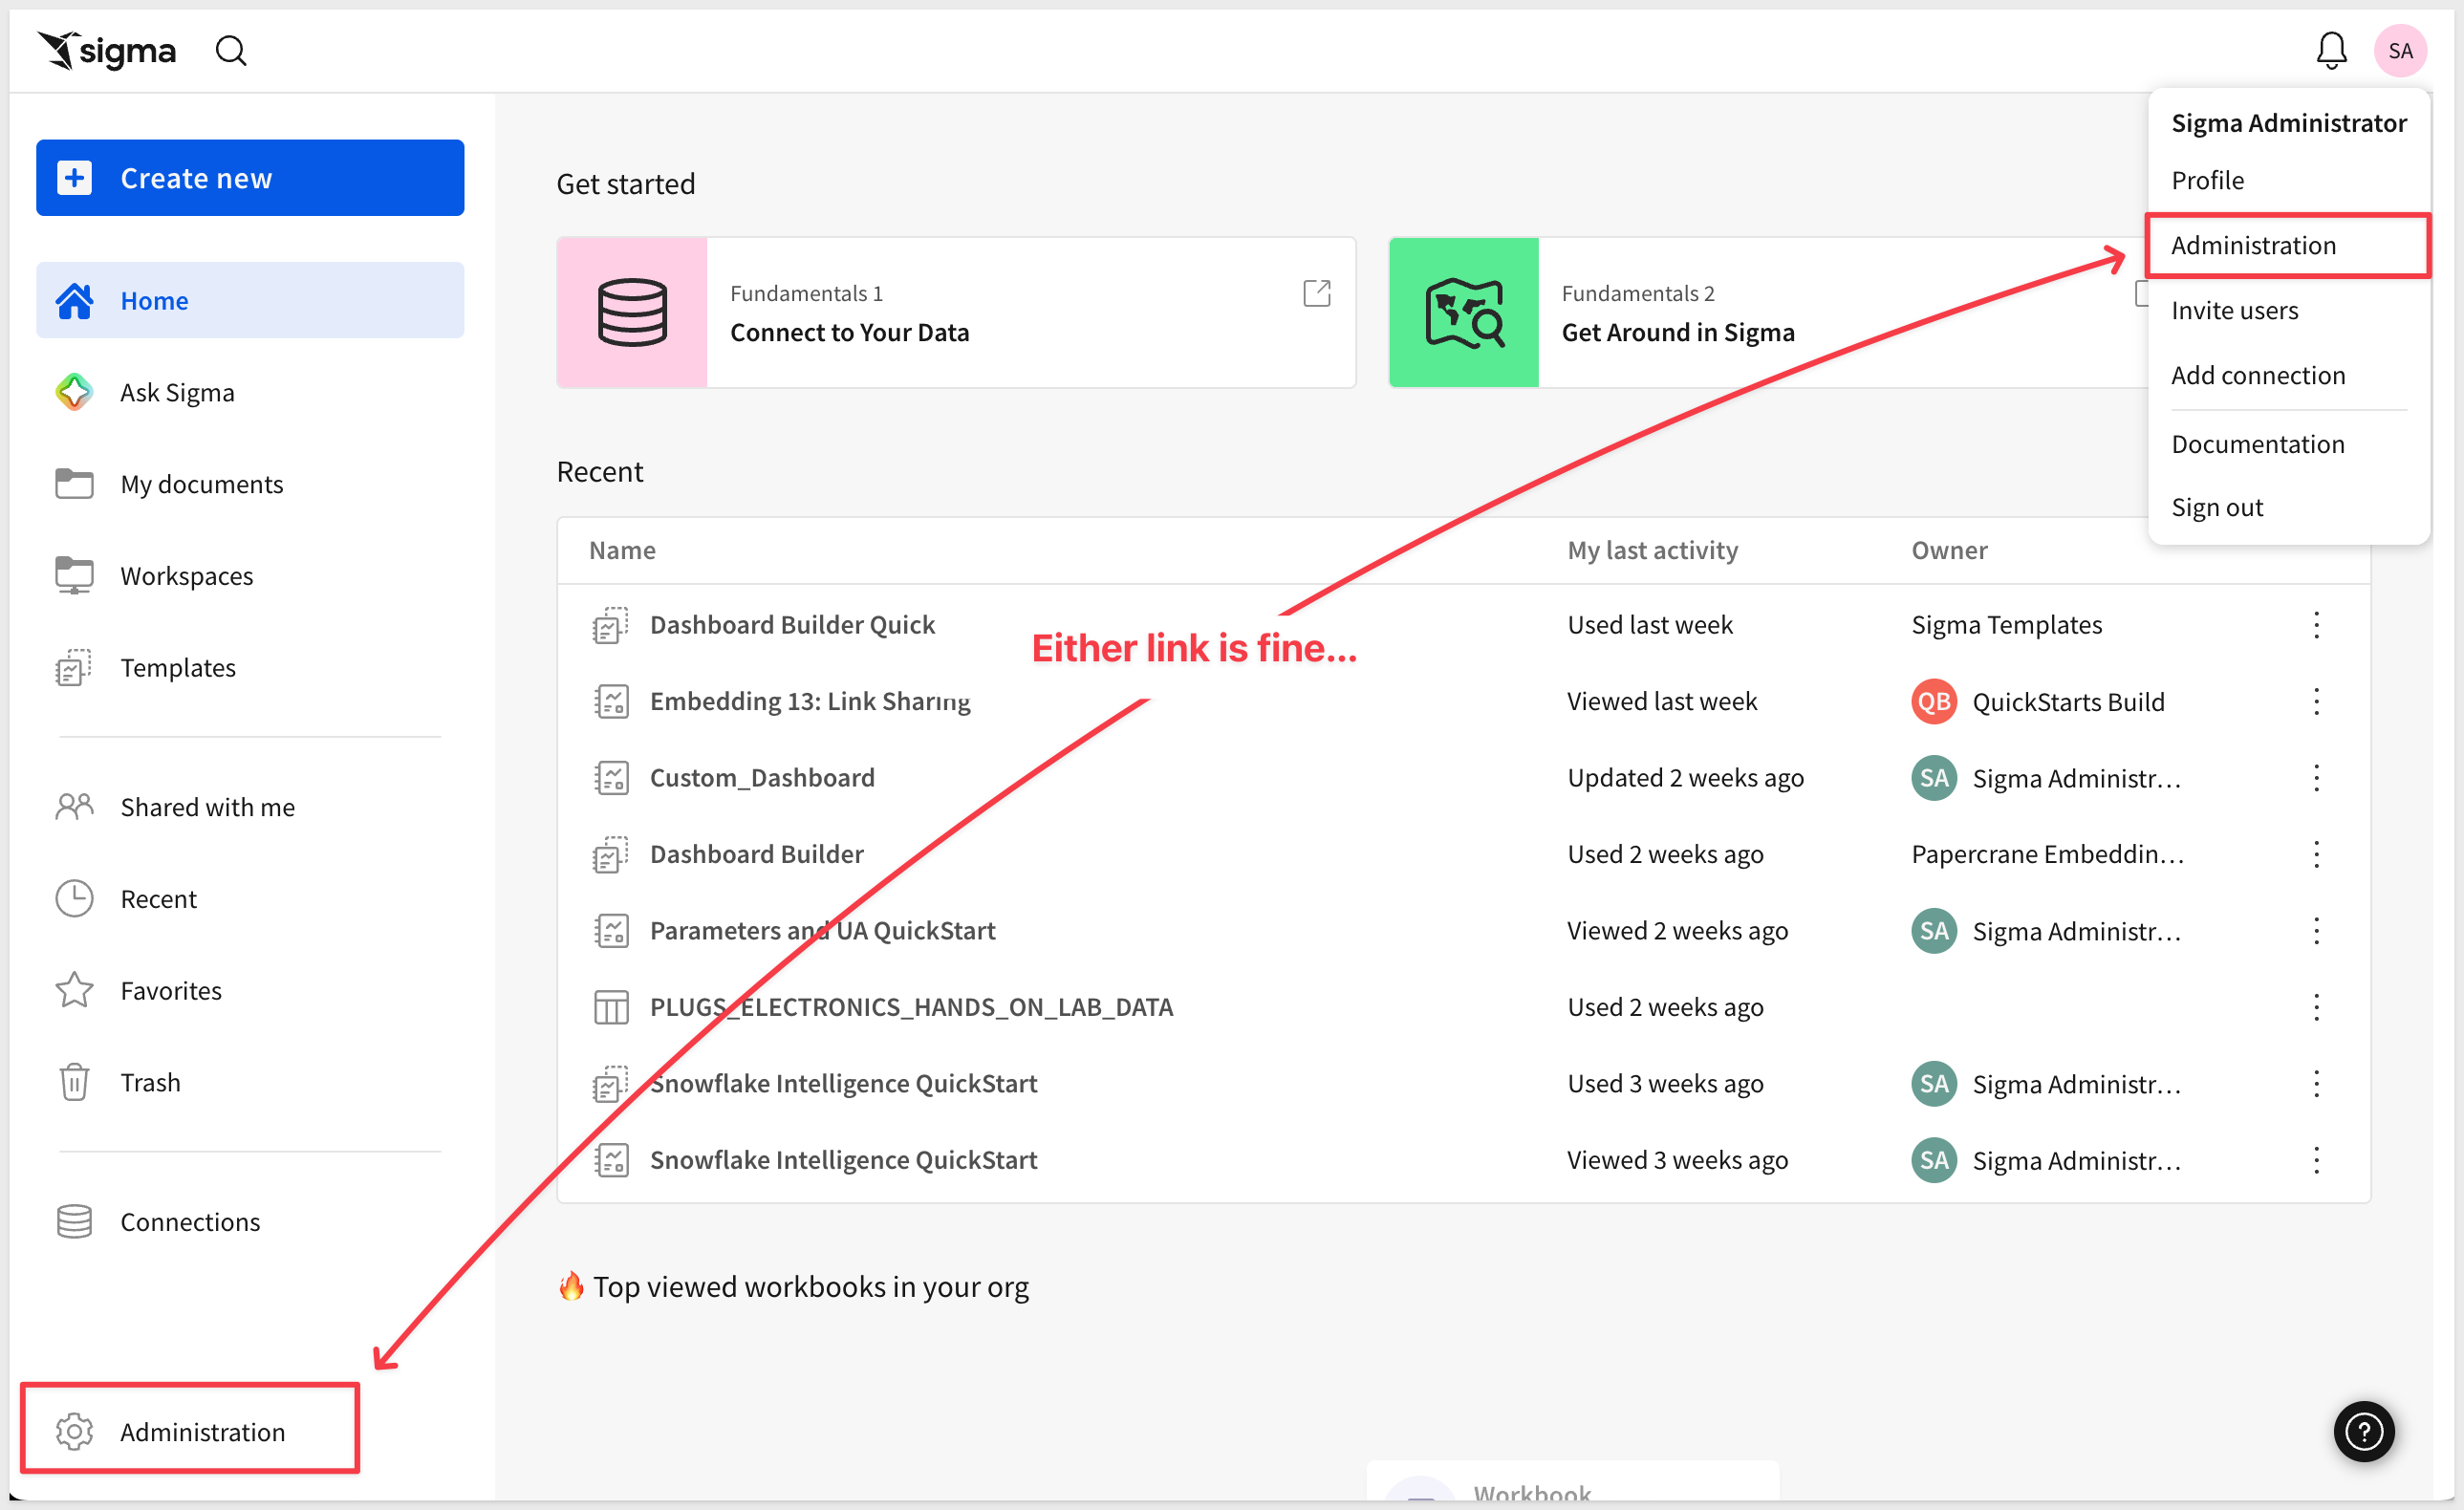
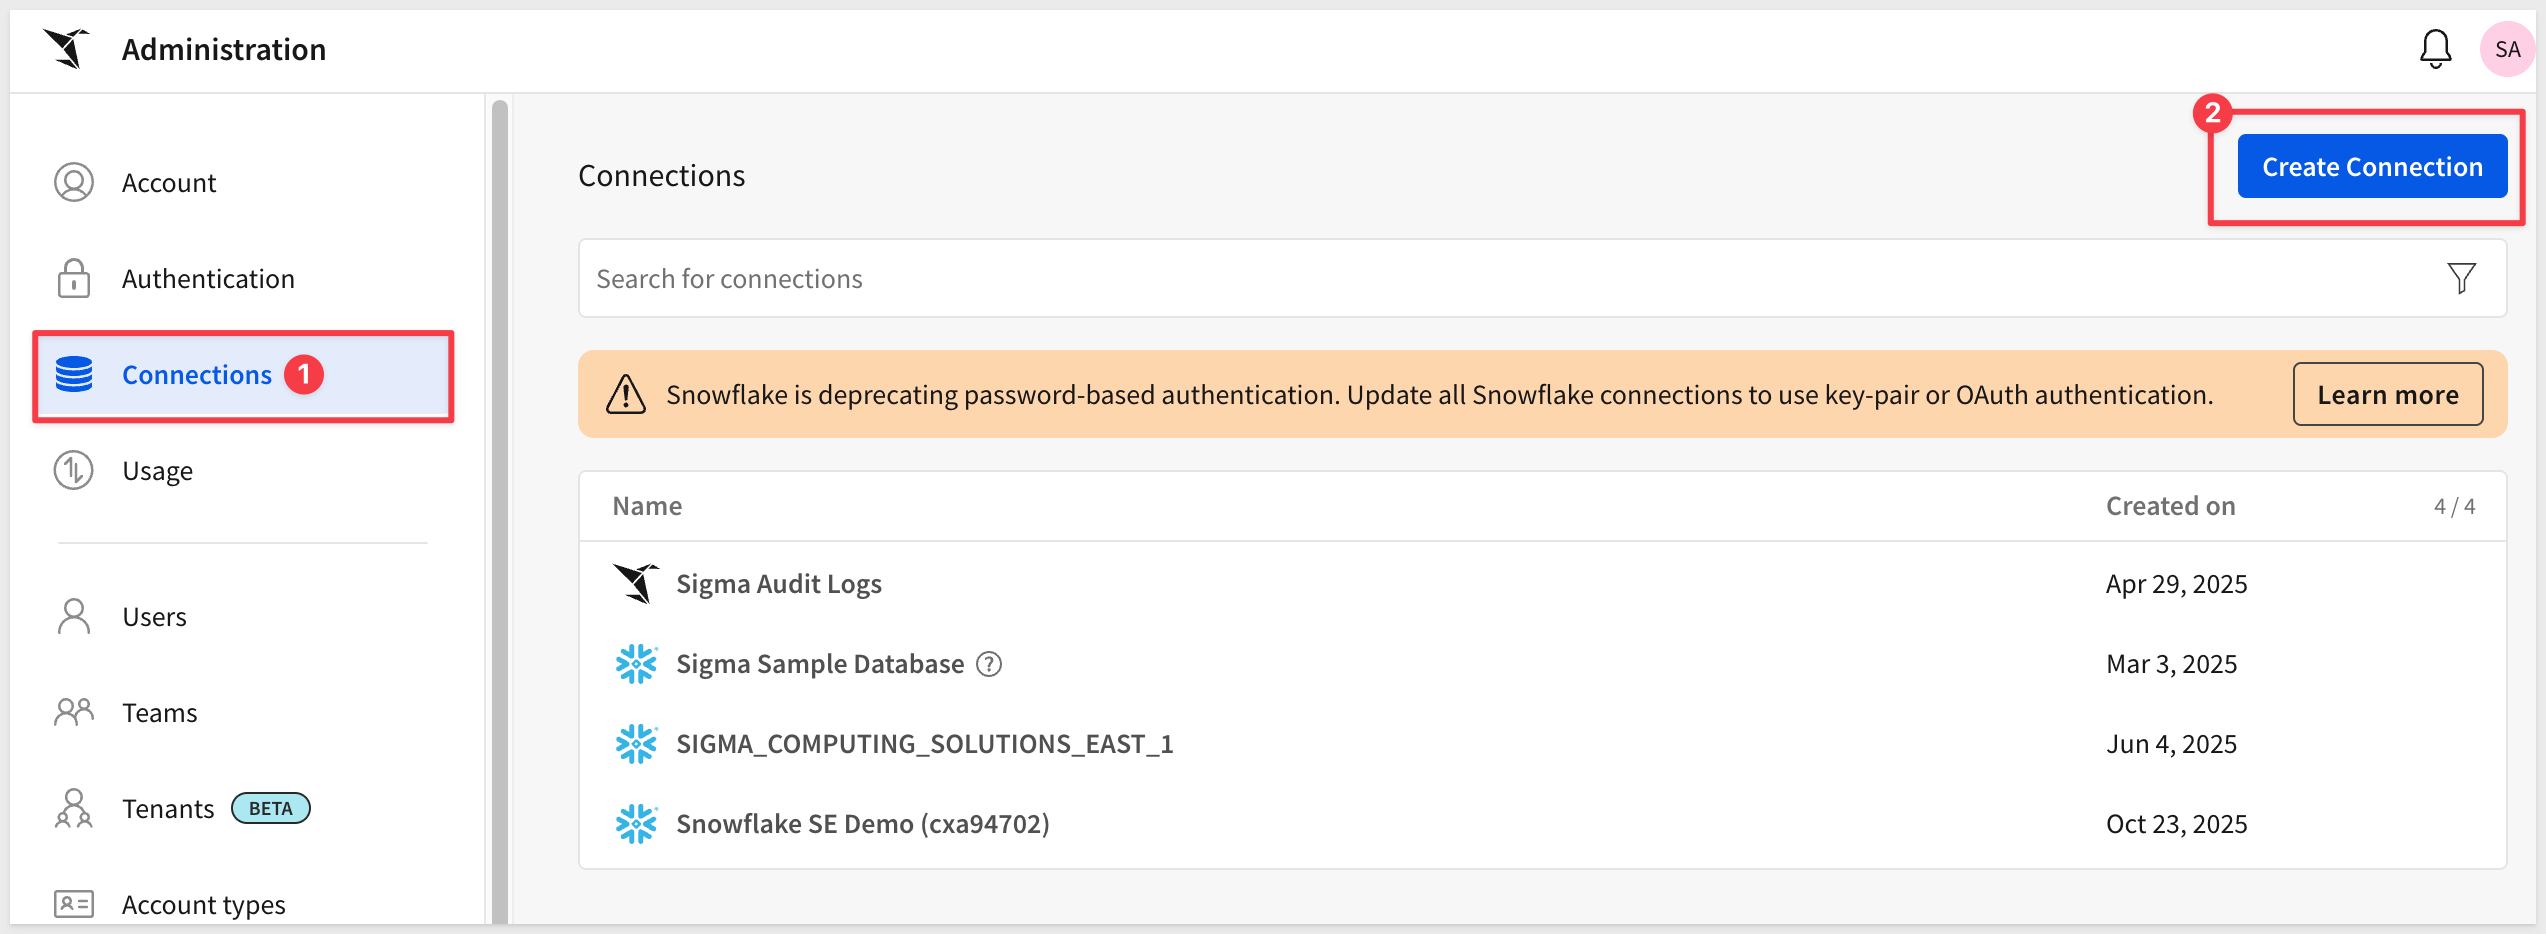
Navigate to Administration:
Select Connections > Create Connection:
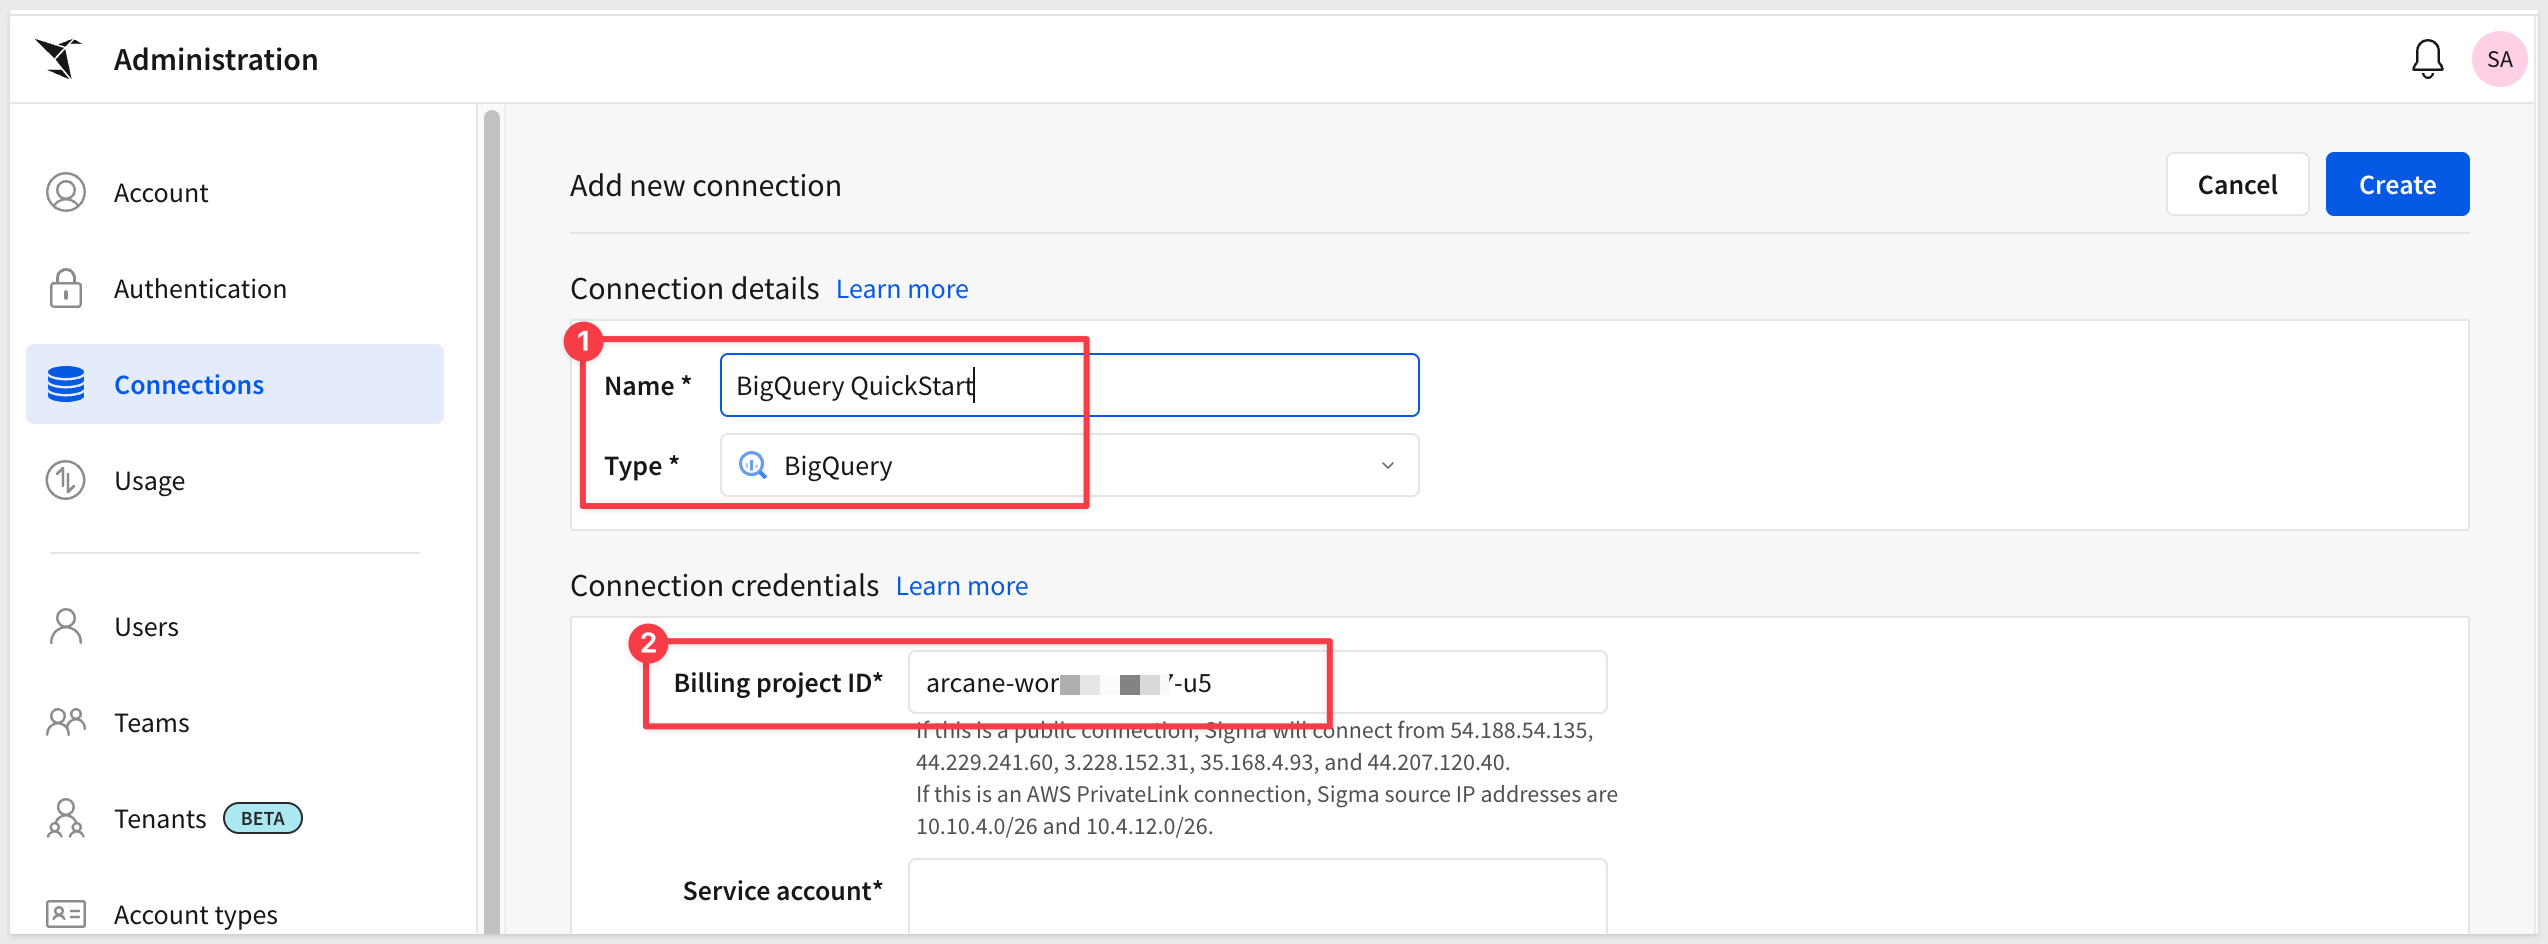
Select BigQuery and give it a name.
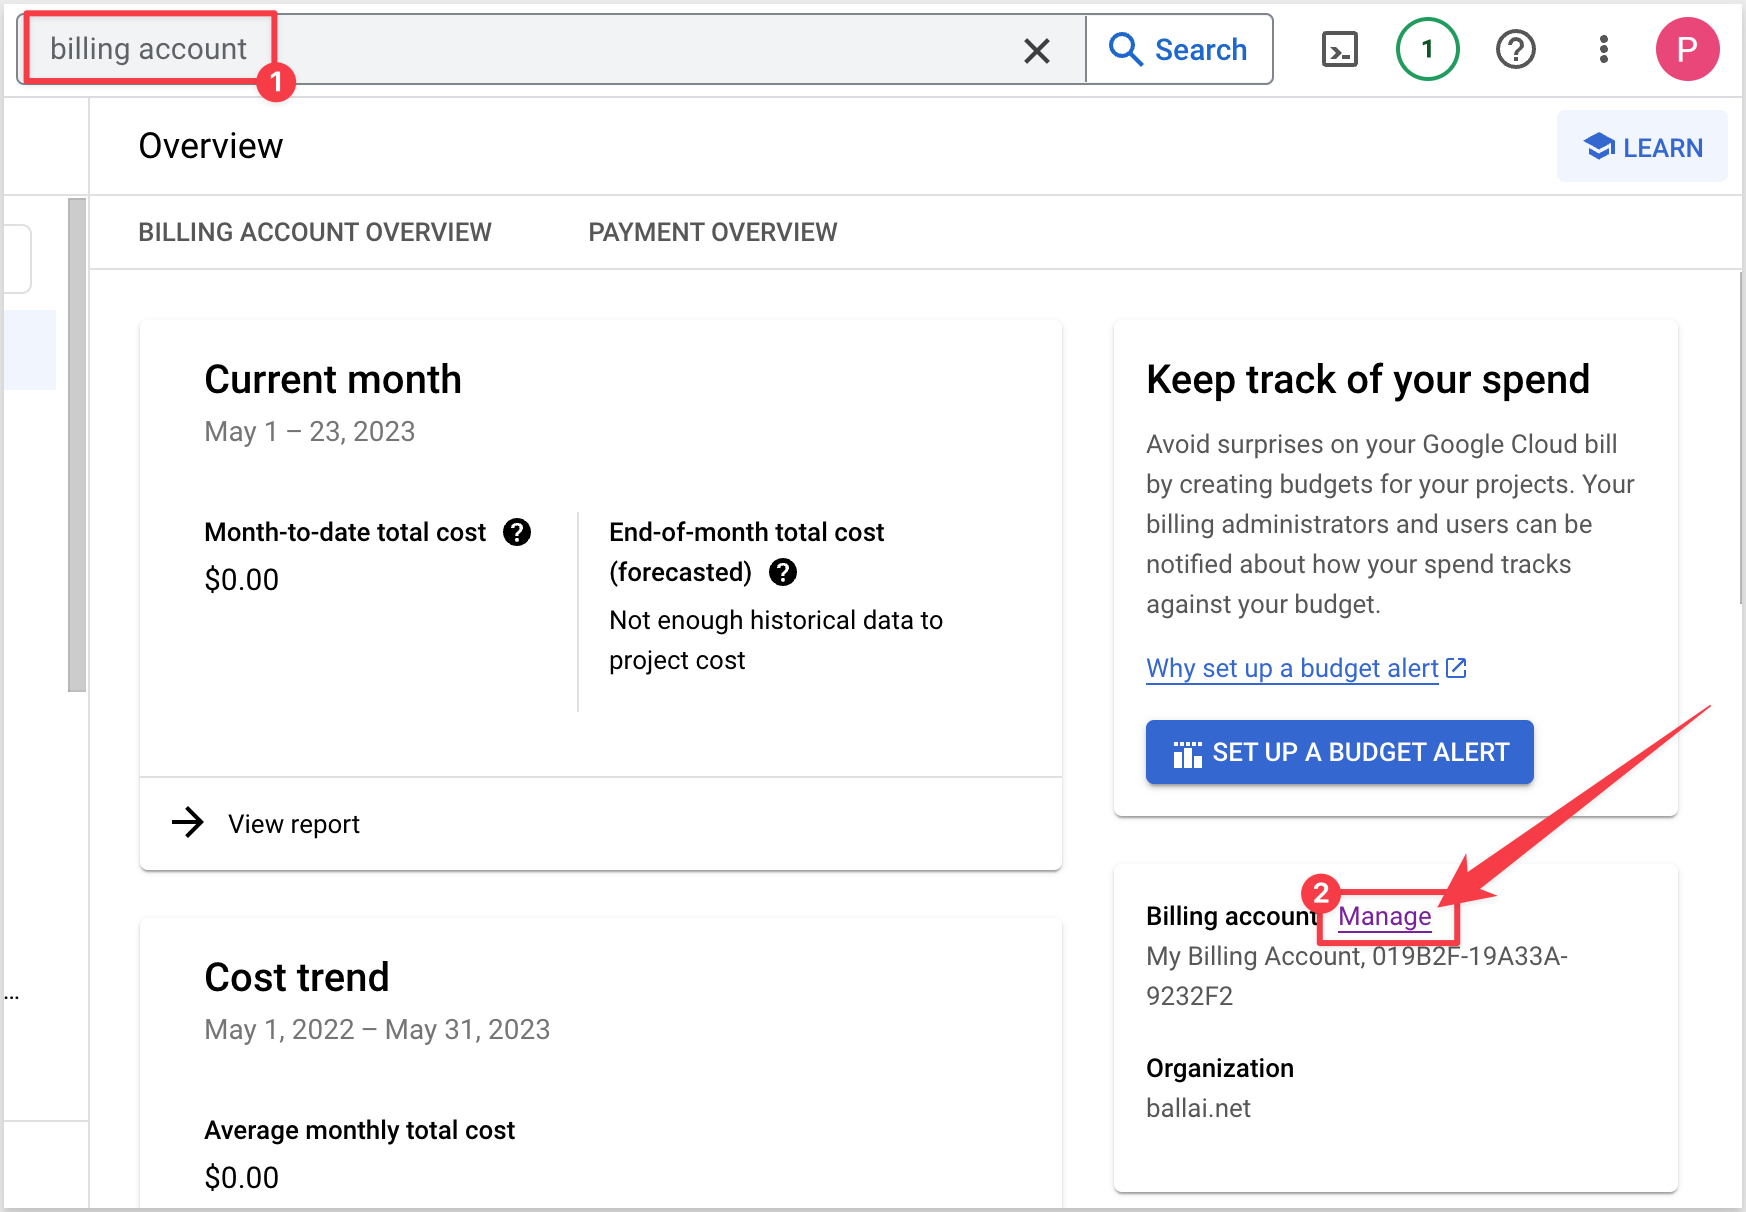
We need to provide the Billing project ID from GCP. That can be copied from this page in GCP, and clicking the Manage link:
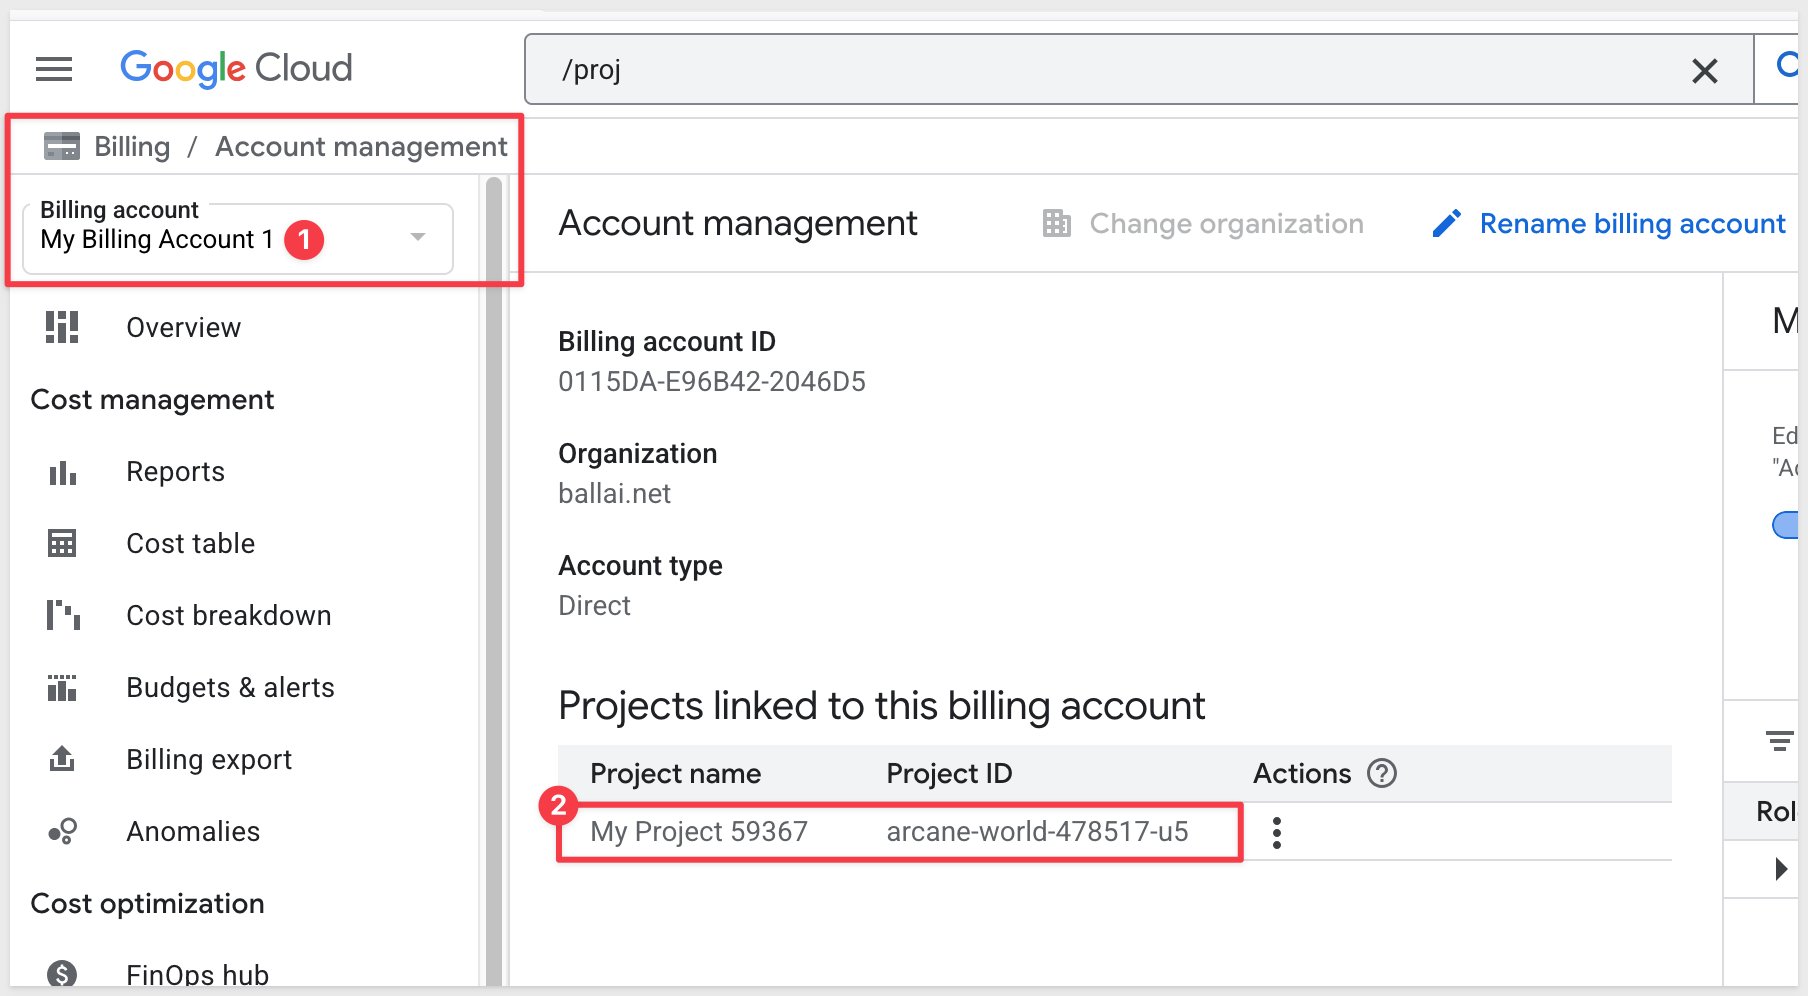
Copy the Project ID:
Paste it into the Billing project ID section in the Sigma connection configuration:
Next, open the Service Account key file in a text editor (the one we downloaded and renamed earlier from GCP) and paste the entire contents of the file into the Service account section in the Sigma connection configuration. Take care not to leave trailing spaces from the copy/paste operation.
When done, click Create. Sigma will attempt to validate the connection is working or not. A message will appear upon success or failure.
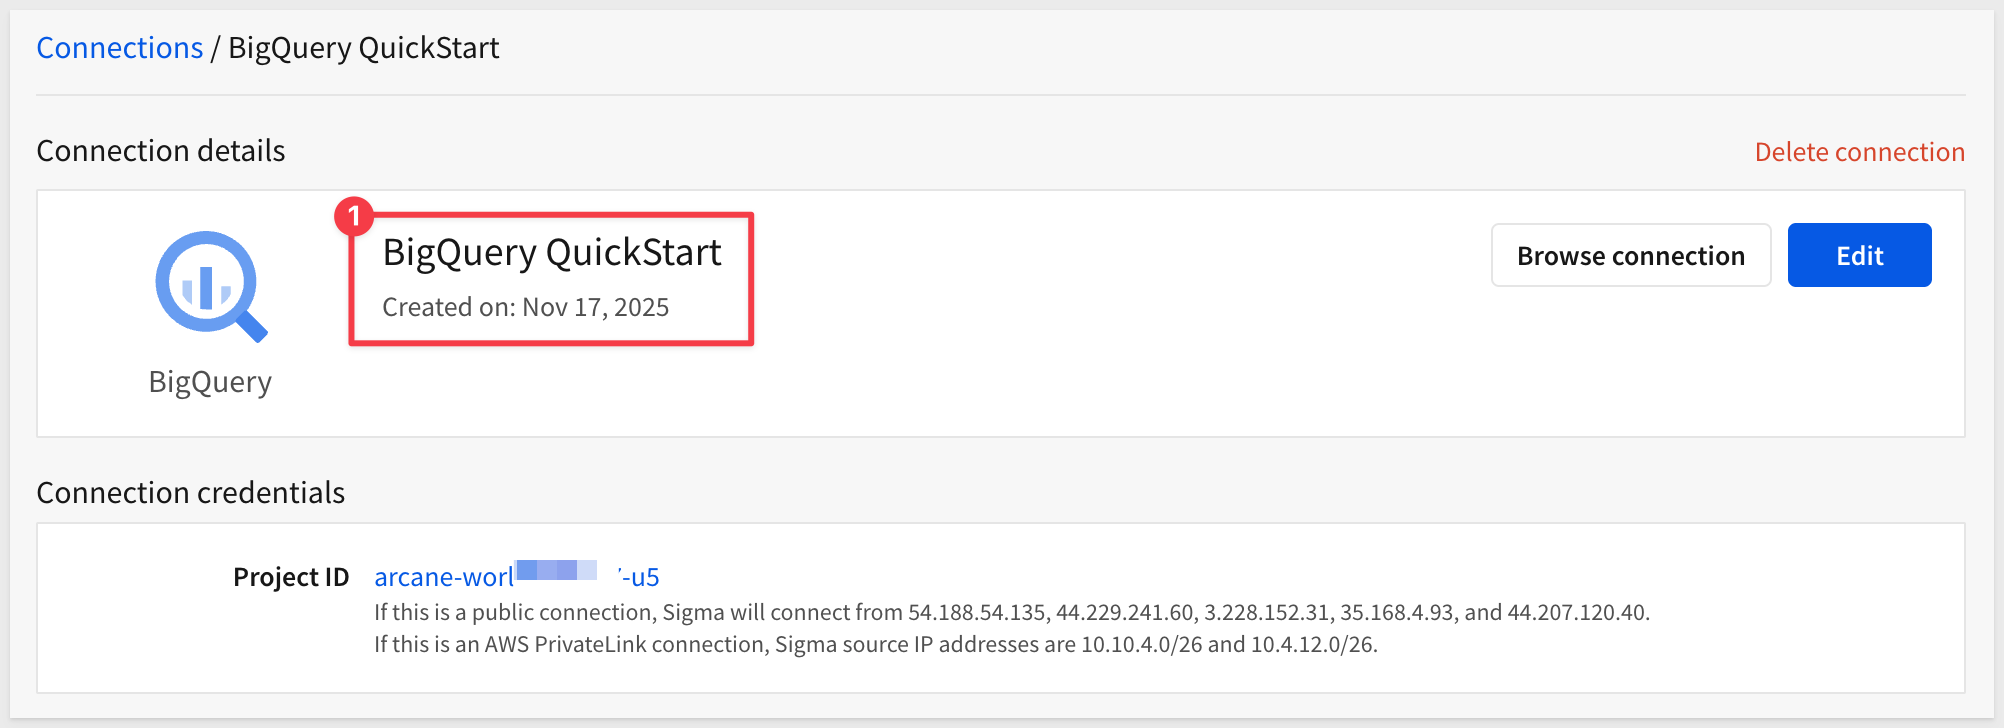
Sigma's data models are a flexible way to build centralized data definitions and guide data exploration.
With data models, you can define your data transformation and semantics in one place, and use them anywhere in Sigma. This avoids duplicating effort, and provides a single source of truth for your Analytics Engineering team to collaborate on key business logic and metric definitions.
For more information, see the QuickStart Fundamentals 10: Data Modeling
In Sigma, we will create a new data model and connect it to the bigquery-public-data that is provided in the BigQuery sandbox.
Return to the Sigma homepage. You can click the Crane logo in the upper left corner anytime to return to the homepage.
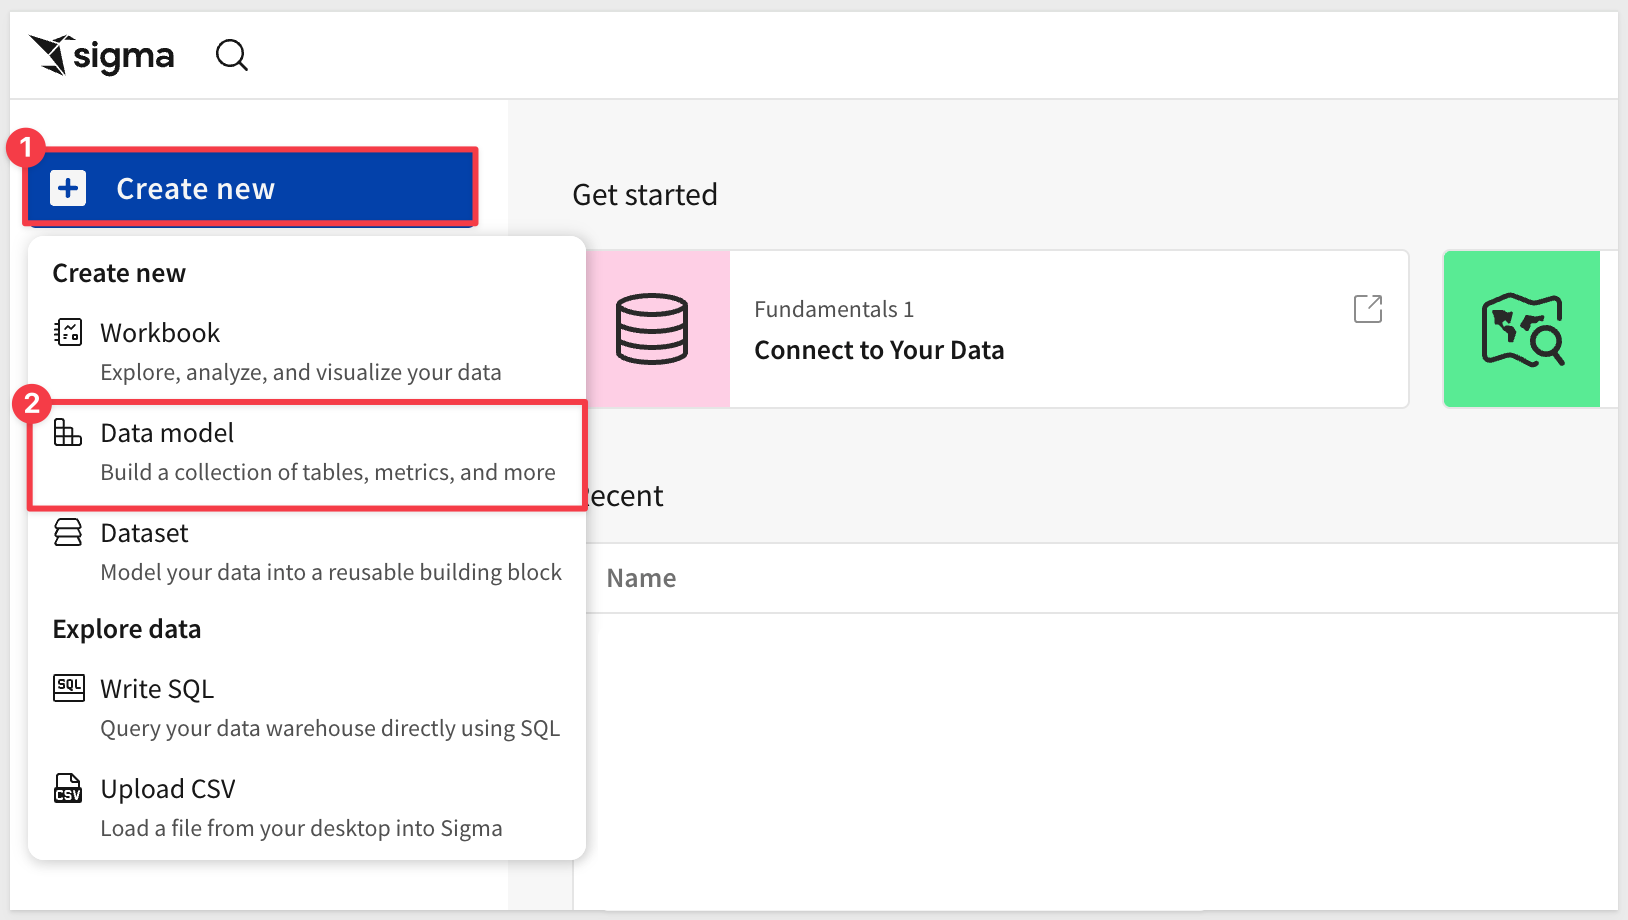
Click on the Create New at the top left of the page and then select Data model:
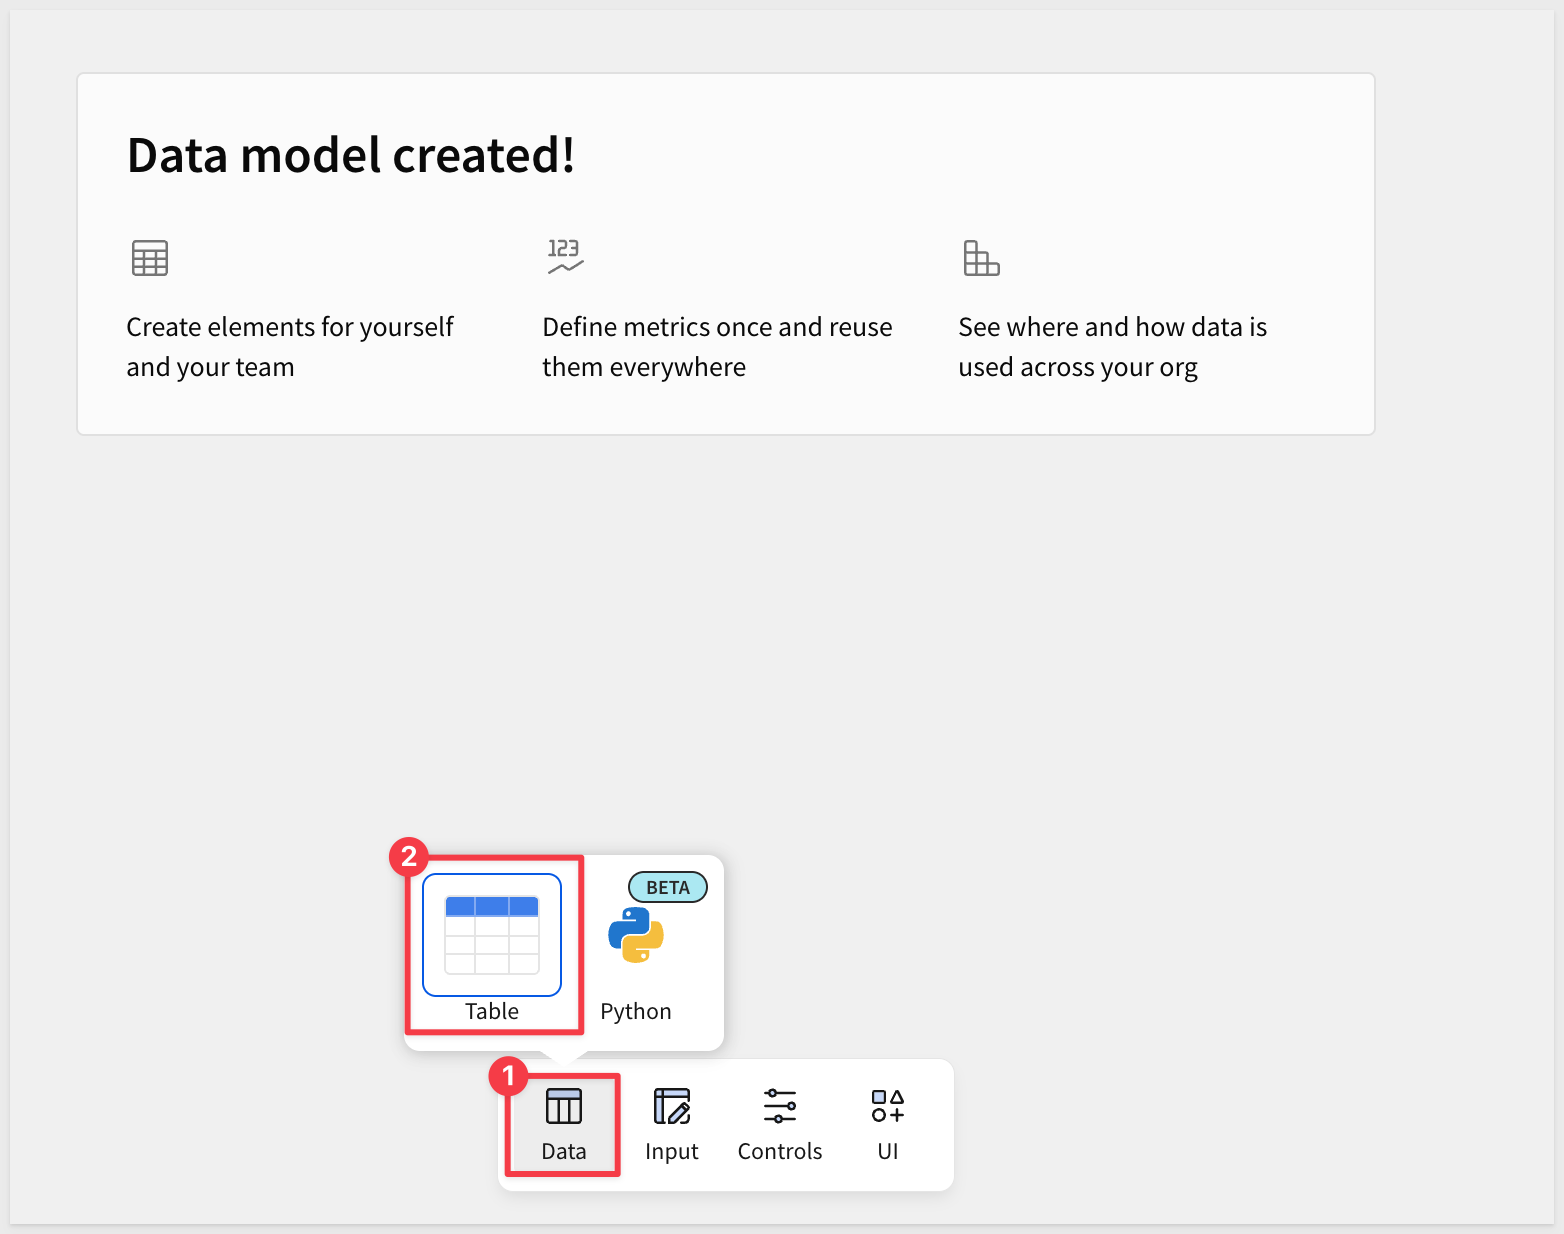
From the Element bar select Data > Table:
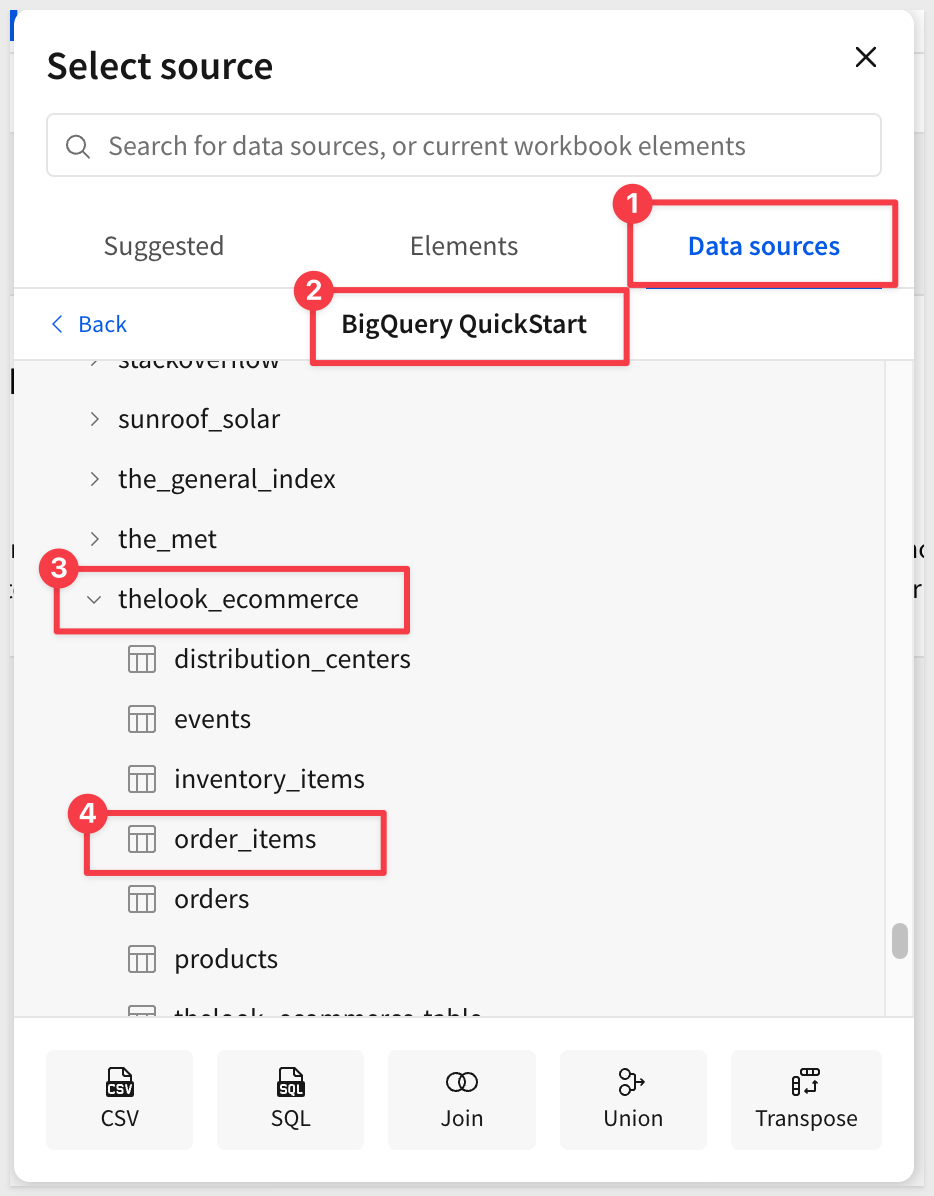
For Source, navigate to Connections > GCP Trial Account to BigQuery > bigquery-public-data > thelook_ecommerce database > order_items table:
The table will be loaded into a new data model:
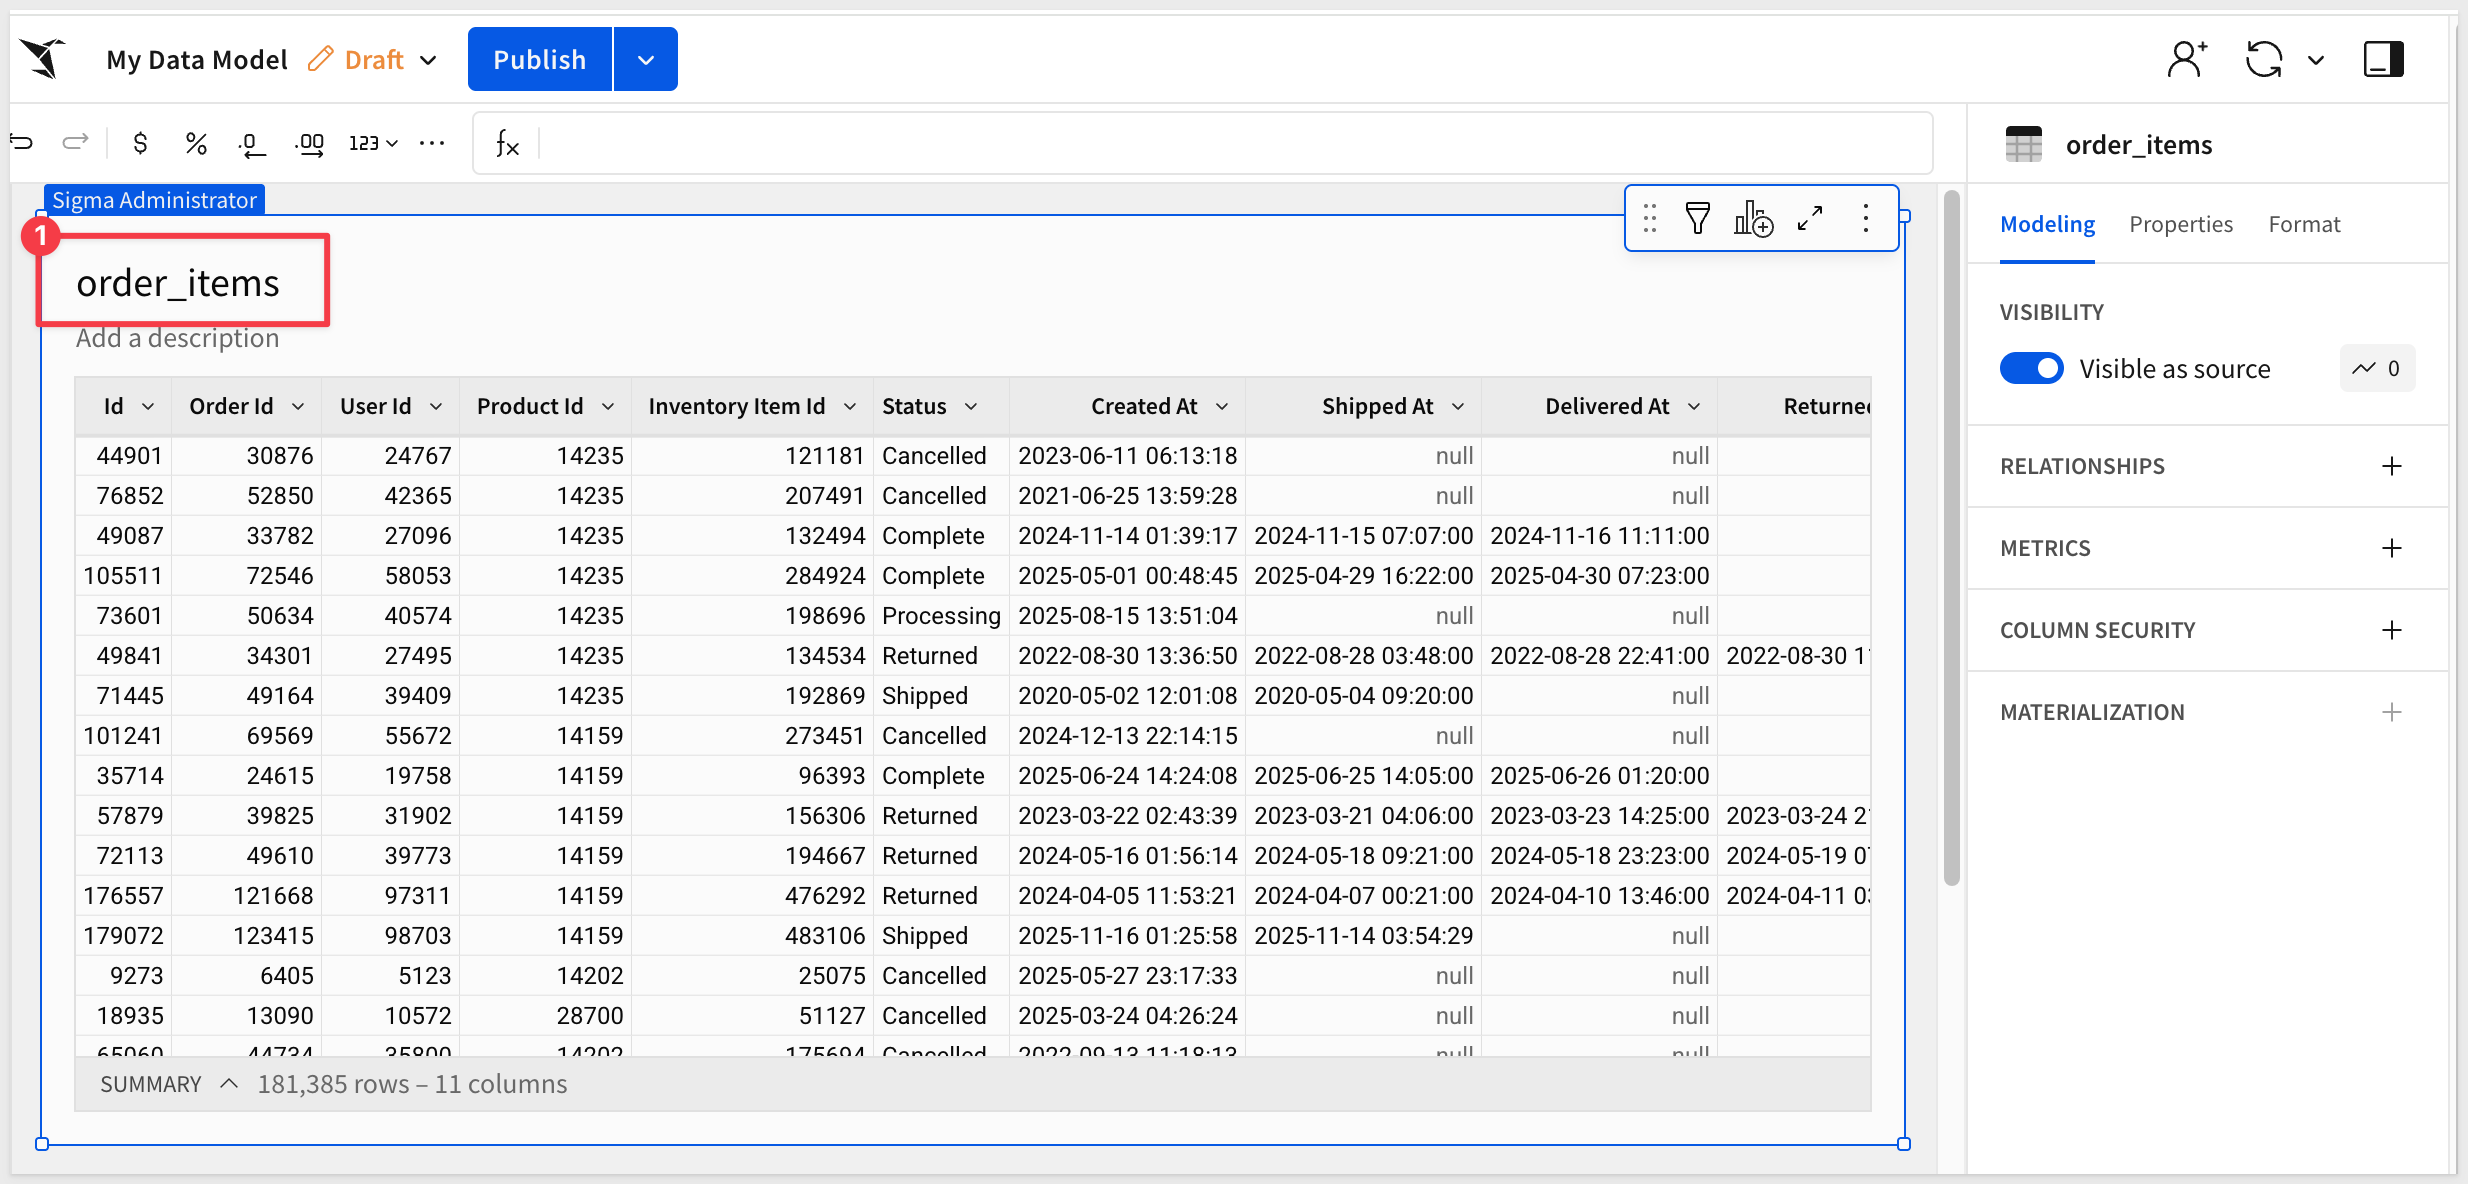
We now have a very simple data model we can use in the next section. We could join other data here but we will do that later instead.
Rename the data model to BigQuery QuickStart Data Model and click Publish.
Sigma workbooks offer data exploration tools, including a visualization canvas, designed to enable spreadsheet-savvy users to apply formulas and charting options that are typically accessible only to Business Intelligence (BI) developers.
From the data model click the crane icon  in the upper right corner to return to the homepage.
Click Create new and Workbook.
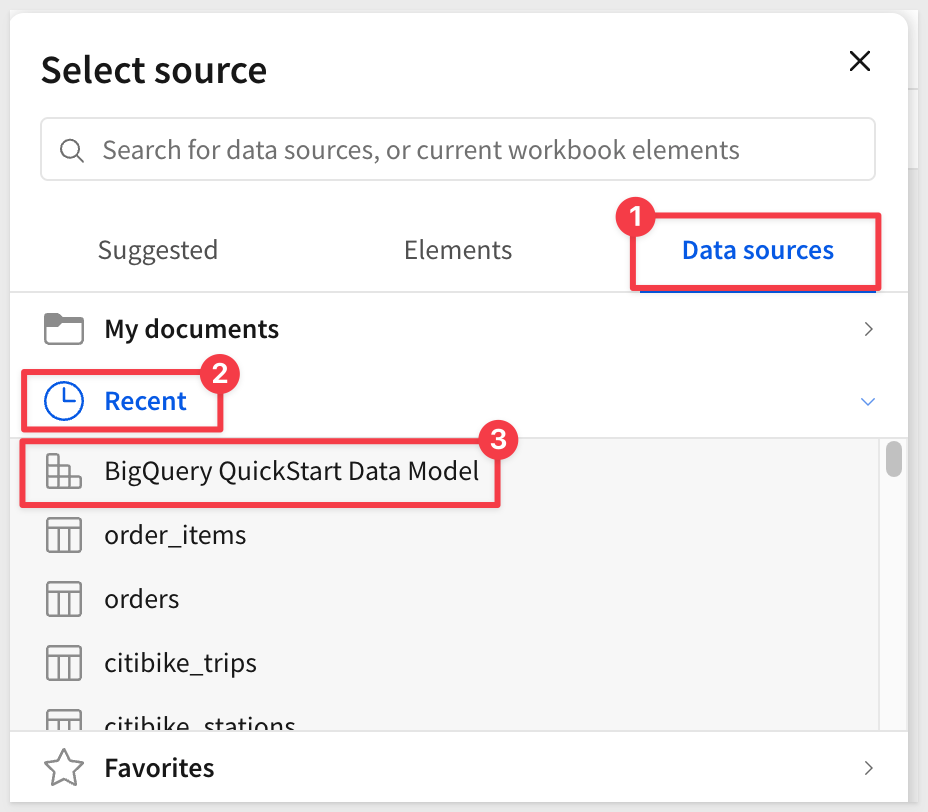
Use the Element Panel and select a new Data > Table. Select Data sources and in Recent the BigQuery QuickStart Data Model is available. Click that and then the order_items table:
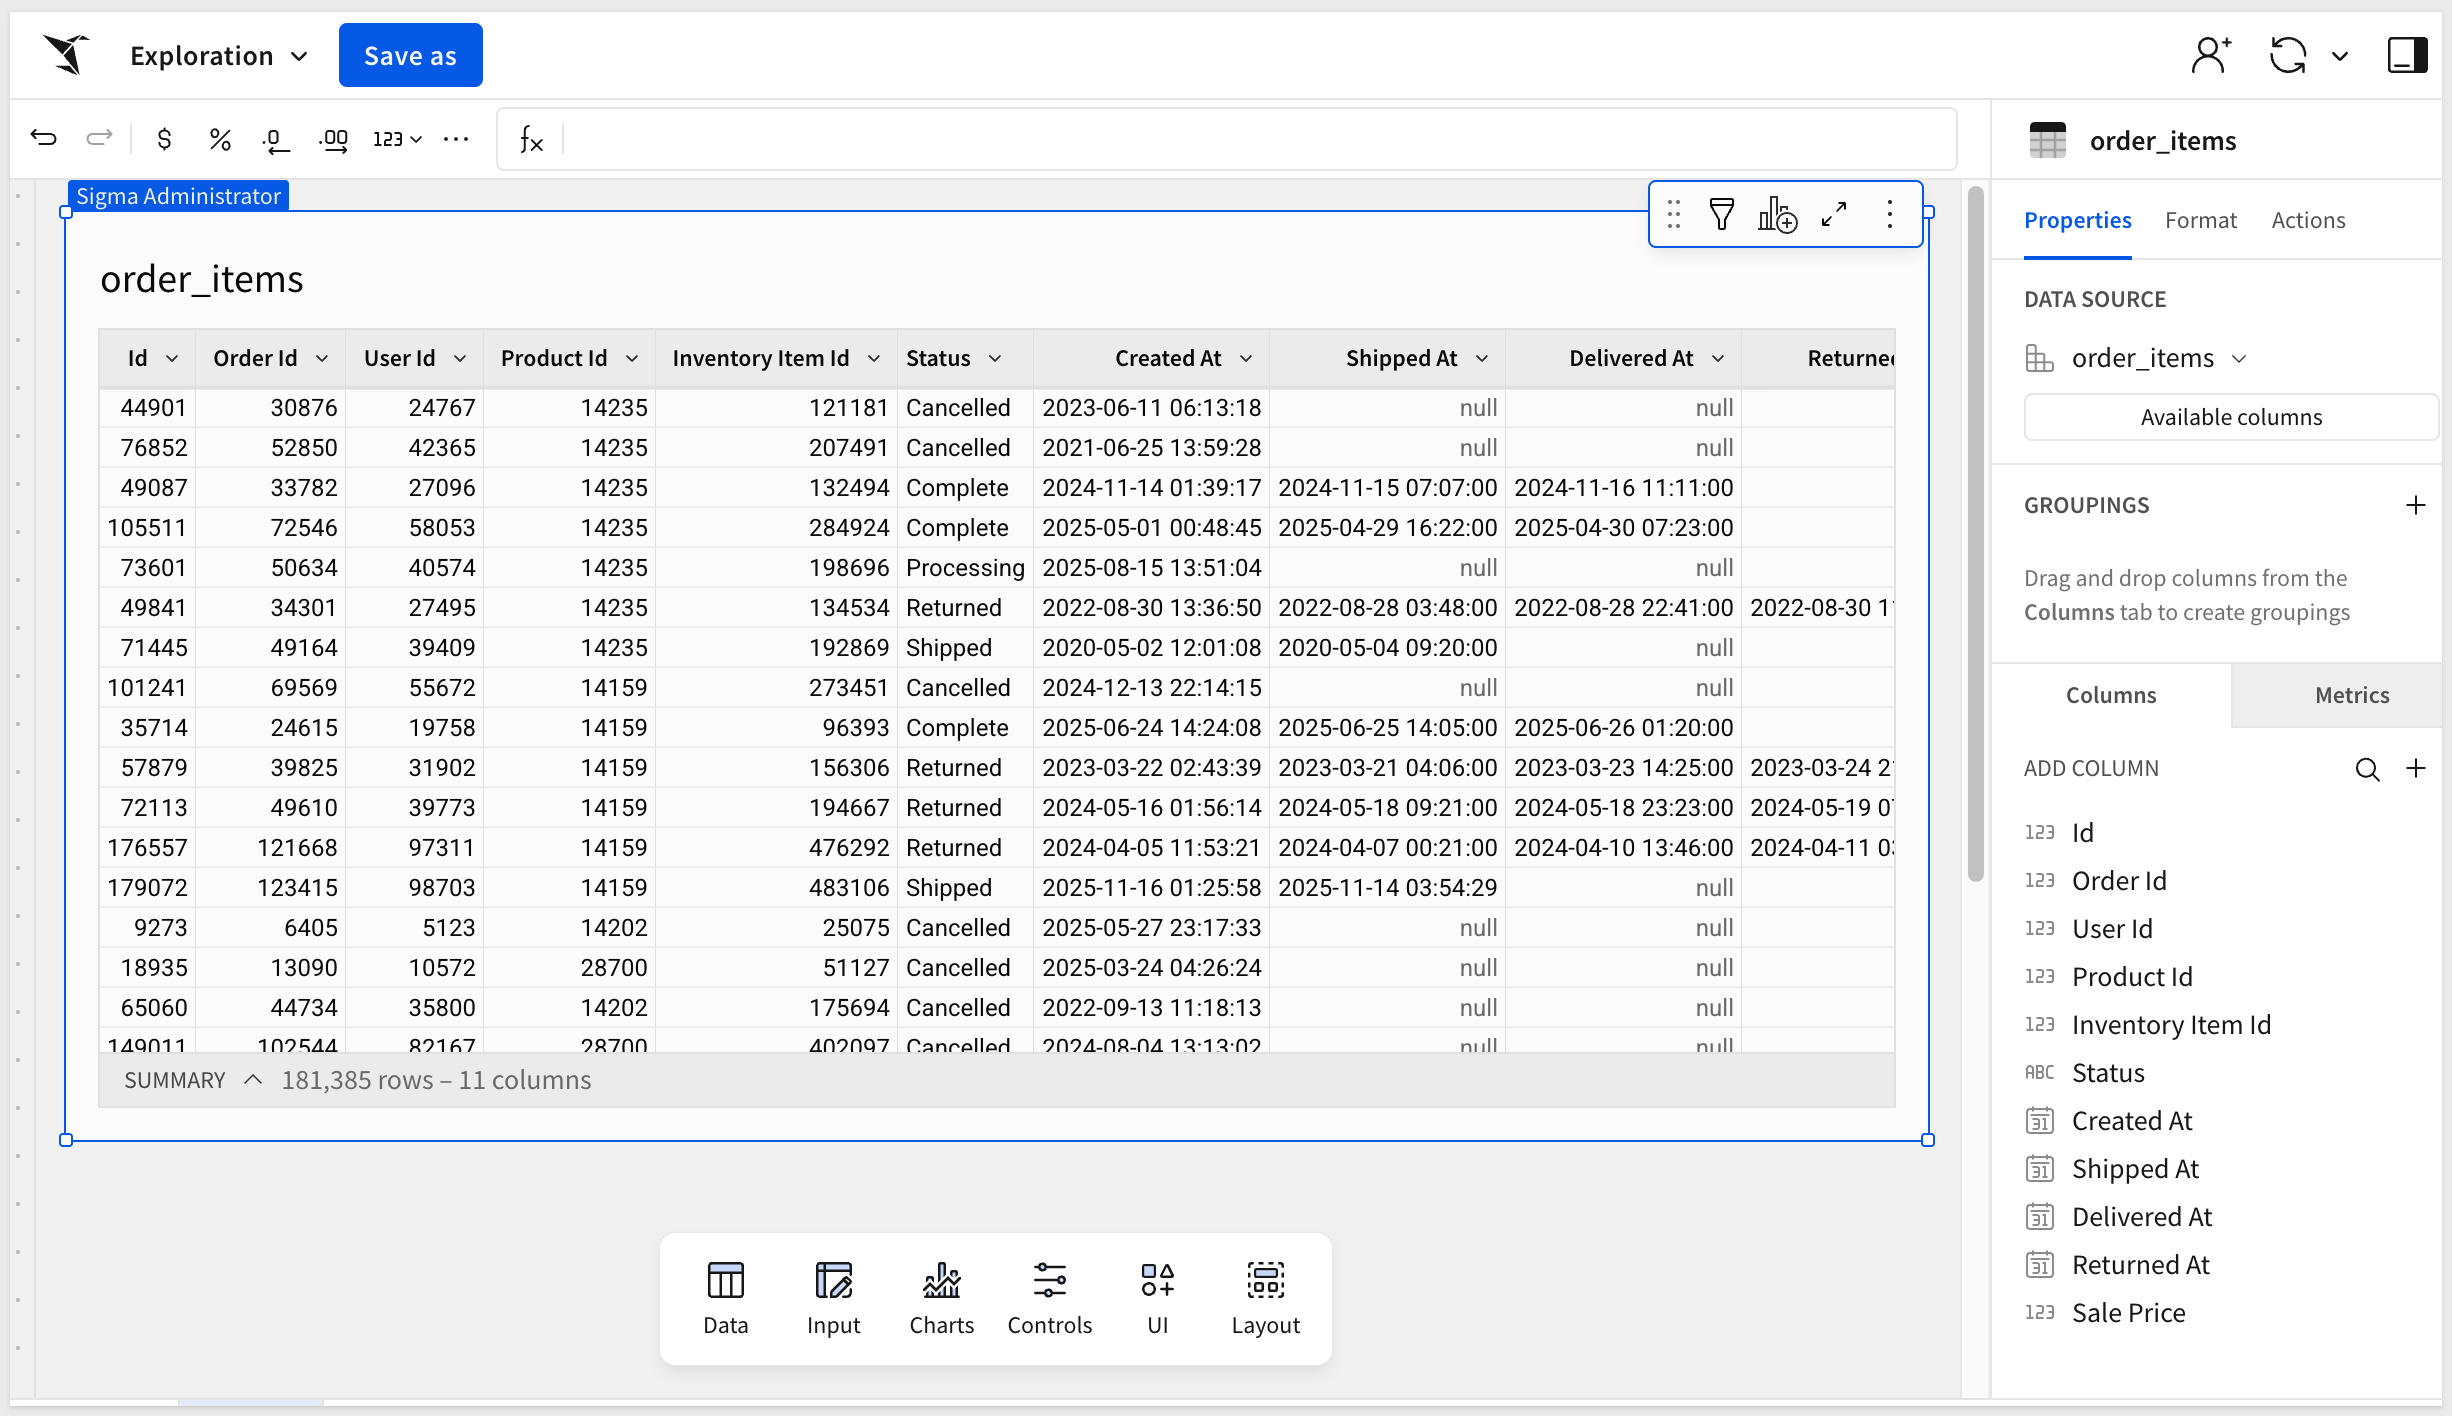
Now that we have the "approved" table from the data model on the page, we can join other tables.
Click the "hamburger menu" (3-dots) and select Element Source > Join:
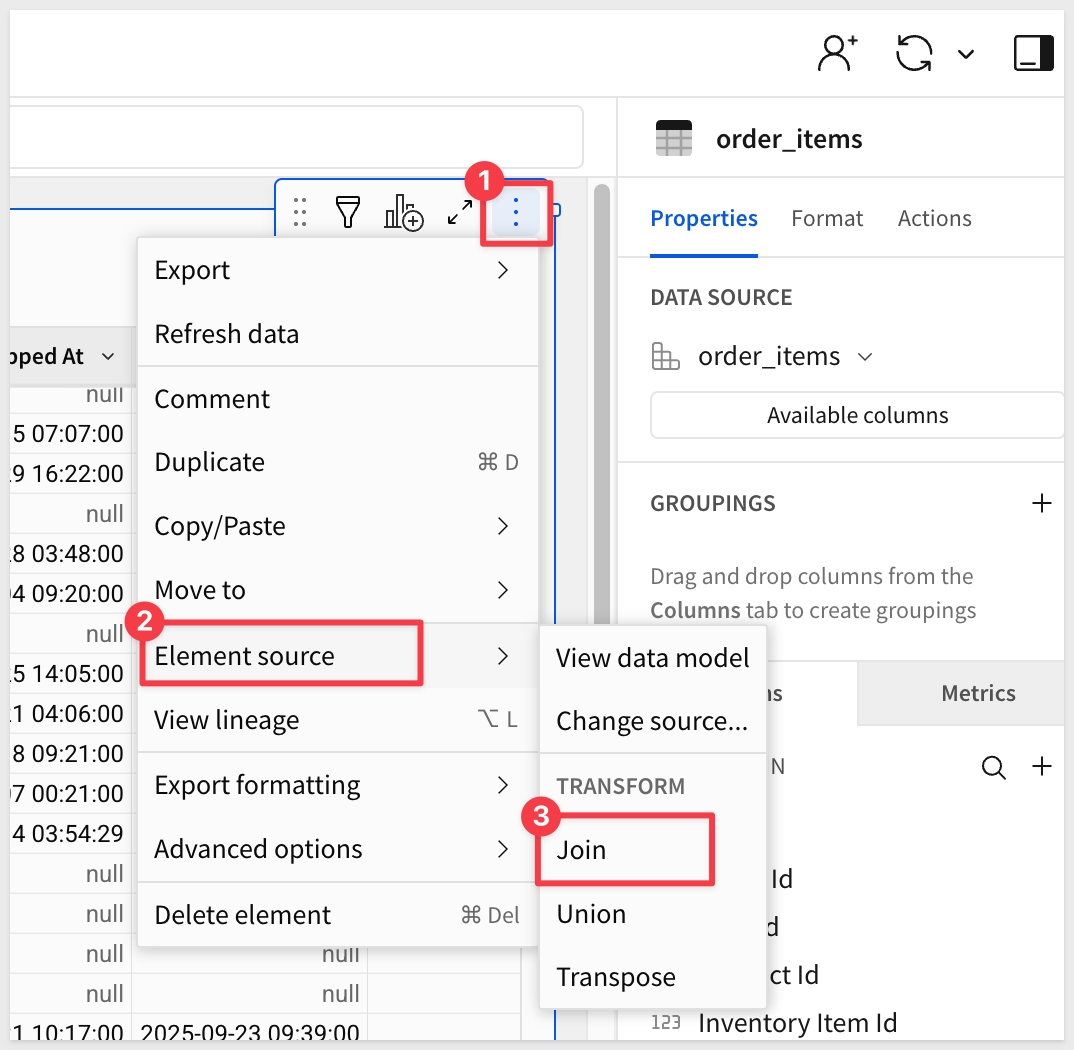
In the source selector, search for products and select the table from the public data:
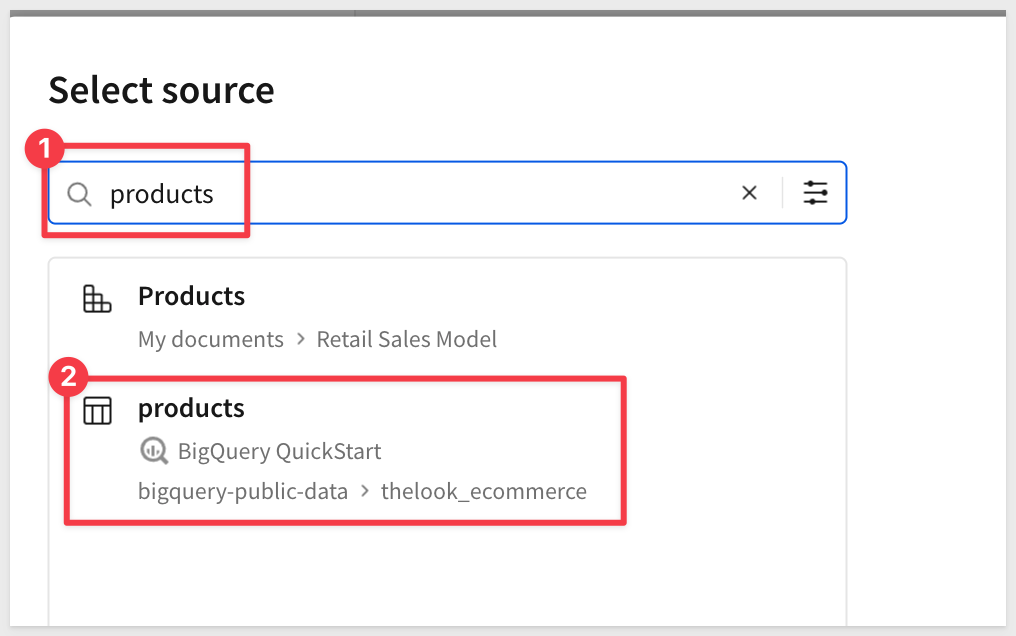
Accept all columns by clicking Select.
Set the Join Keys as shown below and click Preview Output:
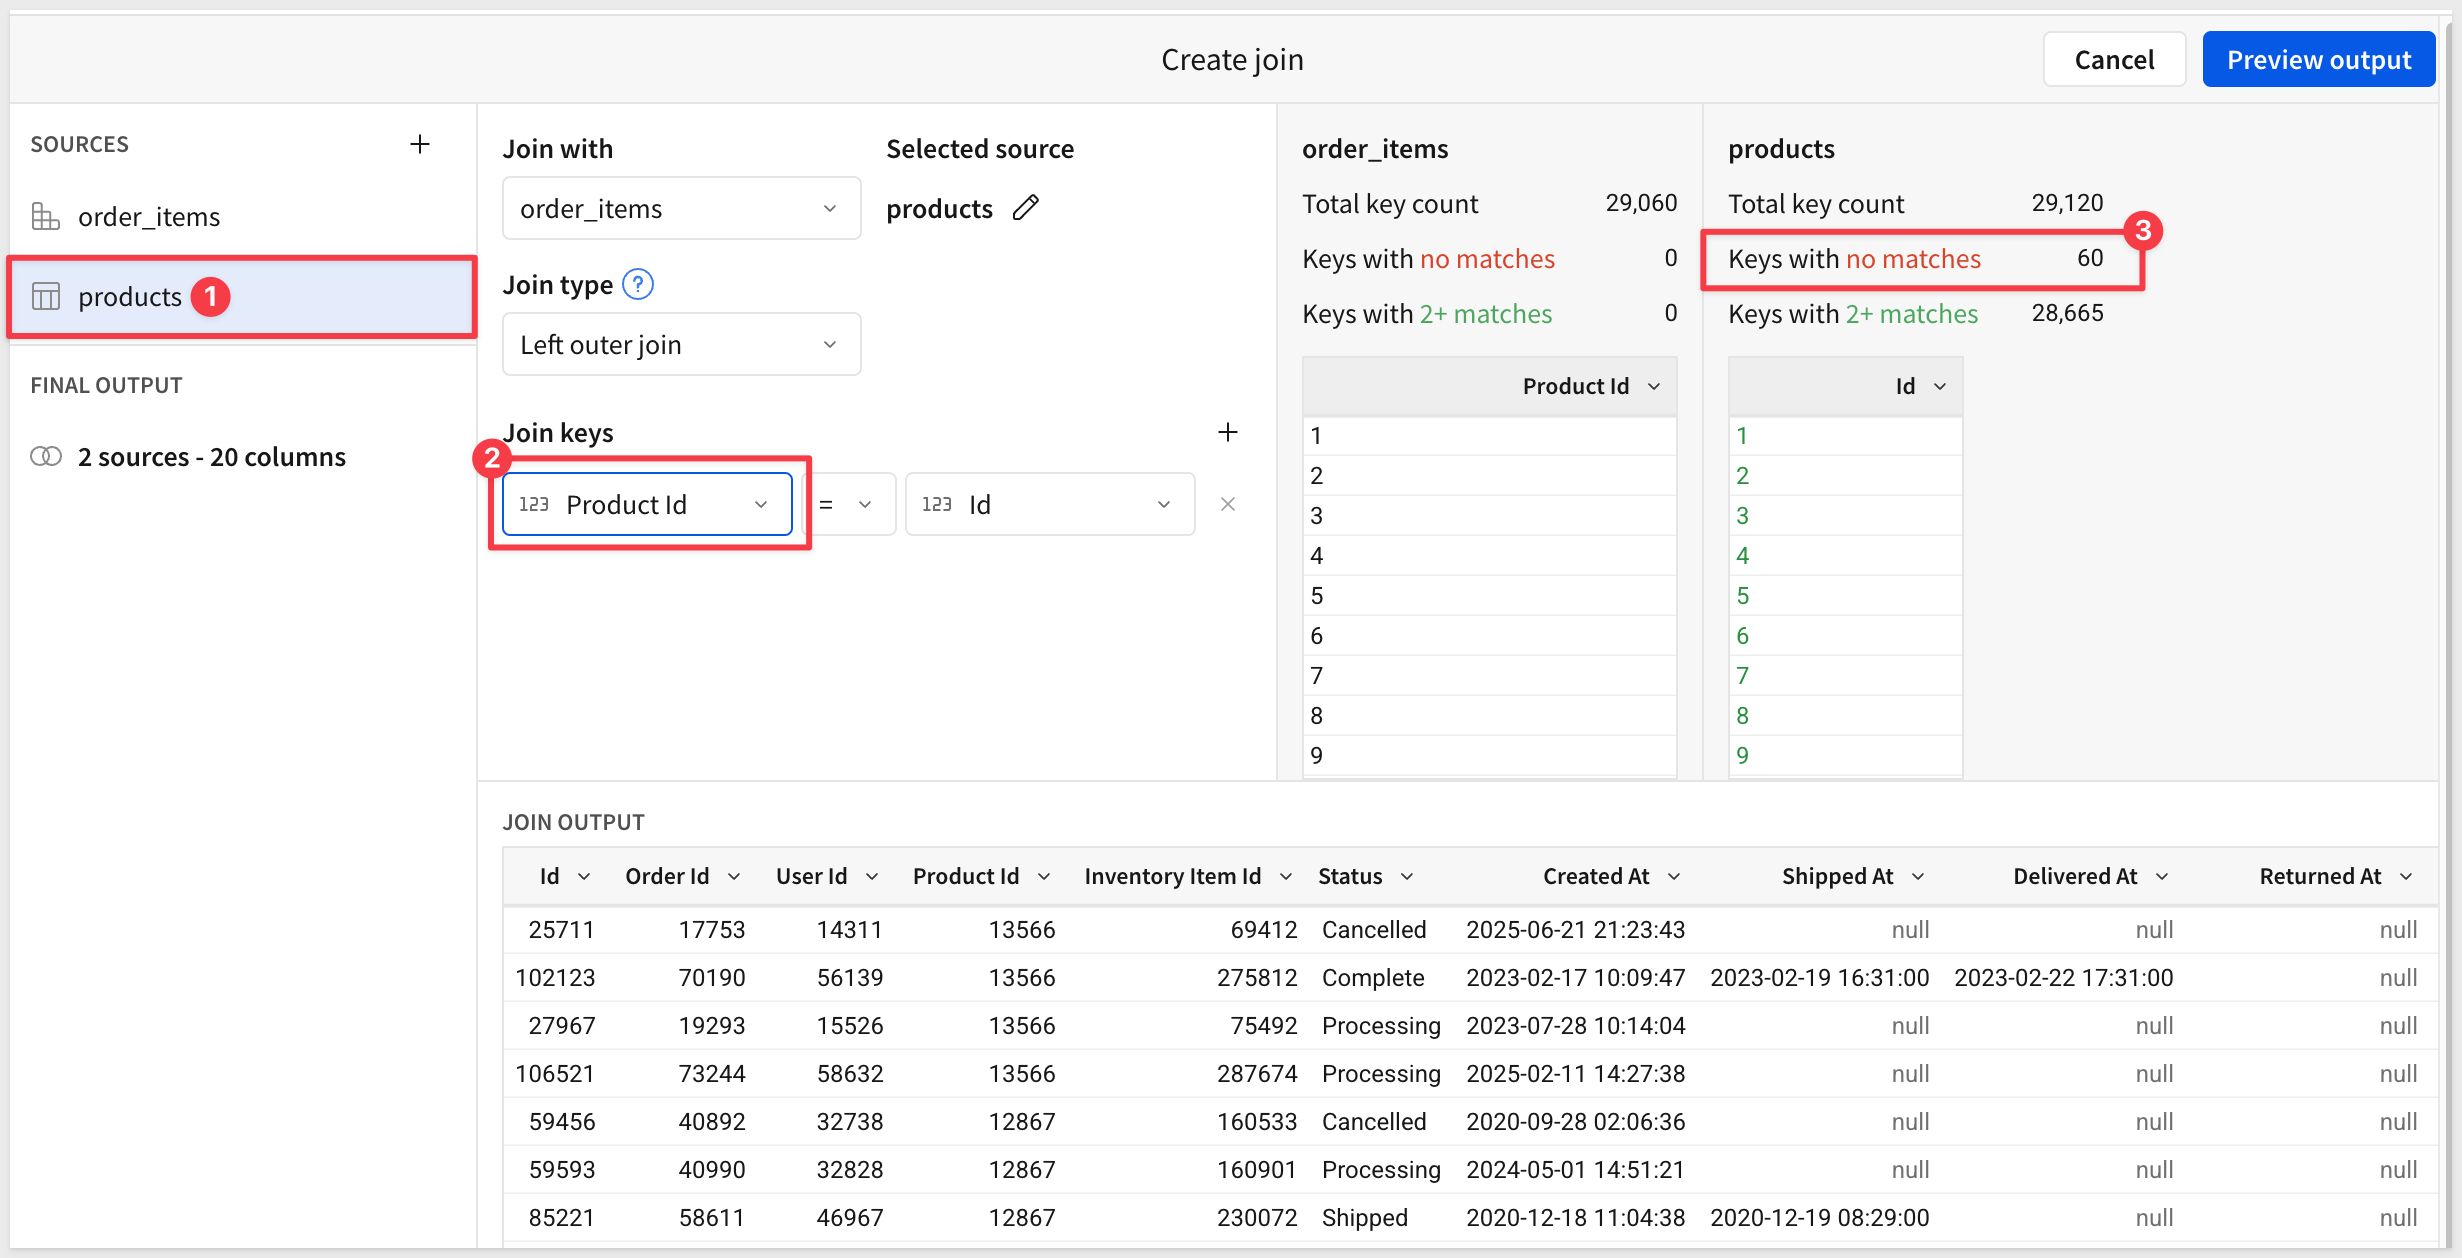
We are shown a visual representation of the dataflow (lineage).
Click Done:
Before we go forward, click the Save As button and name the workbook BigQuery QuickStart.
There is a wide range of benefits by opting for a modern data analysis and visualization stack.
These include:
- Faster time to value for analytics with BigQuery's near-unlimited scaling and processing capabilities, so decisions can be made faster.
- High user retention and engagement by giving users an interface they intuitively understand, the spreadsheet.
- Engage users in the modeling and exploratory process of data analysis. In Sigma, users can ask questions of the data just like they would in Google Sheets, but at the scale of your data. Work with millions or even billions of rows of data.
- Get started with Sigma in a flash! Once you've established a connection from BigQuery to Sigma any user can work with permitted tables immediately. Ask questions, build visualizations, and create reports in a fraction of the time of other tools.
- Harness the power of BigQuery in Sigma by effectively working with your data at scale. Sigma issues live queries rather than working off extracts. This ensures your data is always live and up-to-date.
- Access BigQuery user-defined functions directly in Sigma to ensure even the most complex functions are available to your entire organization.
Build Sigma dashboards and analyze data
In this section, we will demonstrate some basic features of Sigma that show how easy it is to leverage our data in BigQuery while working in a familiar interface.
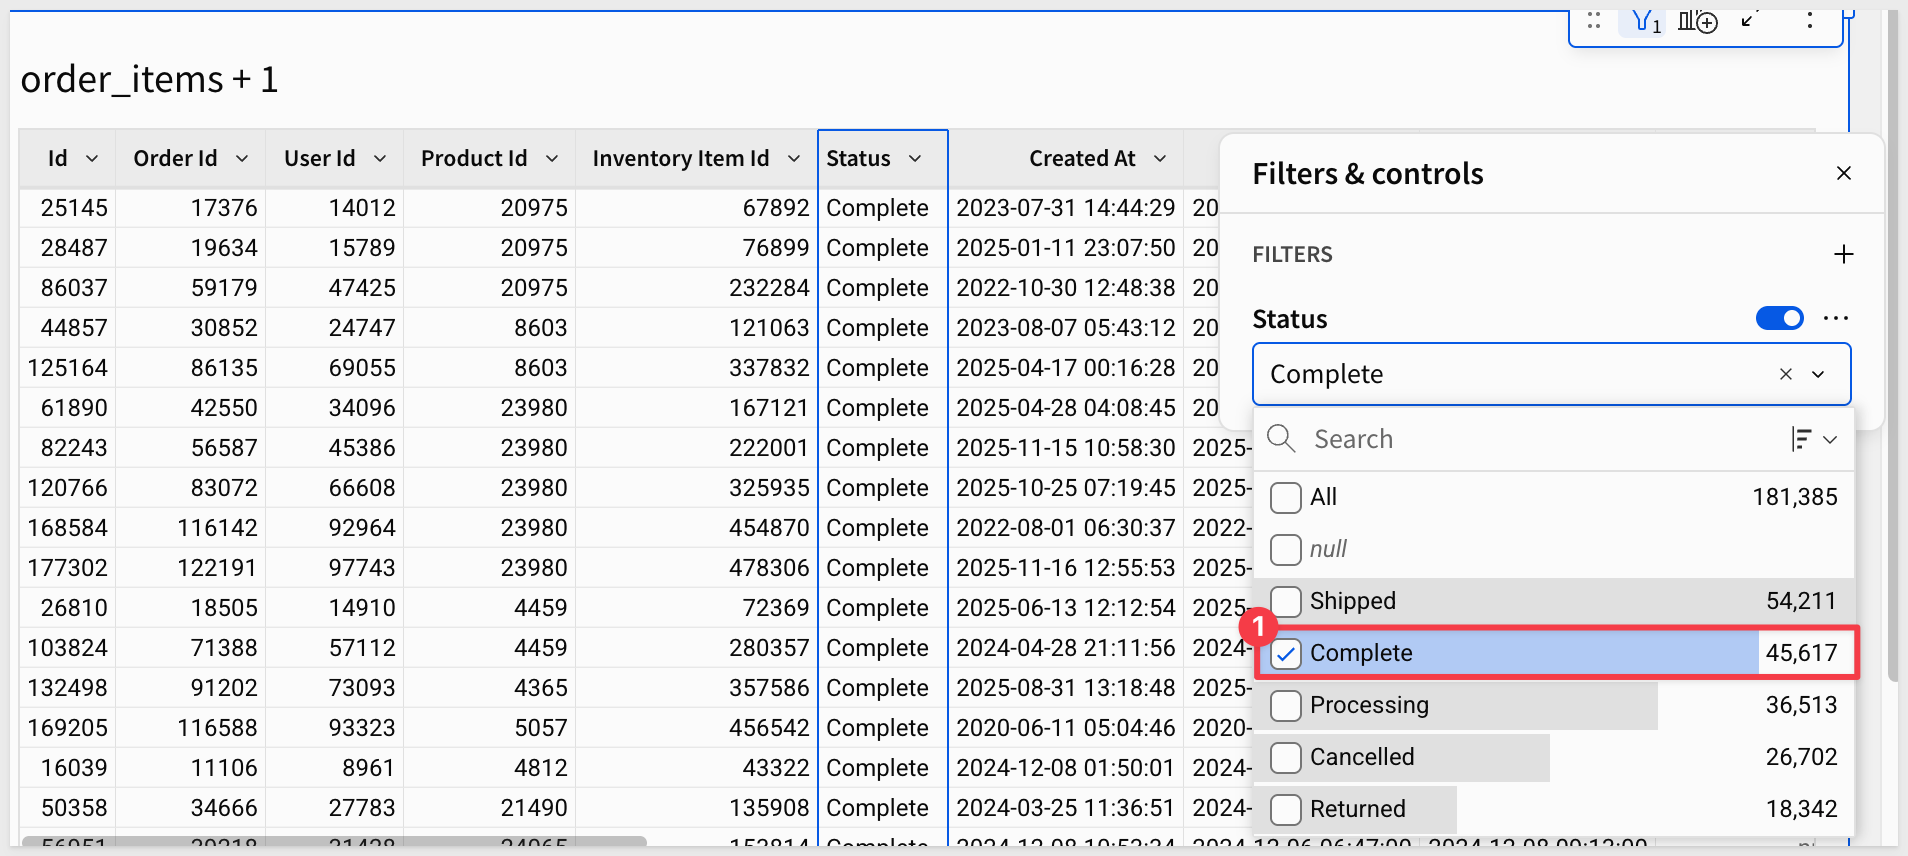
Using the BigQuery QuickStart workbook we will first narrow down our data scope to complete orders.
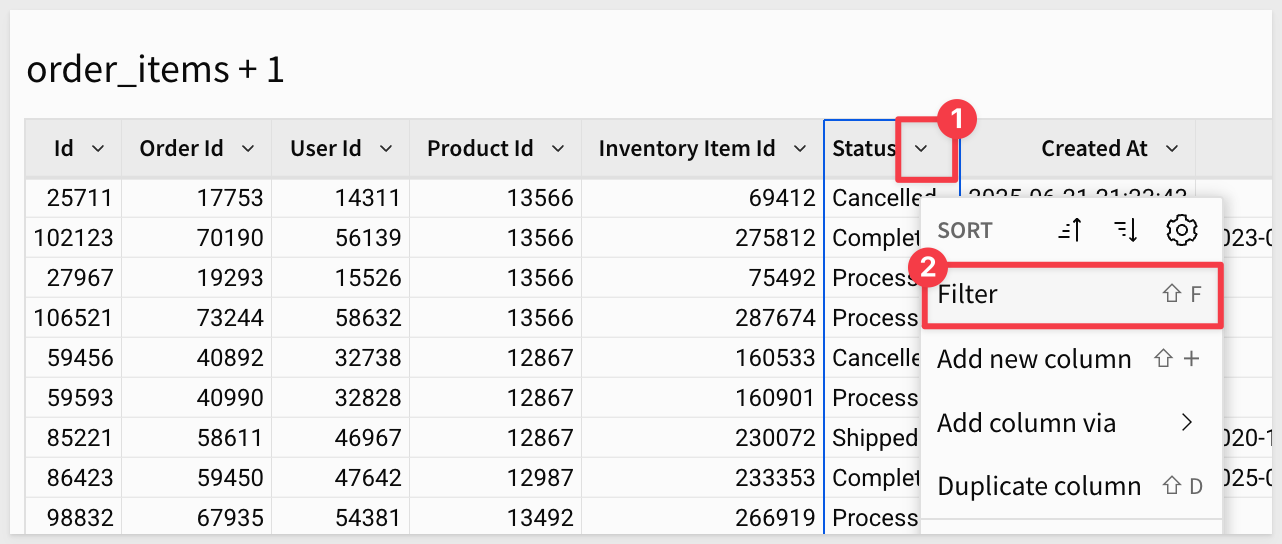
Select the dropdown next to Status and select the Filter button:
Select Complete to find only the finalized orders:
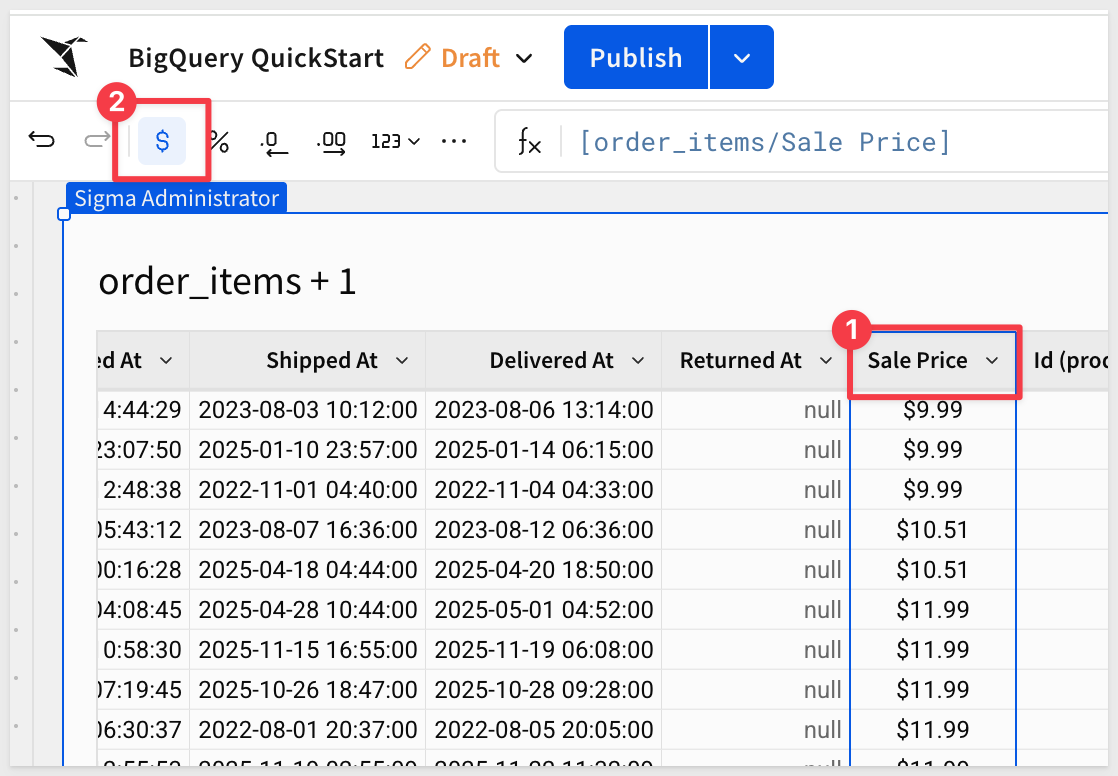
Format Sale Price as a currency by selecting Format> Currency from dropdown:
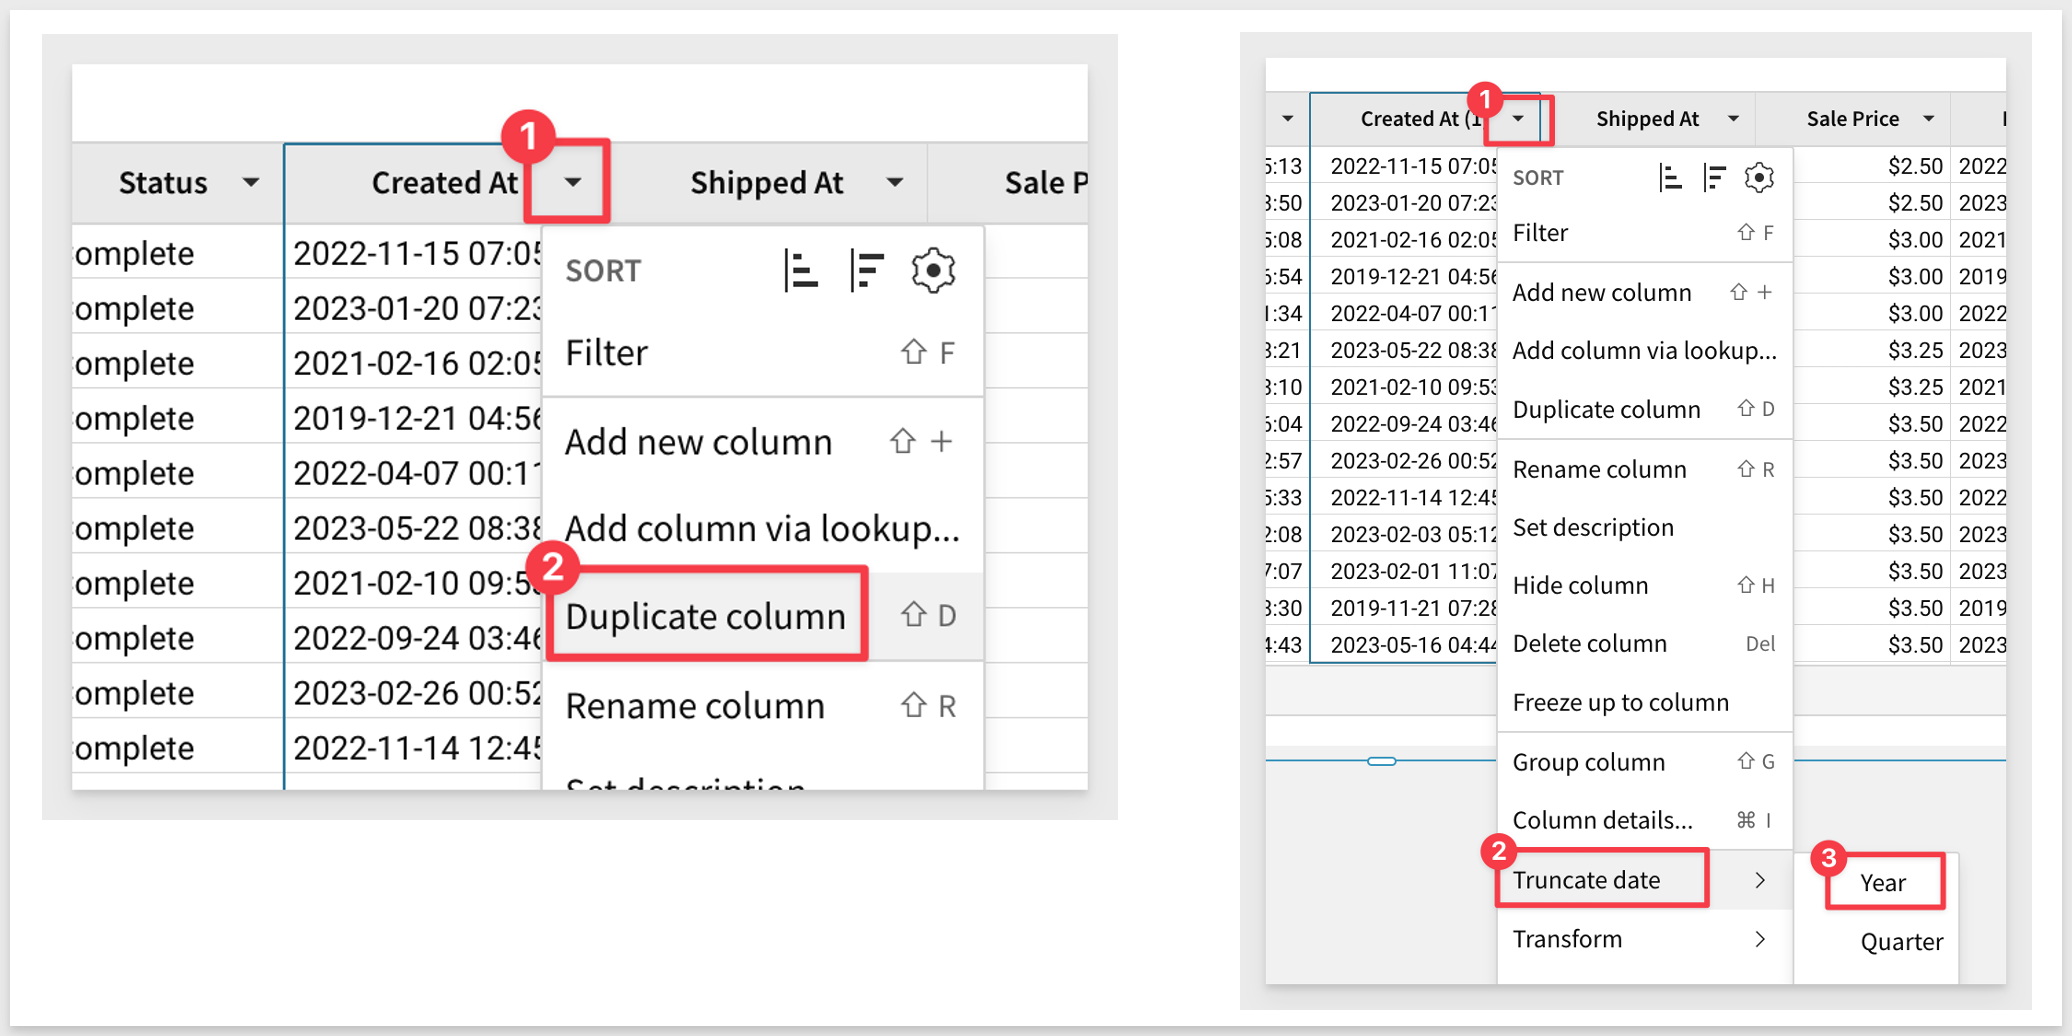
To perform analysis on the basis of order creation year, add a duplicate column Created At and then truncate it down to Year:
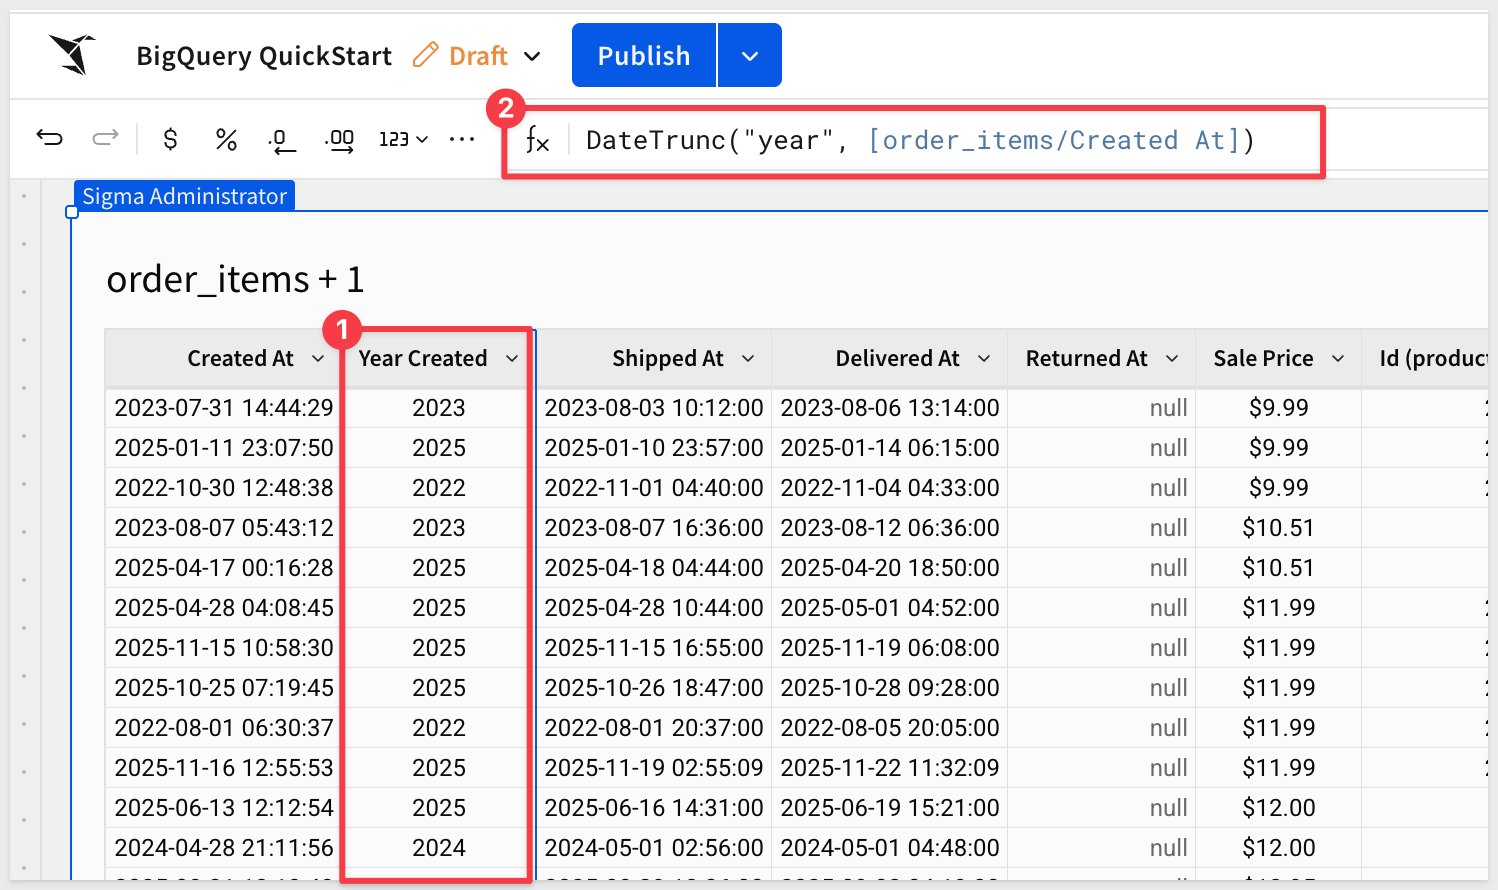
Double click on the new column's header (name) and rename it to Year Created.
Notice that we could also have edited the formula directly instead of using the column's context menus:
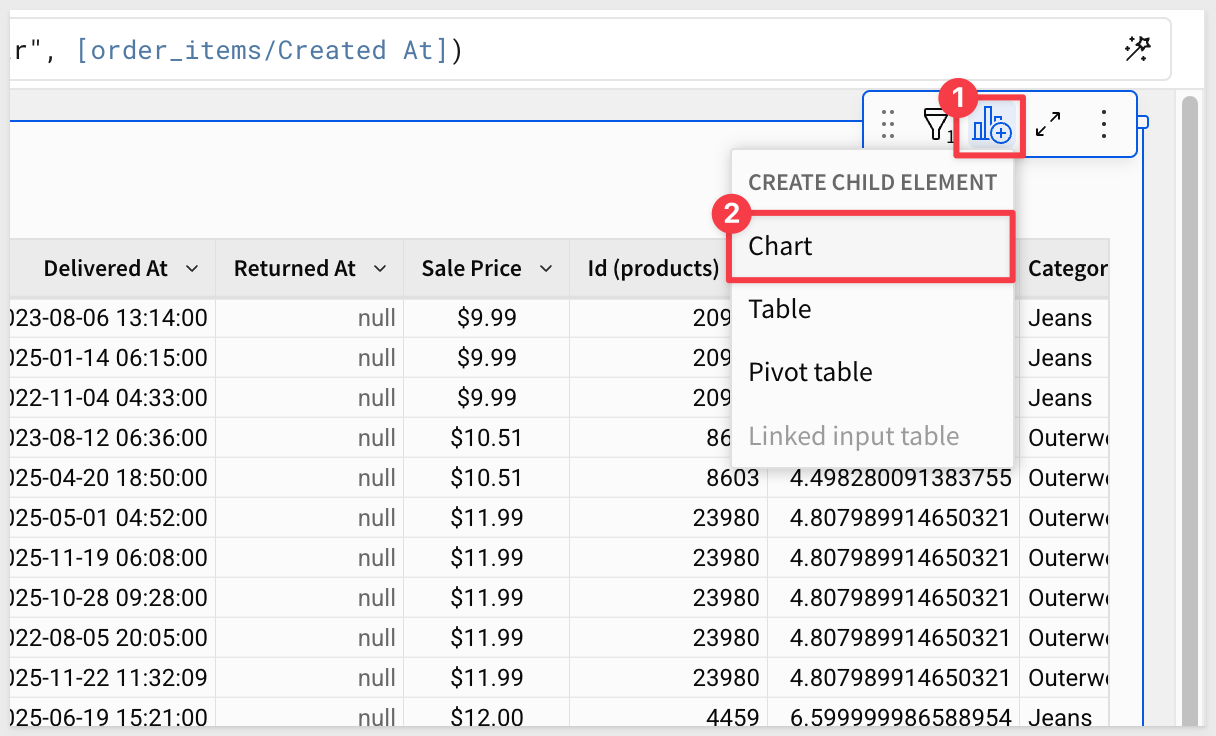
Create a chart from Table
We can create a chart that leverages this table's data (child element).
Select the Create Child Element and the Chart option:
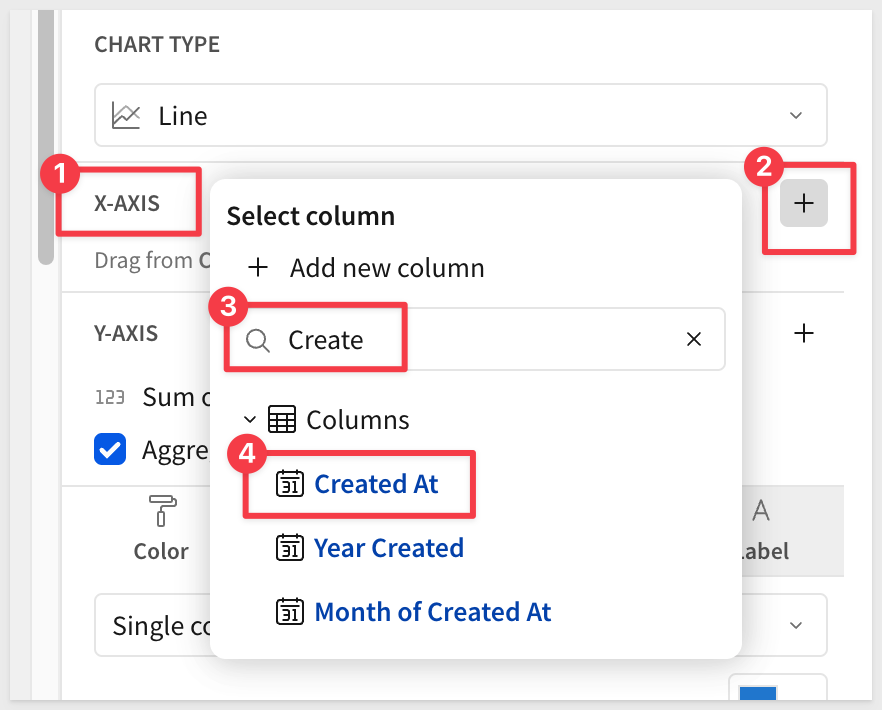
With the new chart selected, we'll start by adding the Created At field to the x-axis. You can either use drag and drop interface or search for it, like in the example below:
For the y-axis, add the transformed Sale Price field from previous steps. Try dragging and dropping the Sale Price column this time:
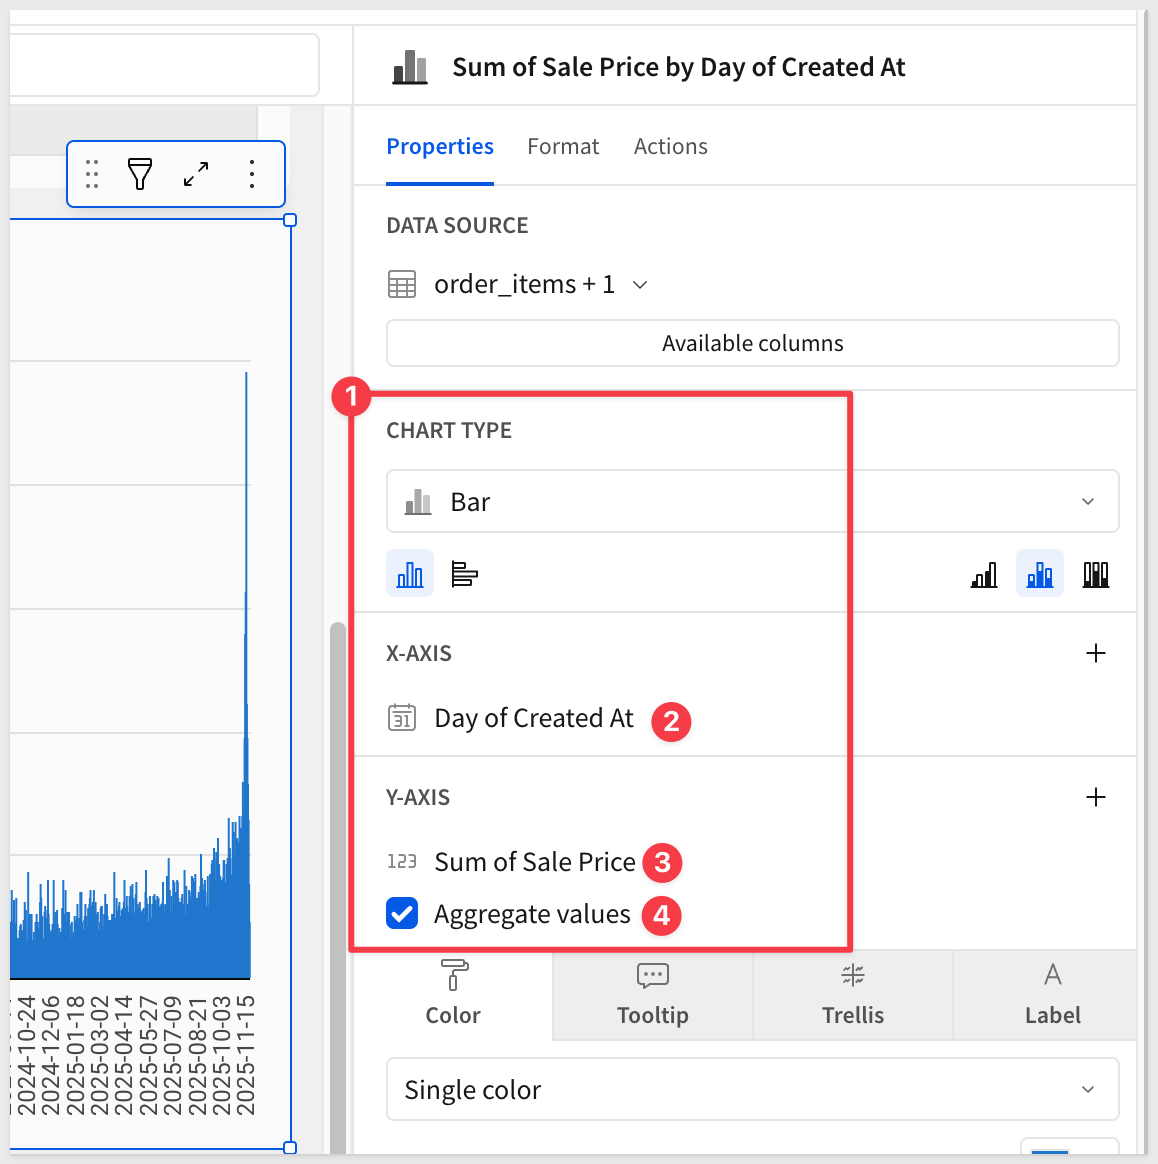
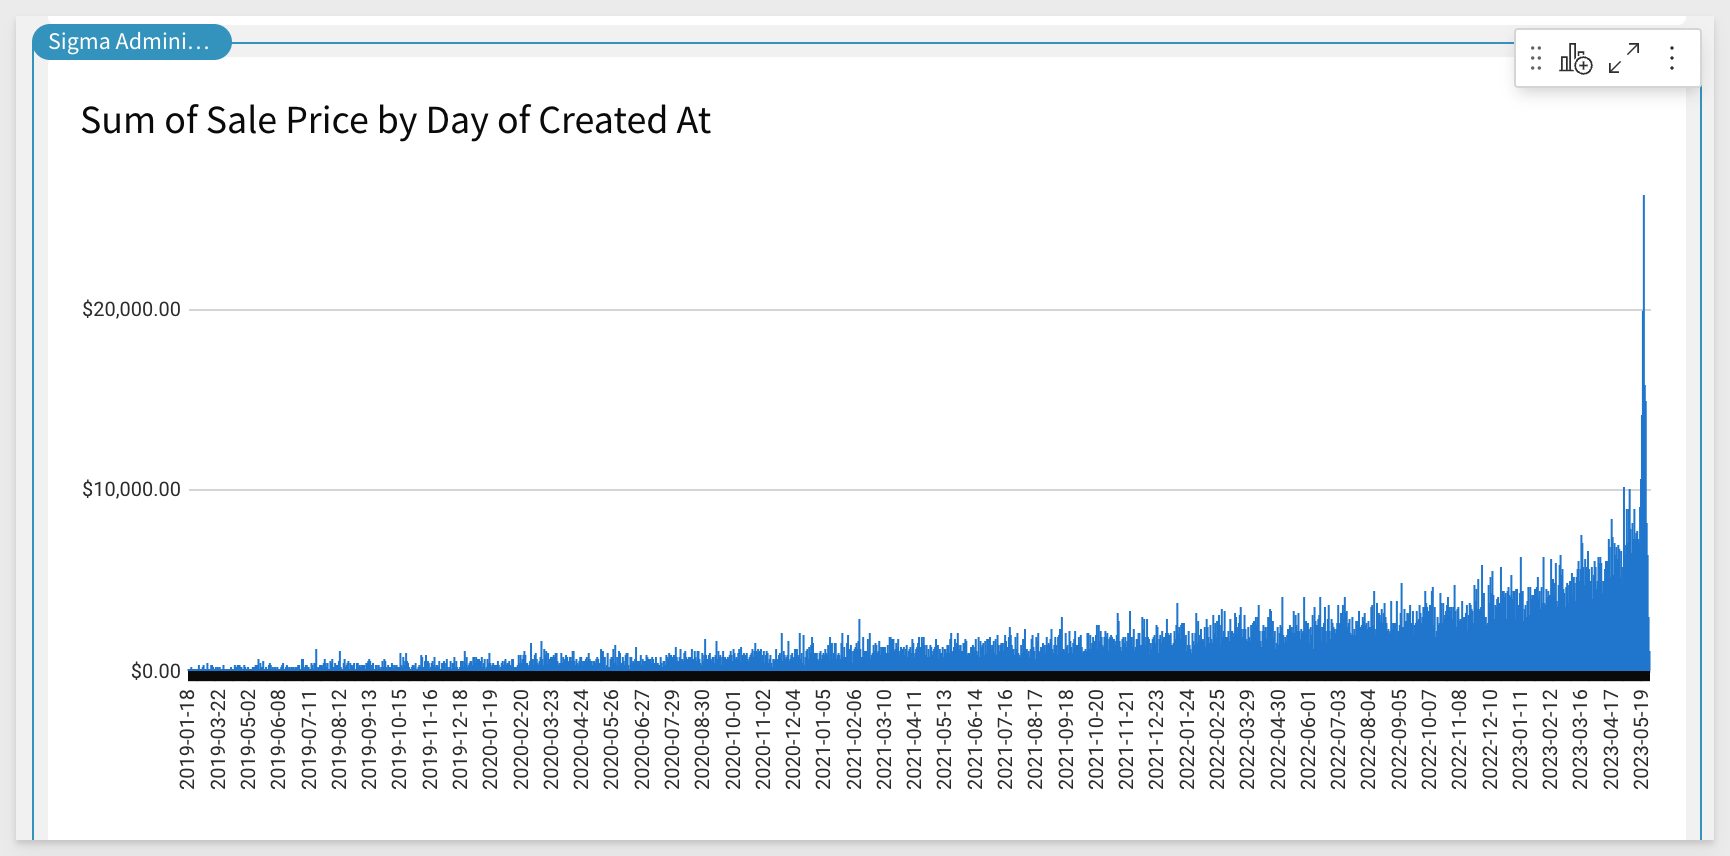
The visualization will appear showing the sum of Sale Price by Created At for the available data in the table:
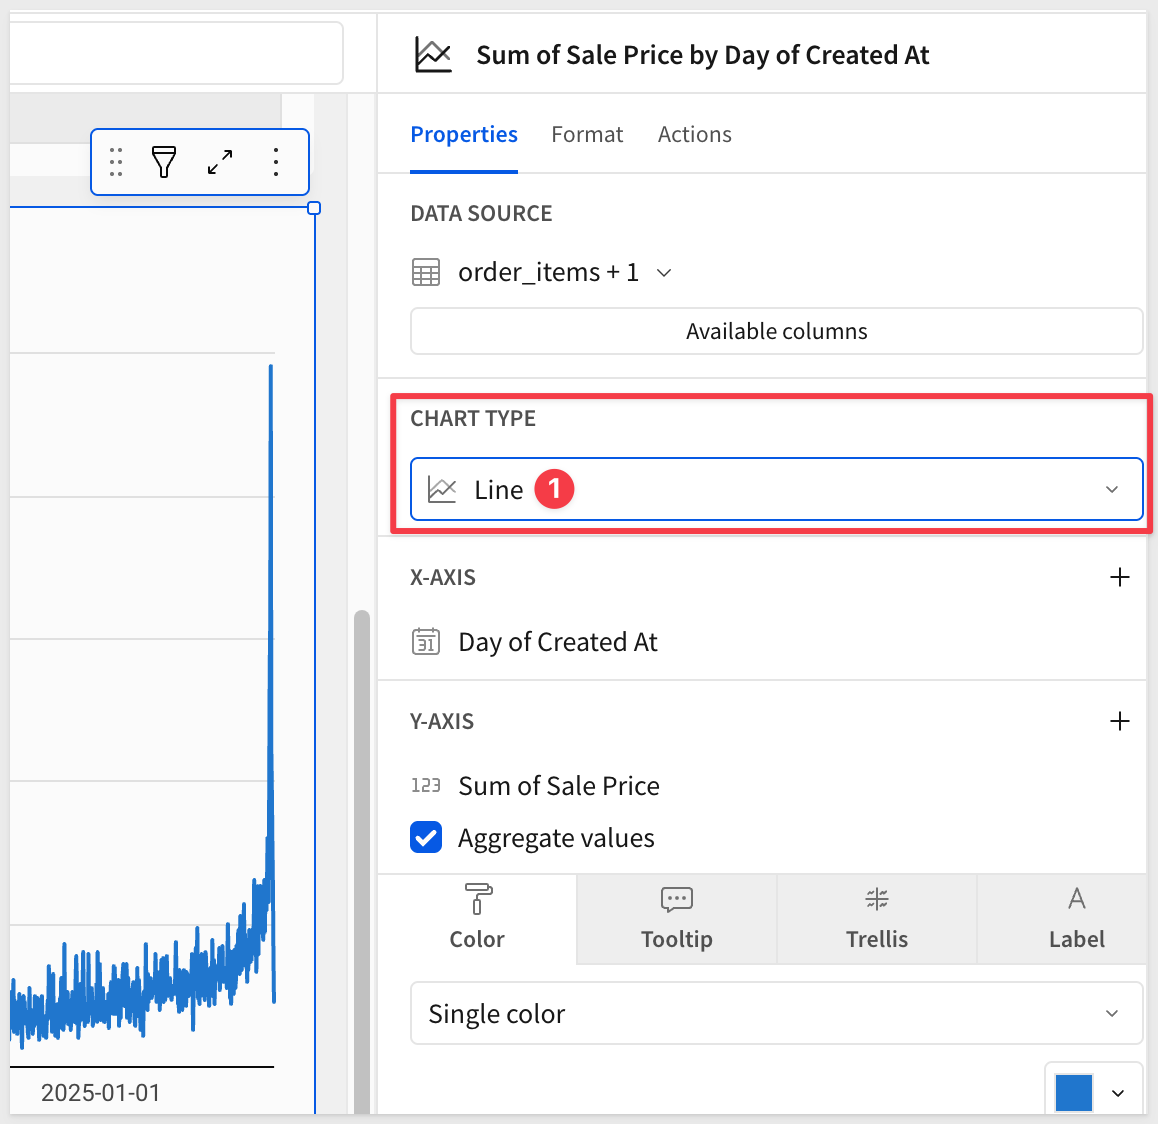
We'll modify this visualization by changing it to a line chart:
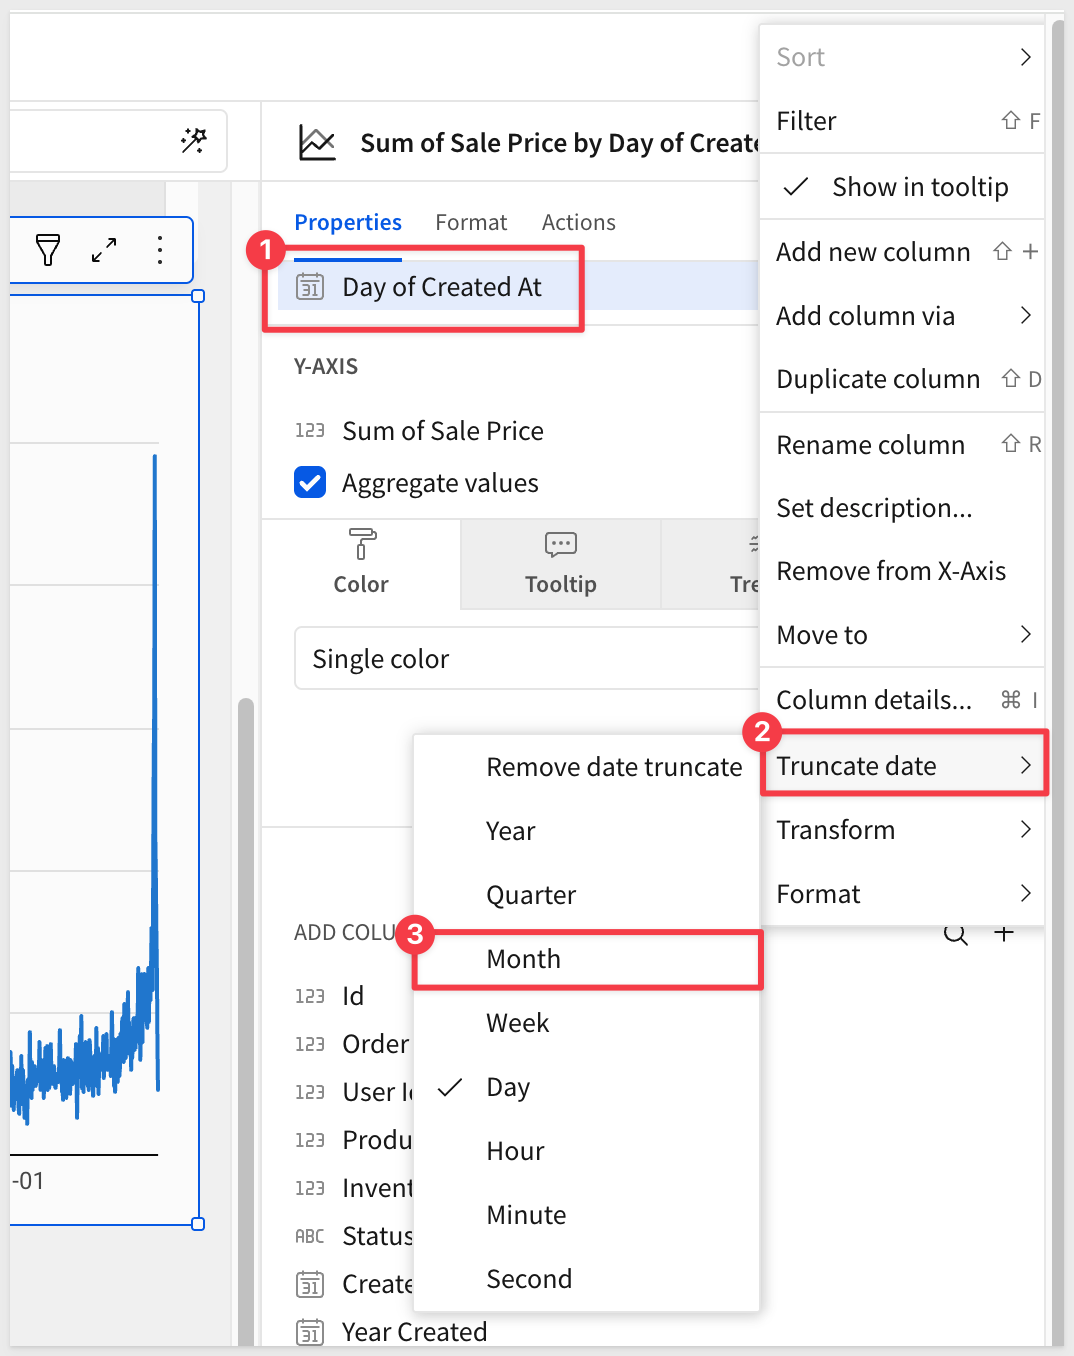
To perform data aggregation at a higher order of time (for example, at the month), we have a few methods available to the user.
We can use the drop menus (as before) to truncate the Day of Created At column in the X-AXIS to month:
OR
Column data can be manipulated using Sigma's formula bar, similar to spreadsheet formula features.
Notice here, we just selected the Day of Created At column in the X-AXIS and altered the existing formula to Month instead of Day:
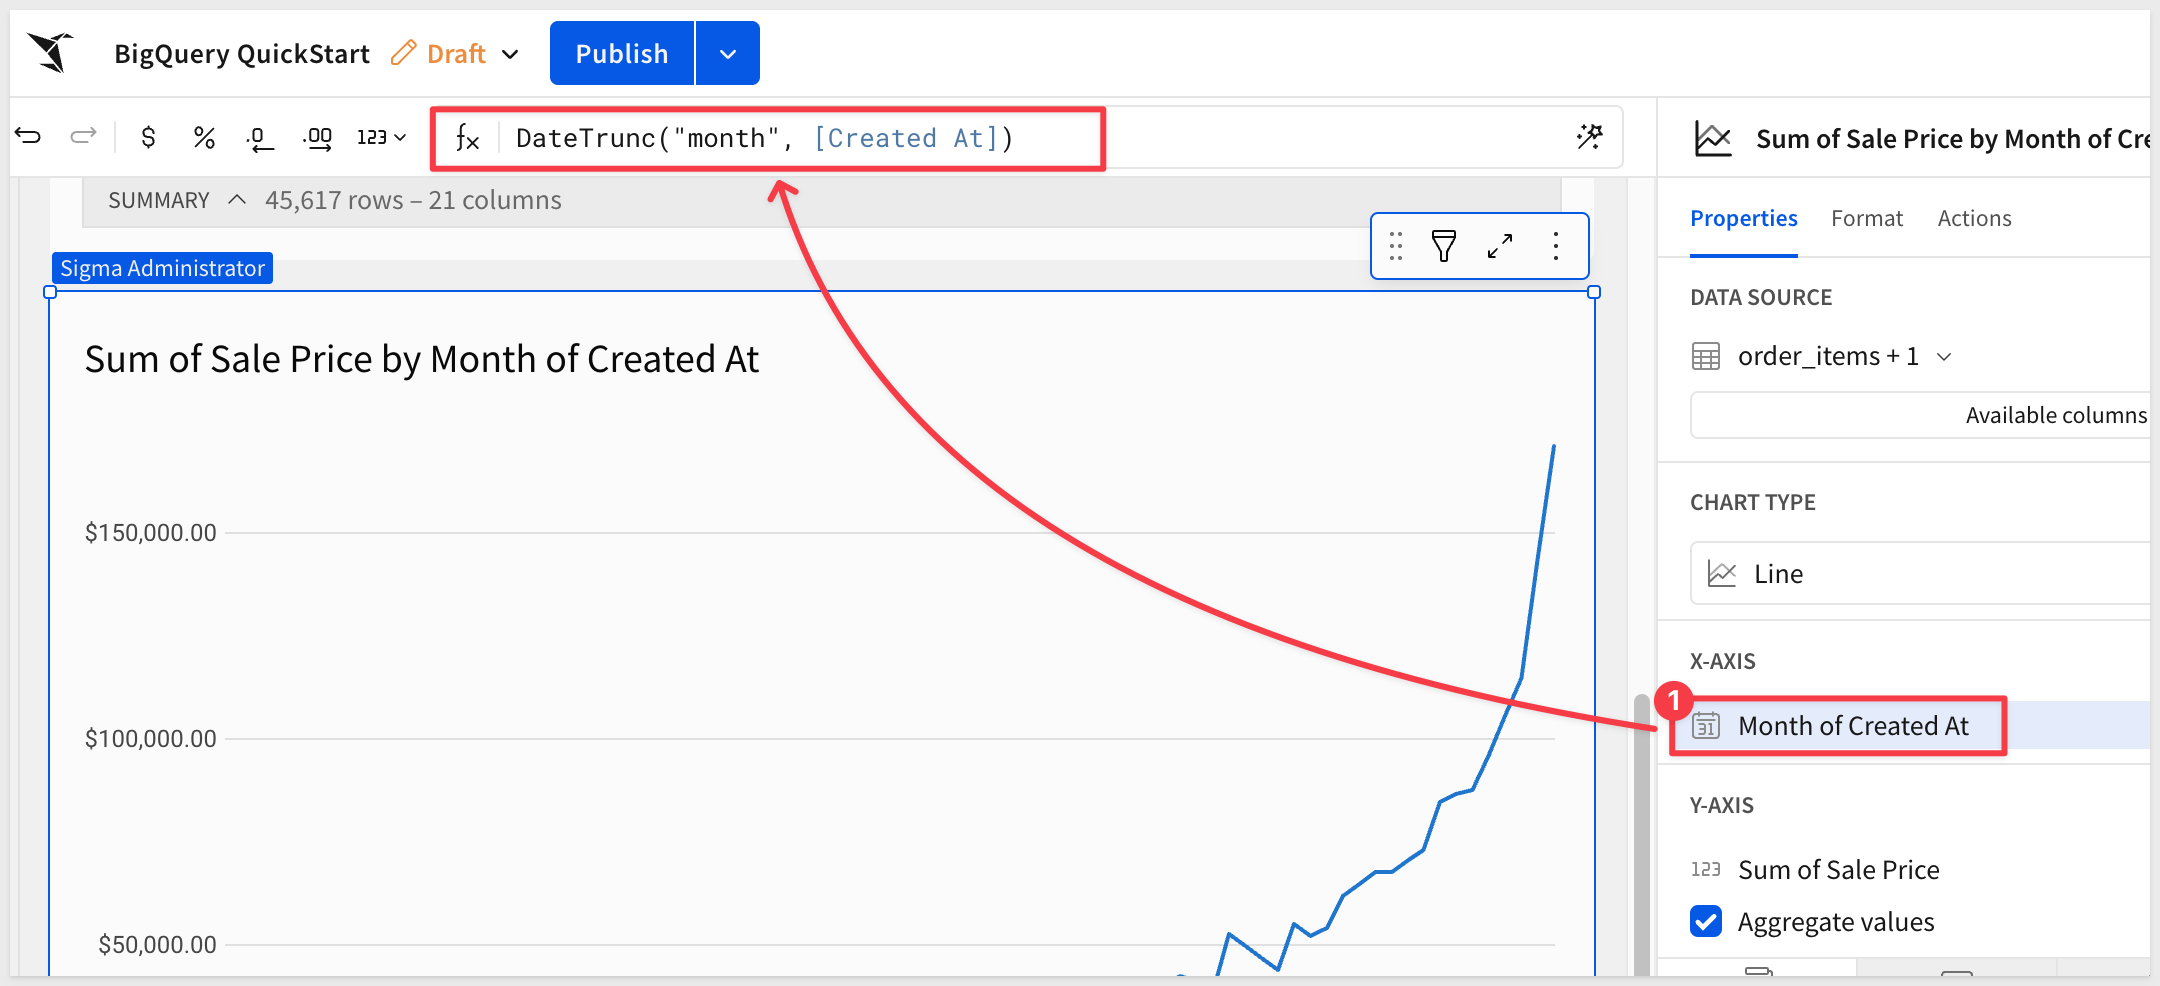
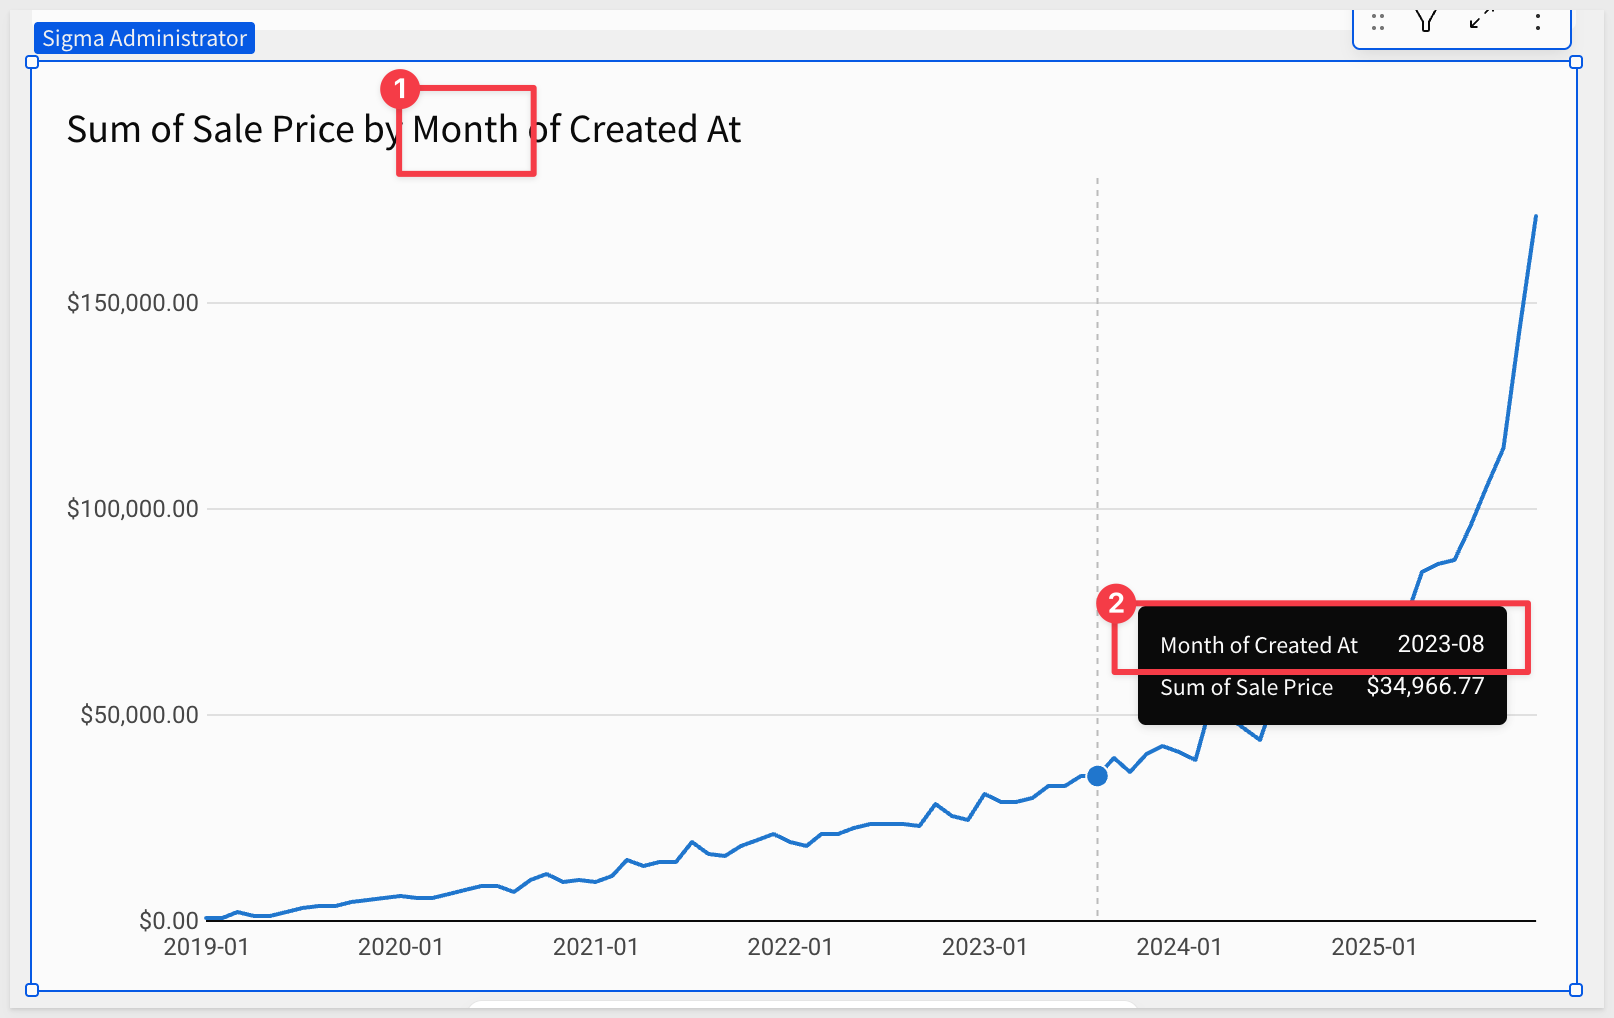
The chart is automatically updated to reflect the month instead of day:
Create a Pivot Chart
It is easy to create a pivot table in Sigma.
We will create another child element from our order_items + 1 table but this time, select Pivot table.
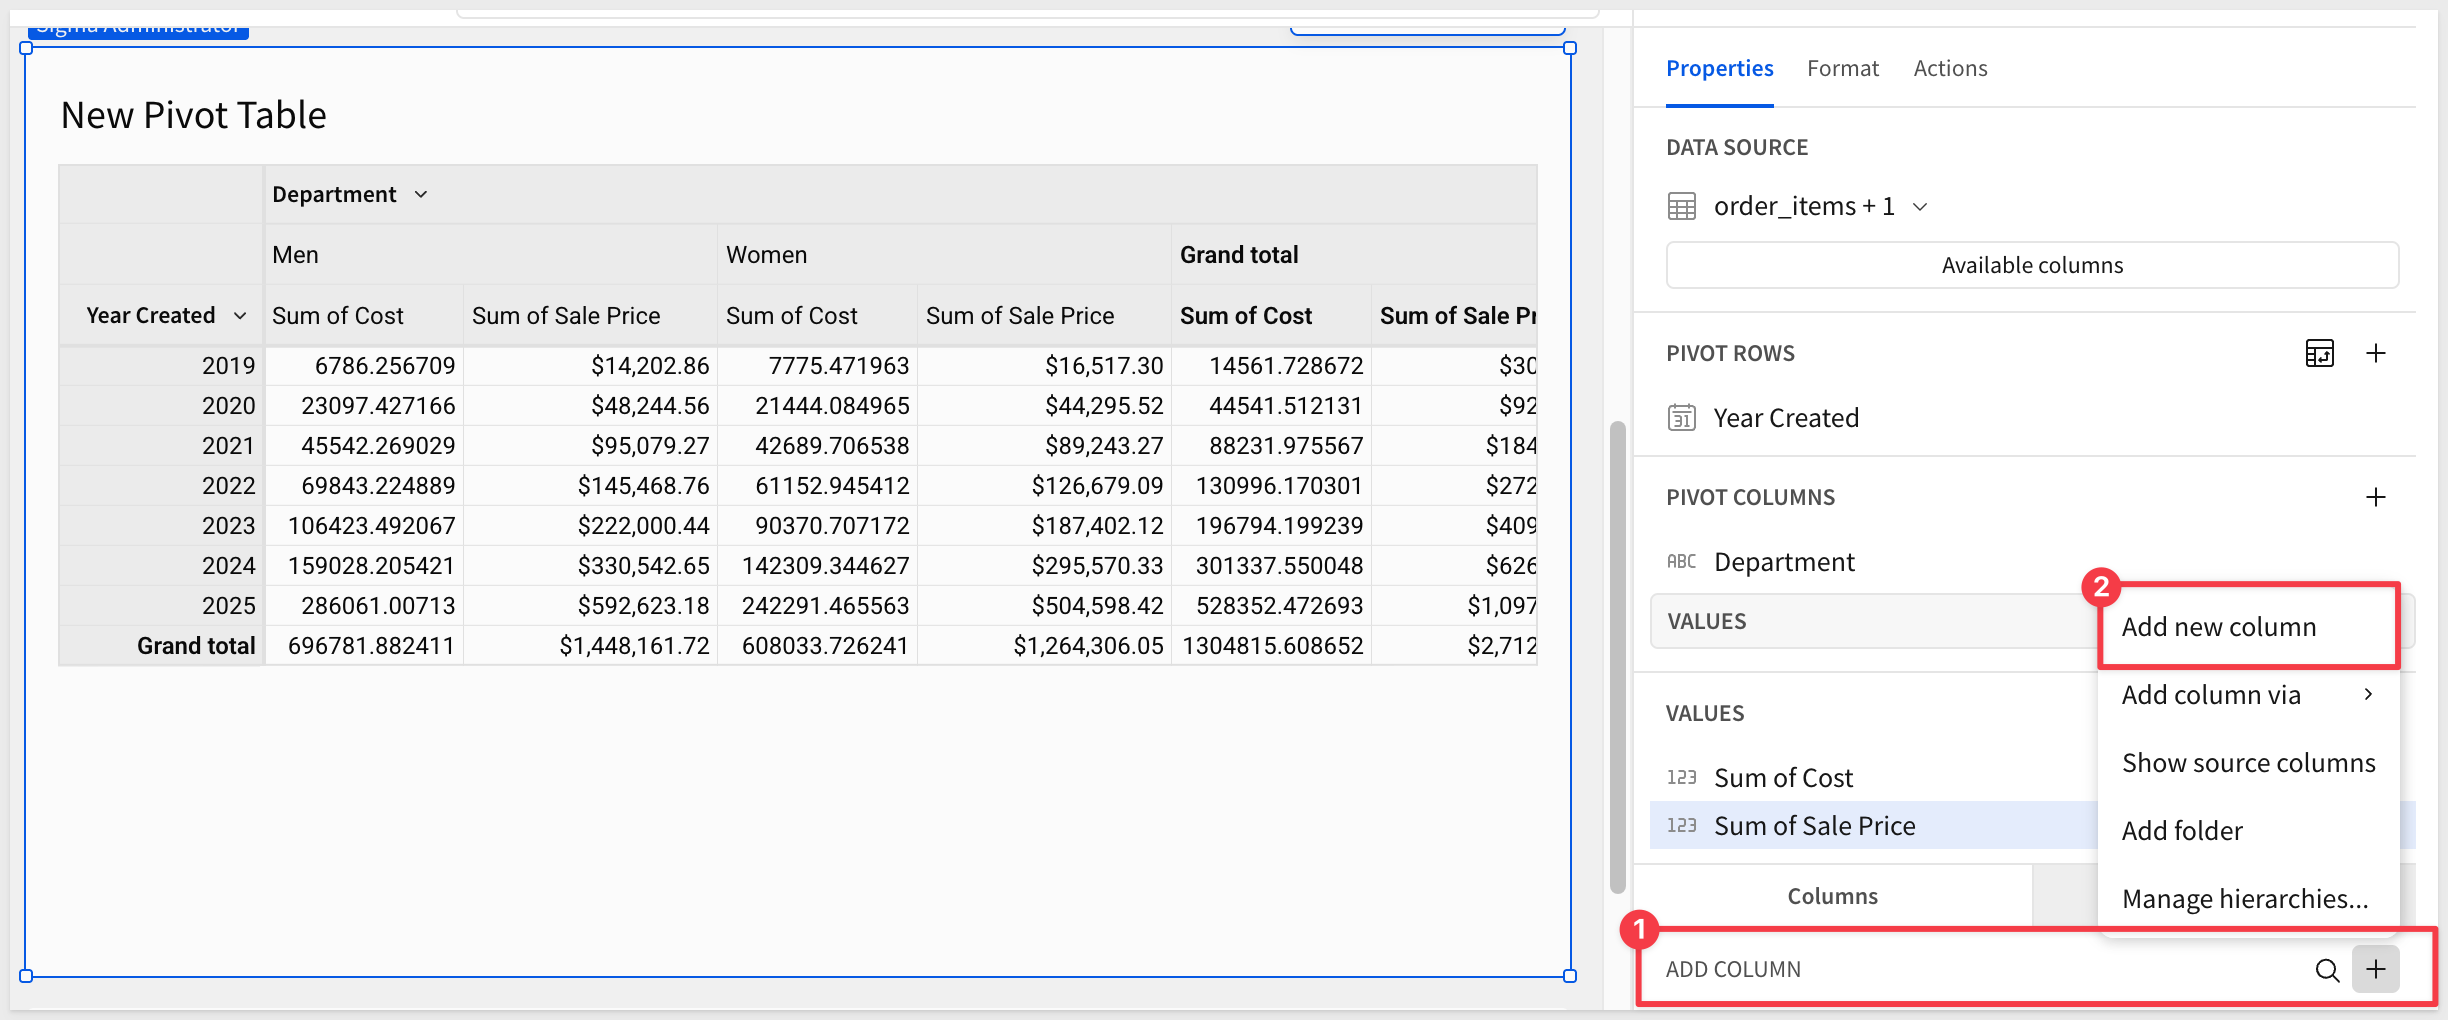
Add Year of Created to the Pivot Rows section.
Add Department (products) to the Pivot Columns section:
For data analysis, you can add aggregations in the Values section. Sigma enables data analysis across different cohorts.
In this example we'll simply add our Cost and Sale Price columns to the values section.
Create a new column within the pivot table called Profit by selecting the plus sign next to Values and clicking New Column:
Use the formula bar to set the formula for the new column to:
Sum([Sale Price]) - Sum([Cost])
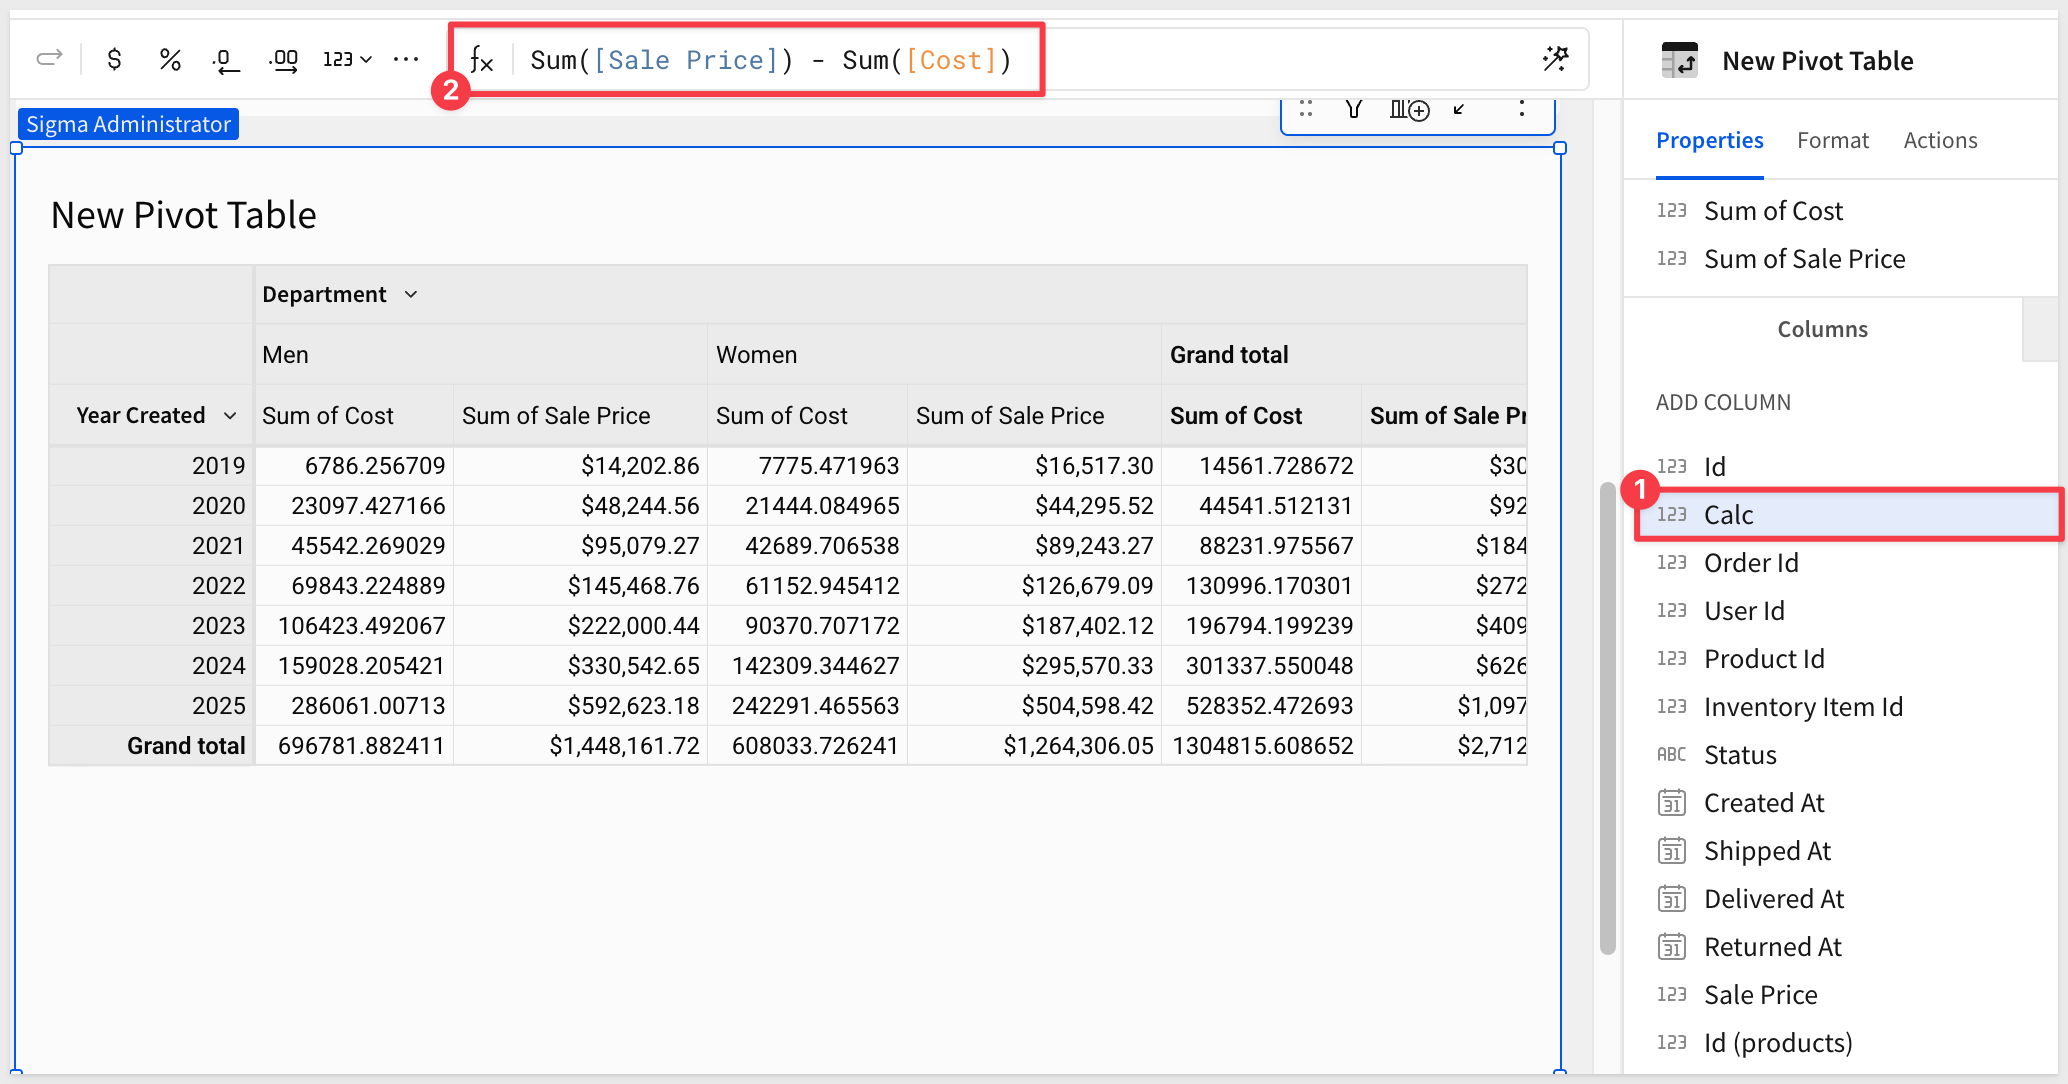
Double-click (or use the drop menu) to rename the new column from Calc to Profit.
Publish the workbook.
After some rearranging and renaming, the workbook might look like this:
In this QuickStart, you learned how to set up and connect Sigma to BigQuery. Connecting Sigma to BigQuery can provide significant benefits for data analysts and data teams looking to improve their data visualization and analytics capabilities. Using BigQuery as the underlying data warehouse provides a highly scalable and cost-effective solution for storing and querying large volumes of data.
Authored by
Additional Resource Links:
Be sure to check out all the latest developments at Sigma's First Friday Feature page!
Help Center Home
Sigma Community
Sigma Blog