Get oriented in Sigma — hands-on practice with the interface, workbooks, and core navigation for users starting from scratch.
The Fundamentals series covers a broad range of topics at an introductory level. Each QuickStart includes links to deeper resources — follow what's relevant to you.
If you're coming from another BI platform, these community resources may help you get up to speed faster:
Sigma Differences From Other BI Tools Overview For New Sigma Creators
I am a Dashboard Builder New to Sigma. How Can I Quickly Get Up To Speed?
Each QuickStart in the series uses sample data Sigma provides to all customers — sales data from our fictitious company Plugs Electronics.
For more information on Sigma's product release strategy, see Sigma product releases
If something isn't working as expected, here's how to contact Sigma support
About Sigma
Sigma is a front-end for your cloud data warehouse—an analytics platform for spreadsheets, interactive AI-enabled apps, and more. It centralizes your data, eliminates silos, and replaces fragmented tools for various use cases within a governed environment. Additionally, Sigma enables businesses to monetize their data through embedding Sigma in bespoke SaaS applications.
Many solutions exist, but Sigma stands out. Here's why:
Sigma is multi-modal, designed for users of all skill levels. Data engineers can write SQL, data scientists can use Python, and business users can work with spreadsheet functions. Want to build a complex app workflow? Sigma makes it easy.
It's also the only platform that lets users securely write back data—updating rows or columns without overwriting the warehouse.
Sigma is built for collaboration, allowing teams to work together in real time on live data.
For developers embedding Sigma in a larger platform, every feature is available—no need to manually code elements.
With full feature parity and no coding required, Sigma is a strong choice for teams building embedded analytics.
Many customers are already using Sigma to replace existing, purpose-built SaaS applications.
Target Audience
This QuickStart is designed for new Sigma users across three roles:
- Users — analysts or report consumers who want to query and explore data, with or without AI
- Builders — developers or analysts creating workbooks, dashboards, and apps
- Admins — administrators evaluating Sigma's governance, licensing, and operational capabilities
How QuickStarts are organized
The Sigma QuickStarts library contains over 100 guides organized into categories — Fundamentals, AI Apps, Administration, Embedding, and more. You don't need to complete them all. Use the categories to find what's relevant to your role and goals.
The Fundamentals series (this one included) is the recommended starting point for anyone new to Sigma. It covers the core concepts and capabilities at an introductory level, with links to deeper resources along the way.
After completing this QuickStart, here are suggested paths based on your role:
Users — analysts, report consumers, and anyone exploring data:
- Fundamentals 2: Working with Data
- Fundamentals 3: Pivot Tables
- Fundamentals 5: Charts
- Fundamentals 6: Controls
Builders — developers and analysts creating workbooks, apps, and models:
- All of the above, plus:
- AI Apps Category
- Pixel Perfect Reporting
- Input Tables
- Input Tables: Use Cases
- Design Elements (UI & Layout)
- Beyond the Basics
- Data Modeling
Admins — administrators managing users, connections, and governance:
Developers — engineers building embedded analytics or integrating Sigma via API:
Prerequisites
- A computer with a current browser.
- Access to a Sigma environment. A Sigma trial is acceptable and preferred for this series.
What You'll Learn
- How to set up a Sigma trial and navigate the user interface
- Key Sigma terminology and how workbooks, pages, and elements relate to each other
- How to create, save, and share a workbook
- How to use Sigma Assistant for AI-powered analysis, and how it can plan and build dashboards and apps for you
- How to organize content with pages, containers, modals, and other layout elements
- How account types and scheduled exports work

If you don't have a Sigma account yet, sign up for a free trial to follow along with QuickStarts.
Once on the trial setup page fill out the form and click Start Trial:
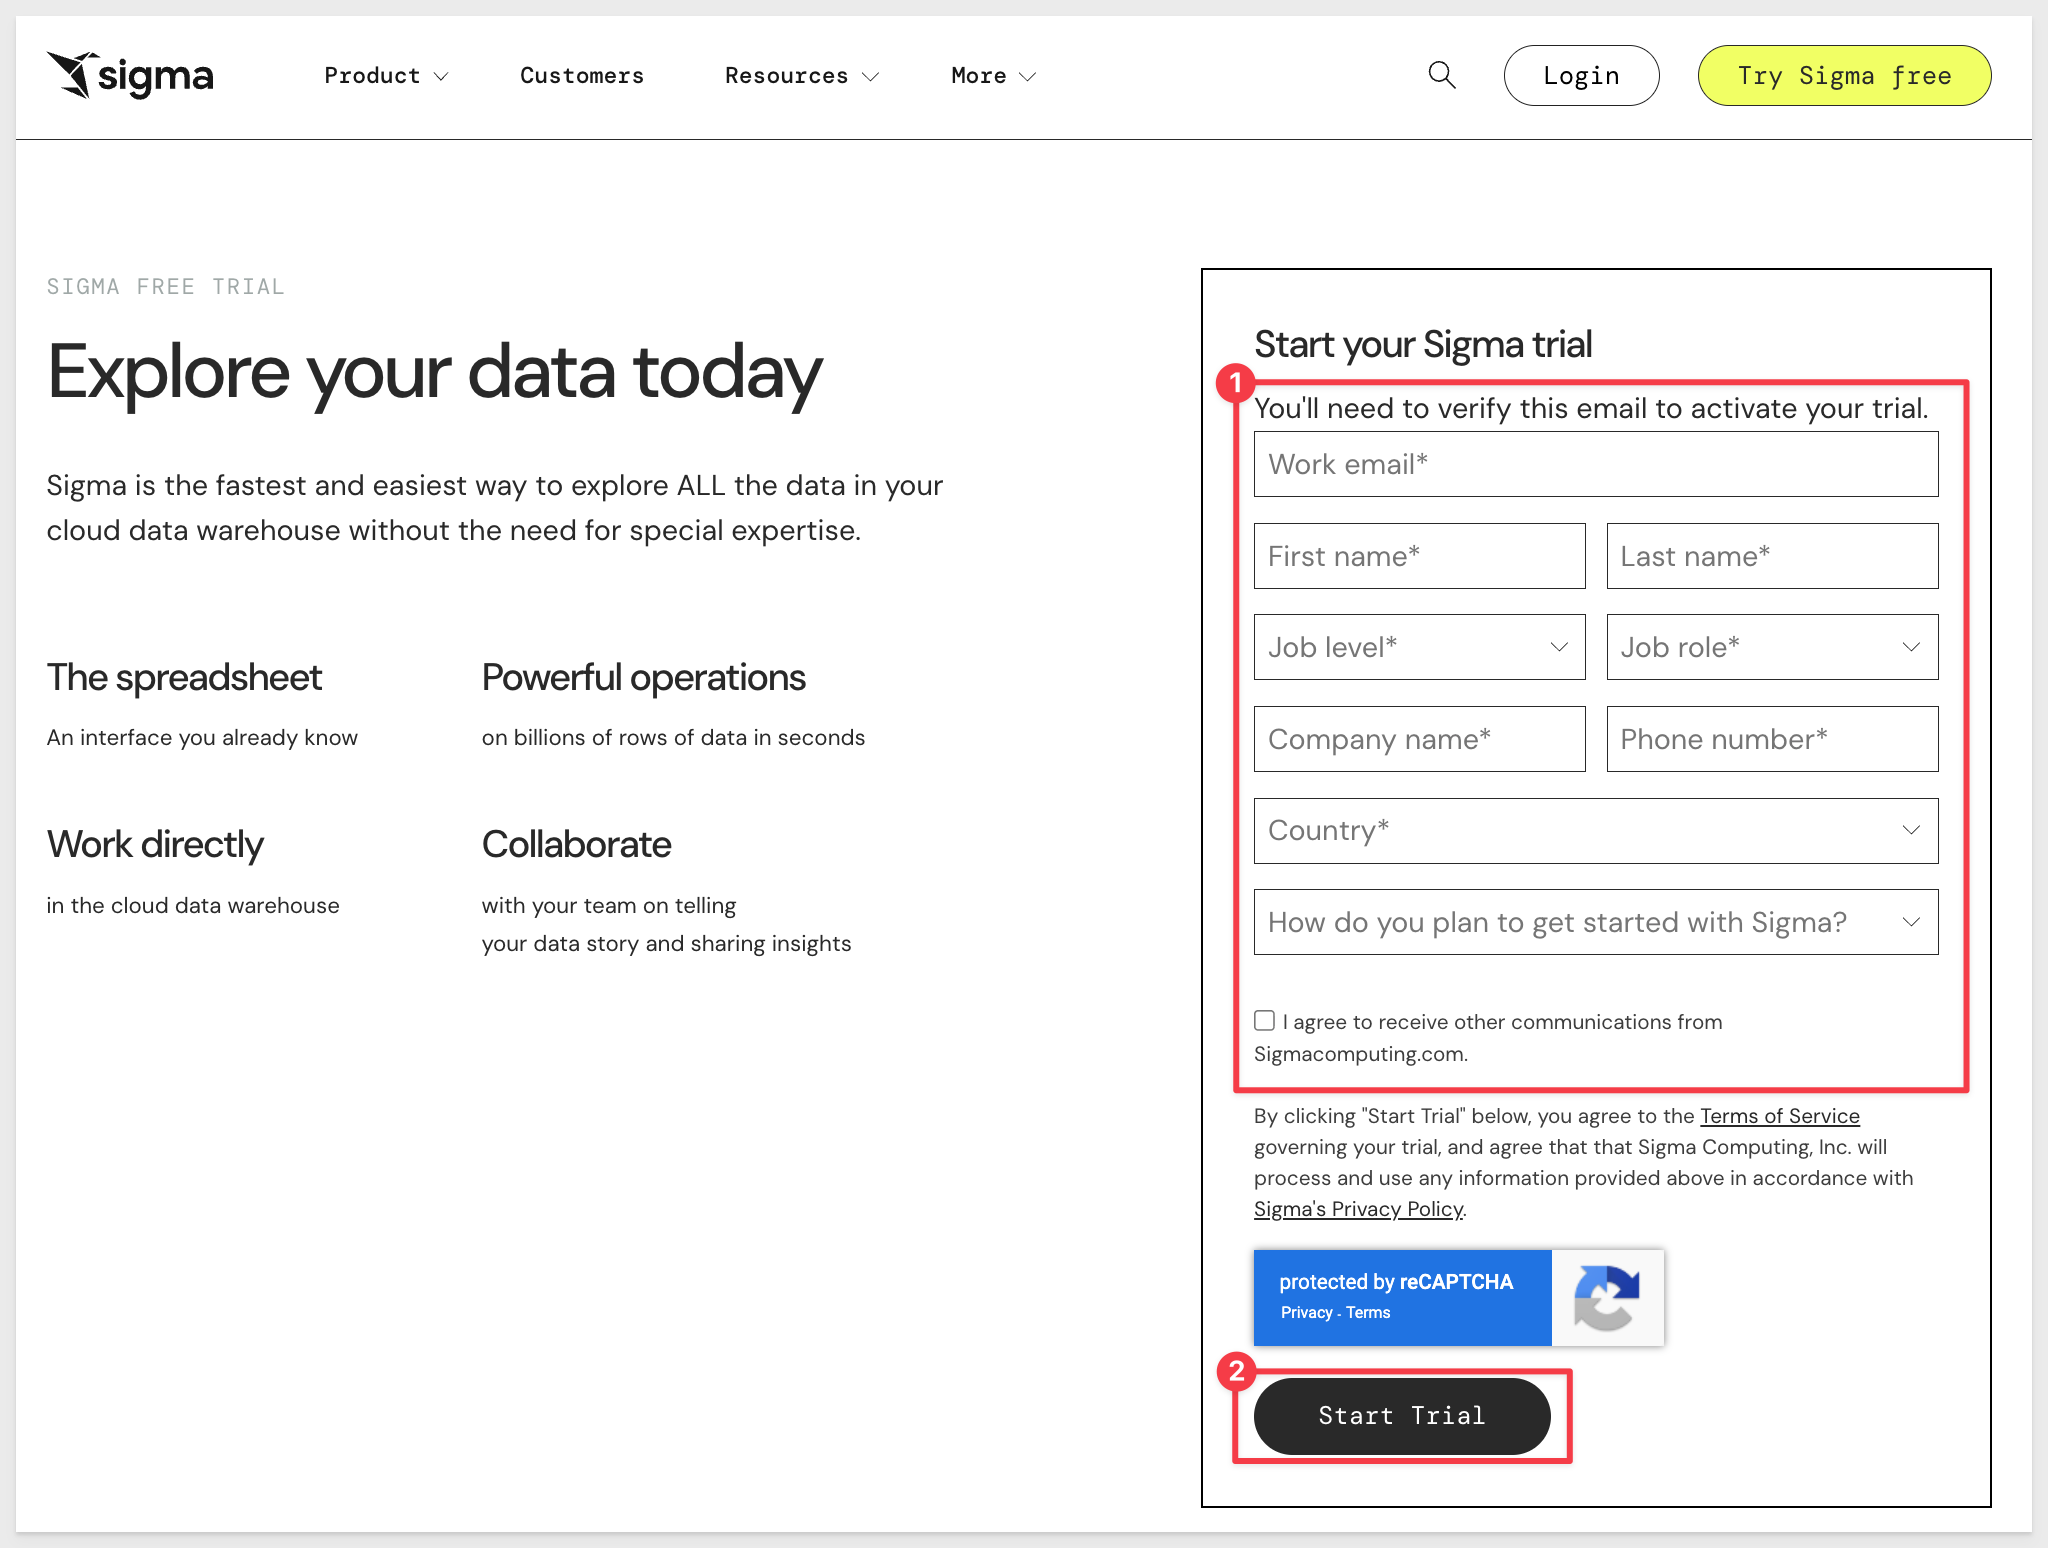
Fill out the form, click Start Trial and confirm the CAPTCHA.
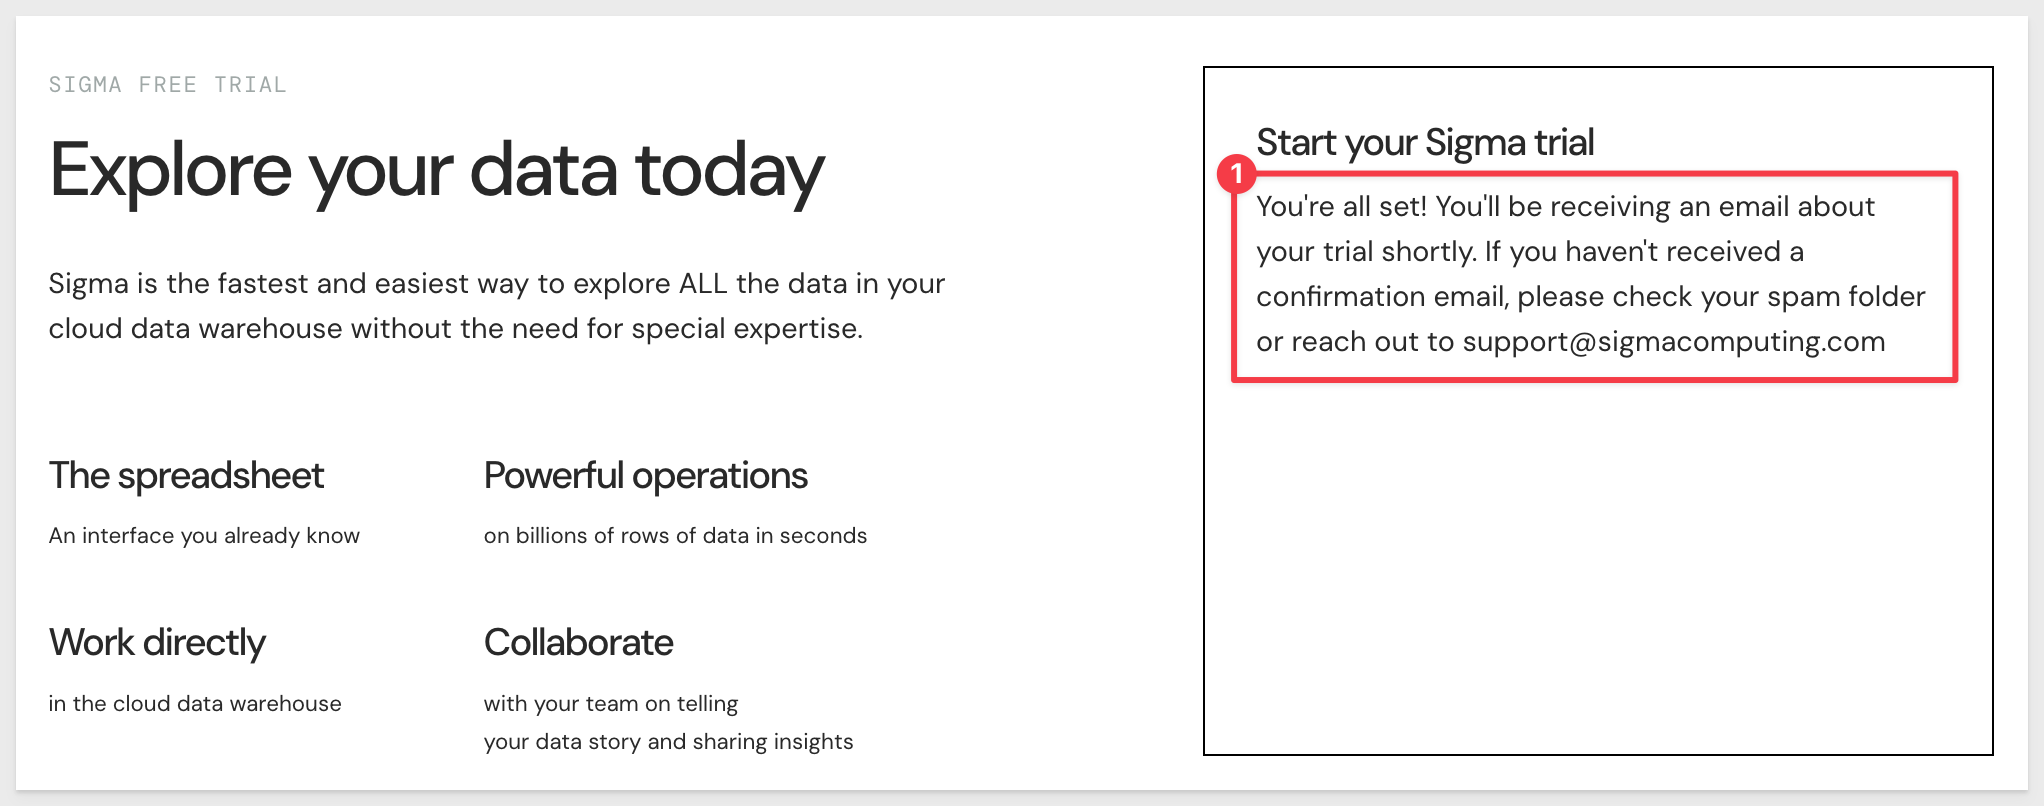
You will receive notice that Sigma is sending an email invitation:
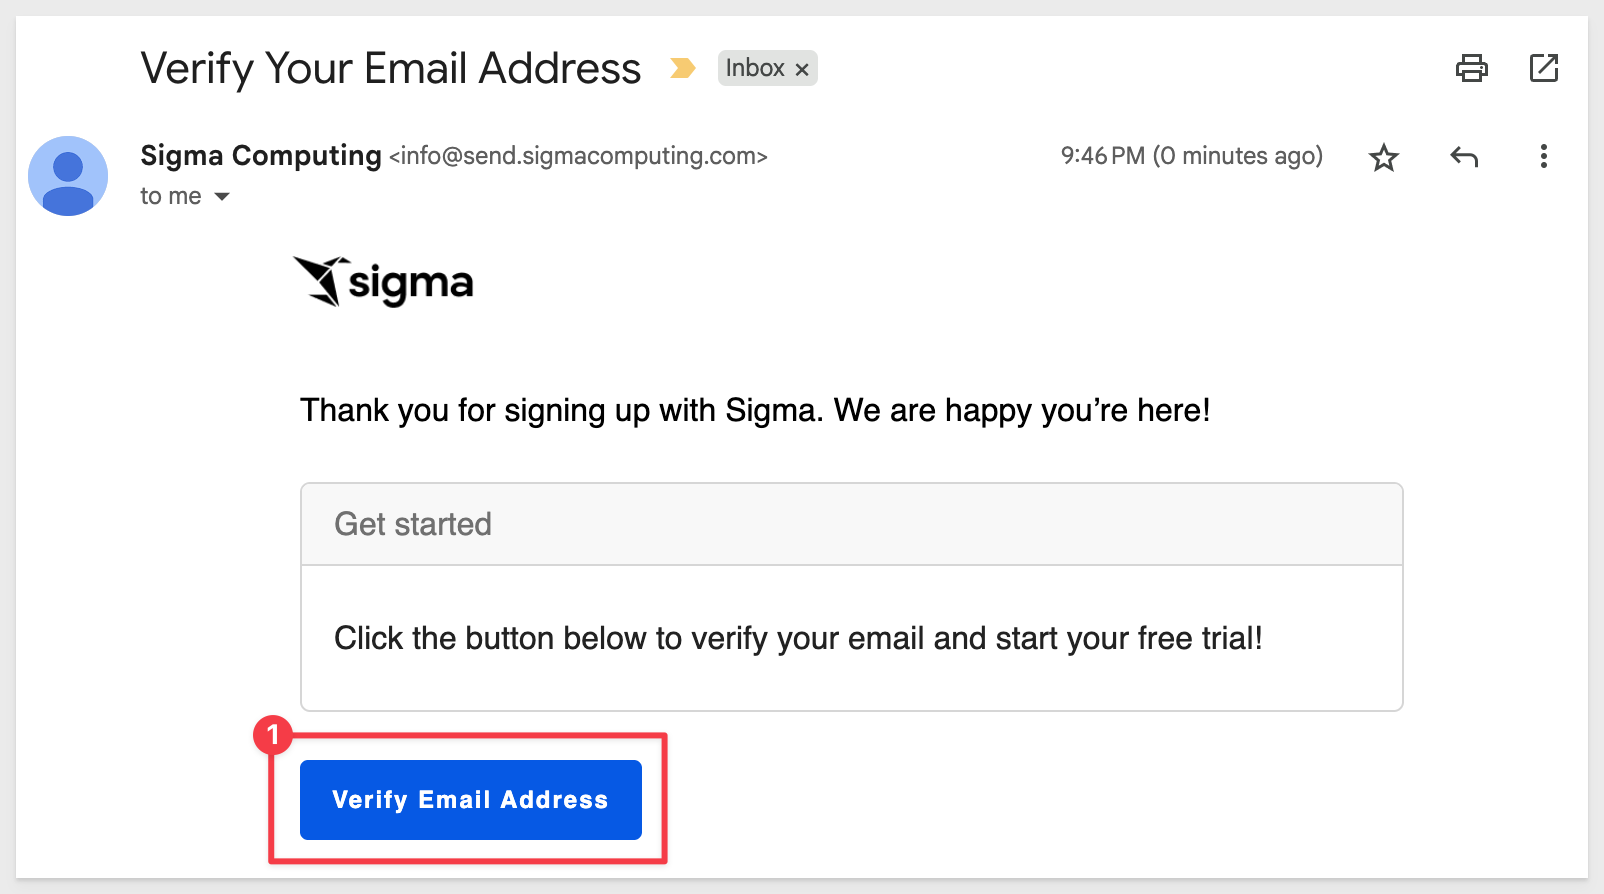
In your email application, open the email from Sigma and click Verify Email Address:
When the page loads in your default browser, enter in your Company Name and Company Login URL (if you prefer something different)
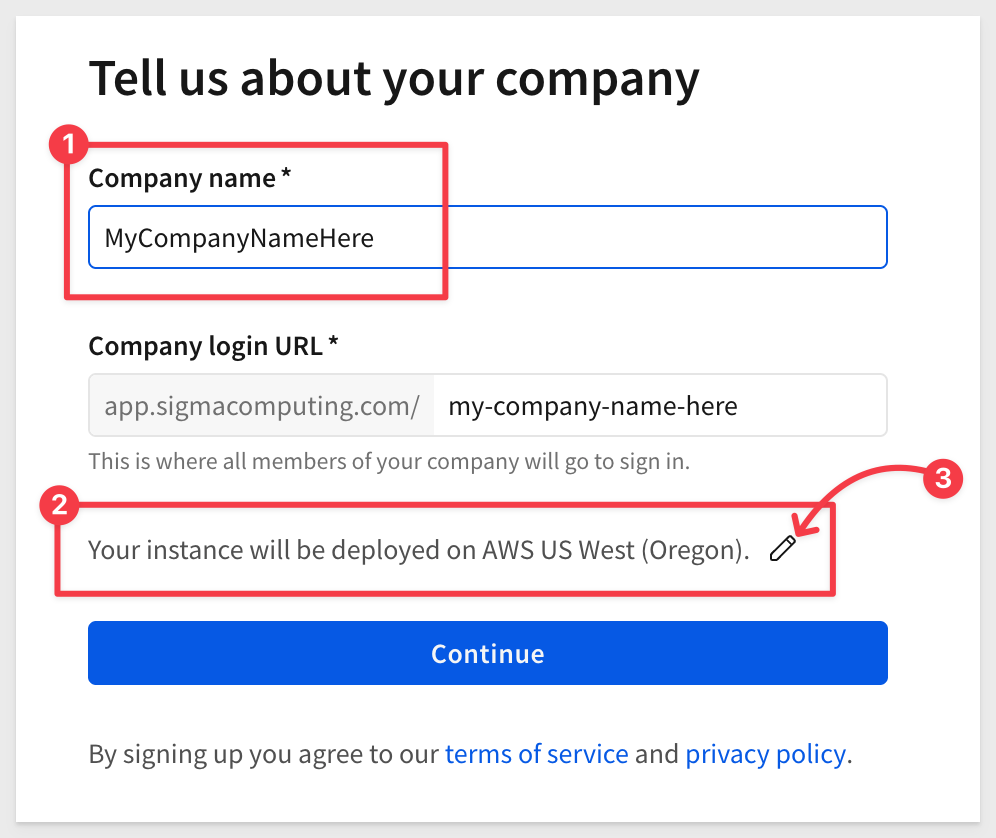
Sigma will pre-select a cloud location where the trial will be created. If location matters for your testing, click the pencil icon to select a different location.
For example, if you are in Europe you may want to select Frankfurt:
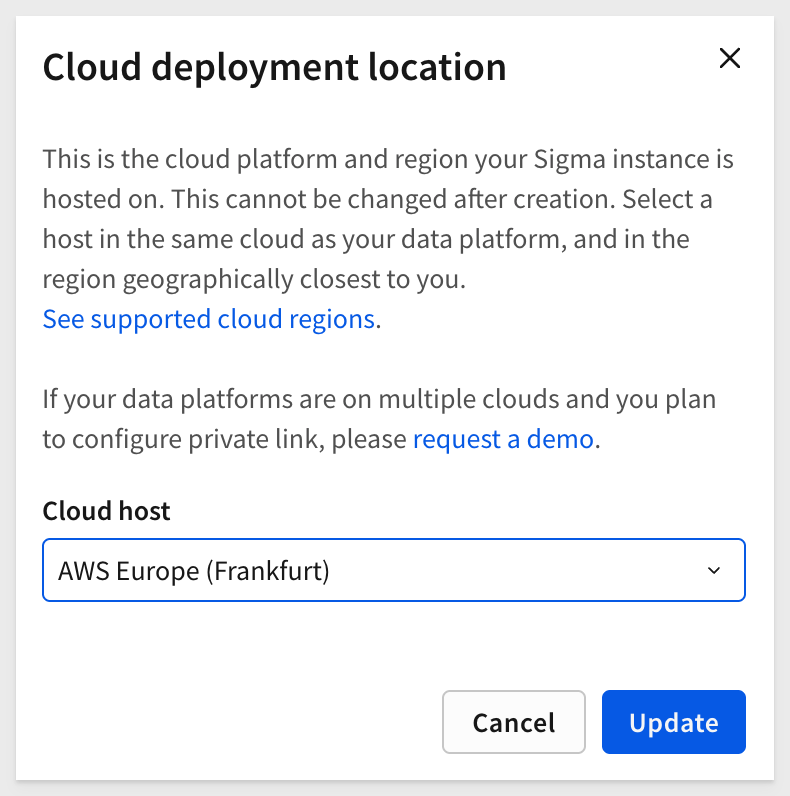
For more information, see Supported regions, data platforms, and features
Click the Update and then the Continue button:
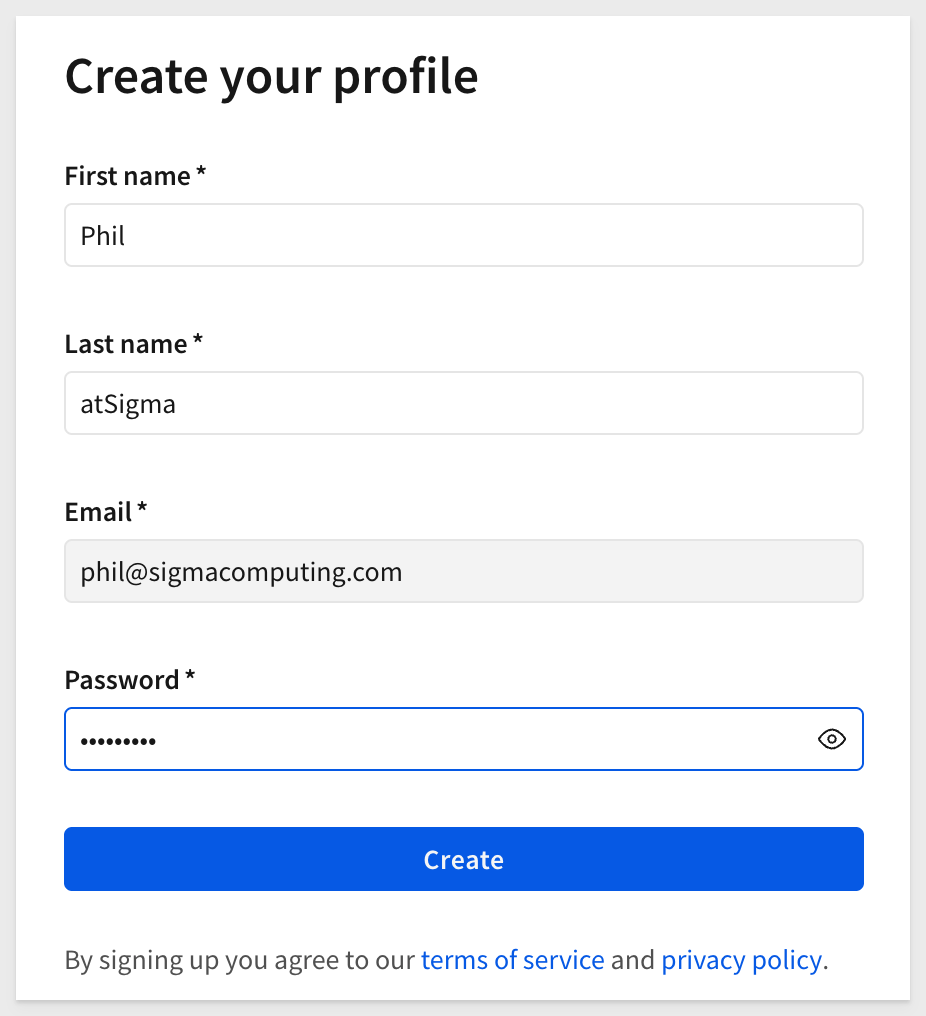
Next create your user profile and click the Create button:
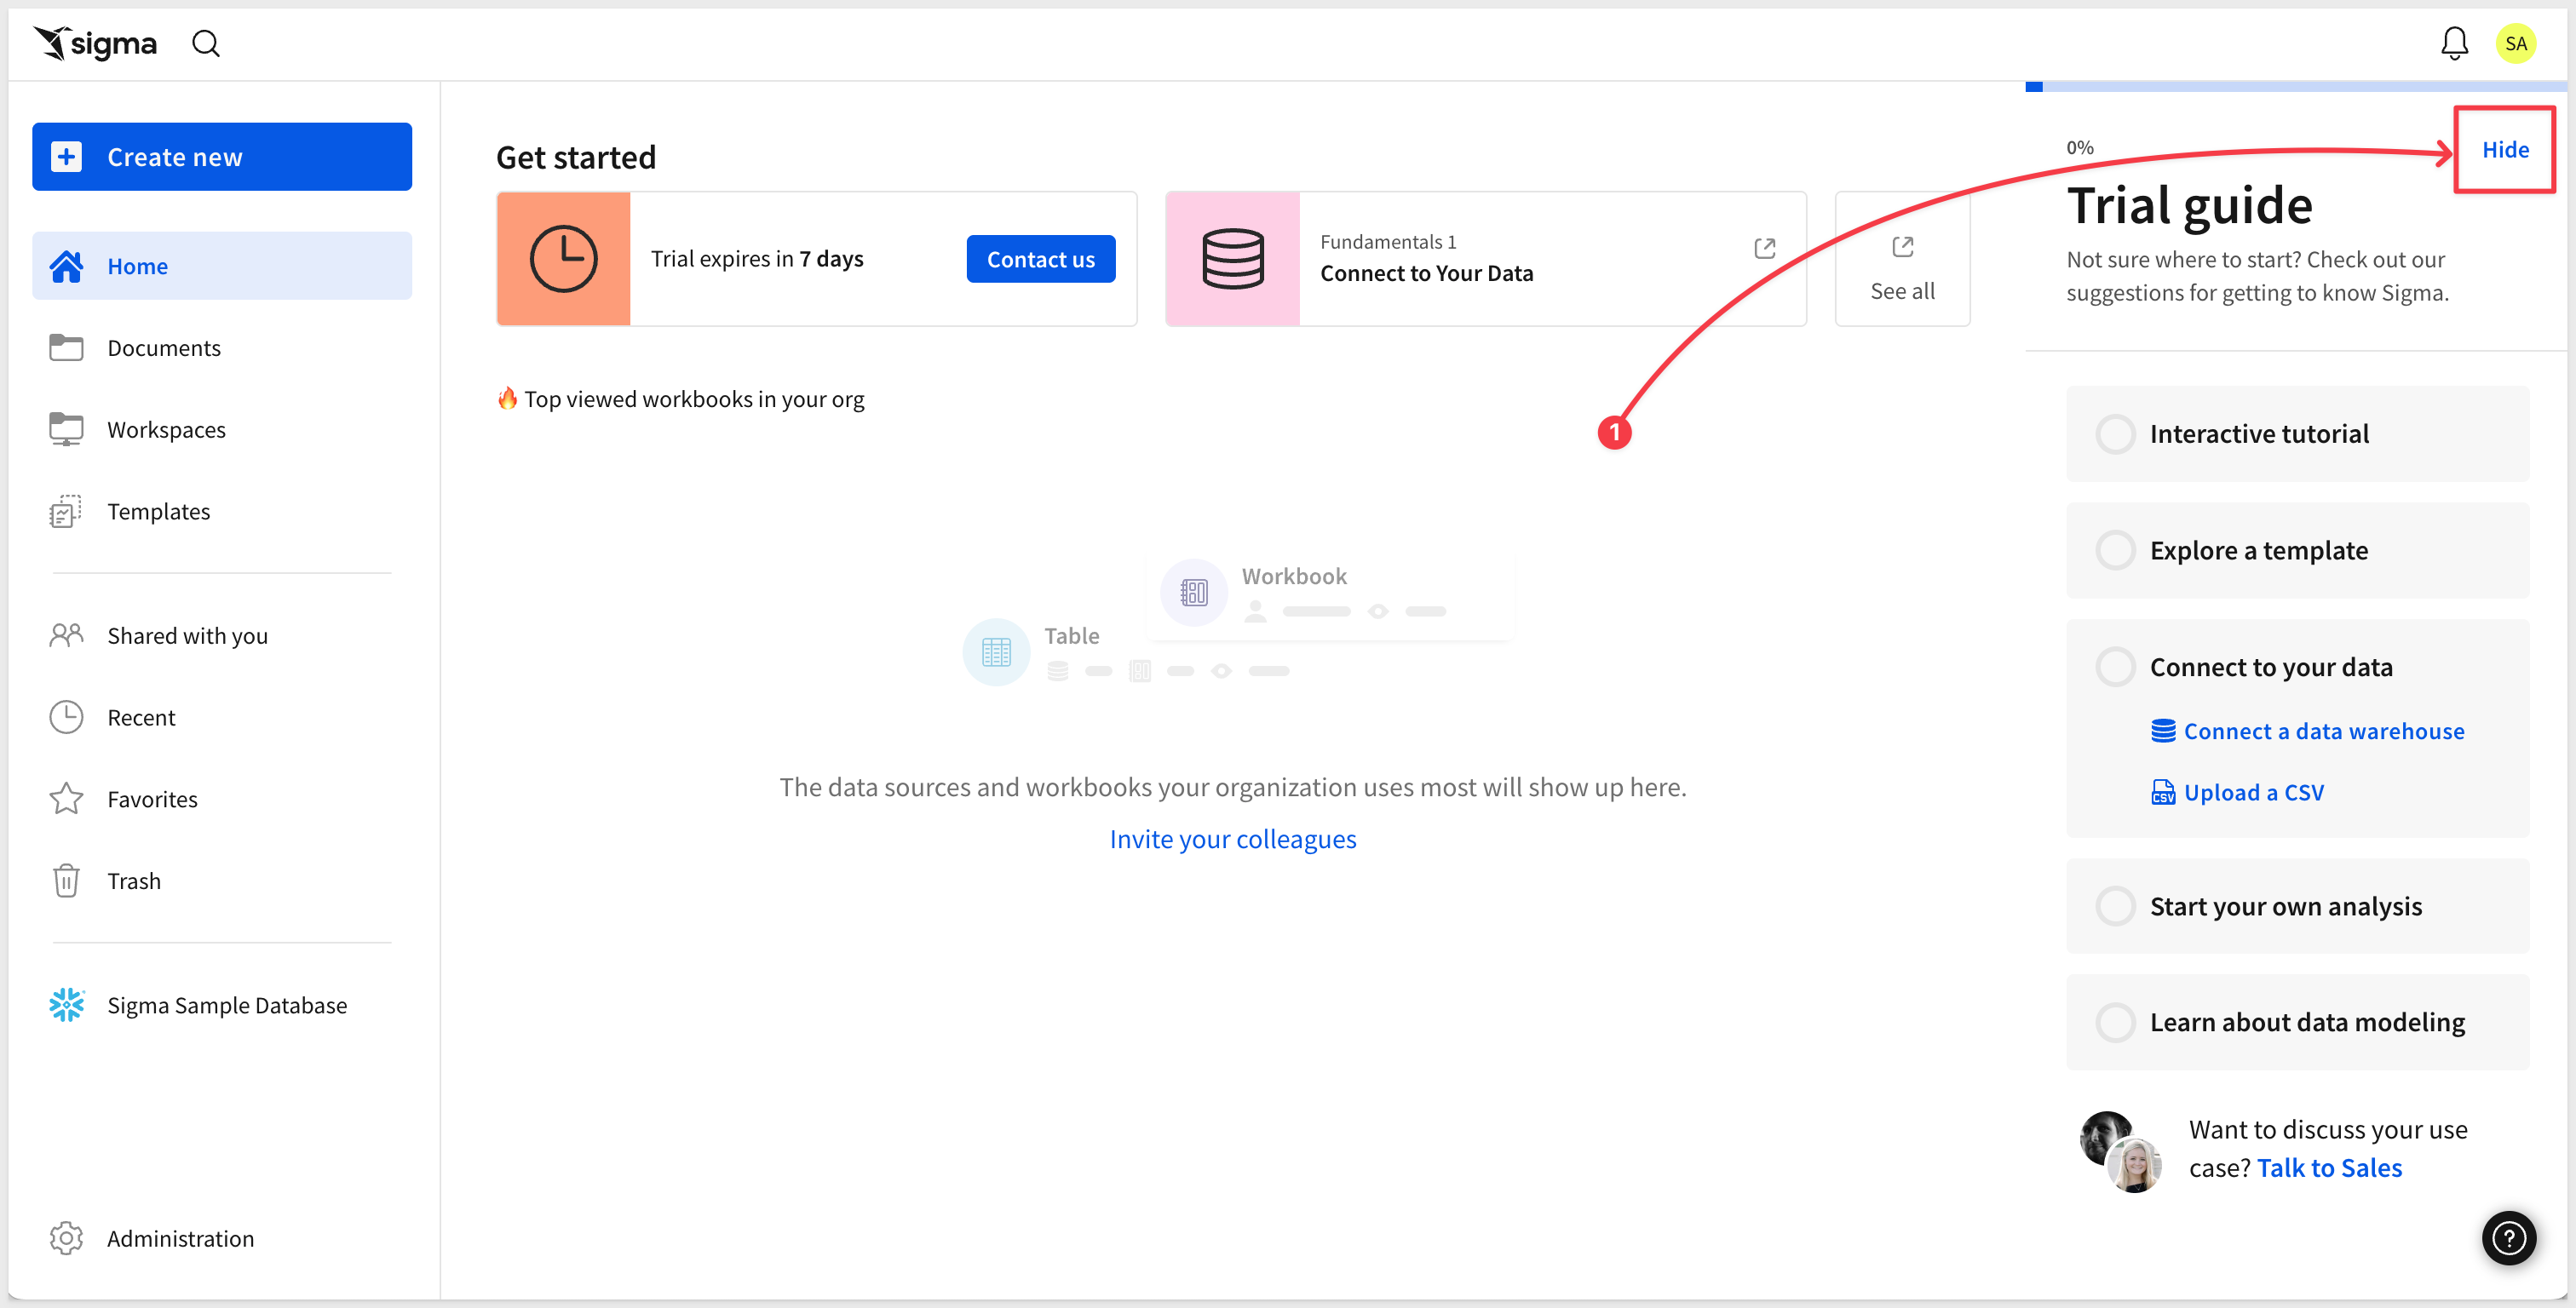
You are placed in Sigma and there is a Trial guide to explore too.
Click Hide to close the trial guide:
You should also receive a welcome email from Sigma:
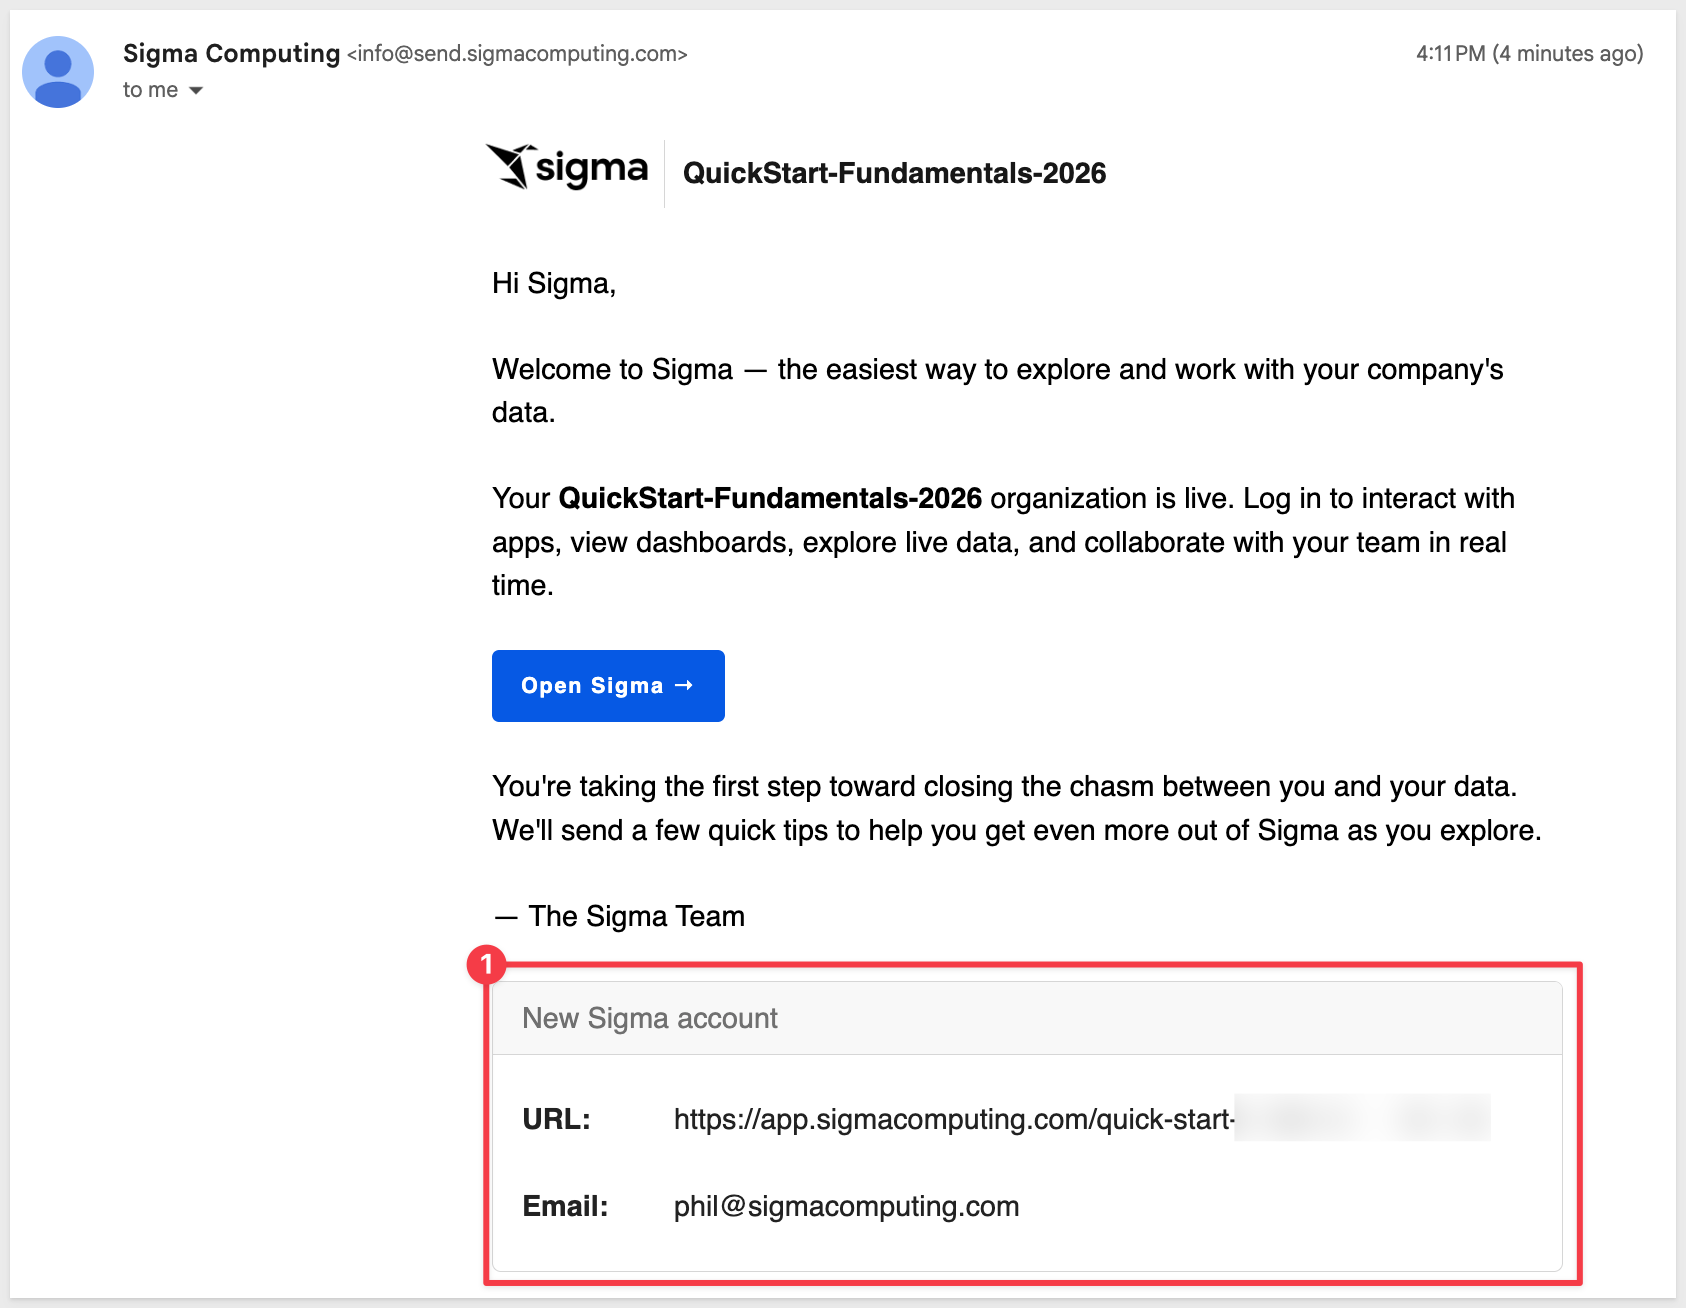
If something is not working as you expect, here is how to contact Sigma support
The Sigma homepage provides quick access to everything you need to get started.
The main areas are numbered and described below:
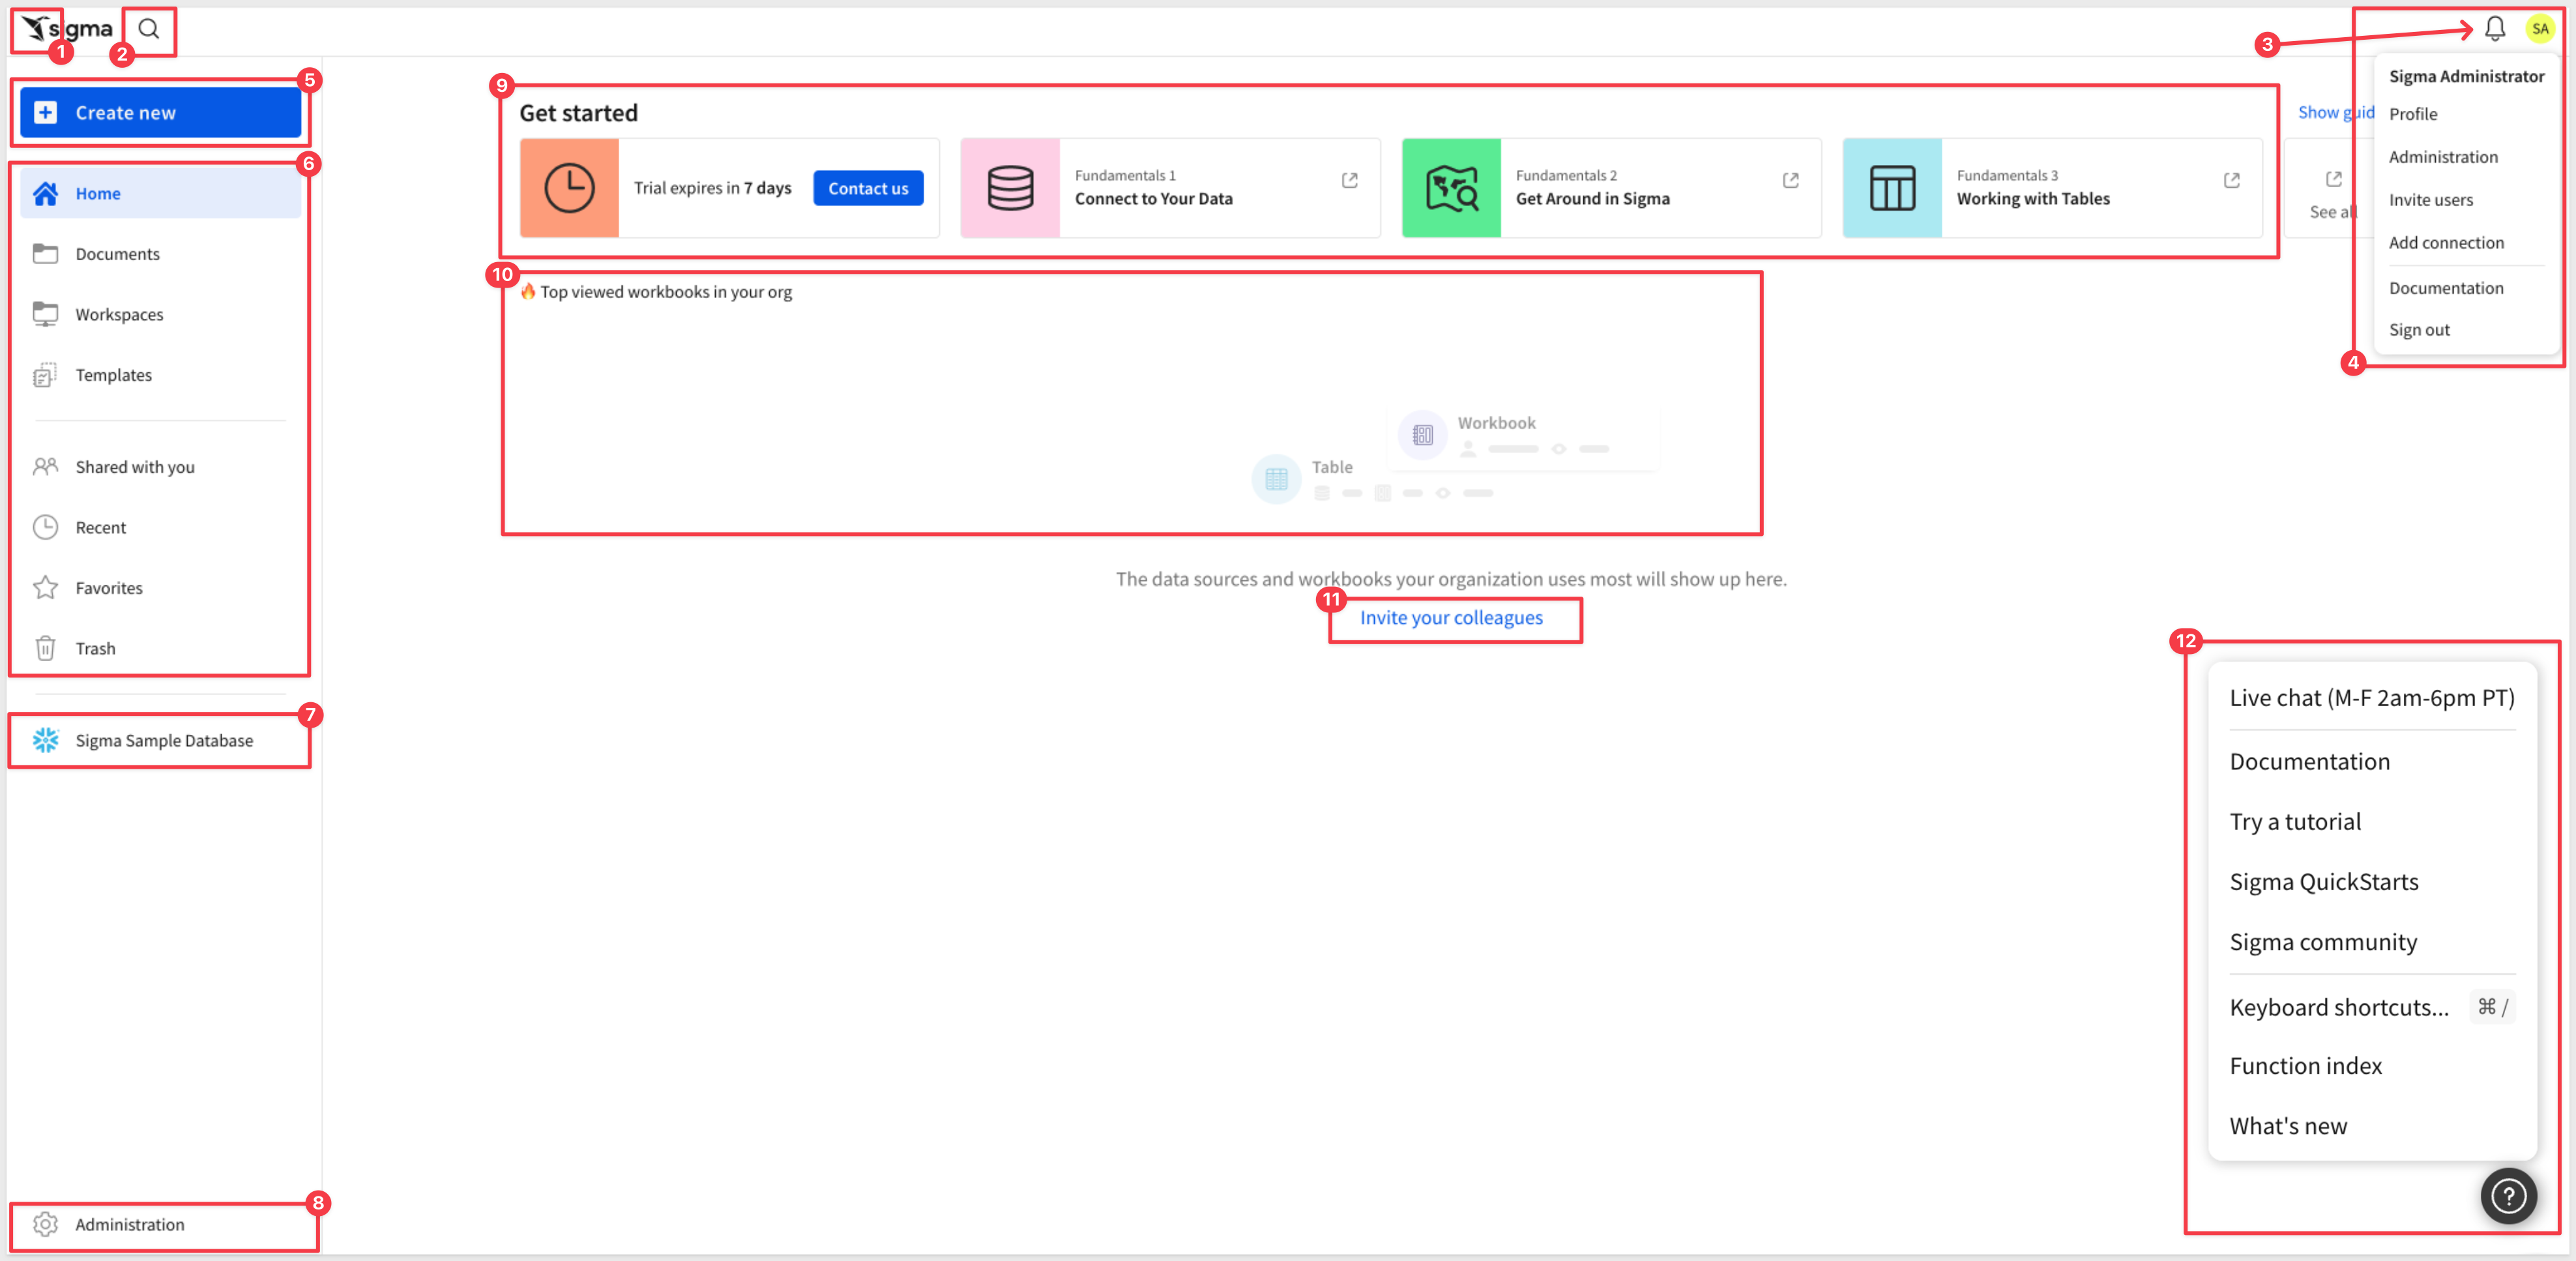
Top bar
 Sigma Logo: Click the Sigma logo in the upper left to return to the homepage from anywhere in the portal.
 Search: Click the search icon to find content across your Sigma environment.
 Notifications: The bell icon shows alerts and activity relevant to your account.
 User Profile: Click your initials in the upper right to access your profile, preferences, sign-out, and other options.
Left sidebar
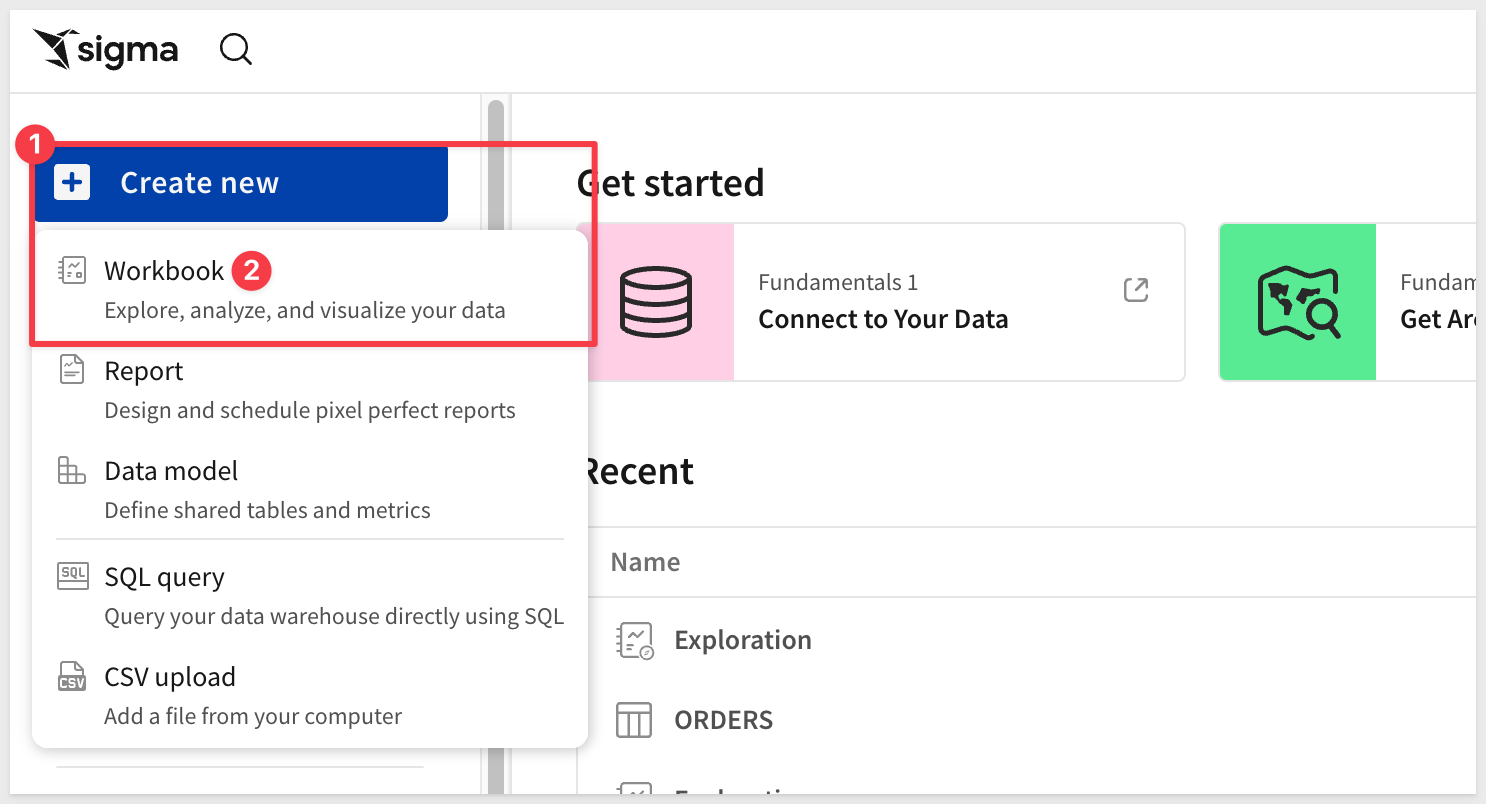
 Create New: The blue button at the top of the sidebar is your starting point for any new content:
- Workbook: The primary interface for users and builders to view and interact with data and apps.
- Report: A document type designed to help you create predictable, pixel-perfect PDF exports.
- Data Model: A reusable data layer shared across workbooks and reports.
- SQL Query: Write and run SQL directly against your connected warehouse.
- CSV Upload: Upload a CSV file to the warehouse for analysis.
 Navigation:
- Home: Returns to the homepage.
- Documents: Your personal folder for content you've created.
- Workspaces: Shared folders for organizing and sharing content with specific teams or members.
- Templates: Pre-built, ready-to-use content including Starter Apps — fully working apps built on sample data that cover common business workflows you can explore and connect to your own data.
- Shared with you: Content others have shared with you directly.
- Recent: Content you've accessed recently.
- Favorites: Content you've marked as a favorite for quick access.
- Trash: Deleted content, recoverable before permanent removal.
 Connections: Lists available data warehouse connections. Clicking one shows the tables and schemas you have access to. Connections are configured by administrators in the Administration section. Initially, only the
 Sigma Sample Database will be shown. This is hosted by Sigma and can be disabled by an administrator if preferred.
 Administration: Available to administrators only. Provides access to user management, connections, account settings, and more.
Main content area
 Get Started: When you first log in, this section shows trial status and recommended help documents (these are not QuickStarts but rather help docs) to help you orient quickly. Use the
 Show guide link in the upper right of this area to toggle it on or off.
 Top Viewed: As your team creates and uses content, the most-accessed workbooks will appear here. It will be empty at the start as there has been no activity yet.
 Invite your colleagues: Provides a quick method for adding users to your account. This is a configurable convenience; users in Sigma can be managed in the administration section or externally via any SAML 2.0 compatible identity management provider (e.g., Okta, Auth0)
 Help: The help button in the lower right corner provides access to documentation, release notes, and live chat support.
If you ever need to know what is new in Sigma, there are two resources:
We also publish a monthly summary on the "First Friday" of each month, covering everything released in the prior month, including bug fixes.
Before diving in, it helps to understand some of the core terms Sigma uses.
The diagram below shows how the key concepts relate to each other at a high level.
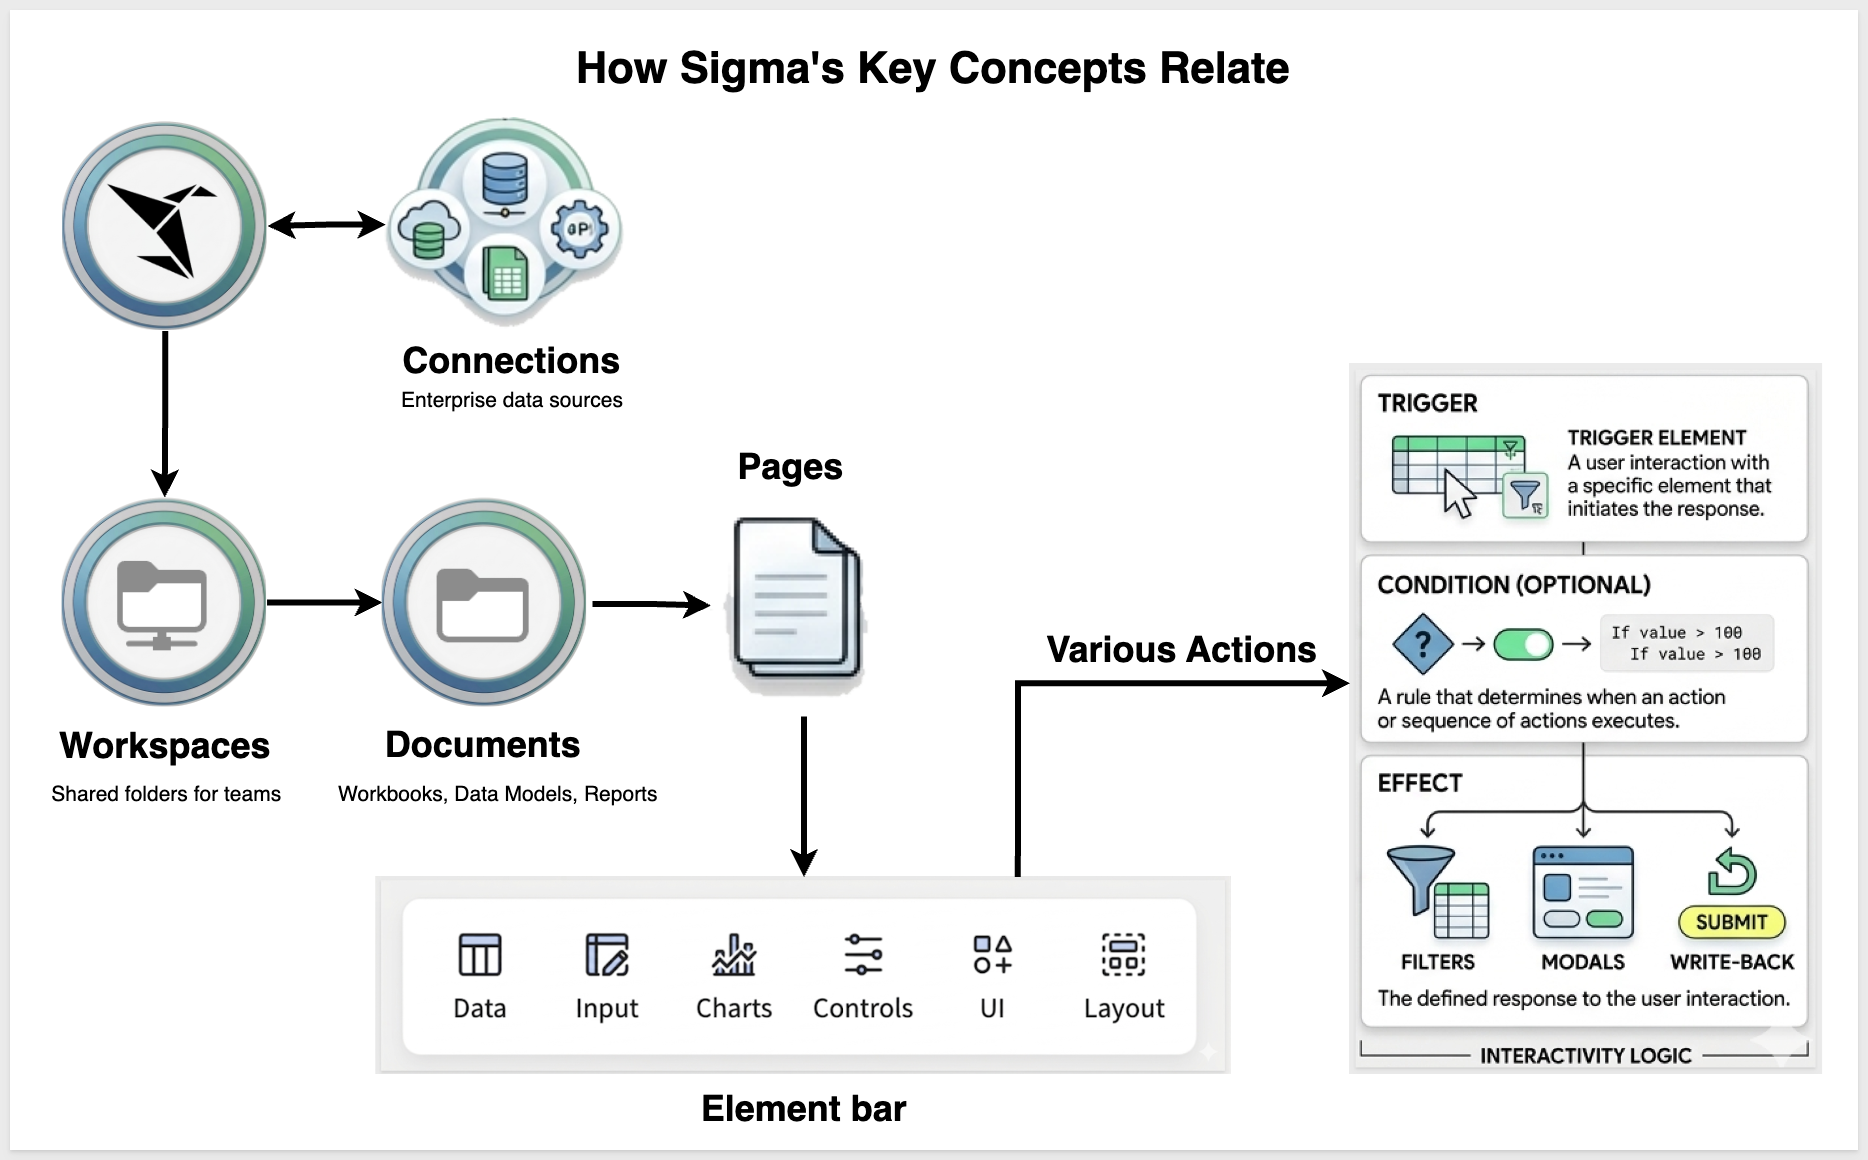
Sigma connects to your data through Connections, organizes content in Workspaces, and everything you build lives in a Document — a workbook, report, or data model. Workbooks contain Pages, and pages are built from Elements — tables, charts, controls, and more. Actions wire those elements together, turning a static workbook into an interactive app.
The following sections describe each of these core terms in more detail.
Document Types
- Document: The general term for any content item in Sigma — workbooks, reports, and data models are all documents.
- Workbook: Sigma's primary document type. A workbook can contain data tables, charts, controls, and apps — all on one or more pages.
- Report: A fixed-layout document optimized for pixel-perfect PDF exports.
- Data Model: A reusable data layer that defines shared tables, columns, and calculations for use across workbooks and reports.
Workbook Lifecycle
- Exploration: An unsaved, ad hoc workbook. Explorations let you query and analyze data without cluttering your folders. Save only when the work is worth keeping.
- Draft / Published: Once saved, a workbook exists in two states — a draft (work in progress, visible only to editors) and a published version (the stable version visible to viewers).
Workbook Structure
- Page: Each workbook contains one or more pages, similar to tabs in a spreadsheet.
- Element: The building block of any workbook page. Every table, chart, control, input table, image, or text block is an element.
Element Types
- Table: A spreadsheet-like data element displaying rows and columns from your connected data source.
- Chart: A visual data element such as a bar chart, line chart, scatter plot, or map.
- Input Table: A data entry element that allows users to add or edit data directly in Sigma.
- Control: An interactive element — such as a date picker, dropdown, or text input — used to filter or drive other elements on the page.
- Container: A layout element that groups other elements together on a page. Useful for visual organization and building app interactions.
- Modal: A hidden workbook page that appears as an overlay when triggered by a user action.
Actions
- Actions: Interactions configured on elements that trigger a response elsewhere in the workbook — such as filtering a chart, opening a modal, or writing data back to the warehouse. Actions are what transform a workbook from a static report into an app.
Data & Connections
- Connection: A configured link between Sigma and a cloud data warehouse. Connections are set up by administrators and determine what data is available.
Organization & Access
- Workspace: A shared folder for organizing and collaborating on documents with specific teams or members.
- Account Type: Determines what a user can see and do in Sigma — such as whether they can create workbooks, edit data, or access administration features.
AI
- Sigma Assistant: Sigma's built-in AI assistant. Ask questions in plain language, generate formulas, summarize data, and more — directly inside a workbook.
- Sigma agent: A workbook-scoped AI agent that follows custom instructions, uses selected workbook data sources for context, and can call tools — such as actions, warehouse agents, warehouse search services, or MCP servers — to take action or enrich its answers.
- Chat element: The on-canvas UI that connects to a Sigma agent, letting end users chat with the agent in natural language inside a published workbook.
There are different icons used throughout Sigma to distinguish document types and objects at a glance.
AI is built into Sigma throughout — not as a separate product or add-on, but as a native capability available where you already work. Whether you're writing formulas, exploring data, or building apps, AI is there to help.
AI provider setup
Before any AI feature can be used, an administrator must configure an AI provider. Sigma supports two approaches:
- Warehouse-hosted models — AI runs entirely within your data platform (for example, Snowflake Cortex or BigQuery ML), so your data never leaves your environment.
- External AI providers — OpenAI ChatGPT, Azure OpenAI, Google Gemini, Amazon Bedrock and others.
For example, we configured Snowflake as our Data warehouse provider in Administration > AI Settings:
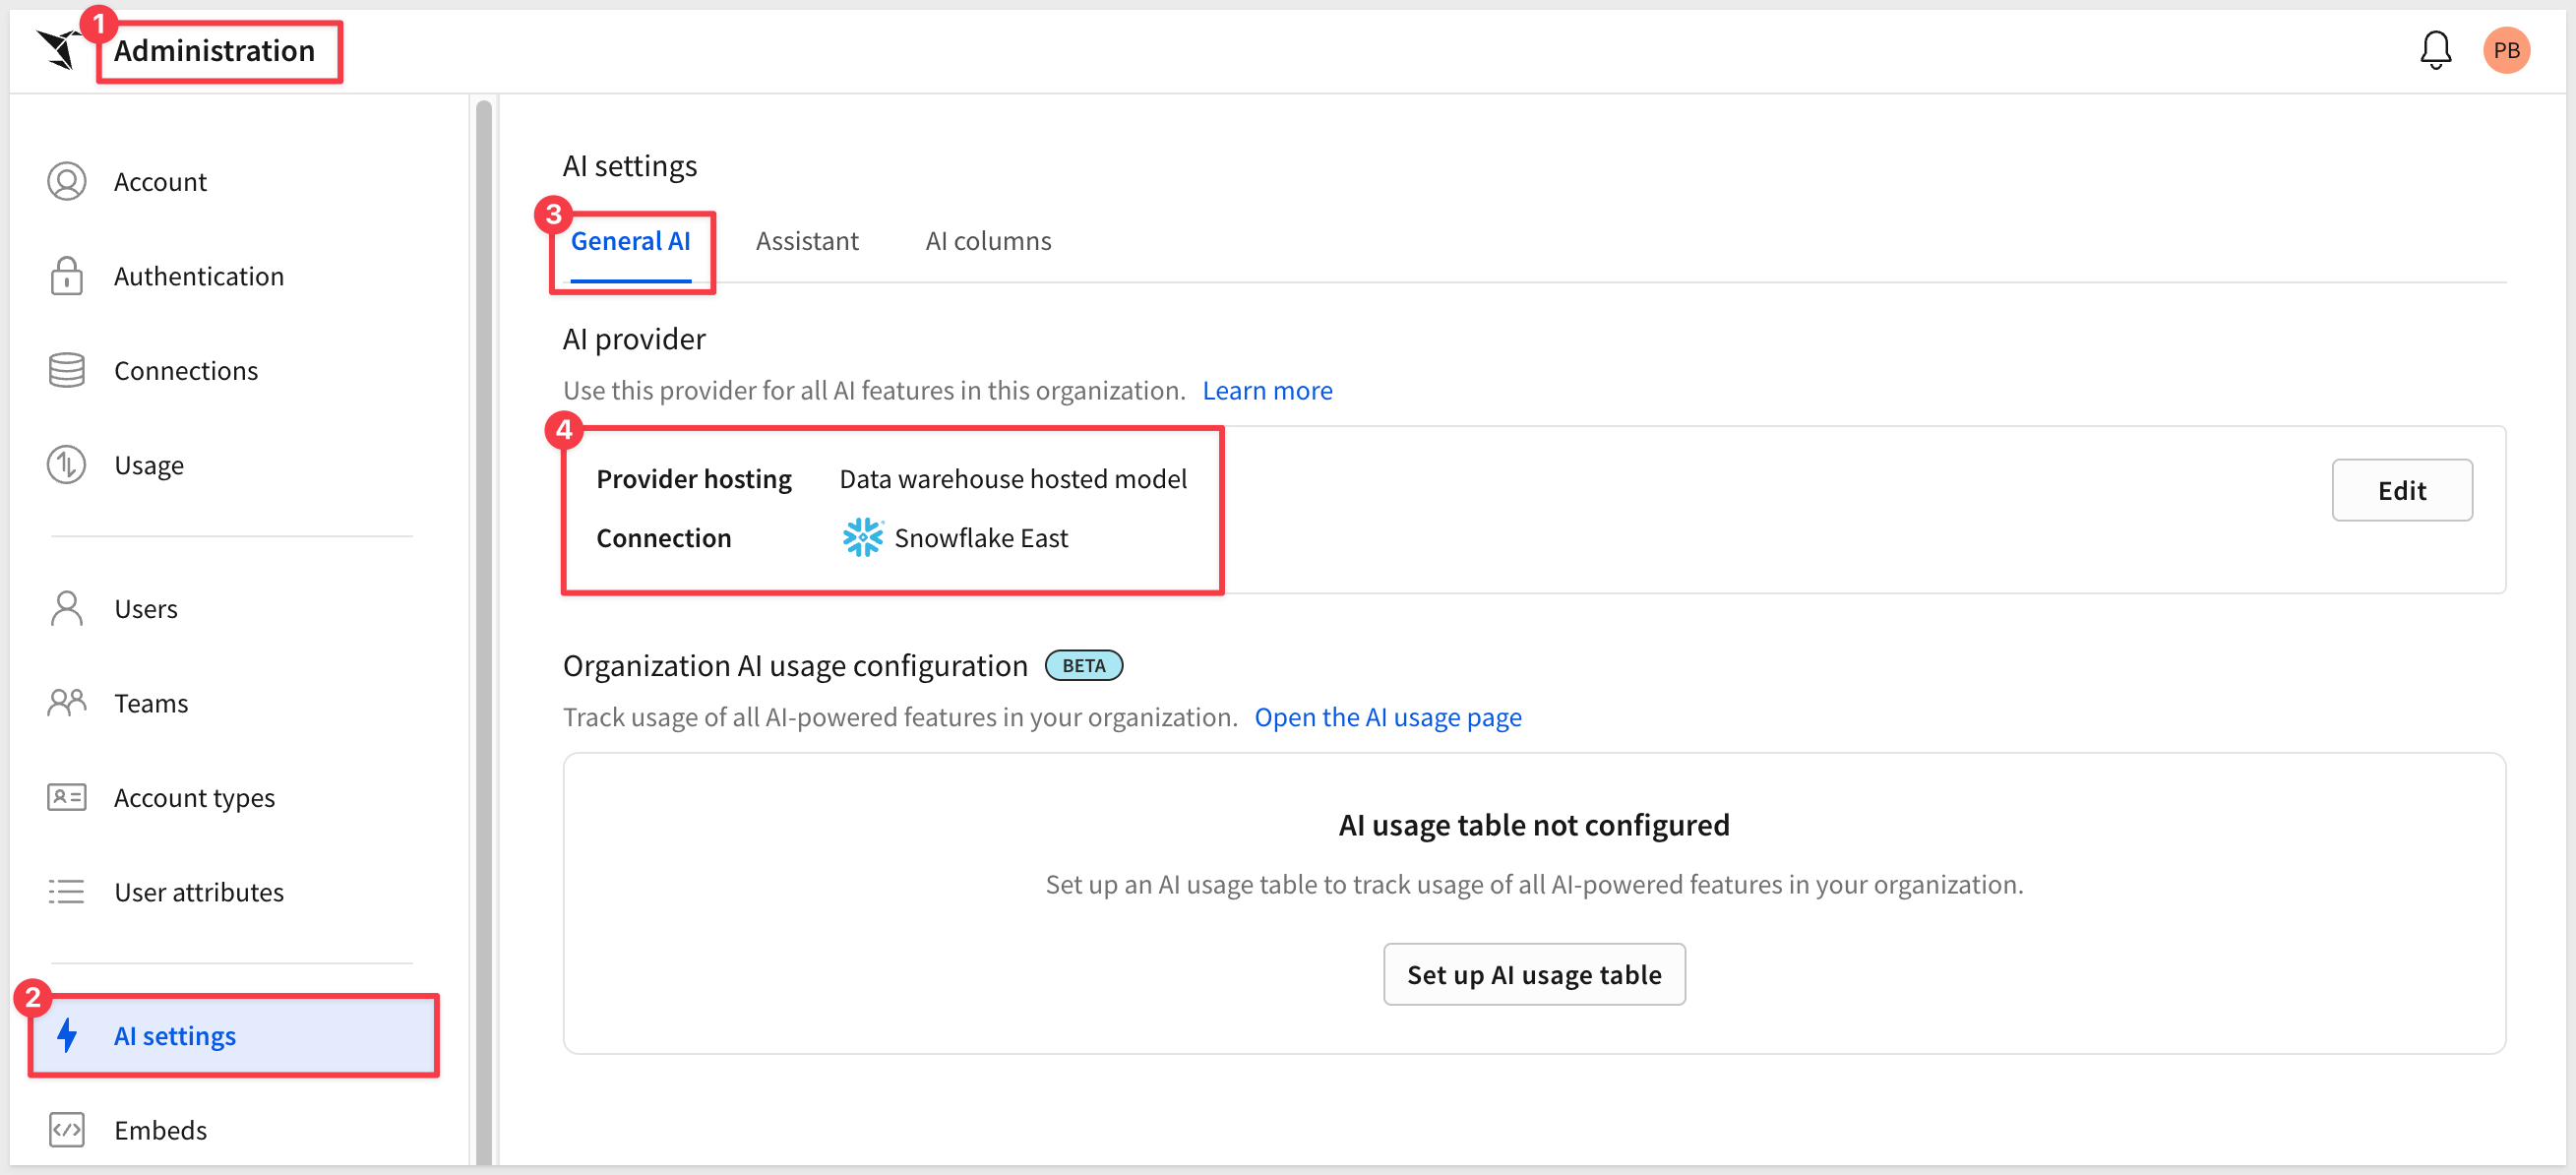
For setup instructions, see Configure an AI provider
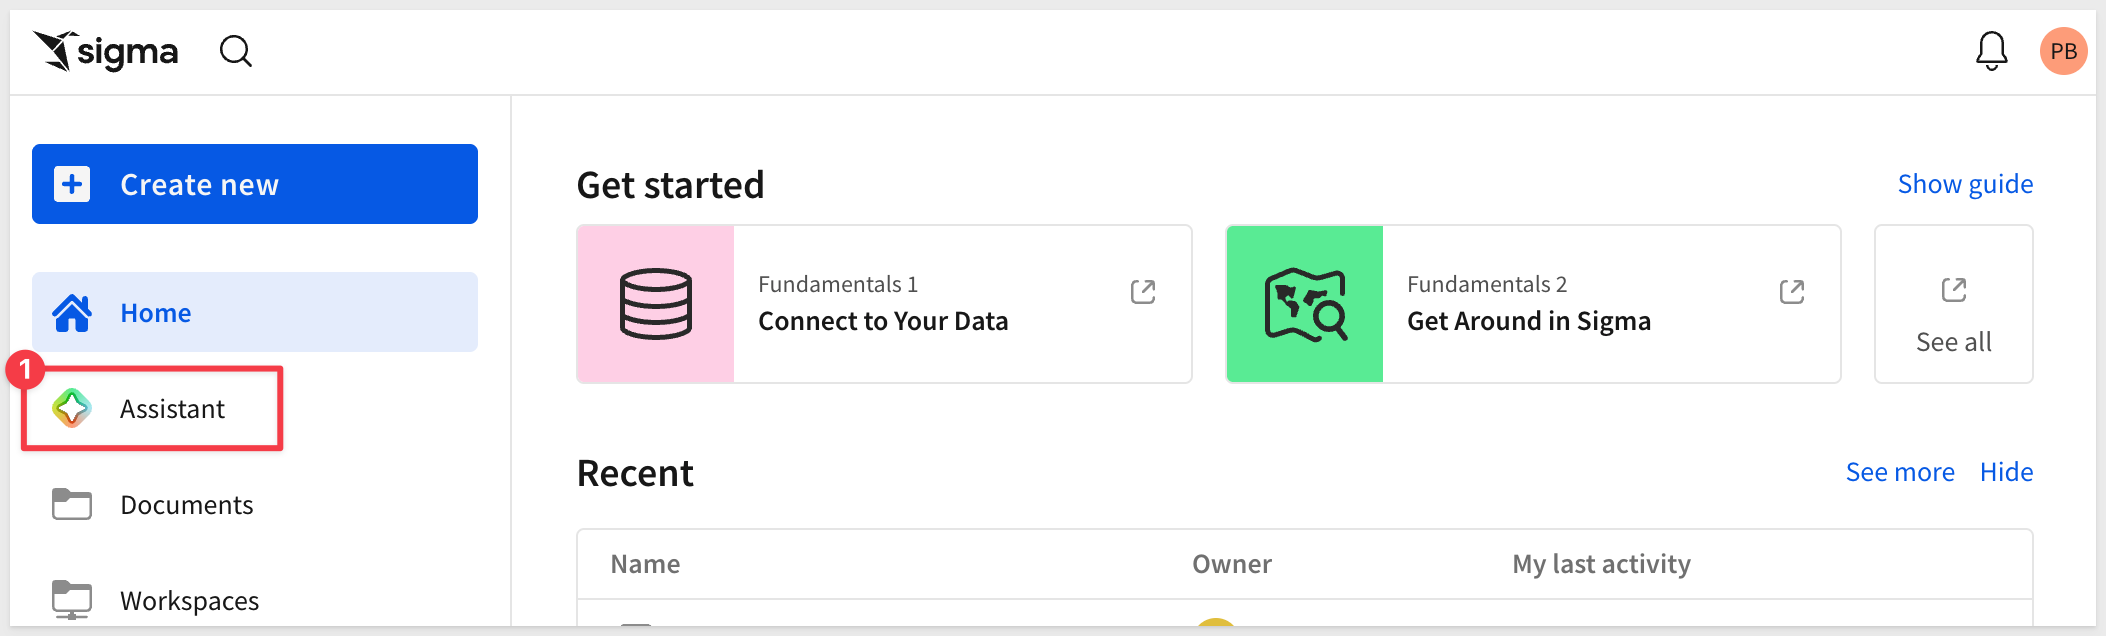
Once configured, Assistant becomes available on the homepage:
AI features in Sigma
Once a provider is configured, AI appears across the product — and it's designed as a deliberate spectrum, from helping with a single formula to bringing Sigma's data into the AI tools you use elsewhere. This QuickStart walks through them in that order, simplest to most advanced:
- Formula Assistant: Write, fix, or explain a single formula from the formula bar. Reach for it when you're working in one calculation. Learn more
- Sigma Assistant: Ask questions in plain language and get AI-generated tables and charts you can open in a workbook. Reach for it to explore data or start an analysis. Learn more
- Building with Assistant: Inside a workbook, Assistant plans and builds entire dashboards and apps. Reach for it to go from an idea to a working dashboard. Learn more
- Sigma agents and chat elements: Embed an AI helper with custom instructions and tools into a workbook, and let end users interact with it through a chat element. Reach for it to put AI to work inside an app. Learn more
- Sigma MCP Server: Bring your Sigma data into an external AI tool like Claude. Reach for it to work with Sigma data from outside Sigma. Learn more
Two more AI touches show up while you work, though we don't walk through them here: Explain this Chart generates an AI description of any chart, and AI Queries run AI analysis on text data — sentiment, classification, summarization — as part of a workbook calculation.
For more information, see AI usage dashboard
For more information on all AI features, see Get started with AI in Sigma
Two paths, one platform
Sigma's AI features are genuinely useful — and they're only getting more capable. But powerful AI doesn't eliminate the value of understanding how things work.
Some users want to start with a question and get an answer in seconds. Others want to build from scratch, understand the data structure, and control every step. Some want both — starting with AI to explore quickly, then refining manually to get exactly what they need.
Sigma is designed to support both workflows without forcing a choice. You can let AI handle the initial analysis and then edit the results directly in a workbook. Or you can skip AI entirely and build everything by hand. The platform is the same either way — the same data, the same elements, the same publish and share workflow.
All of the AI features covered in the next few sections work with whichever AI provider your administrator has configured — whether that's a warehouse-hosted model like Snowflake Cortex or an external provider like OpenAI or Anthropic. Your organization chooses the provider; the experience in Sigma remains the same.
There is also an additional layer worth knowing about: the Sigma MCP Server. Rather than using AI inside Sigma, the MCP Server brings your Sigma data to your AI tool of choice — so you can query and explore Sigma directly from Anthropic Claude ("Claude"). That is covered later in this QuickStart.
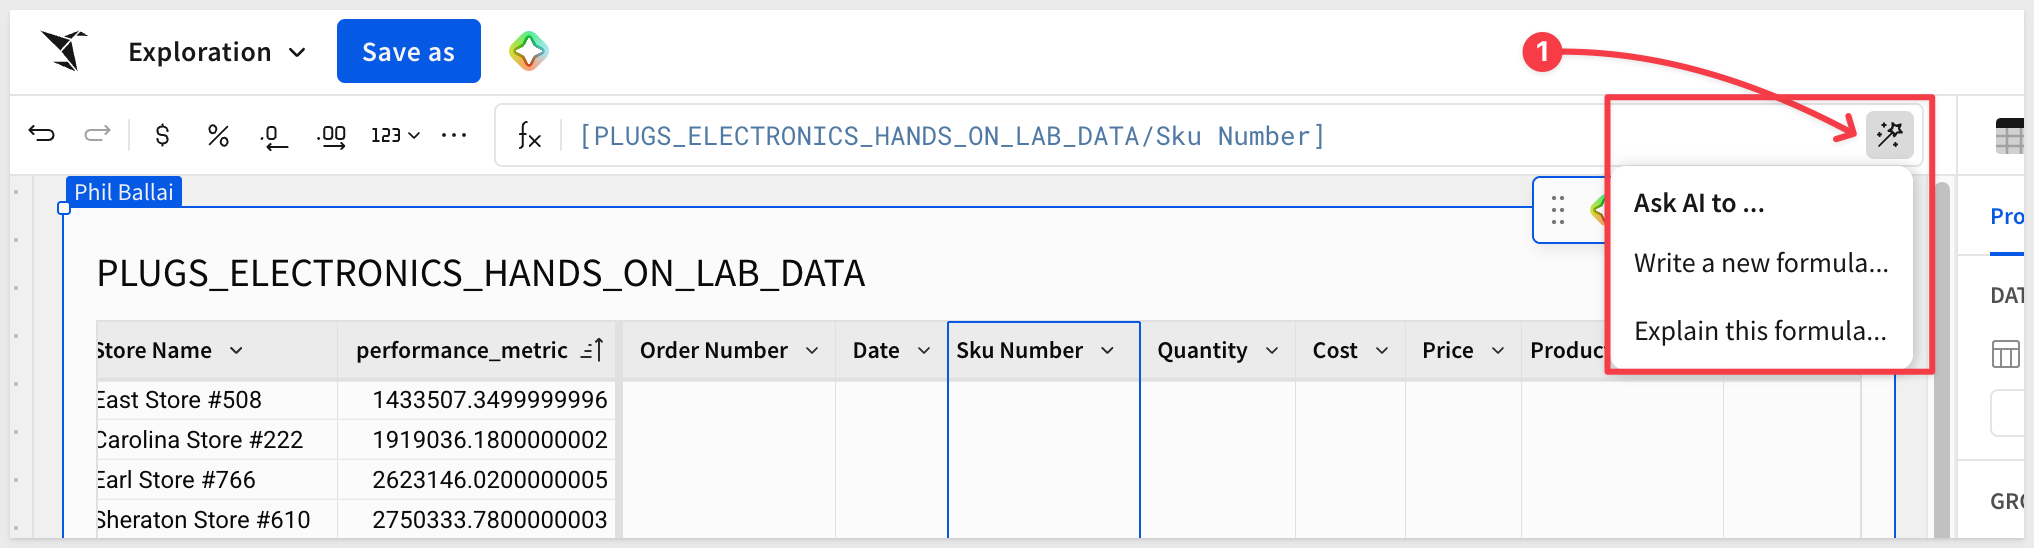
The simplest place AI shows up is the formula bar. The Formula Assistant lives in any workbook or data model and helps with a single calculation three ways:
- Write a formula — describe what you want to calculate, and AI suggests the formula
- Correct a formula — when Sigma detects an error, AI interprets your intent and suggests a fix
- Explain a formula — AI describes, in plain language, what an existing formula does
It becomes available when you select a column and open the formula bar. Click the AI wand icon to choose an option:
For example, selecting a calculated column and choosing Explain this formula returns a plain-language description — the columns it references, how the calculation works, and what the result represents:
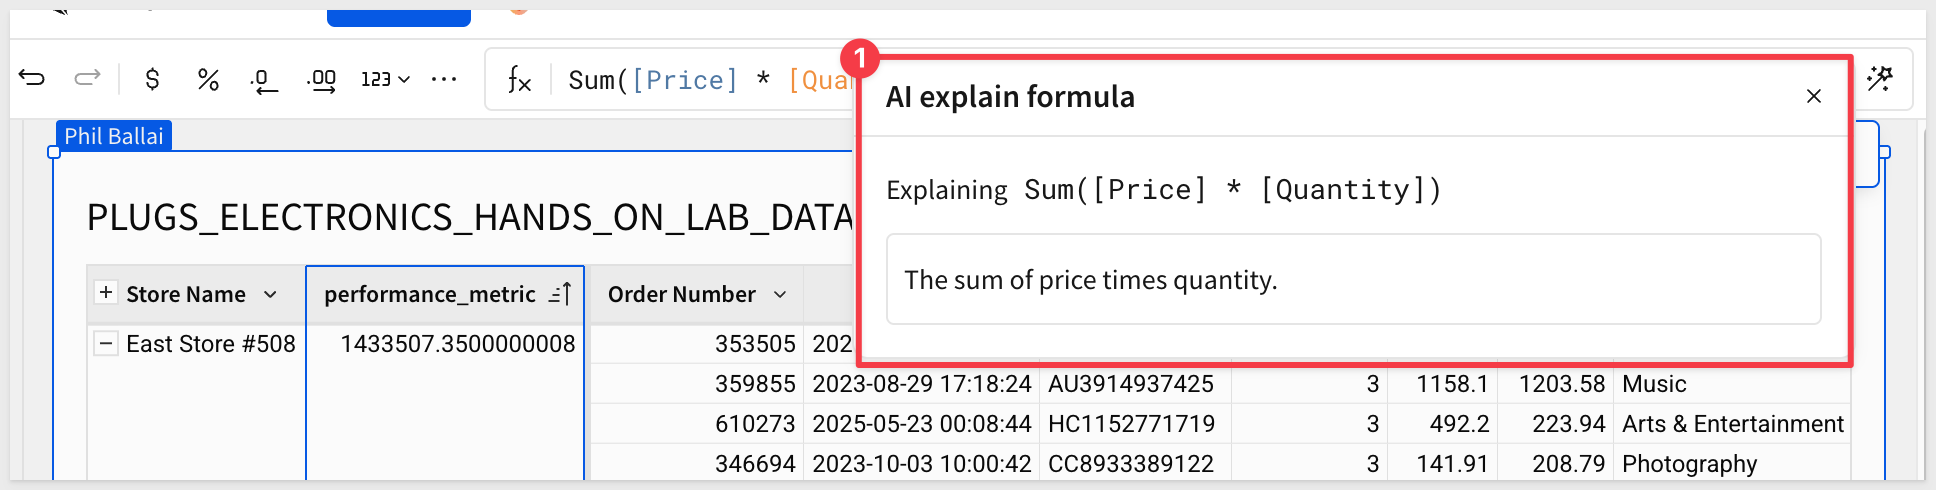
This is the whole idea in miniature: AI does the mechanical work while you stay in control — reading, verifying, and adjusting what it produces.
For more information, see Use AI with formulas
Sigma Assistant is the conversational AI panel built into Sigma. From the homepage you can ask a question in plain language, and Assistant works to answer it using the data sources an admin has made available — explaining each step, showing the SQL it ran, and letting you open the result directly in a workbook for further analysis.
Select data sources for Sigma Assistant
Before Sigma Assistant can answer questions, you need to tell it which data sources it can use. This keeps AI grounded in trusted, approved data and prevents accidental exposure of sensitive information to third-party providers.
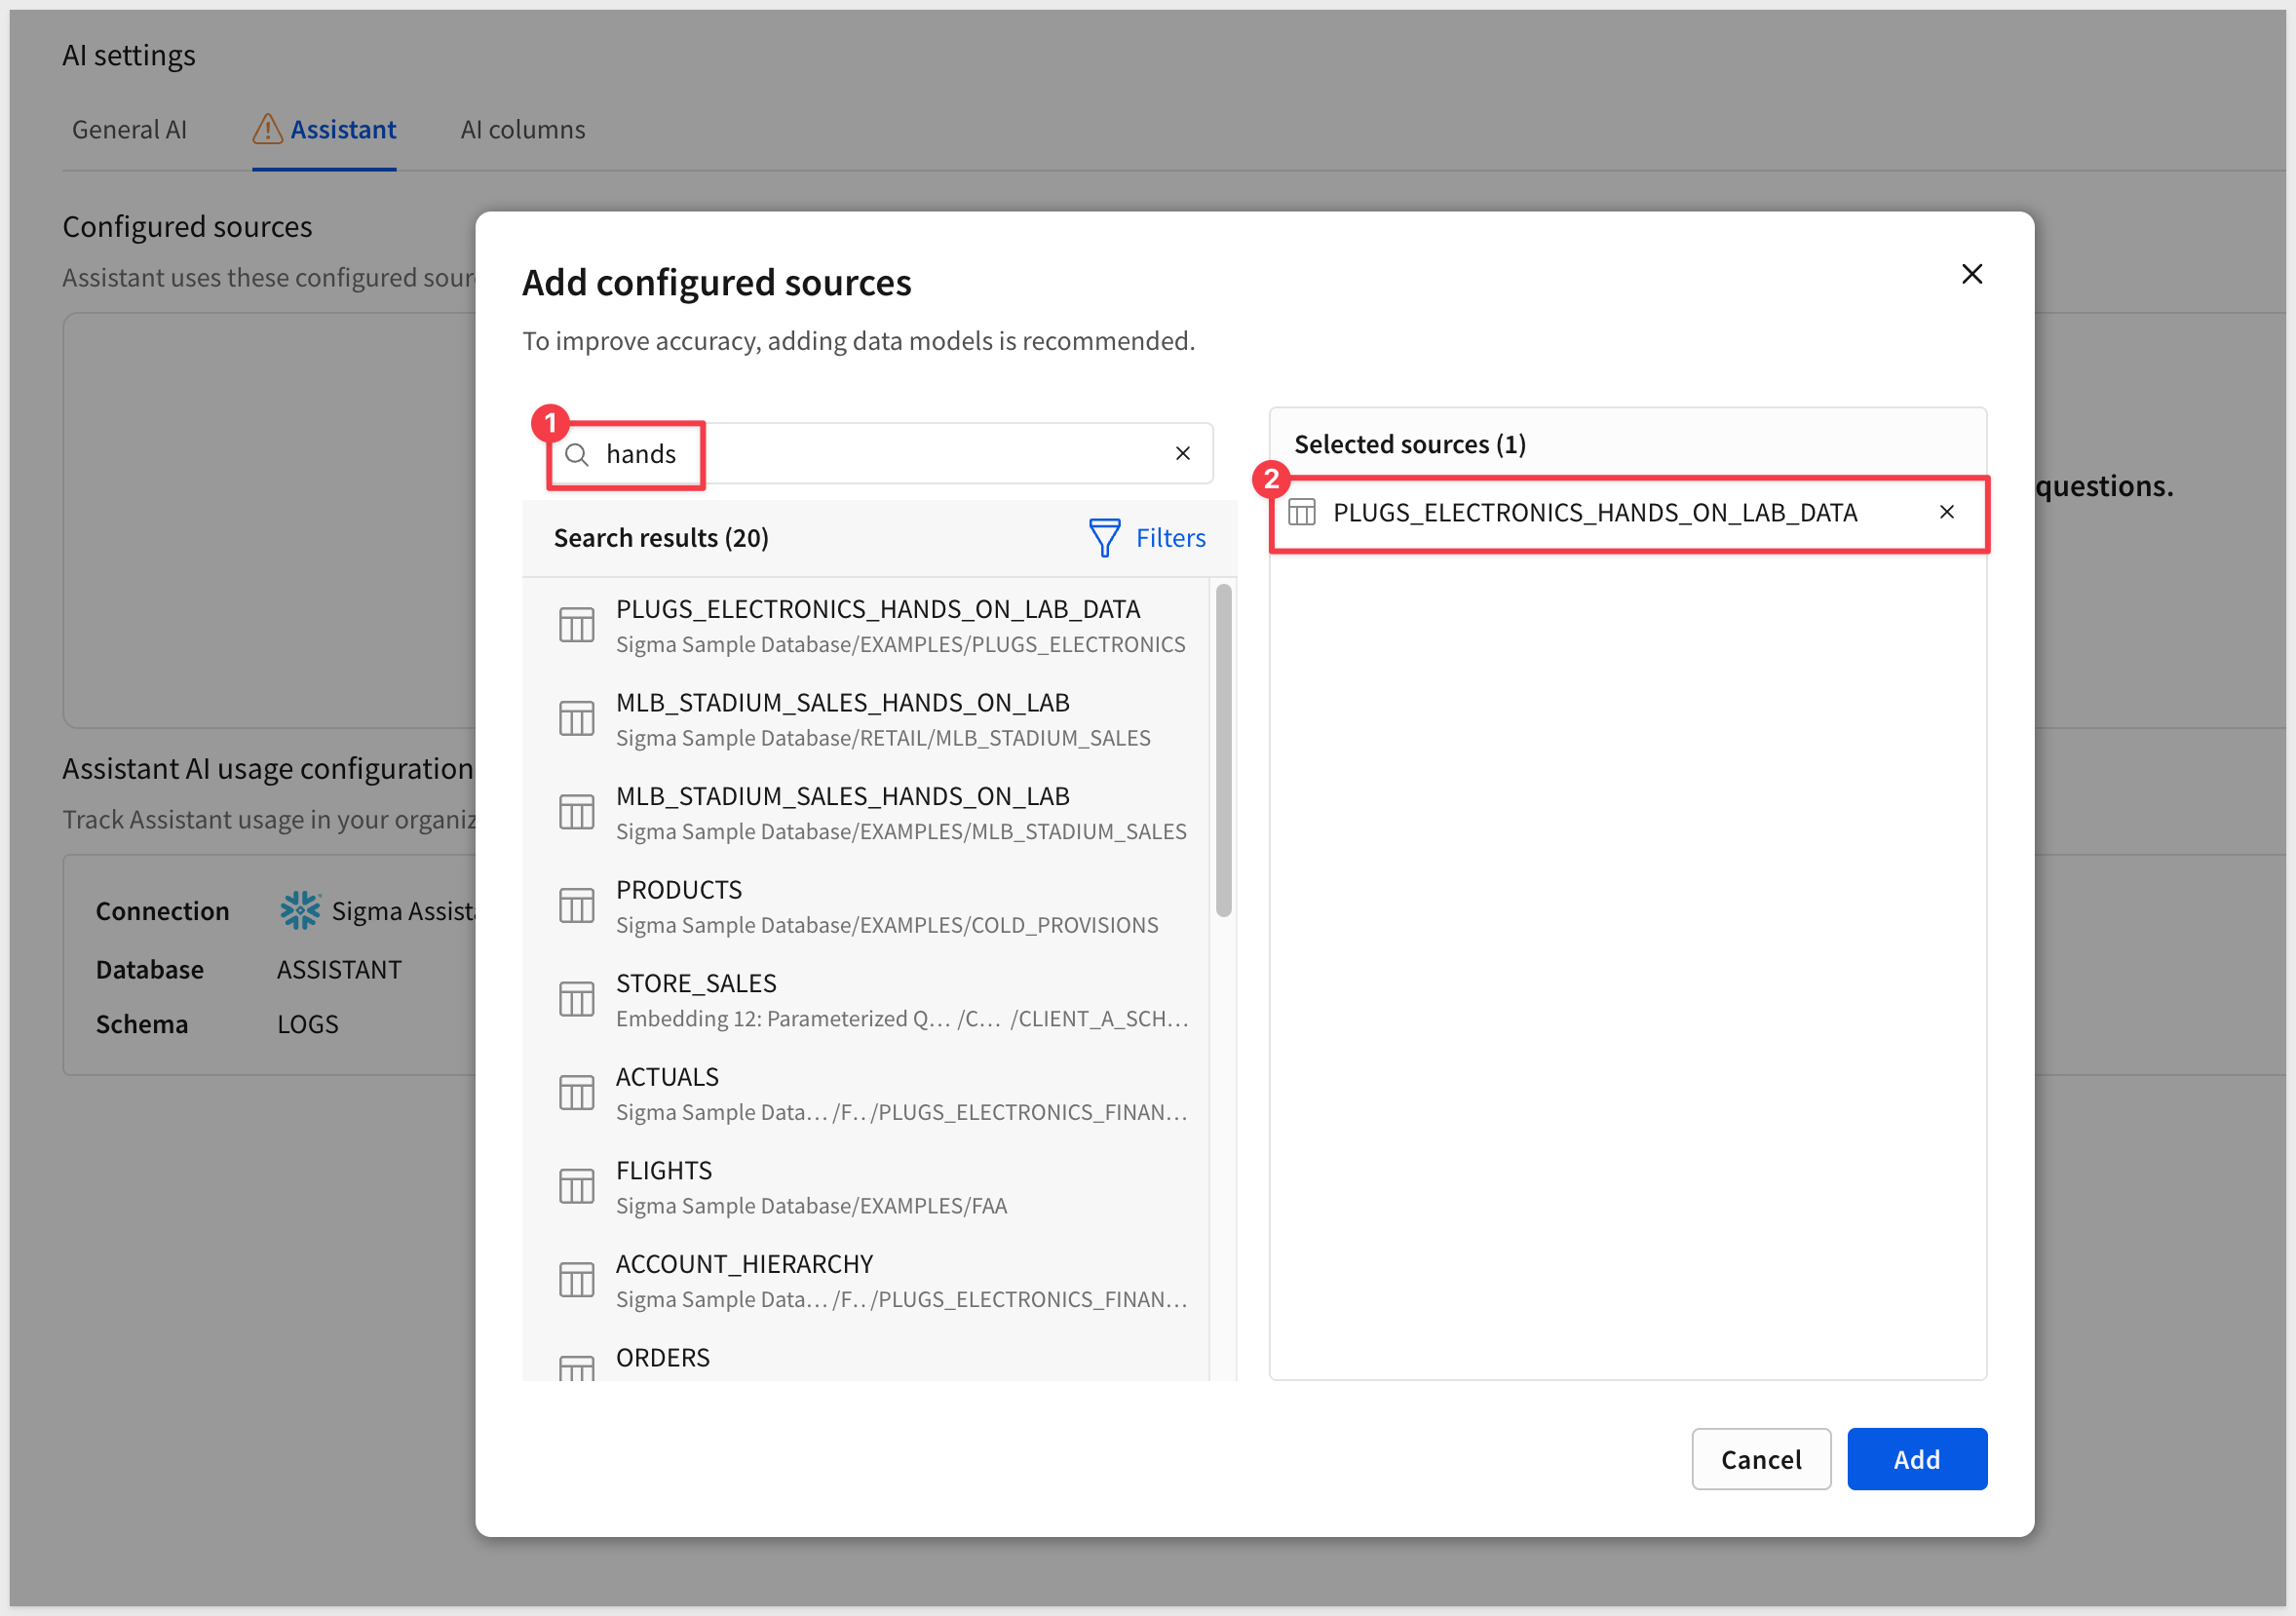
Navigate to Administration > AI > Assistant.
To enable a data source, click the Add source button, search for Hands, check the box for PLUGS_ELECTRONICS_HANDS_ON_LAB_DATA in the Sigma Sample Database > RETAIL schema, and click Add:
Hands-on: Sigma Assistant
Sigma Assistant changes how you start an analysis. Instead of deciding what to build first, you start with a question.
From the homepage, click the Sigma logo icon and select Sigma Assistant:
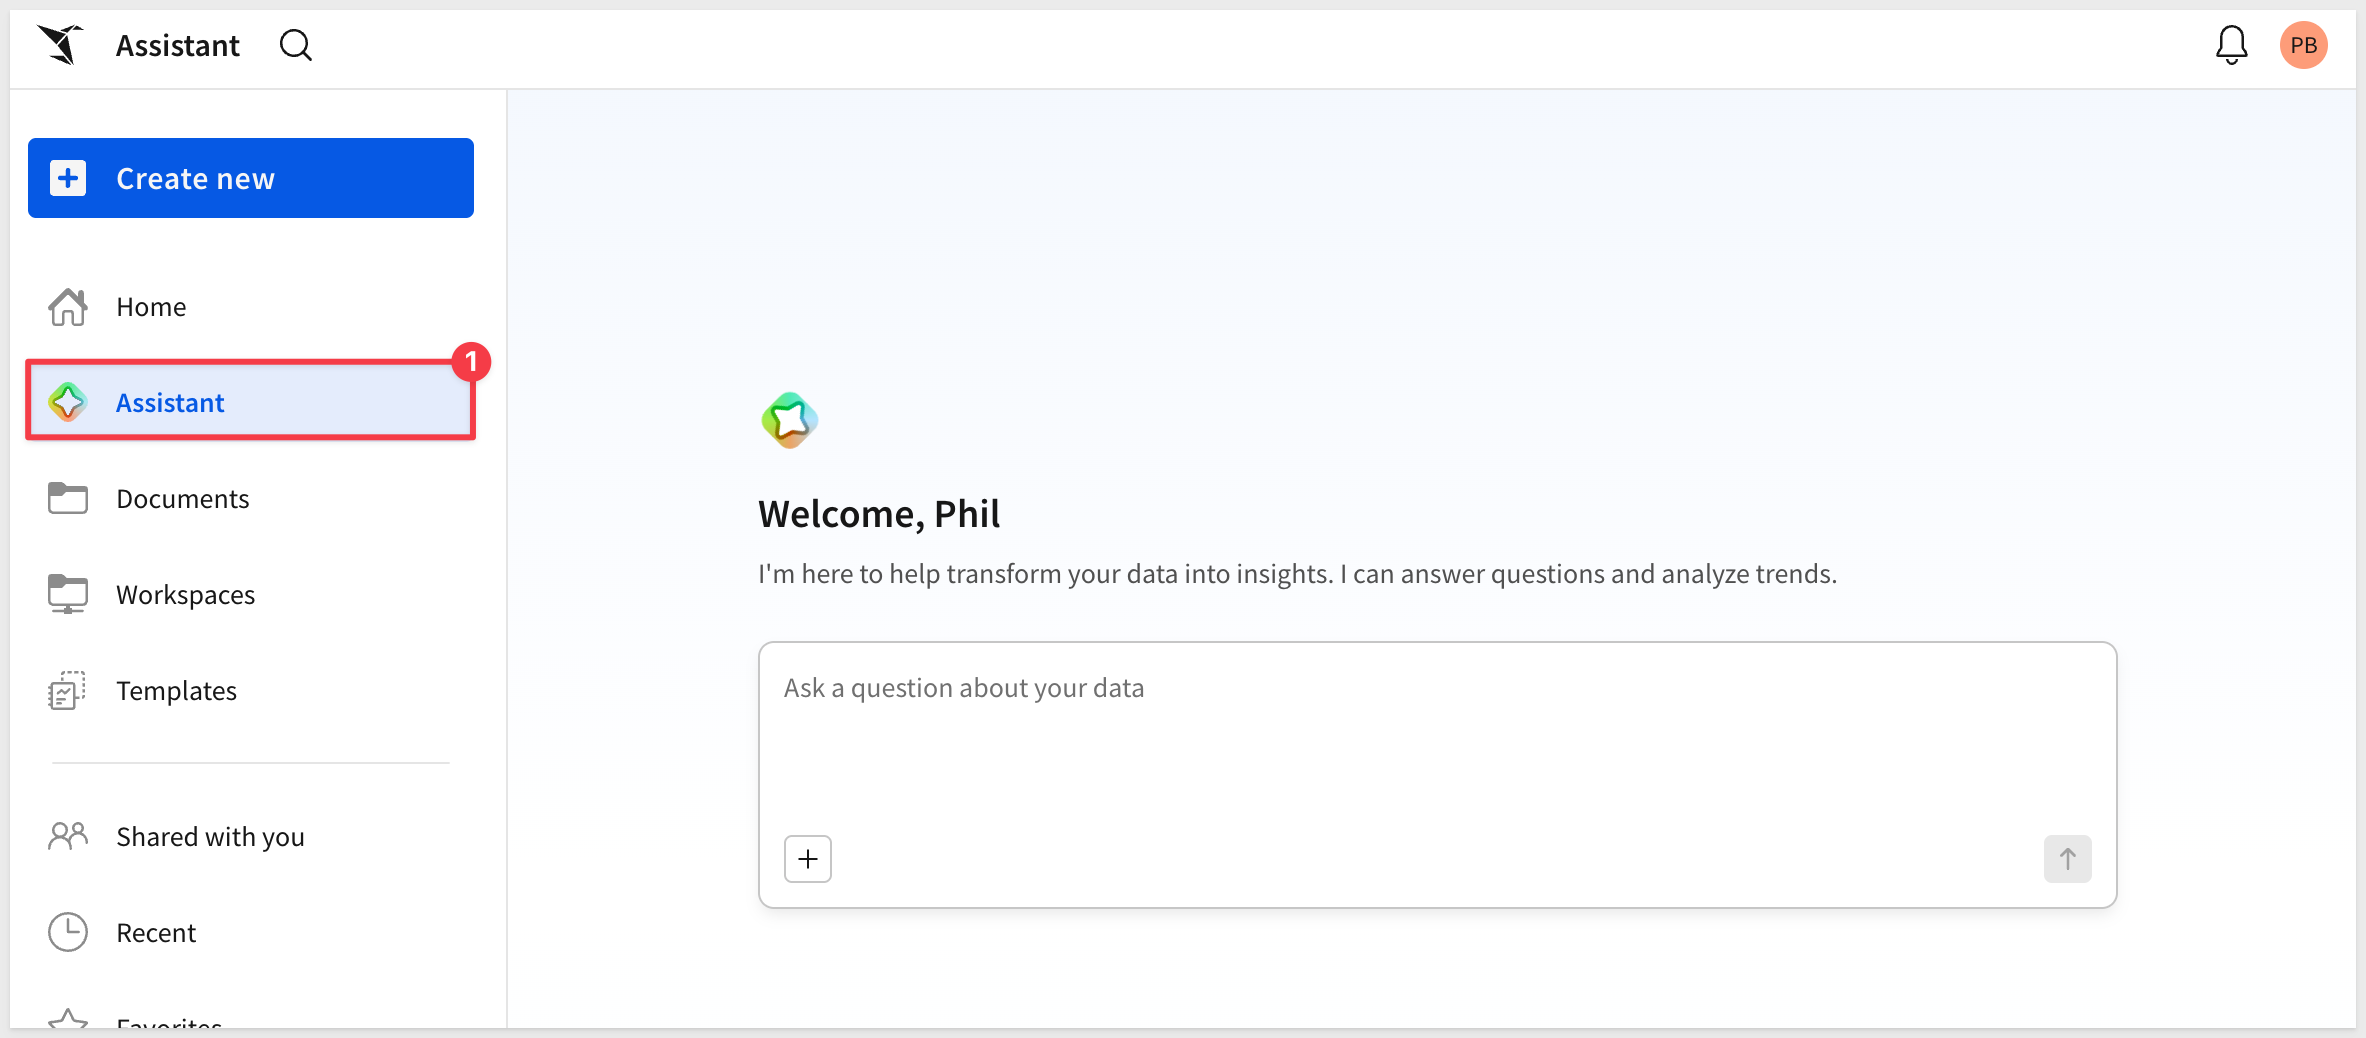
The Sigma Assistant interface is straightforward — type a question, and it will work to answer it using the data sources you've made available.
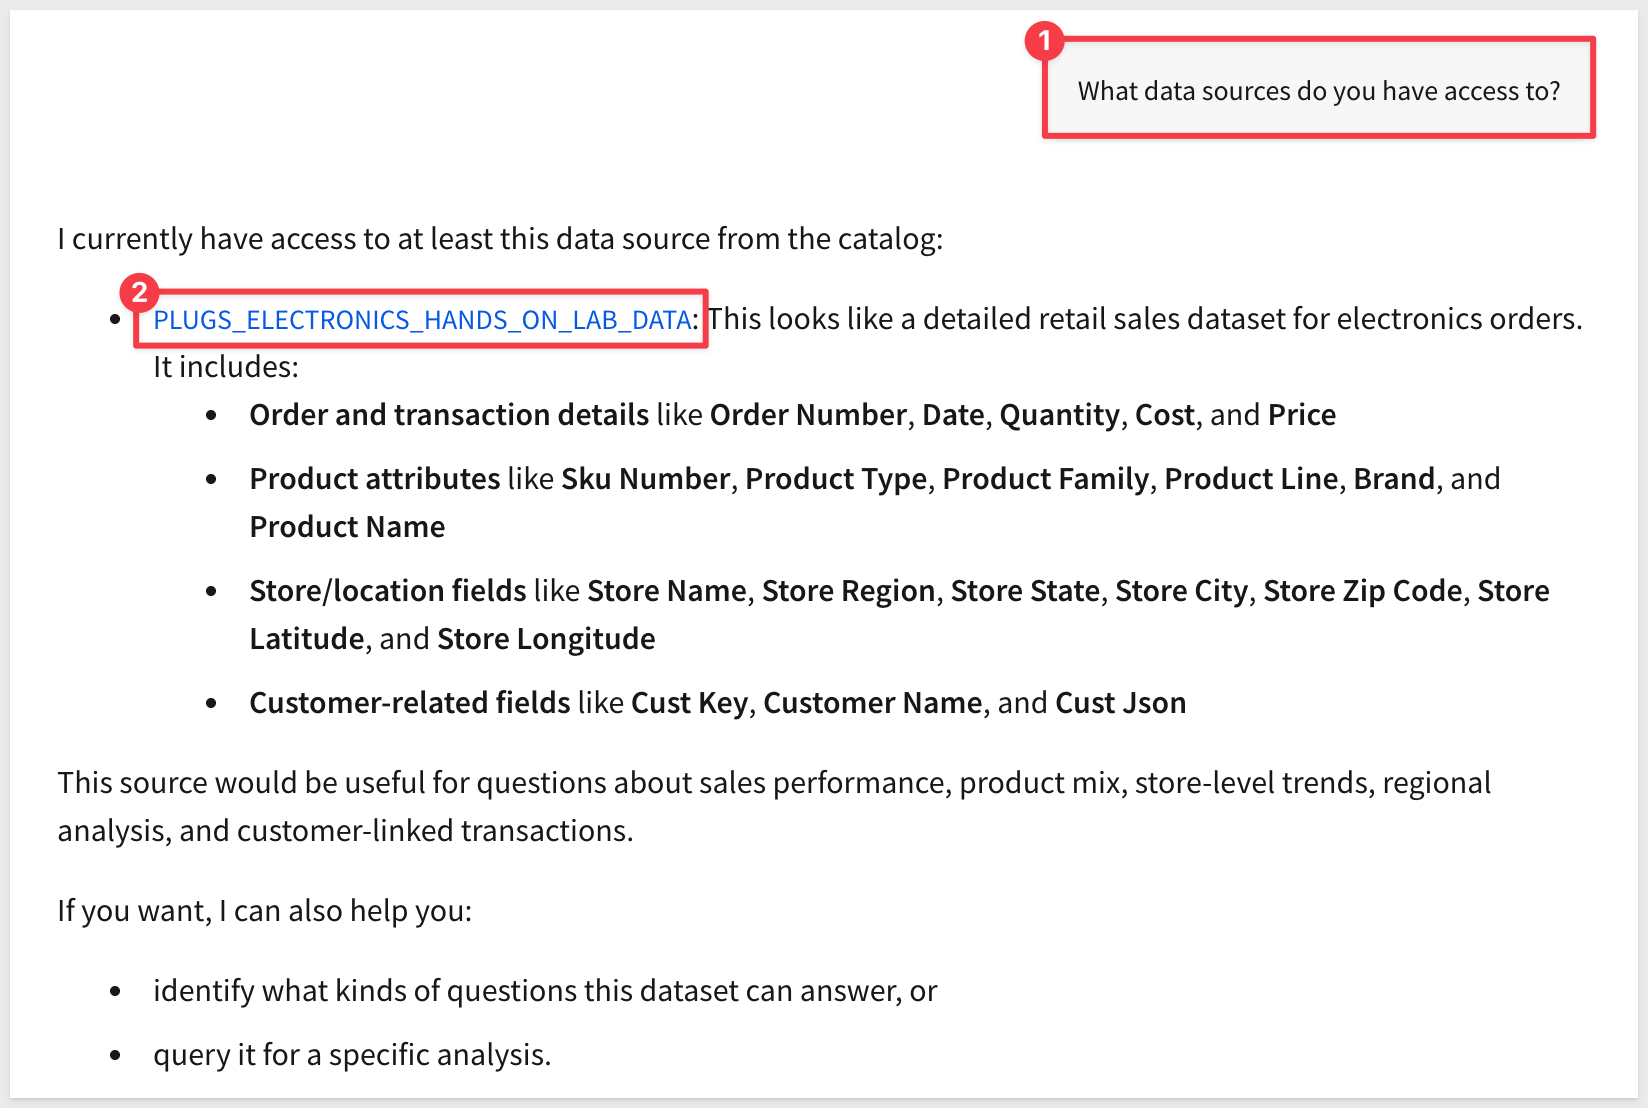
Let's confirm the CUSTOMERS table is not available and see what Assistant does have access to:
What data sources do you have access to?
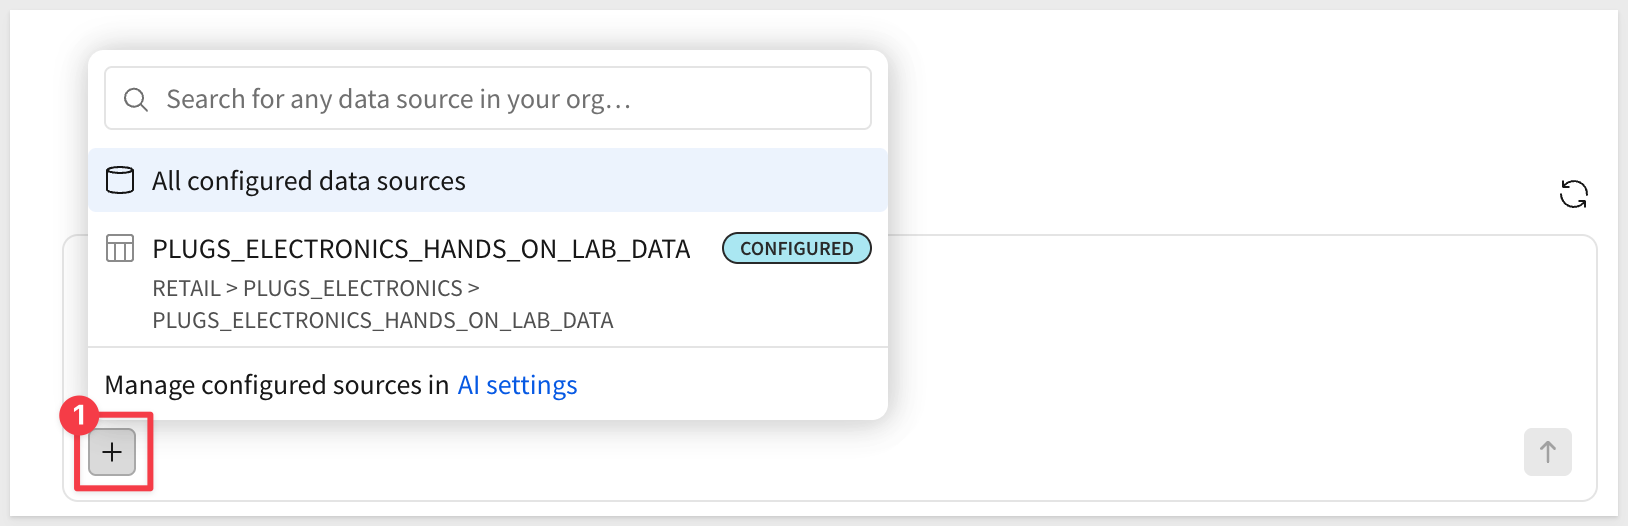
In practice you may have many data sources. It makes sense to focus Assistant on one or more sources instead of having it search all of them when responding to a question. This is made possible by clicking the + icon and selecting the desired source (if known):
Now let's ask a focused business question:
The CEO wants to know the bottom ten stores in the chain.
Before submitting, click the + button in the input area to select a specific data source. This scopes the query to a particular table and avoids ambiguity when multiple data sources are available:
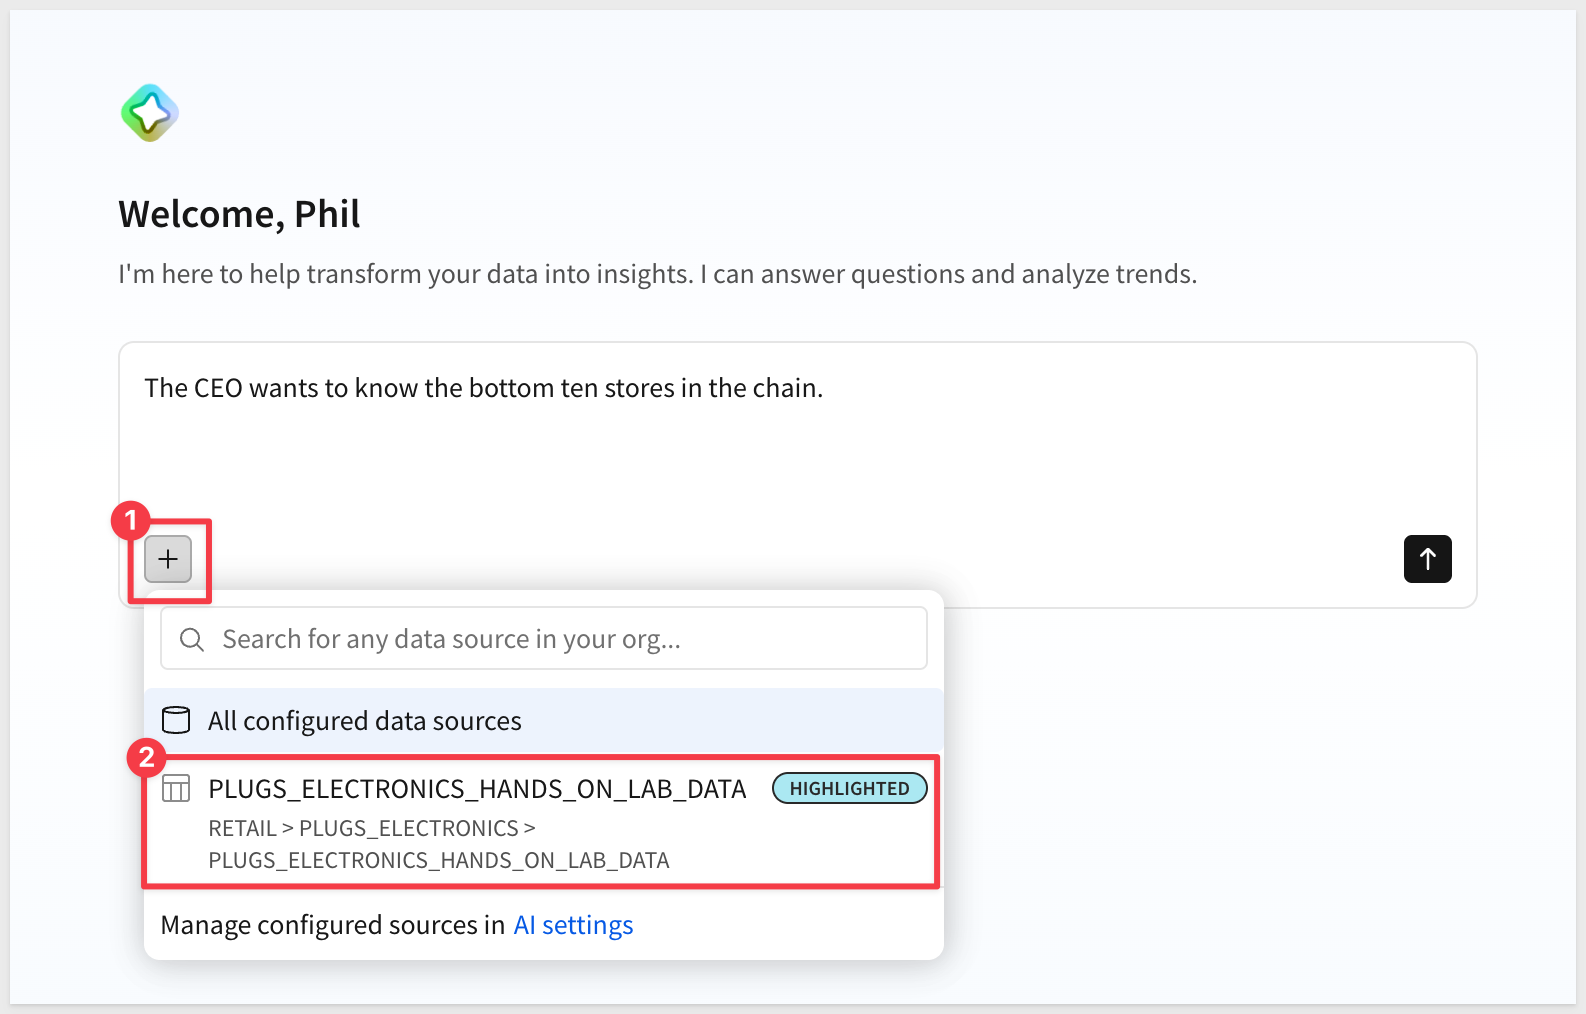
Select PLUGS_ELECTRONICS_HANDS_ON_LAB_DATA and submit the question.
Sigma Assistant explains what it's doing at each step and why. For those who need to see it, the SQL query used is shown:
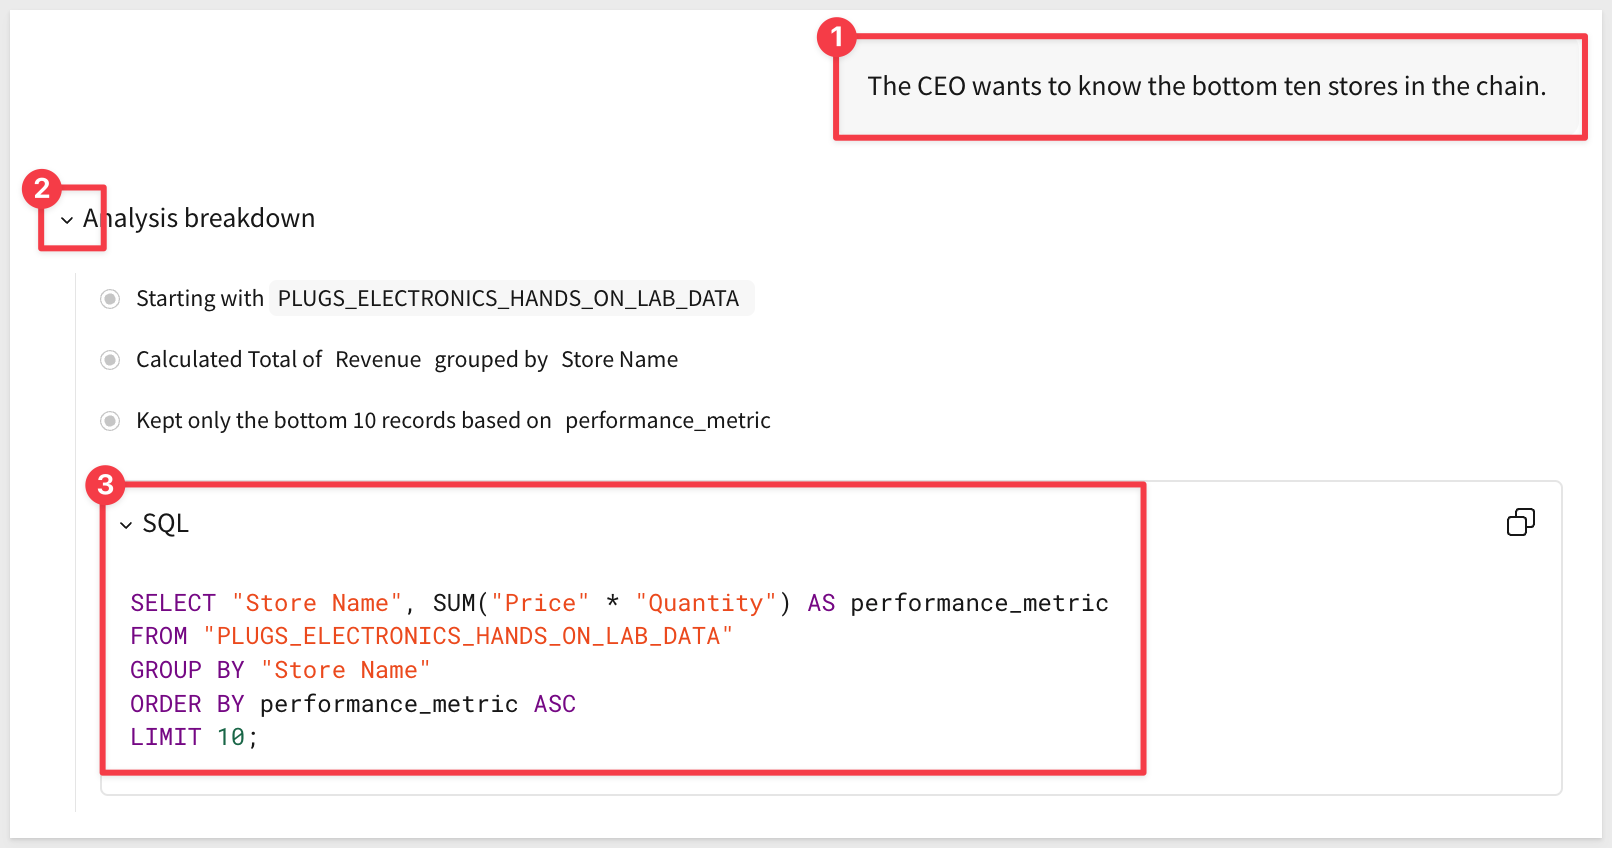
You can see the logic behind the result, adjust any step, and follow your curiosity into the data:
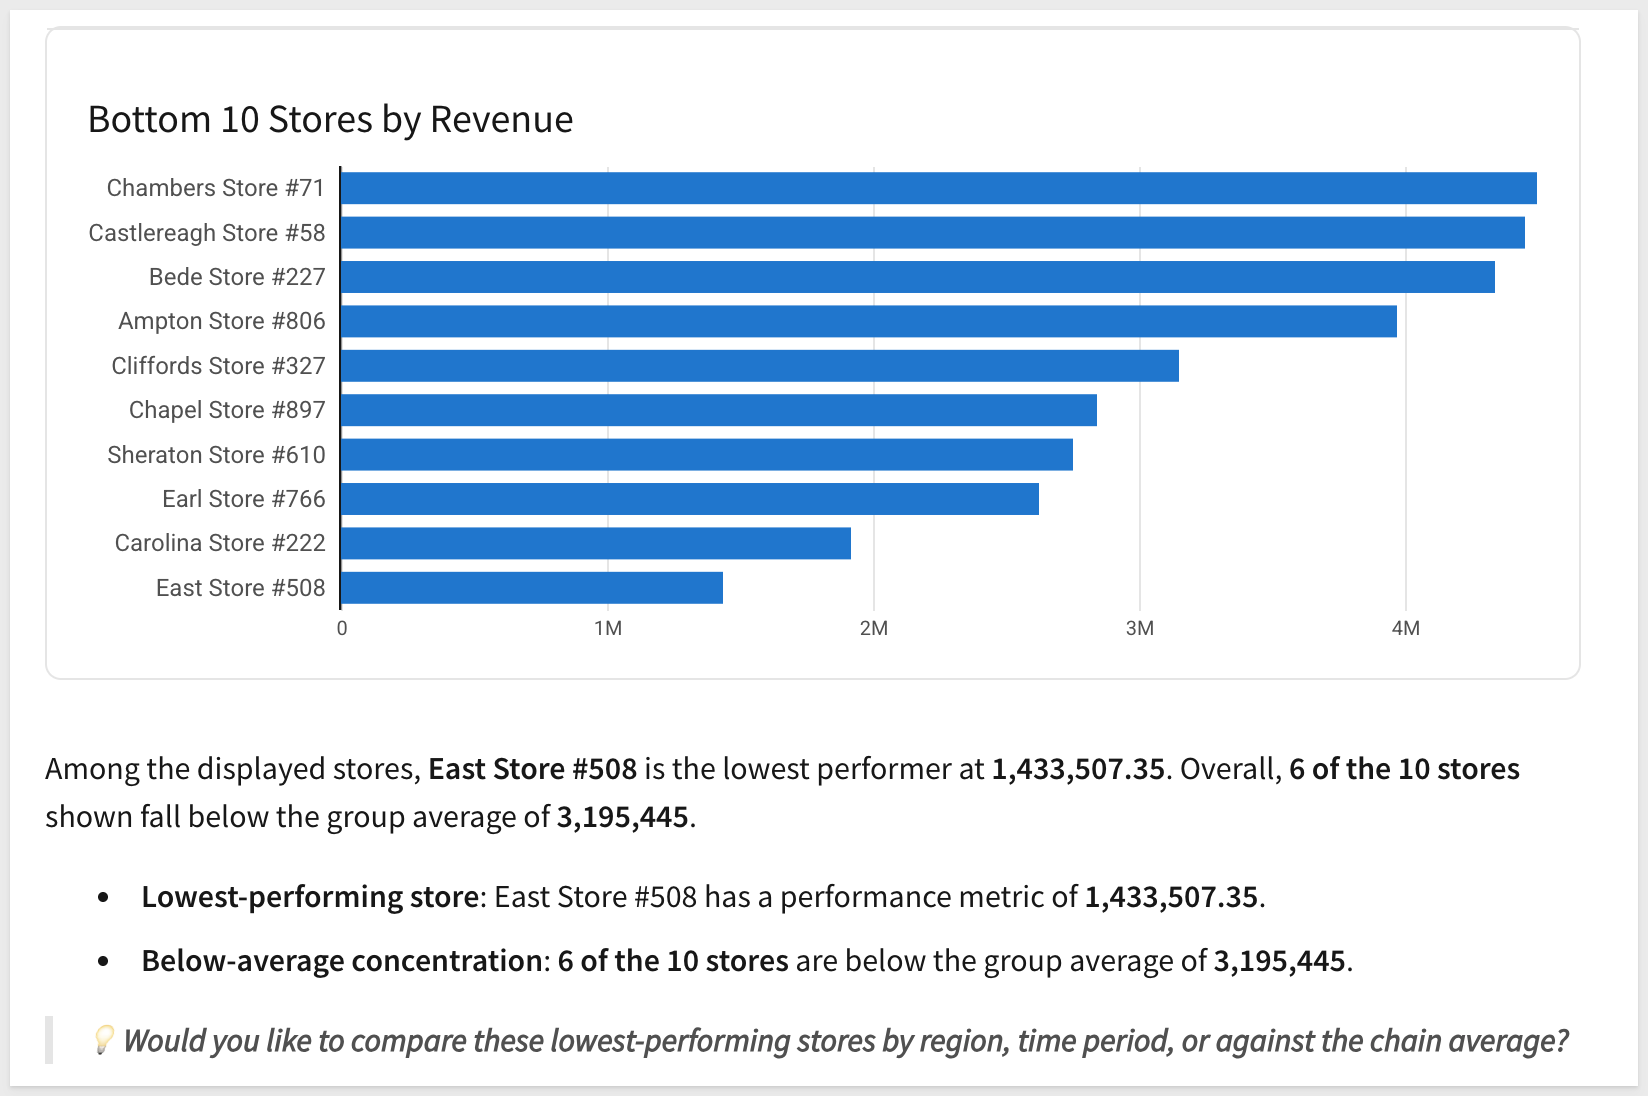
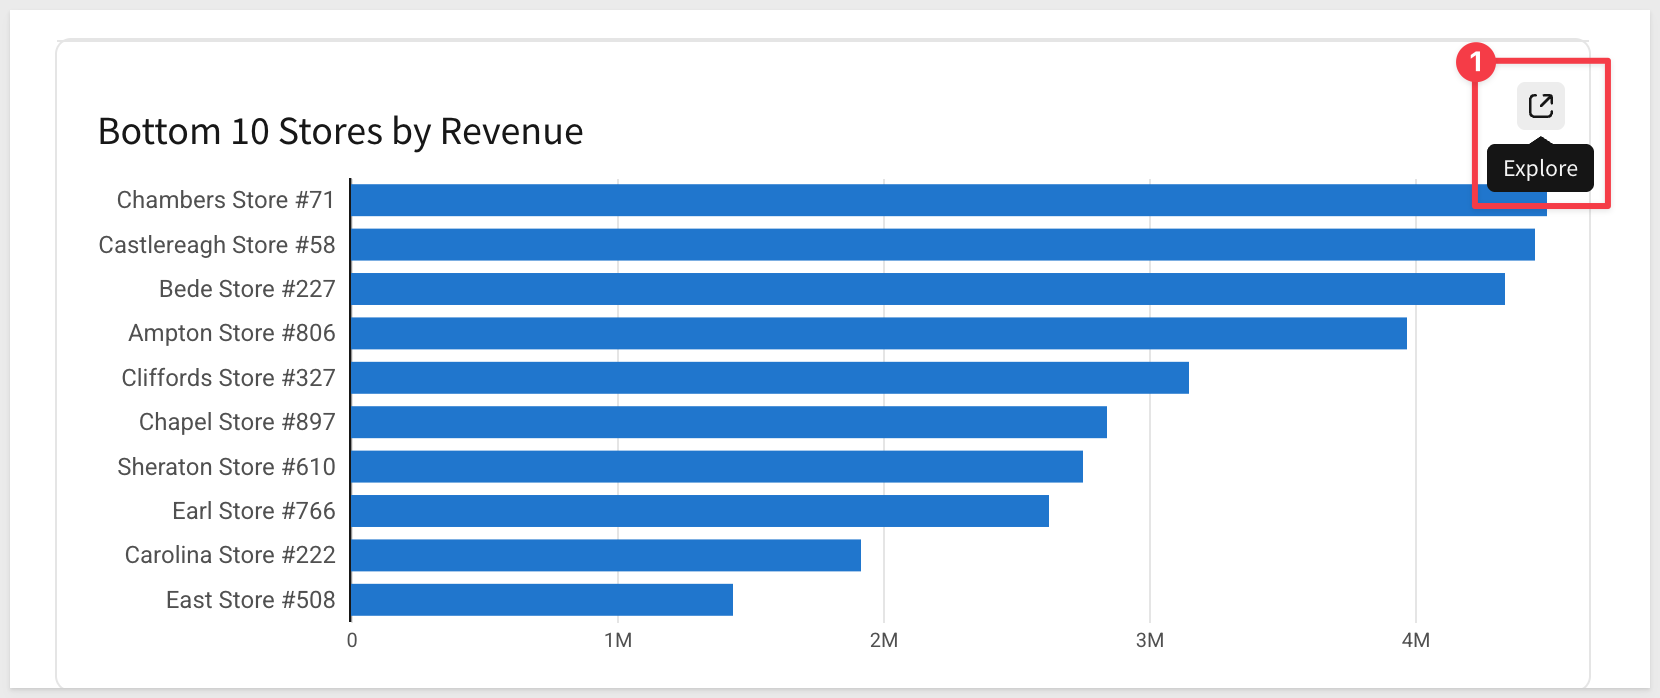
Once the response is ready, you'll see a full explanation, chart options, and the ability to open selected results directly in a workbook for further analysis by clicking the Explore icon.
Once in the workbook, we see that two tables and the chart are included (after moving them around a bit) and Assistant handled the grouping and calculation required to answer the question:
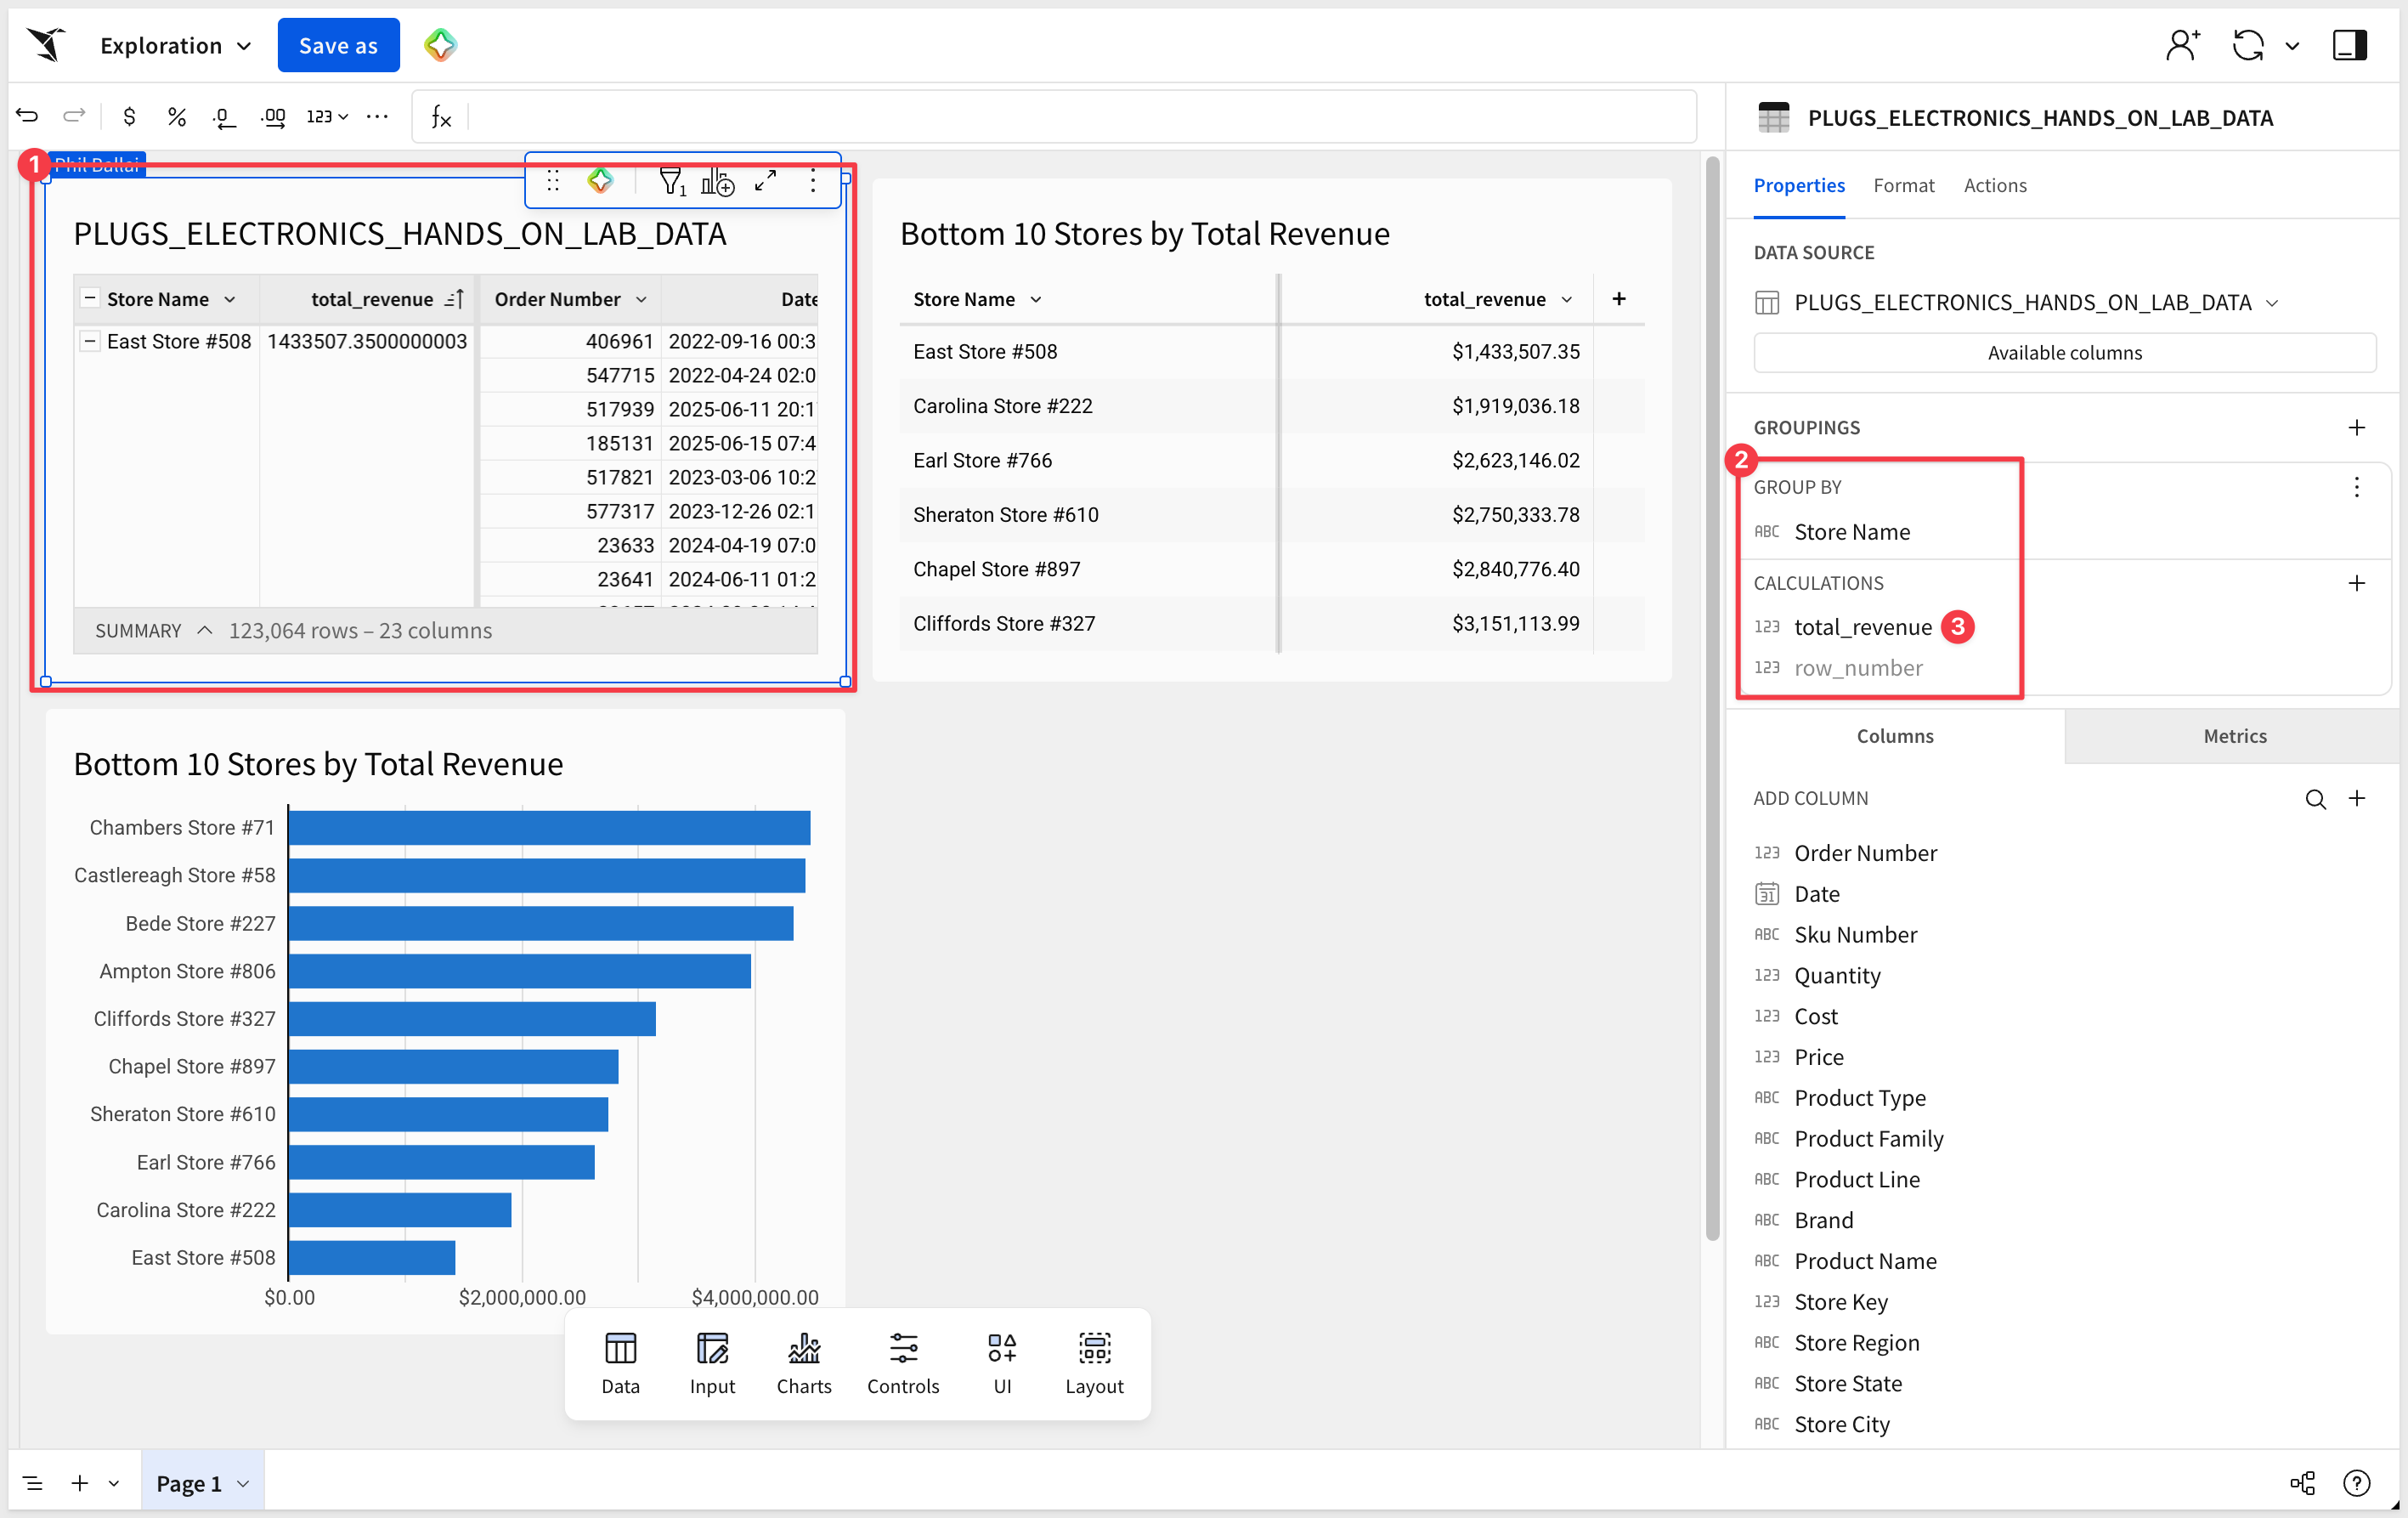
Now we can save it, refine it, or use Sigma's drill-down capabilities for deeper analysis. We'll continue building on this workbook in the next section.
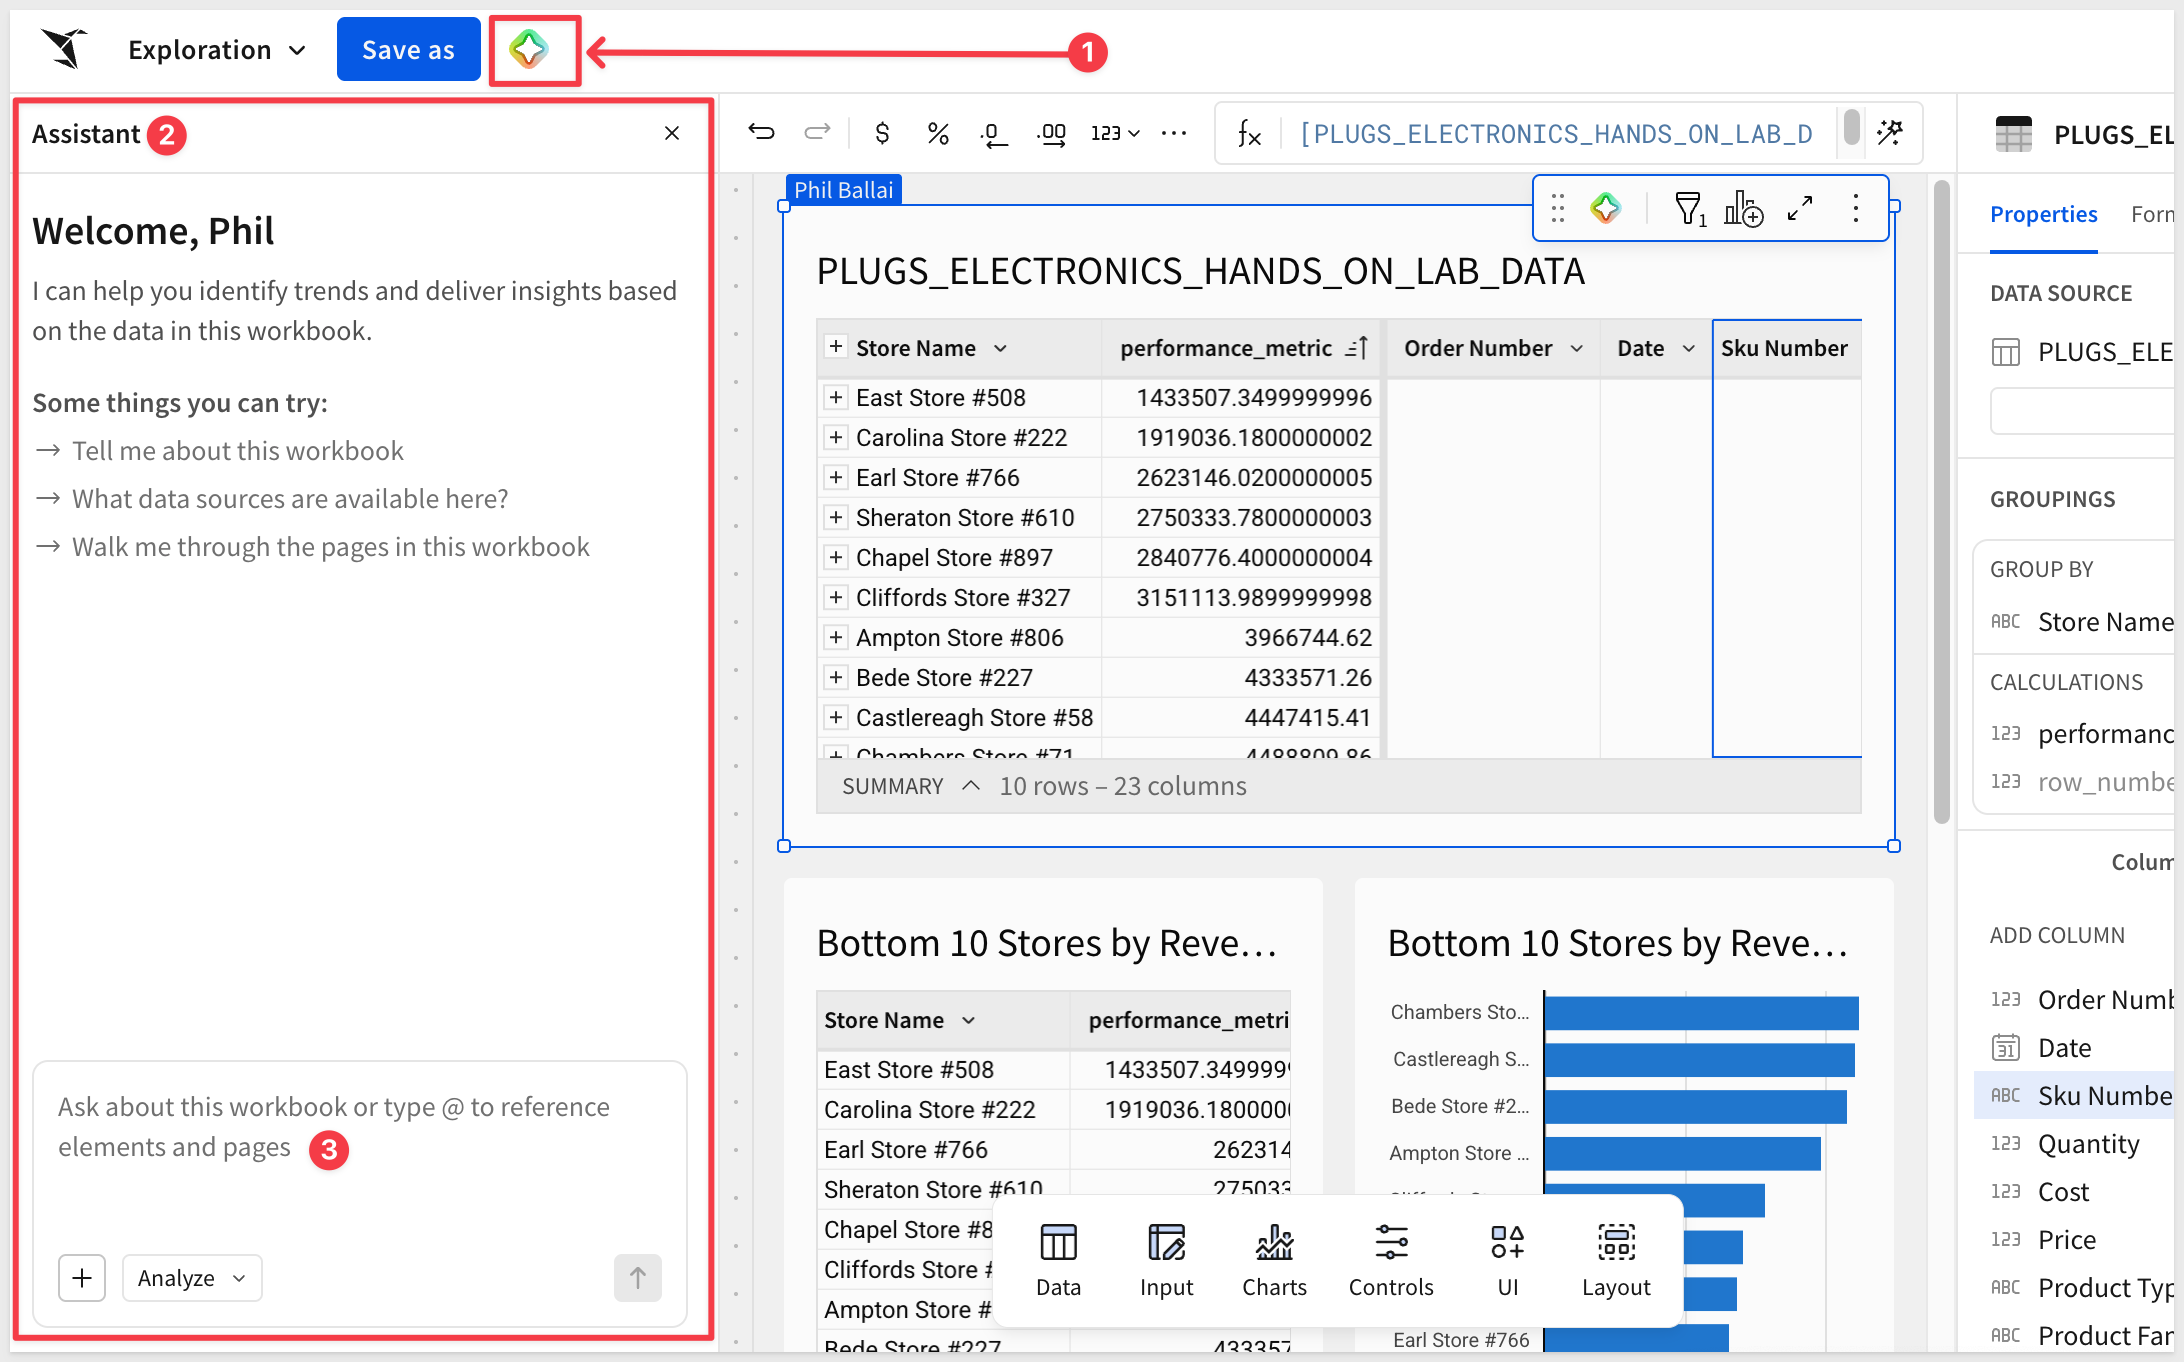
We can still access Assistant in the workbook by clicking the  icon:
icon:
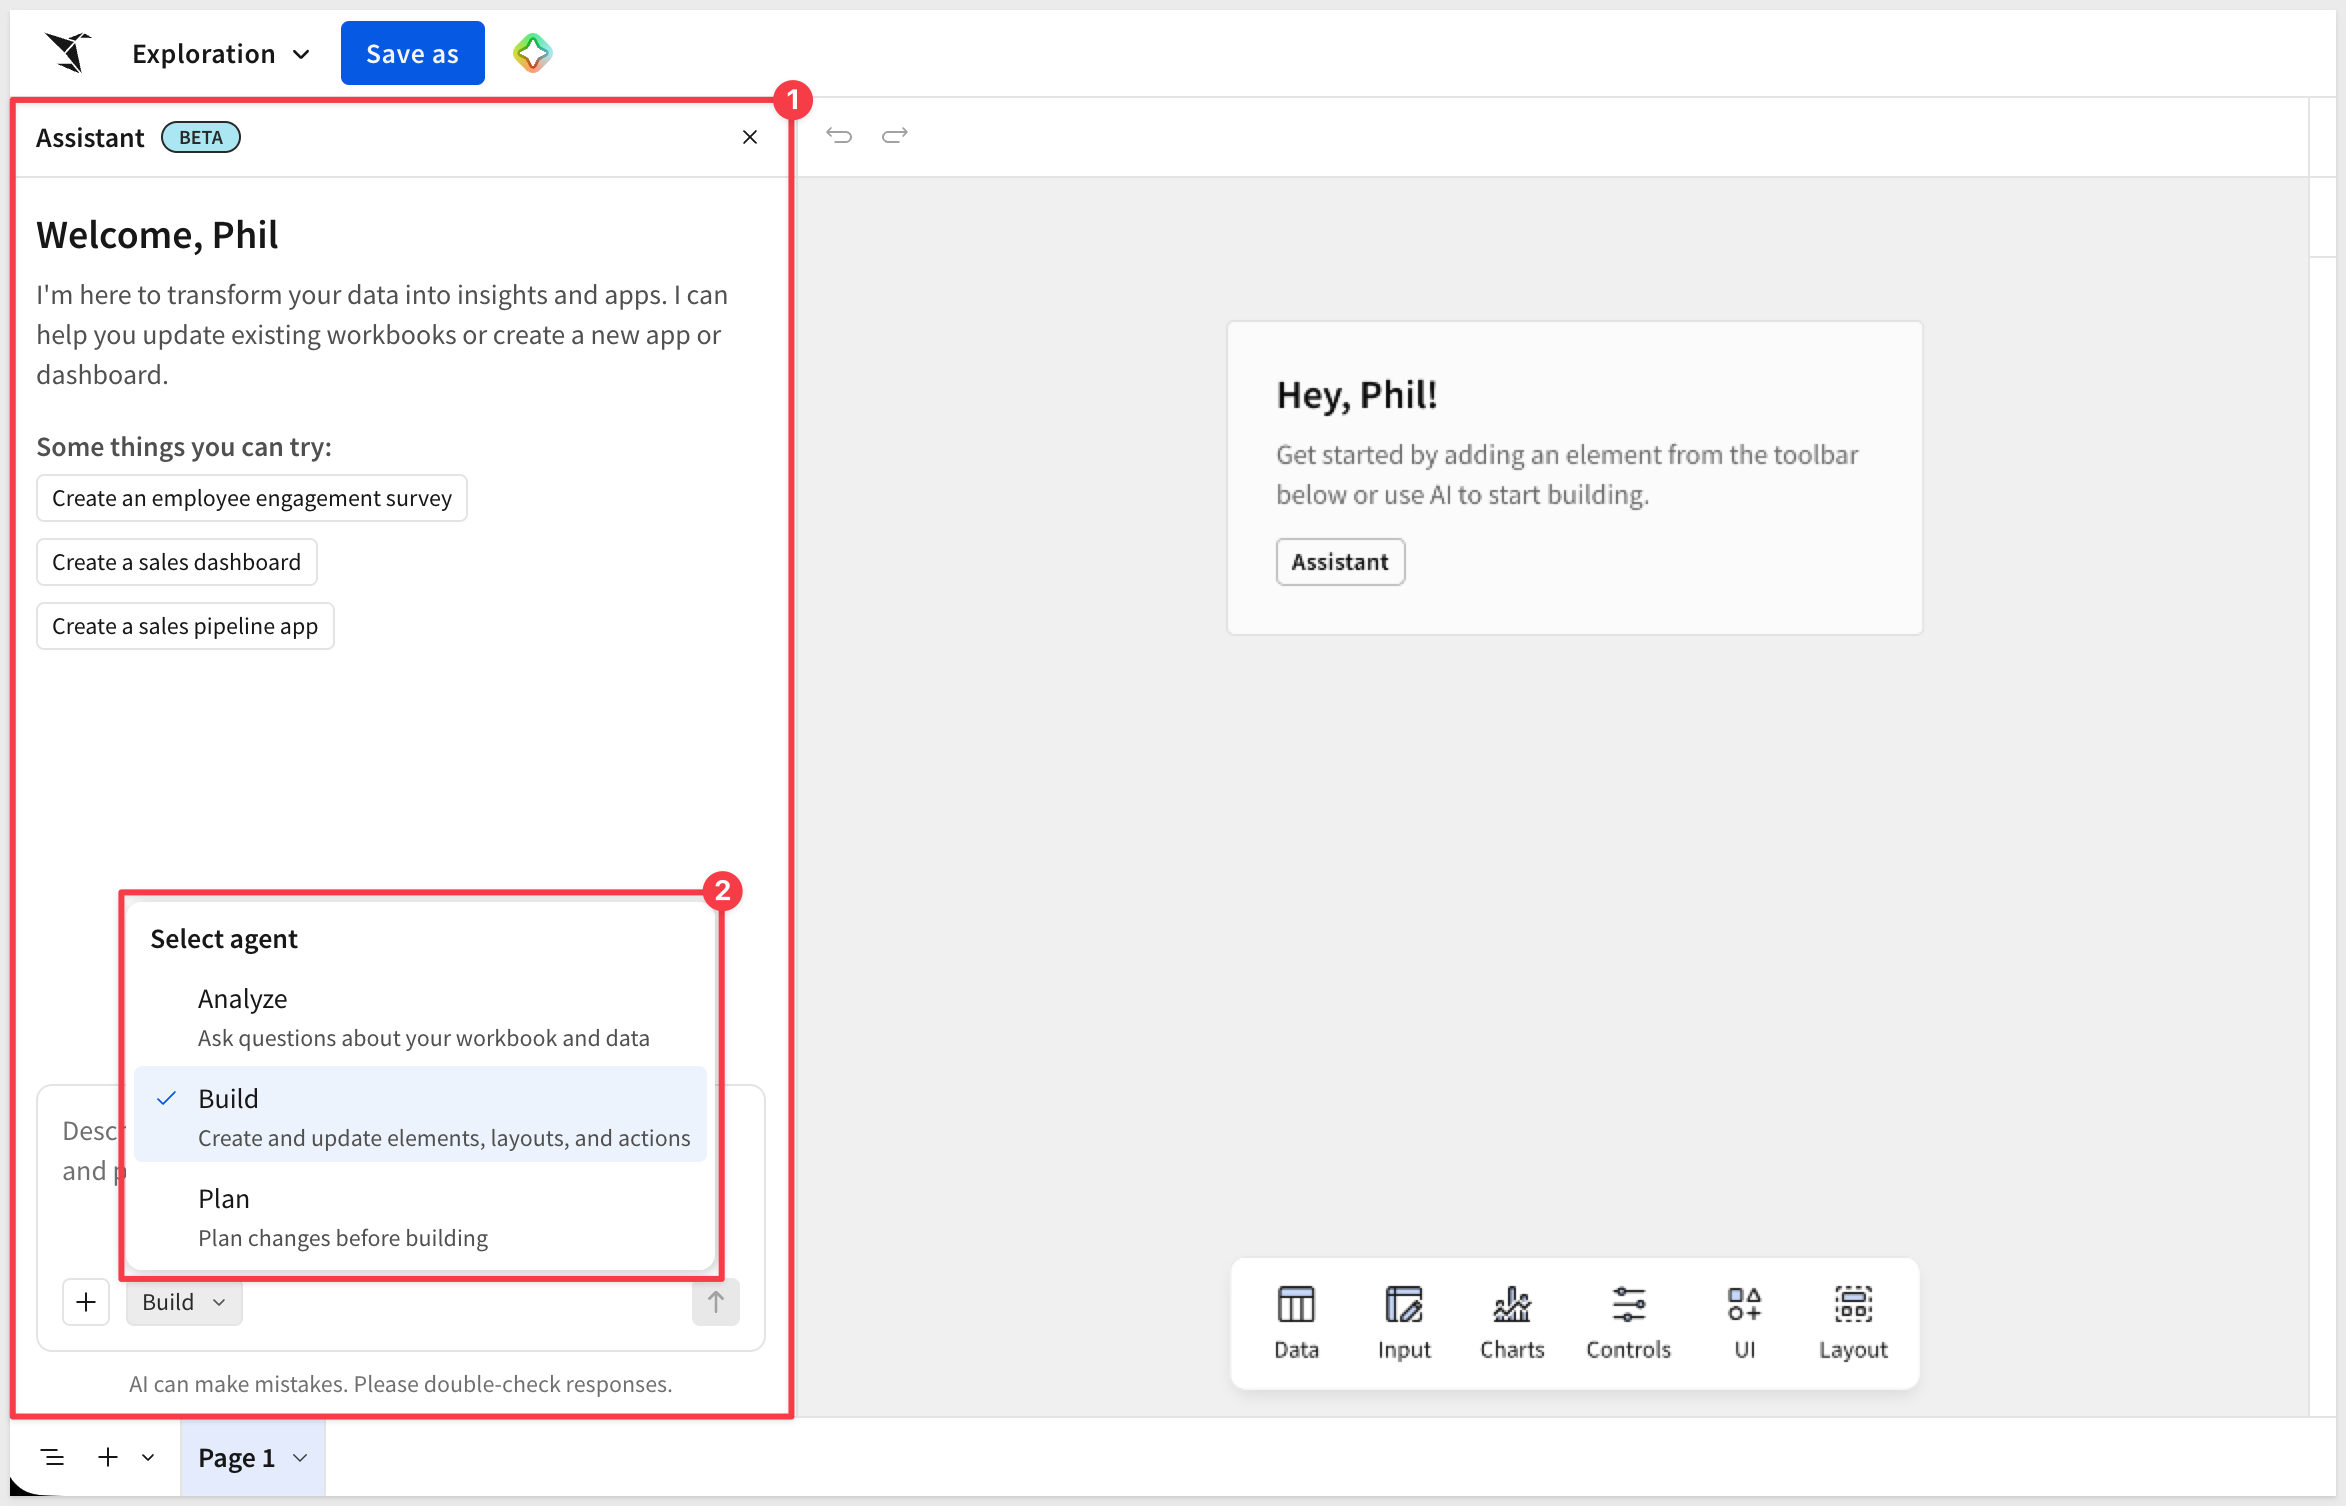
The previous section showed Assistant answering a question and returning results you open in a workbook. Inside a workbook draft, Assistant does more than analyze — it can plan and build for you. Using natural language, it designs and constructs dashboards and AI apps: tables, charts, KPIs, controls, filters, input tables, and even the actions that make an app interactive.
When editing a workbook draft, Assistant works in two additional modes:
- Plan mode — Assistant gathers context and proposes a structured approach — recommended pages, elements, layout, and the data sources needed — without changing anything yet. Scoping in
Planmode first also saves time and AI credits, since you settle the structure before Assistant builds anything. - Build mode — Assistant creates and modifies workbook content: elements, formatting, layout, navigation, filters, and actions.
You can switch between modes at any time, and Assistant keeps the conversation's context as you move from scoping to building.
Assistant is available from several entry points while editing a workbook draft: the empty-state prompt bar on a new page, the Assistant panel in the workbook header, the ⌘ + K / Ctrl + K keyboard shortcut, and the Ask or edit with prompt icon on an element's toolbar.
You can also attach context to any prompt — a specific data source, a page or element, or an image — so Assistant builds from exactly the right information. Attach a screenshot of a dashboard from any tool, and Assistant rebuilds it natively in Sigma.
We take this much further — one-shot dashboard building, editing an existing workbook conversationally, and building from images and plans — in the Build Dashboards and Apps with Sigma Assistant QuickStart
A Sigma agent is the simplest way to put an AI helper inside a specific workbook. You give it a few plain-language instructions ("you help our team understand customer call transcripts"), point it at the data you want it to work with, and add a chat element to the page so people can ask it questions. That's the whole setup — no code, no separate app to build.
What makes an agent powerful is everything it can do beyond answering a question. An agent can:
- Run an action you've already built in the workbook — insert a row, send a notification, update a control.
- Call a warehouse agent in Snowflake or Databricks for deeper analysis.
- Search a warehouse search service like Snowflake Cortex Search.
- Reach out through an MCP server to a system like SharePoint or Slack.
You decide which of those tools the agent is allowed to use, and the agent reaches for them when the conversation calls for it.
End users chat with the agent through a chat element on a workbook page. An agent can also run on its own as part of an automated action sequence — for example, a nightly run that summarizes what changed in the data and posts the summary to Slack.
For example, we can let users chat with AI directly from any Sigma page by adding a chat element and setting some rules for it. This brings the power of AI to users in a controlled manner, helping maintain security and governance guidelines:
When deciding which AI surface fits a task:
- Sigma Assistant is for general data analysis with minimal setup, across the data sources an admin has enabled.
- Sigma agents are for a specific job in a specific workbook — with custom instructions, a focused set of data, and the tools you've chosen to let the agent use.
- Warehouse agents are for cases where you've already built an agent in your data platform; they can be called from Sigma Assistant or used as a tool inside a Sigma agent.
A Sigma agent runs its queries as the user who's chatting with it, so role-based access control stays in force — an agent can't see data the user couldn't already see.
For more information, see Build Sigma agents
What is an MCP server?
MCP stands for Model Context Protocol — an open standard that allows AI assistants to connect to external tools and data sources in a structured, secure way. Think of it as a universal adapter: instead of an AI assistant being limited to what it already knows, MCP lets it reach out to live systems and work with real data in real time.
The Sigma MCP Server implements this protocol for Sigma. Once configured, Claude can search your Sigma environment, inspect data structures, and run queries against your connected warehouse — all without you opening Sigma in a browser.
What this means for Sigma users
The AI features covered so far — Formula Assistant, Sigma Assistant, Building with Assistant, and Sigma agents — work inside Sigma. You open a workbook, ask a question, and the answer appears in context.
The MCP Server flips that around. You stay in your AI tool and bring Sigma to it. The core workflow is:
- Discover: Search for documents, data models, workbooks, and tables across your Sigma organization.
- Describe: Inspect the structure of any table or data model — column names, types, and definitions.
- Query: Run natural language queries against any data source you have access to, without writing SQL.
This is particularly useful for analysts and developers who already work in AI-assisted environments and want Sigma data available in that same context.
Setup
The Sigma MCP Server is available to all Sigma customers today via Claude's MCP registry. This provides a pre-configured MCP server that connects Claude to Sigma.
Required from Sigma
We need two pieces of information from Sigma so that we can provide them to Claude.
Copy these two values to a text file for use in Claude later.
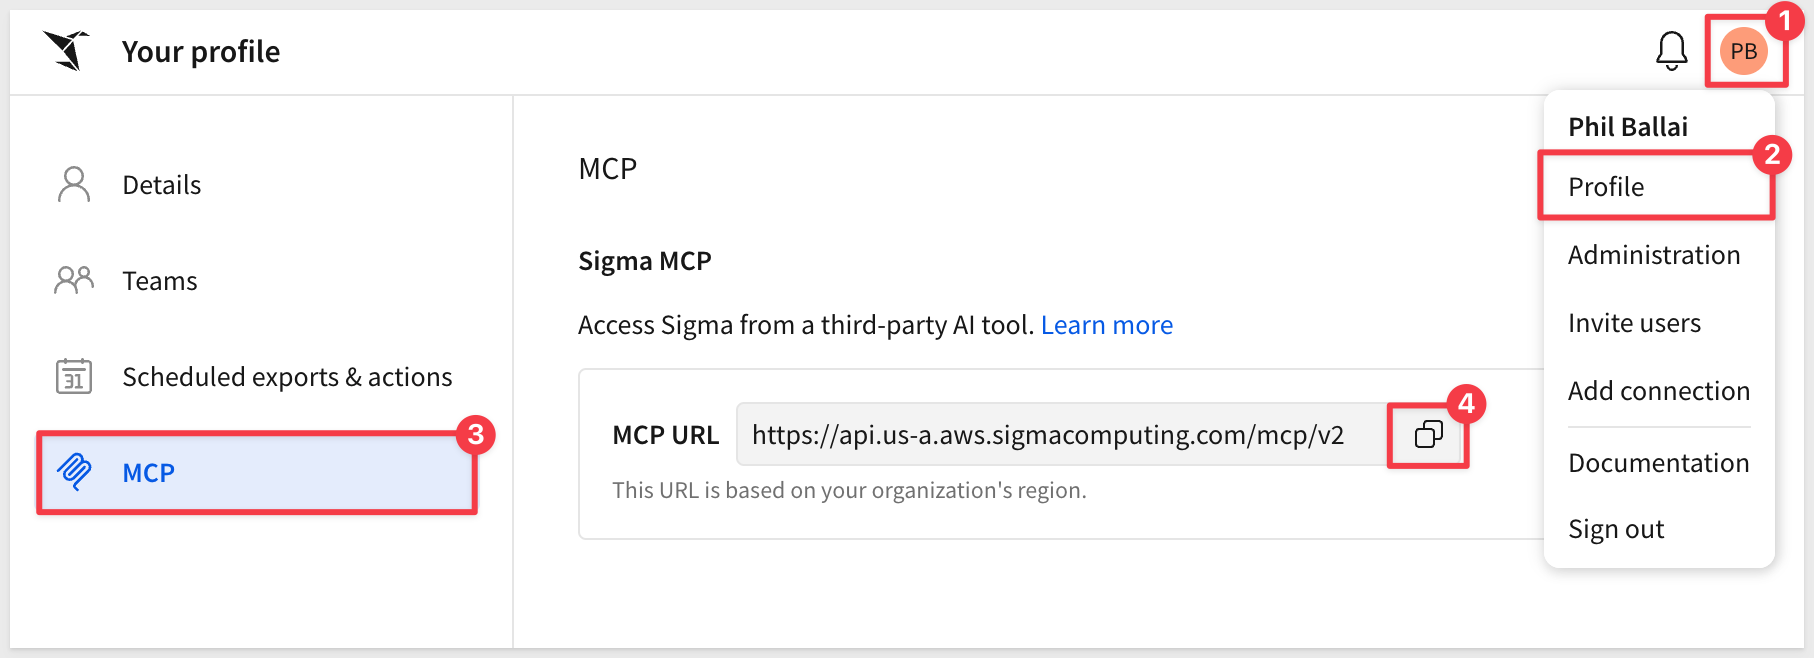
- MCP URL:
Log into Sigma and click the profile icon in the upper left corner and selectMCP. Click the copy icon and save the value off to a text file.
- Organization name:
This is part of the URL Sigma is using in your browser; for example:
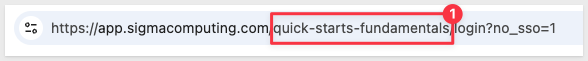
Copy your value off to a text file.
Claude setup
Log into Claude using your browser.
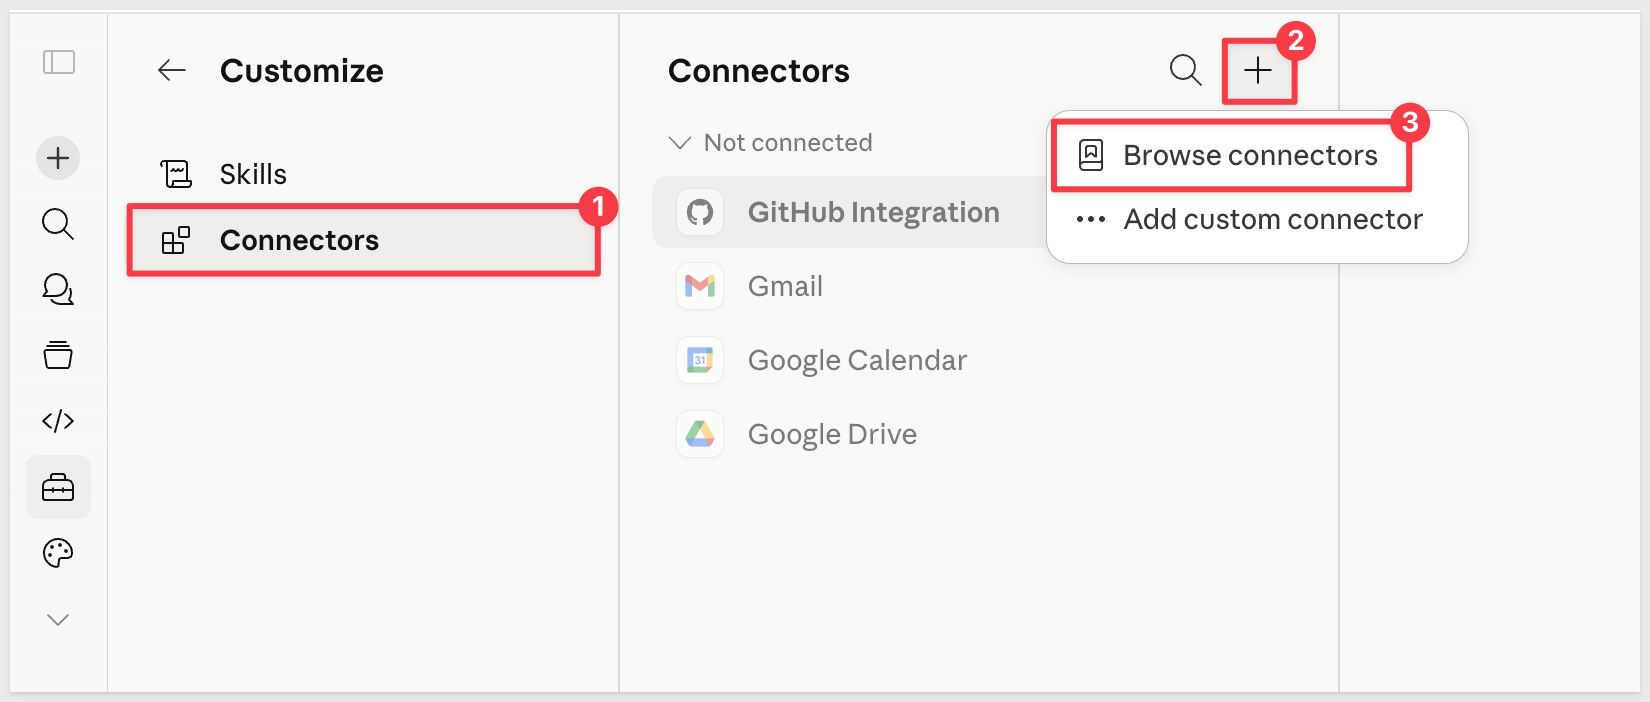
- In Claude, click
Customizefrom the left sidebar:
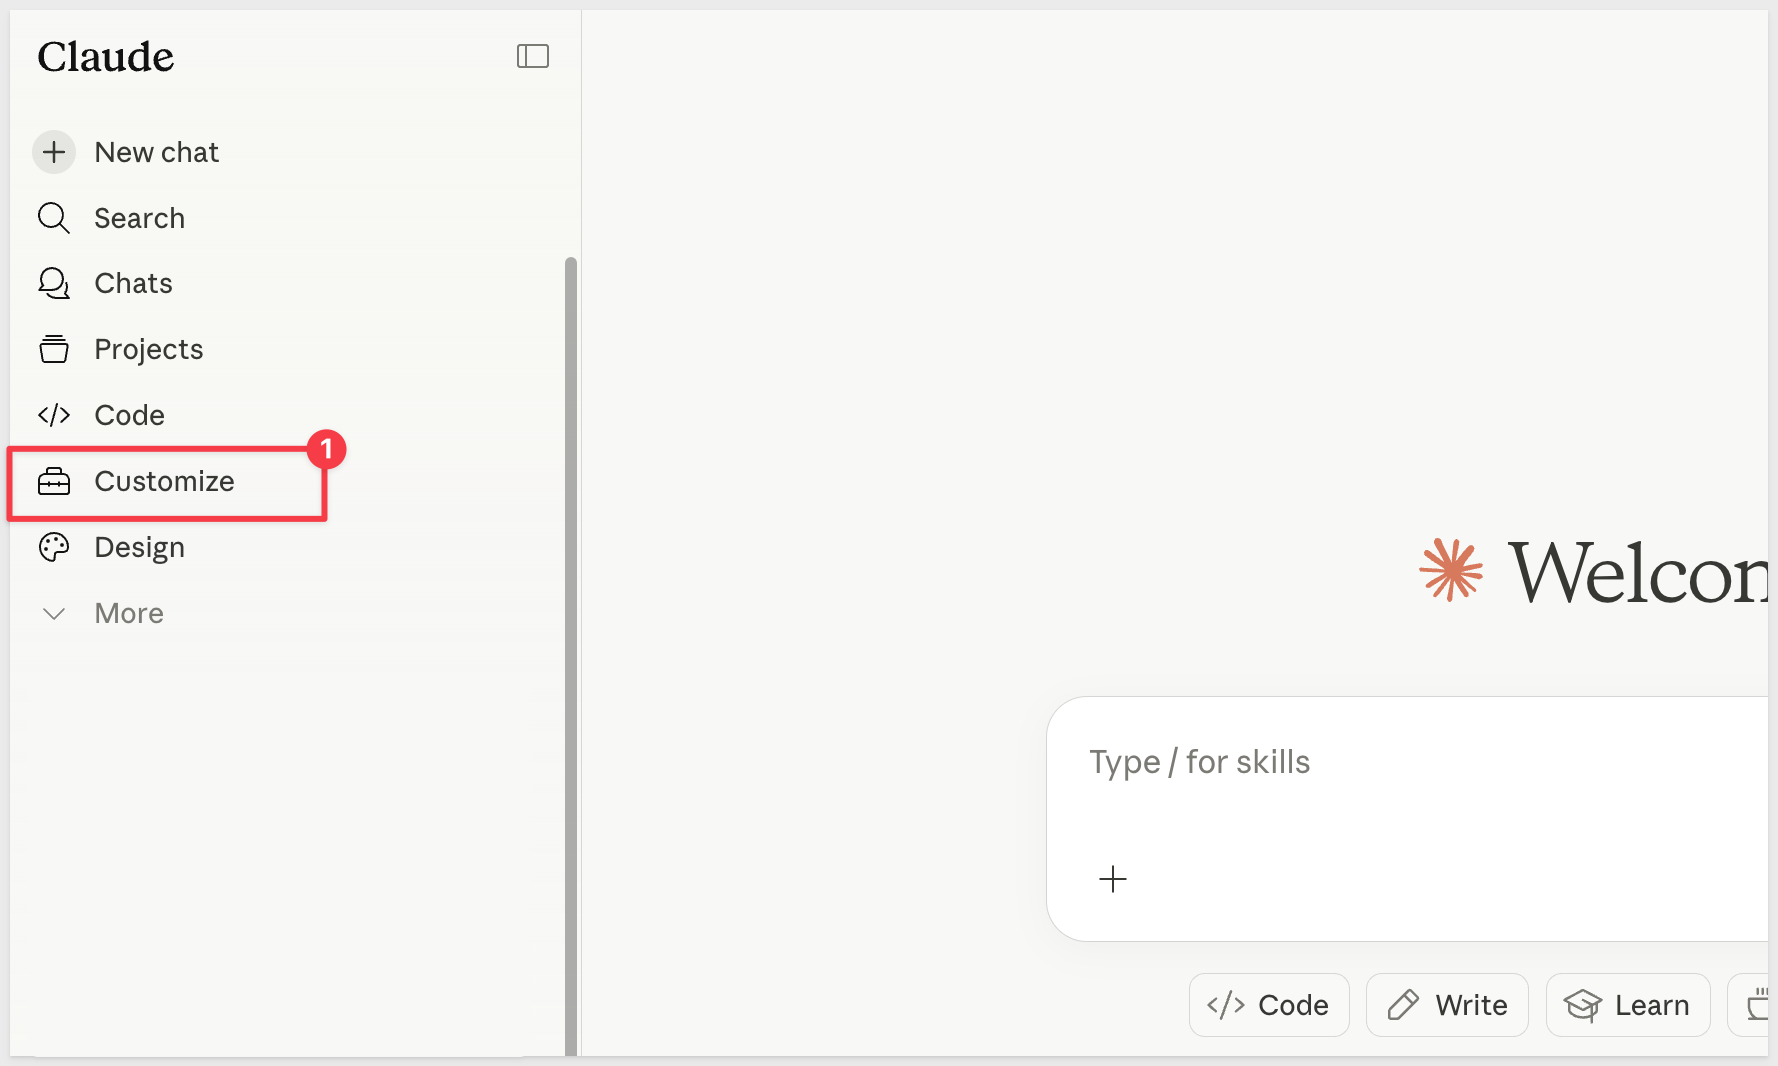
Under Customize click Connectors, + and Browse connectors:
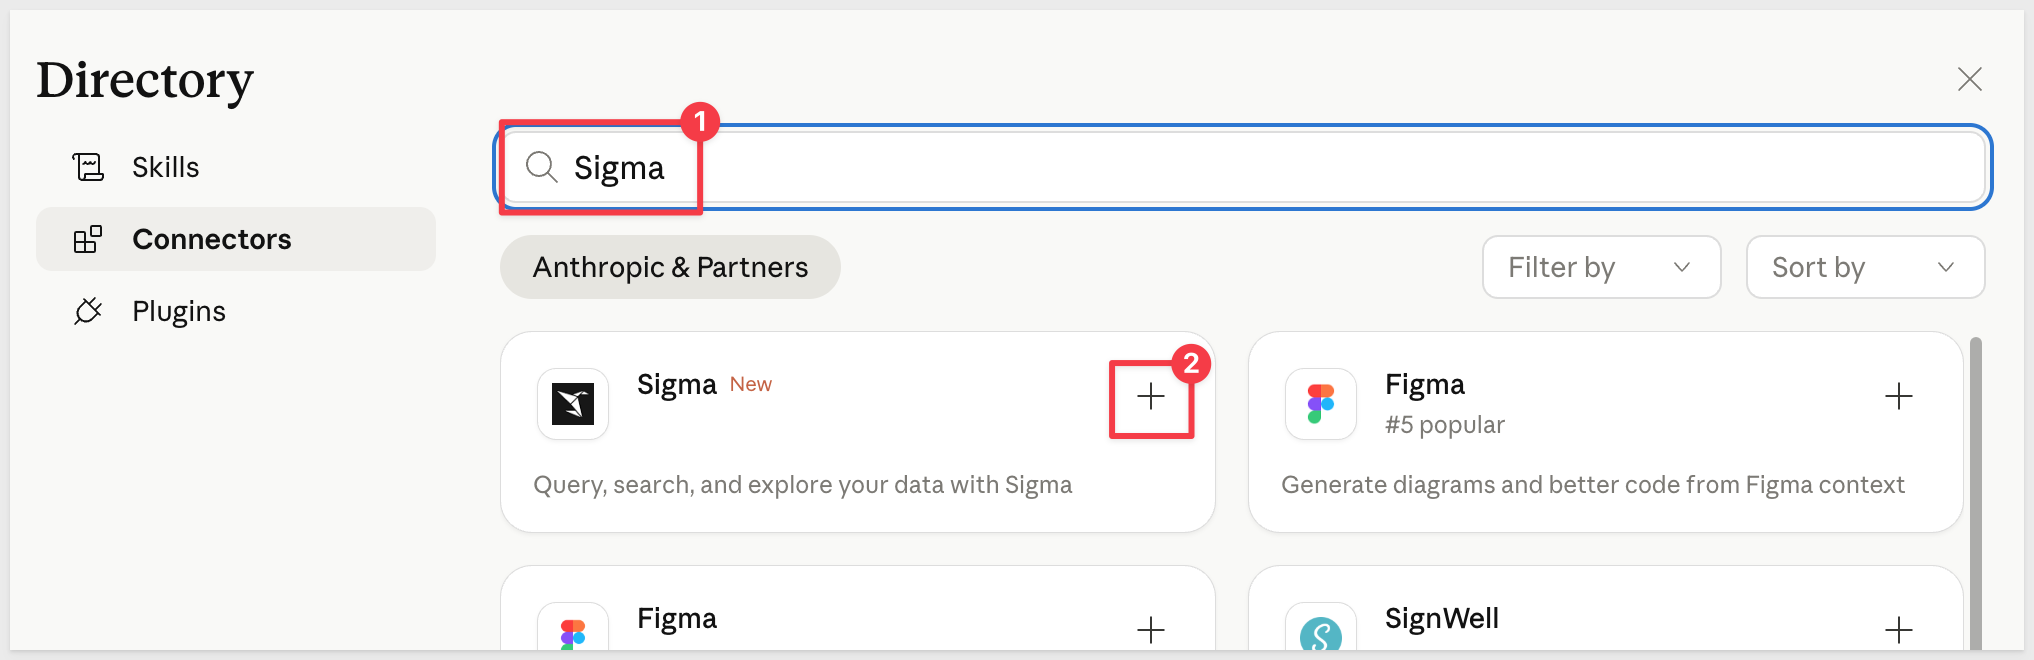
- Search for
Sigmaand click+:
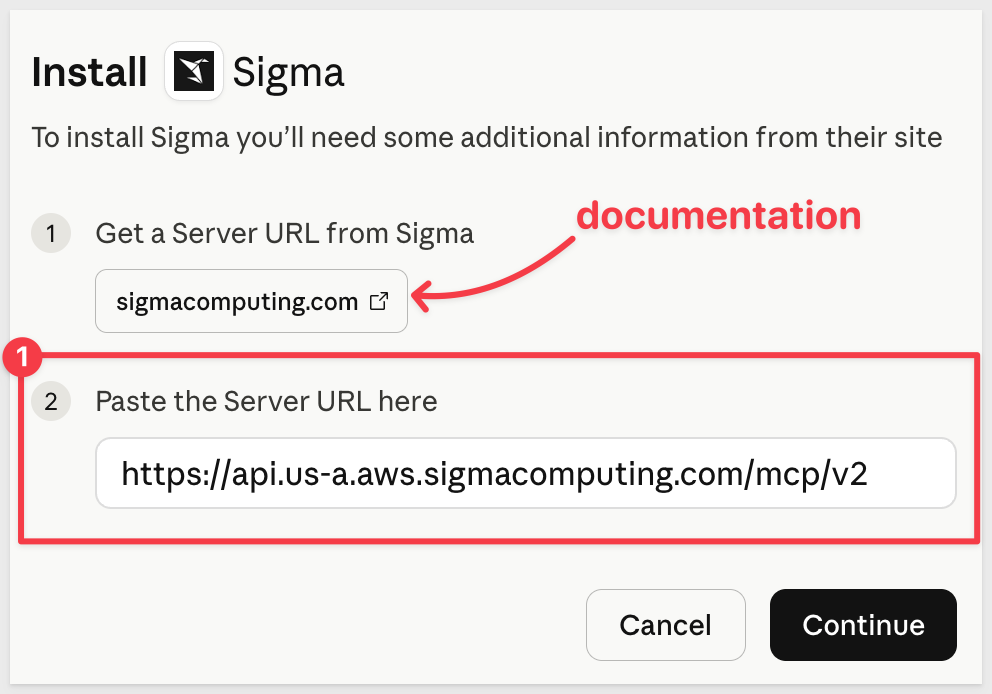
- Paste the
MCP URLcopied from Sigma into Claude and clickContinue:
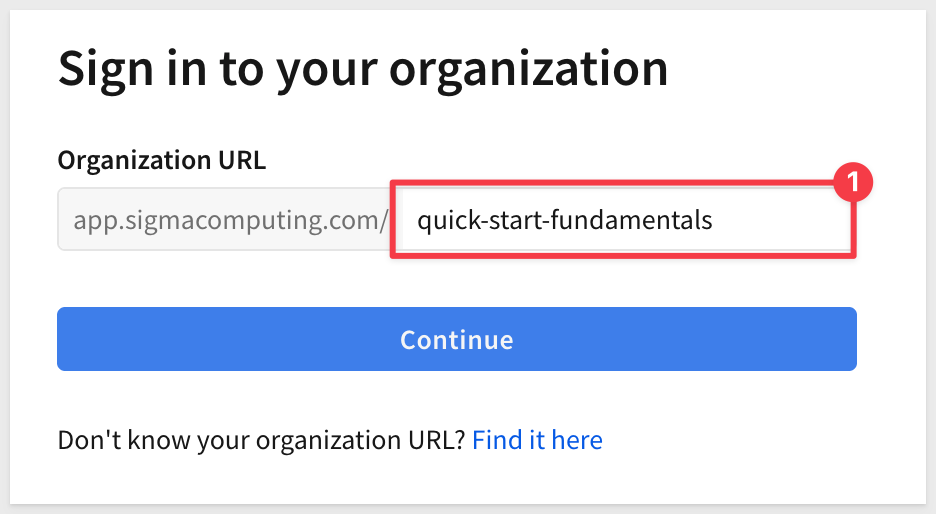
- Add your Sigma organization name and click
Continue:
Provide your Sigma credentials and log in.
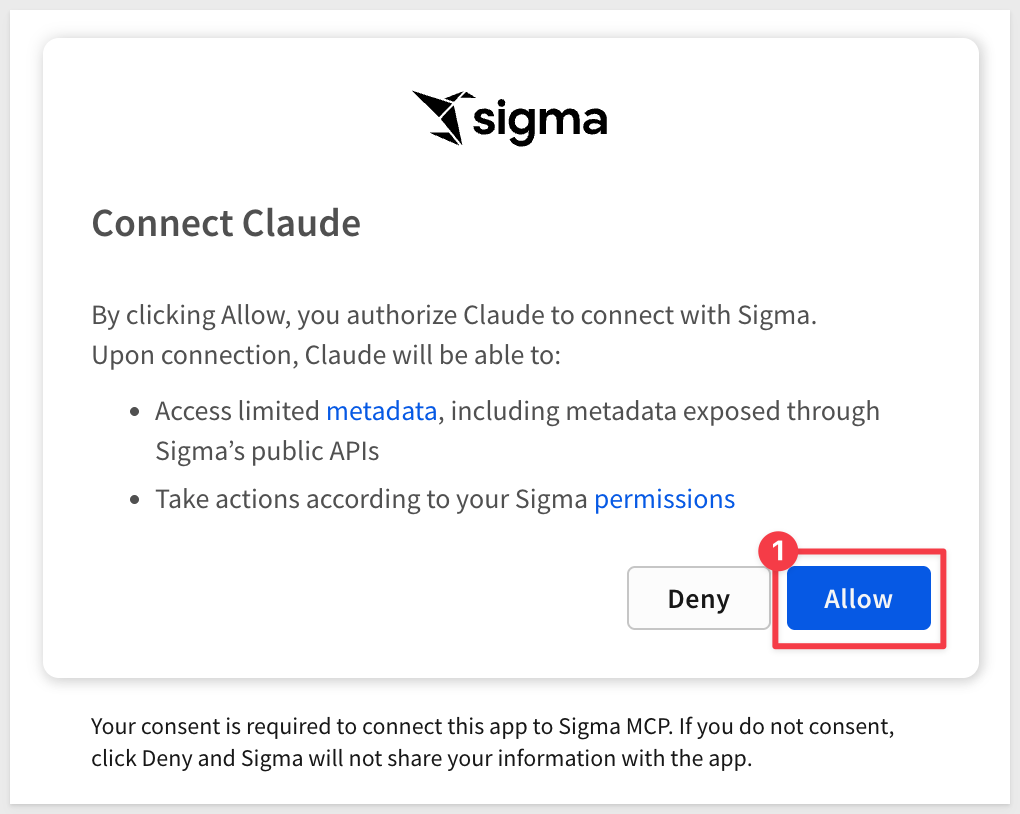
- When prompted by Claude, click
Allow:
If successful, we can Approve the operations Sigma will permit via Claude. For testing we selected Always allow for all tools:
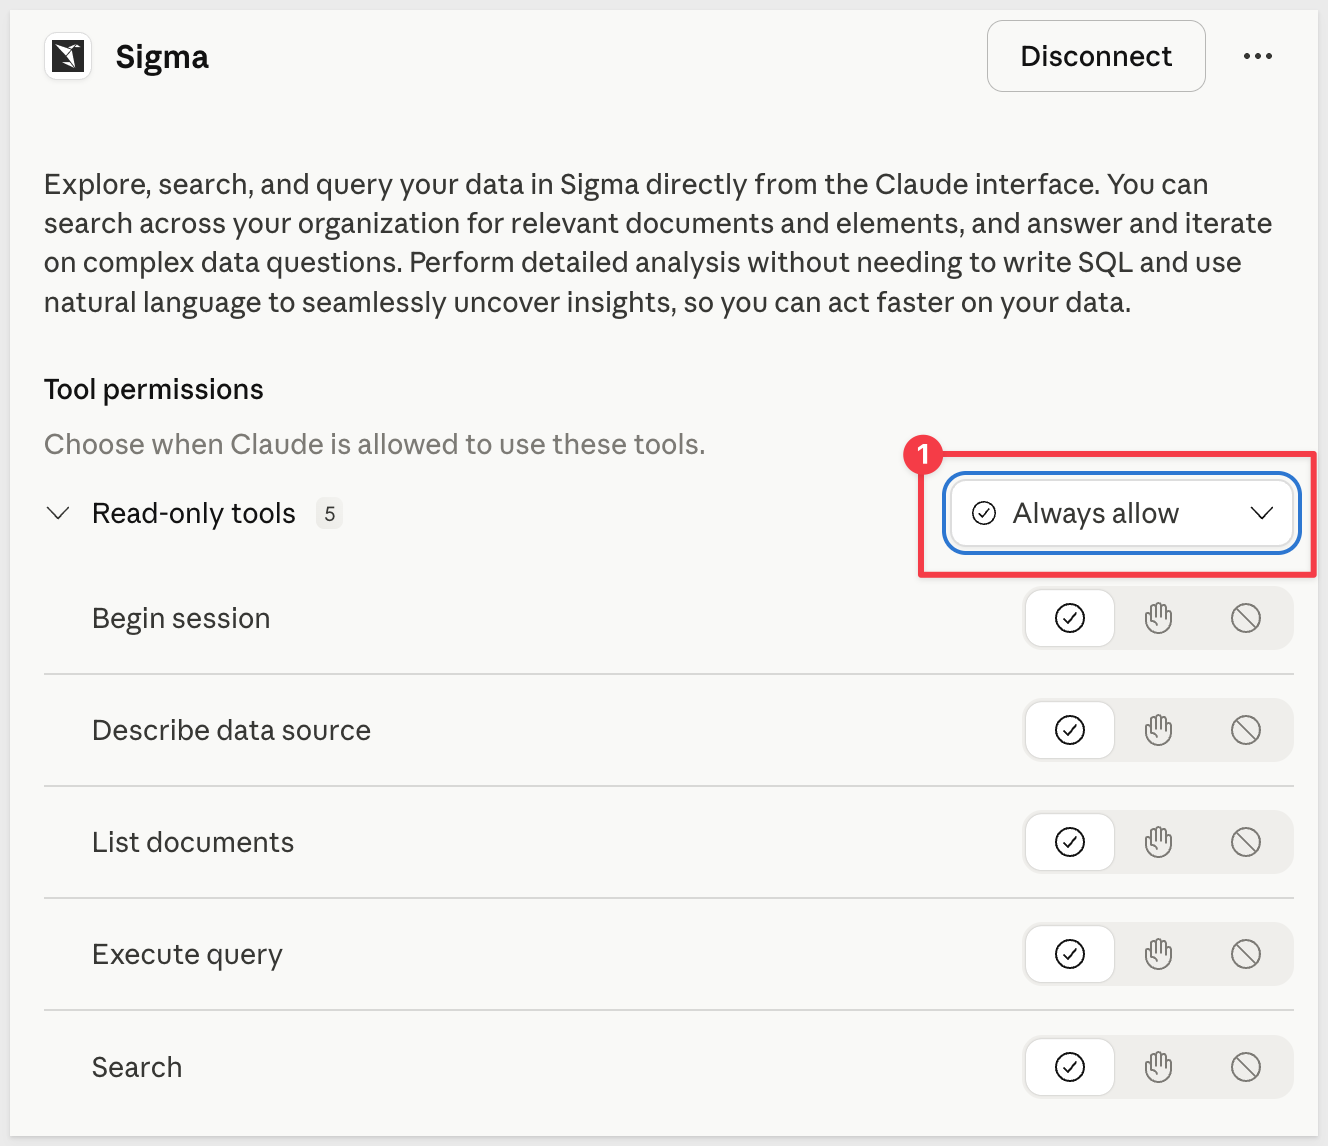
Now Claude can interact with your Sigma environment using plain language. We can also decide which tool permissions we want to allow.
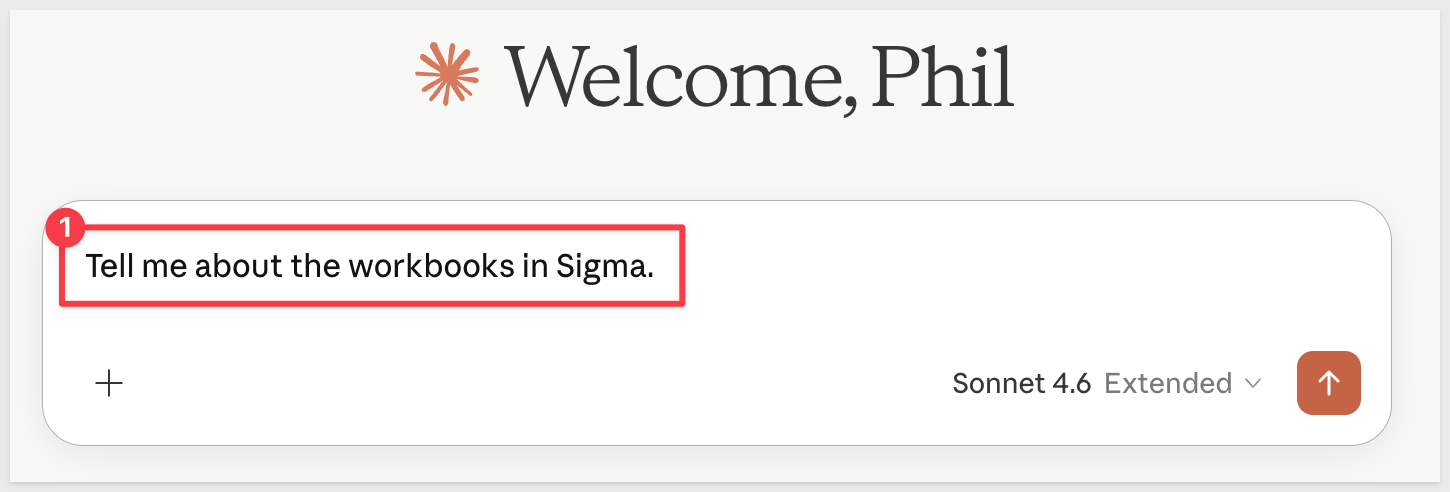
- We ask a simple question about our Sigma instance, which is a new trial and has only one workbook currently:
Since Claude has access, it is able to find the workbook and describe it to us:
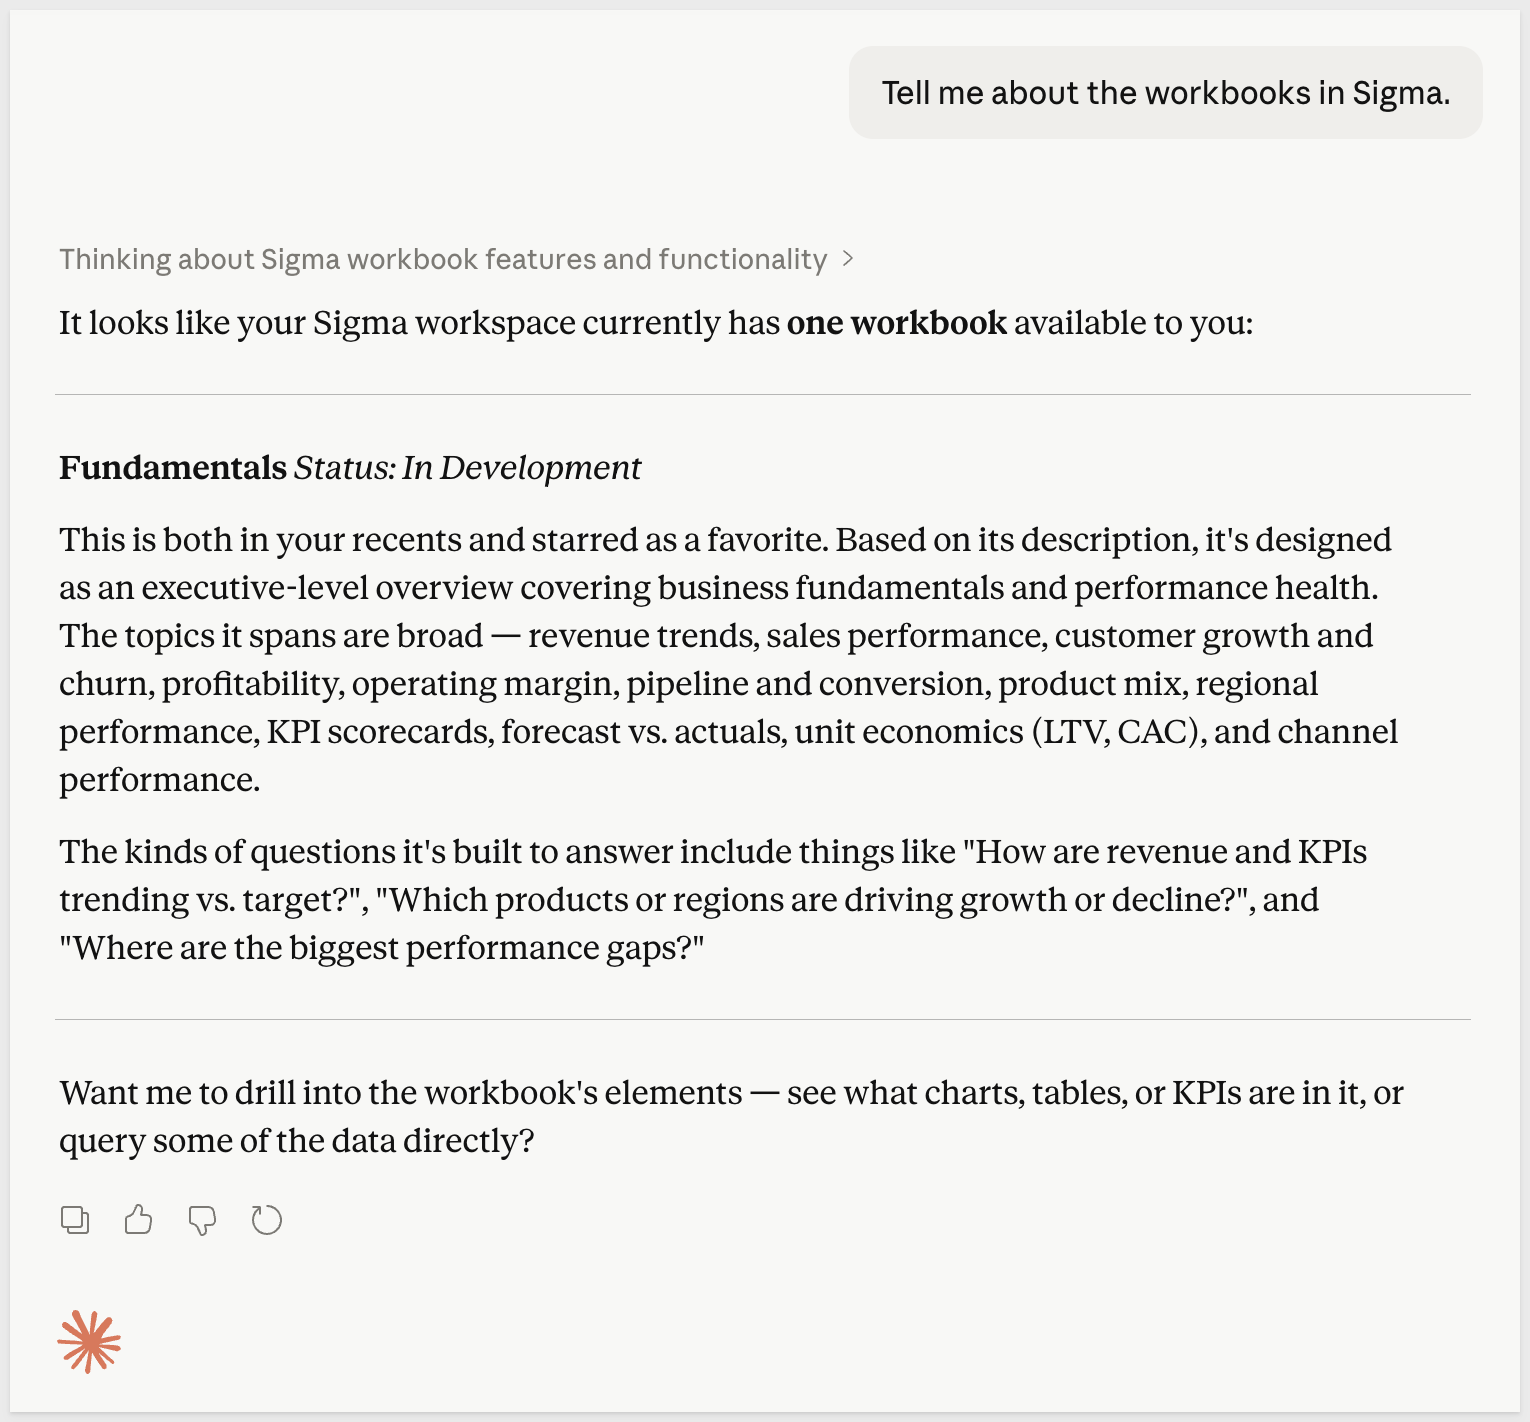
The value here is in the workflow. Instead of switching between Claude and Sigma to answer a data question, you stay in one place. Claude handles the discovery and query work, and you get answers grounded in your actual, live Sigma data — not a training dataset or a cached snapshot.
For teams that already work in AI-assisted environments, this means Sigma data becomes a natural part of that workflow rather than a separate tool you have to open.
For full setup instructions, see Use the Sigma MCP Server
For a hands-on walkthrough — including how to configure a Claude Project with org-specific context, search your Sigma environment, and run natural language queries against live data — see Natural Language Analytics with Claude and Sigma.
A workbook is where analysis happens in Sigma. It can hold tables, charts, controls, text, and apps — all organized across one or more pages, all connected to live data.
In this section, you'll create a workbook from scratch, add data from the Sigma Sample Database, and walk through the key concepts: the exploration state, saving, the workbook interface, and the publish workflow.
Create a new workbook
From the Sigma home page, click Create New in the left sidebar, then select Workbook.
Sigma opens a blank workbook in the exploration state. You'll notice there's no name yet — the workbook doesn't exist in your files until you choose to save it.
Workbook settings
Before adding any data, it's worth knowing that workbooks have their own settings that control how they look and behave. Click the Workbook Settings button in the element panel:
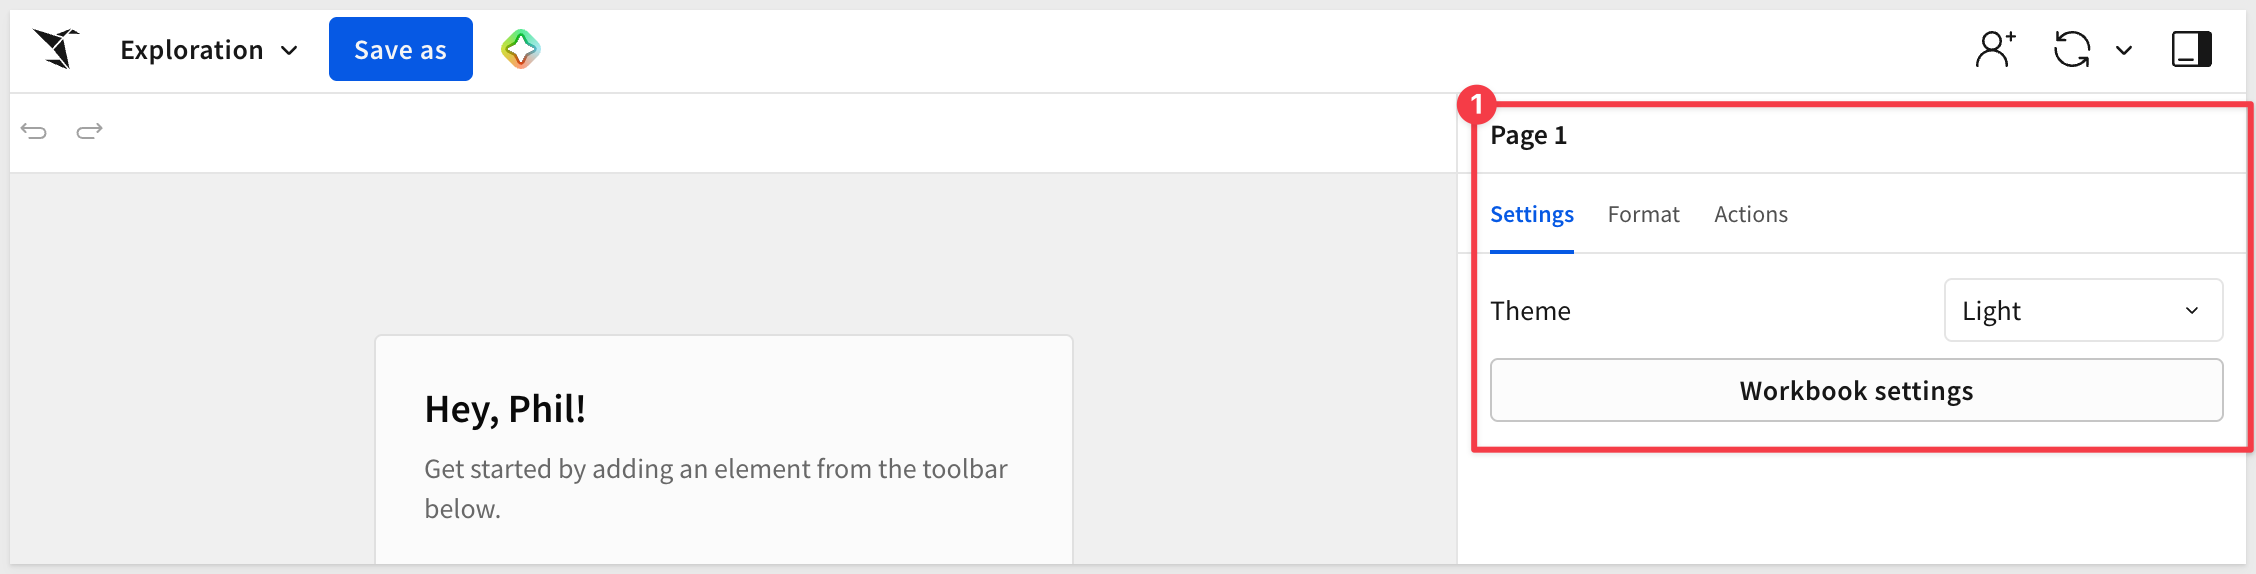
The settings panel is organized into expandable sections:
- Theme: Set a Light or Dark theme for the workbook.
- Color: Configure the color palette used across charts and visualizations.
- Font: Set the default font family and size for text elements.
- Layout Style: Control padding, spacing, and canvas behavior.
- Table Style: Set default styling for table elements — borders, row height, header appearance.
- Layout Settings: Configure how the workbook scales and responds across screen sizes.
- Workbook Navigation: Enable and configure in-workbook navigation menus for viewers.
At the bottom of the panel, Manage locales allows you to configure number and date formatting for different regional audiences.
These settings apply to the entire workbook and can be adjusted at any time.
Another "nice-to-have" feature allows you to hide the Element panel to provide more working surface. There are times when this can be useful:
For more information, see Workbook settings overview
Add data
Let's add a table to the workbook. Open the Data group on the Element bar and drag/drop (or just click) a Table onto the canvas:
Resizing and arranging elements is really simple as is selecting the source of the data from the warehouse.
Data can be sourced from suggestions made by Sigma (based on recent activity), other elements in the workbook or from any available connection.
As shown in the gif, search for Hands and choose the PLUGS_ELECTRONICS_HANDS_ON_LAB_DATA table from the RETAIL schema.
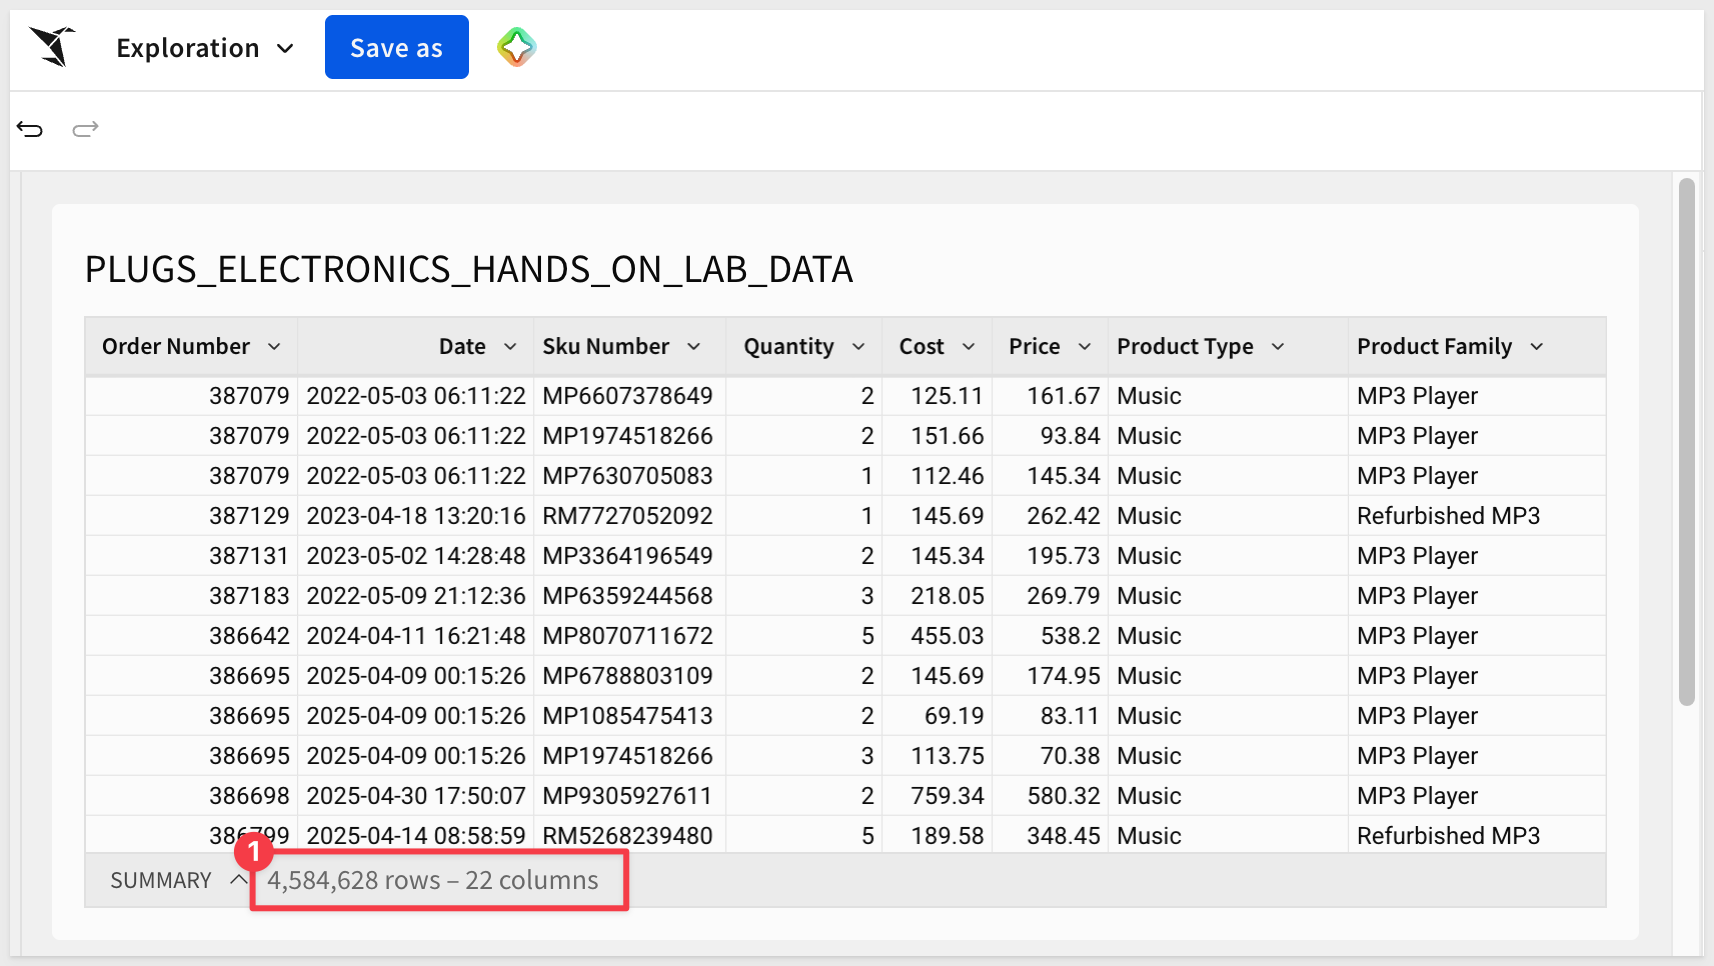
Sigma adds the table to the canvas and pulls the data live from the cloud data warehouse. You're not working with a copy or a snapshot — the data reflects whatever is in the warehouse at query time.
Notice that this table is over 4.5 million rows and 22 columns:
The workbook interface
With the table on the canvas, take a moment to get oriented.
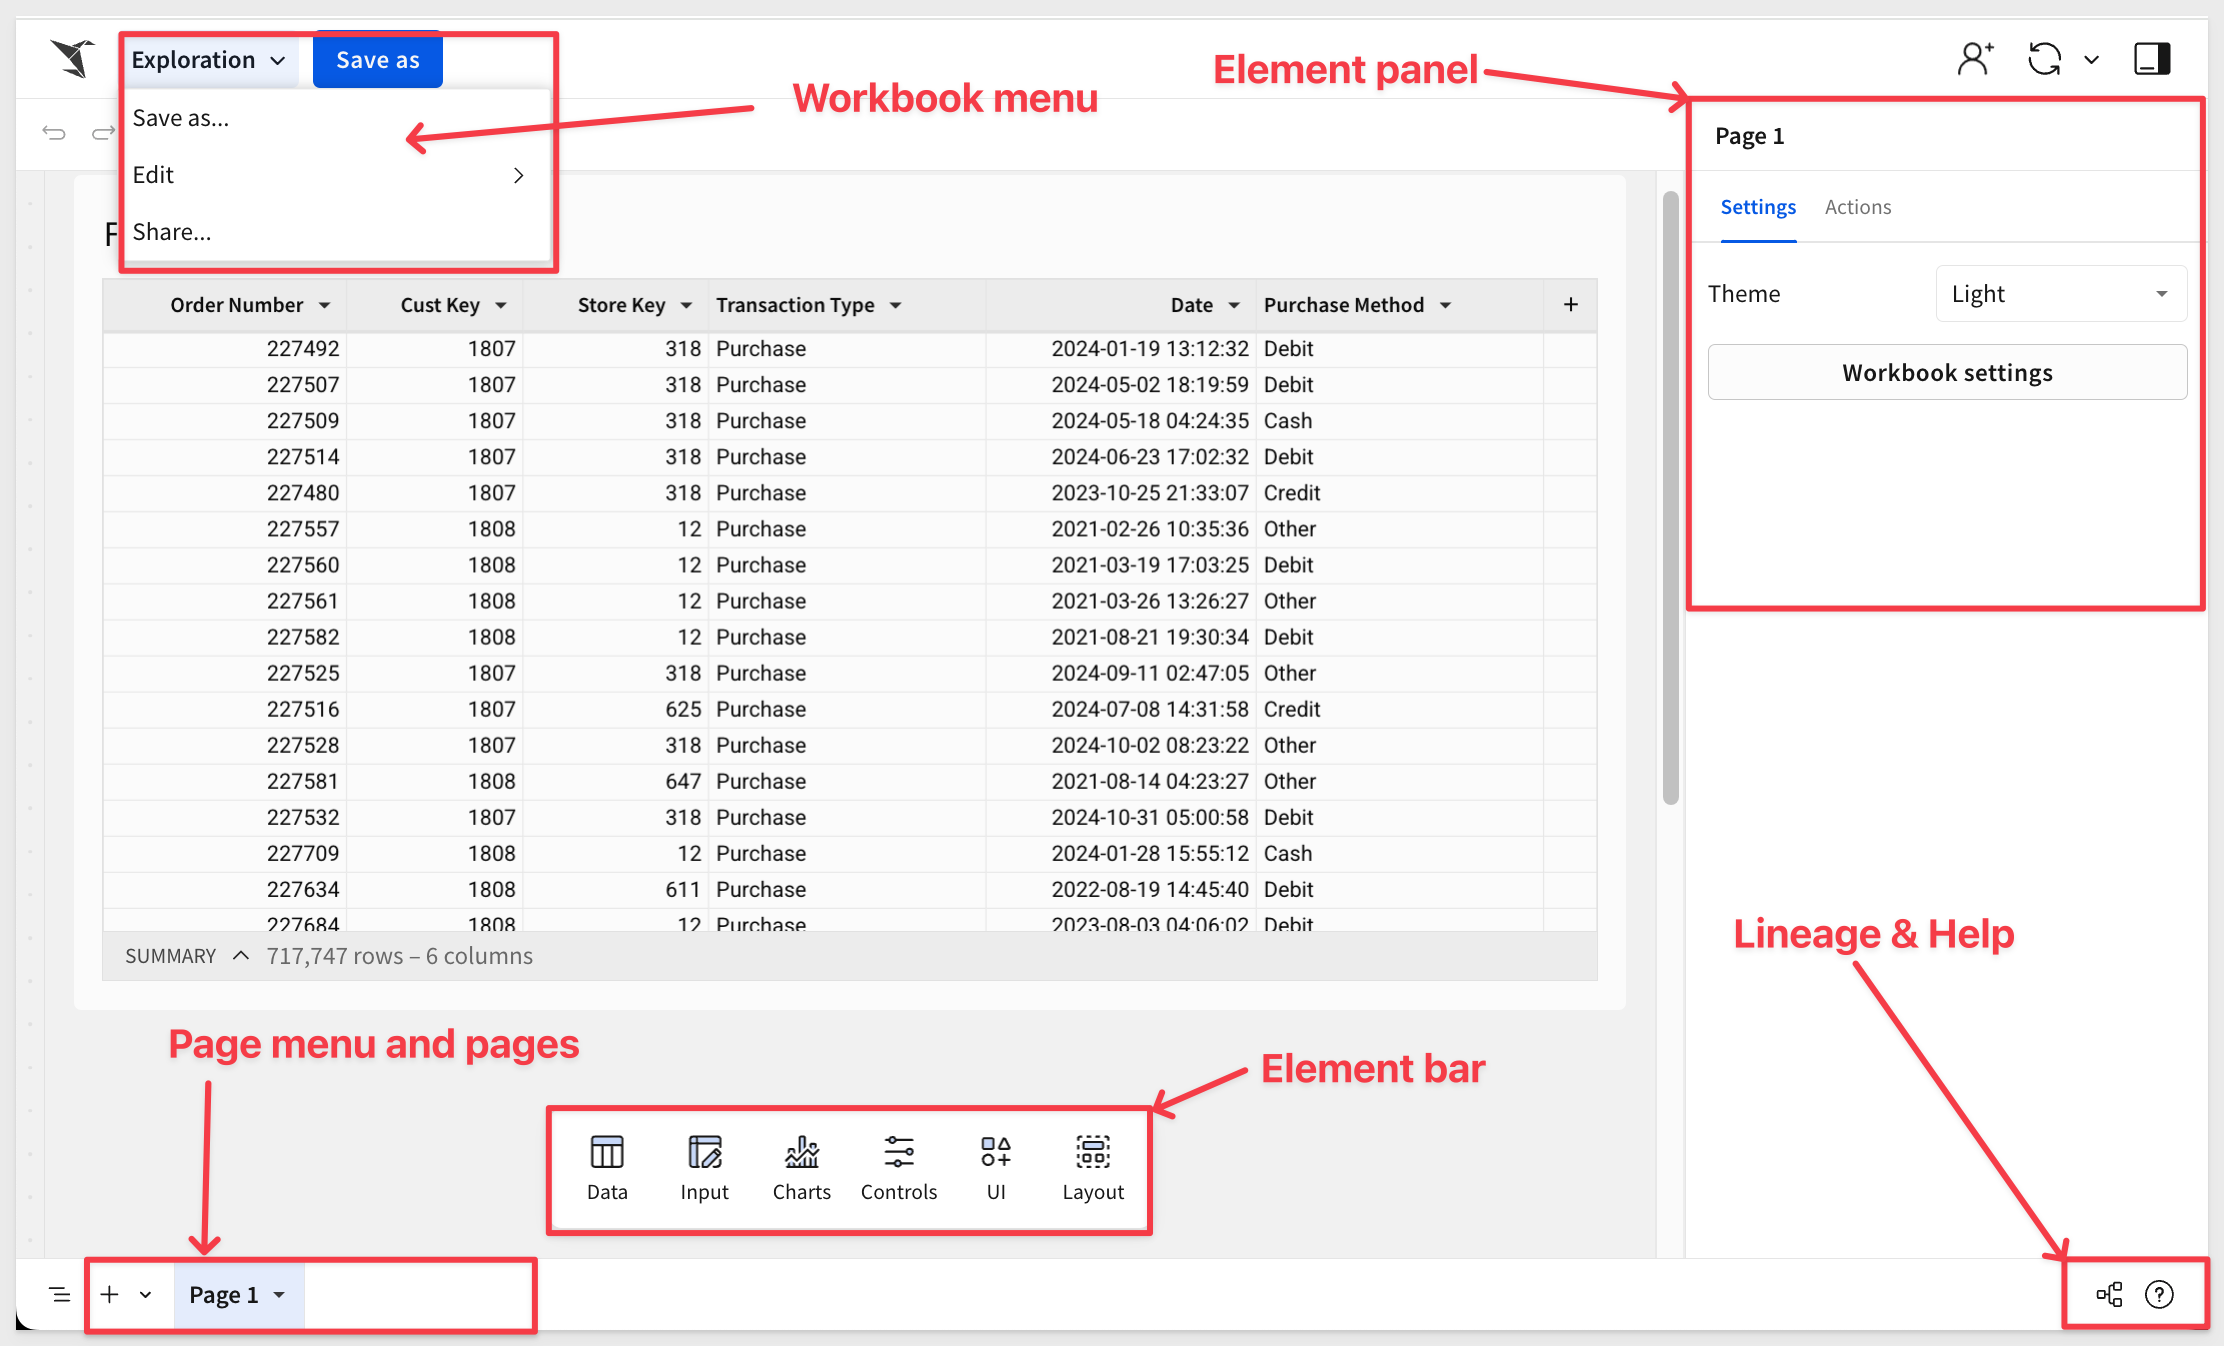
Each workbook can have one or more pages. Each page has its own canvas. The table you just added is on Page 1.
Objects on the canvas are called elements — tables, charts, controls, text, buttons, and so on.
When an element on the canvas is selected, it will have a blue border and the Element Panel will show the related configuration:
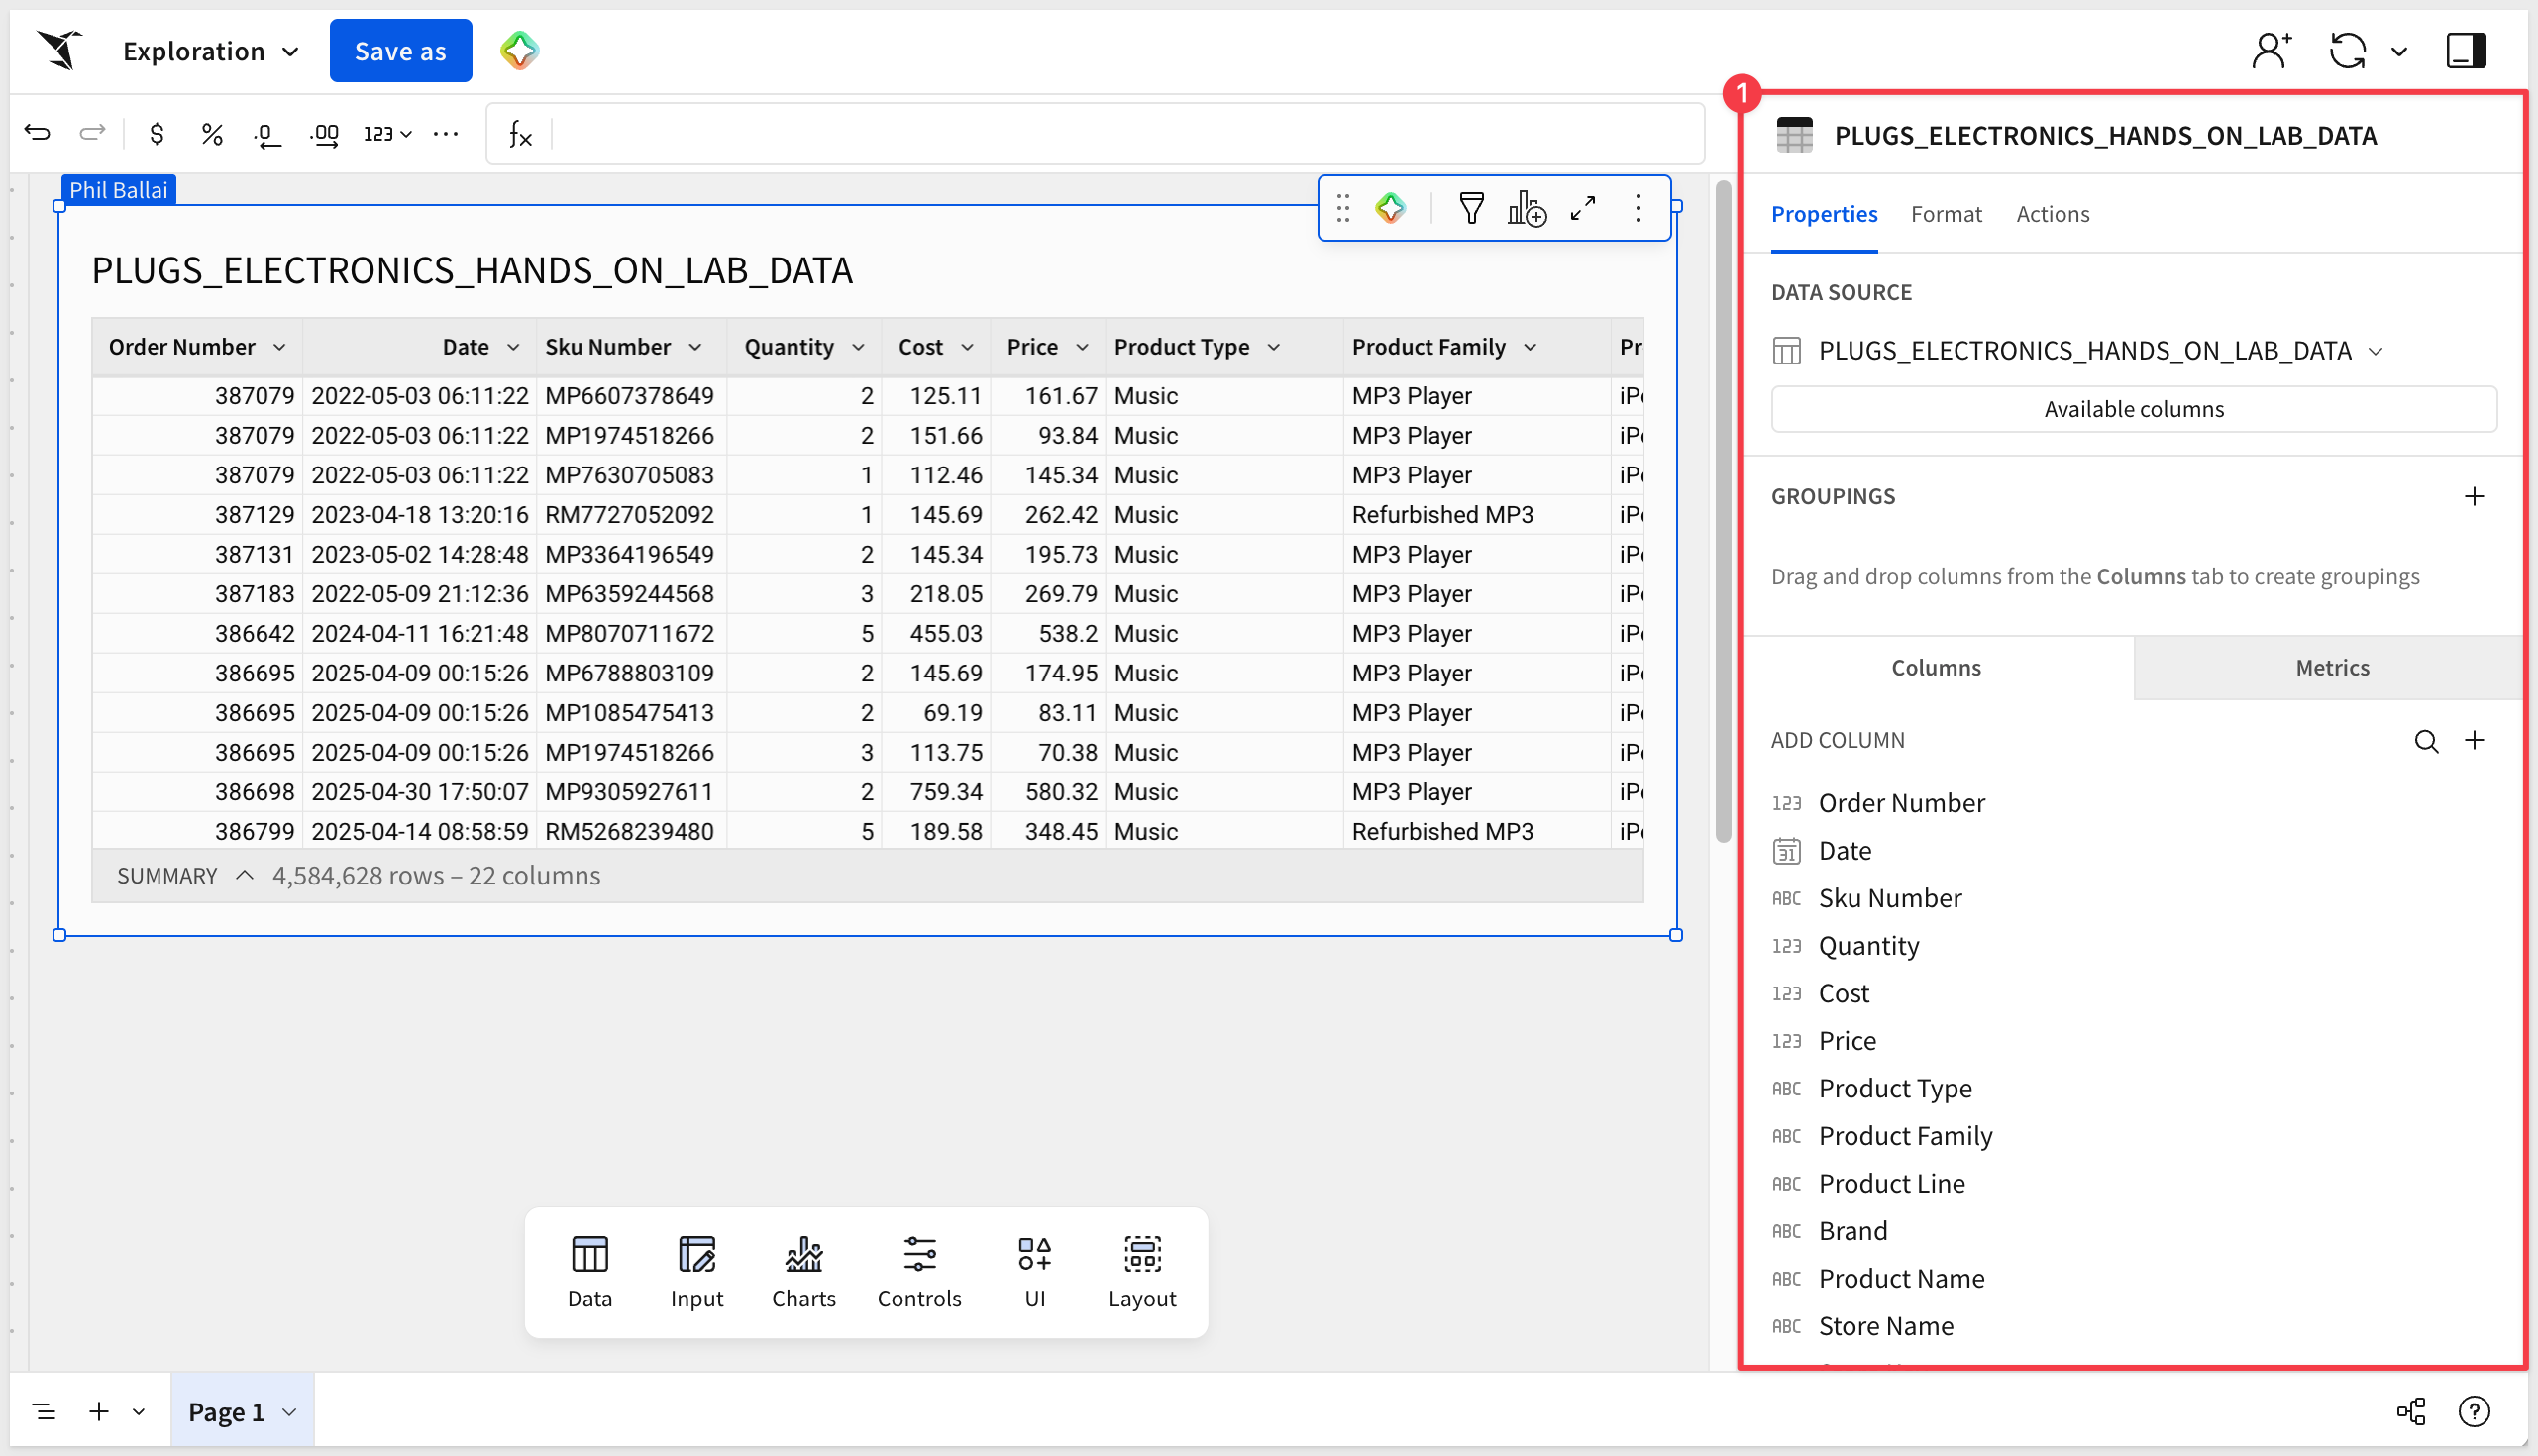
The titles of elements on the page can easily be renamed by double-clicking the name. For example, change the PLUGS_ELECTRONICS_HANDS_ON_LAB_DATA title to Sales Transactions.
When the Sales Transactions table > Order Number column is selected, we can access the Toolbar, Formula bar and Element features.
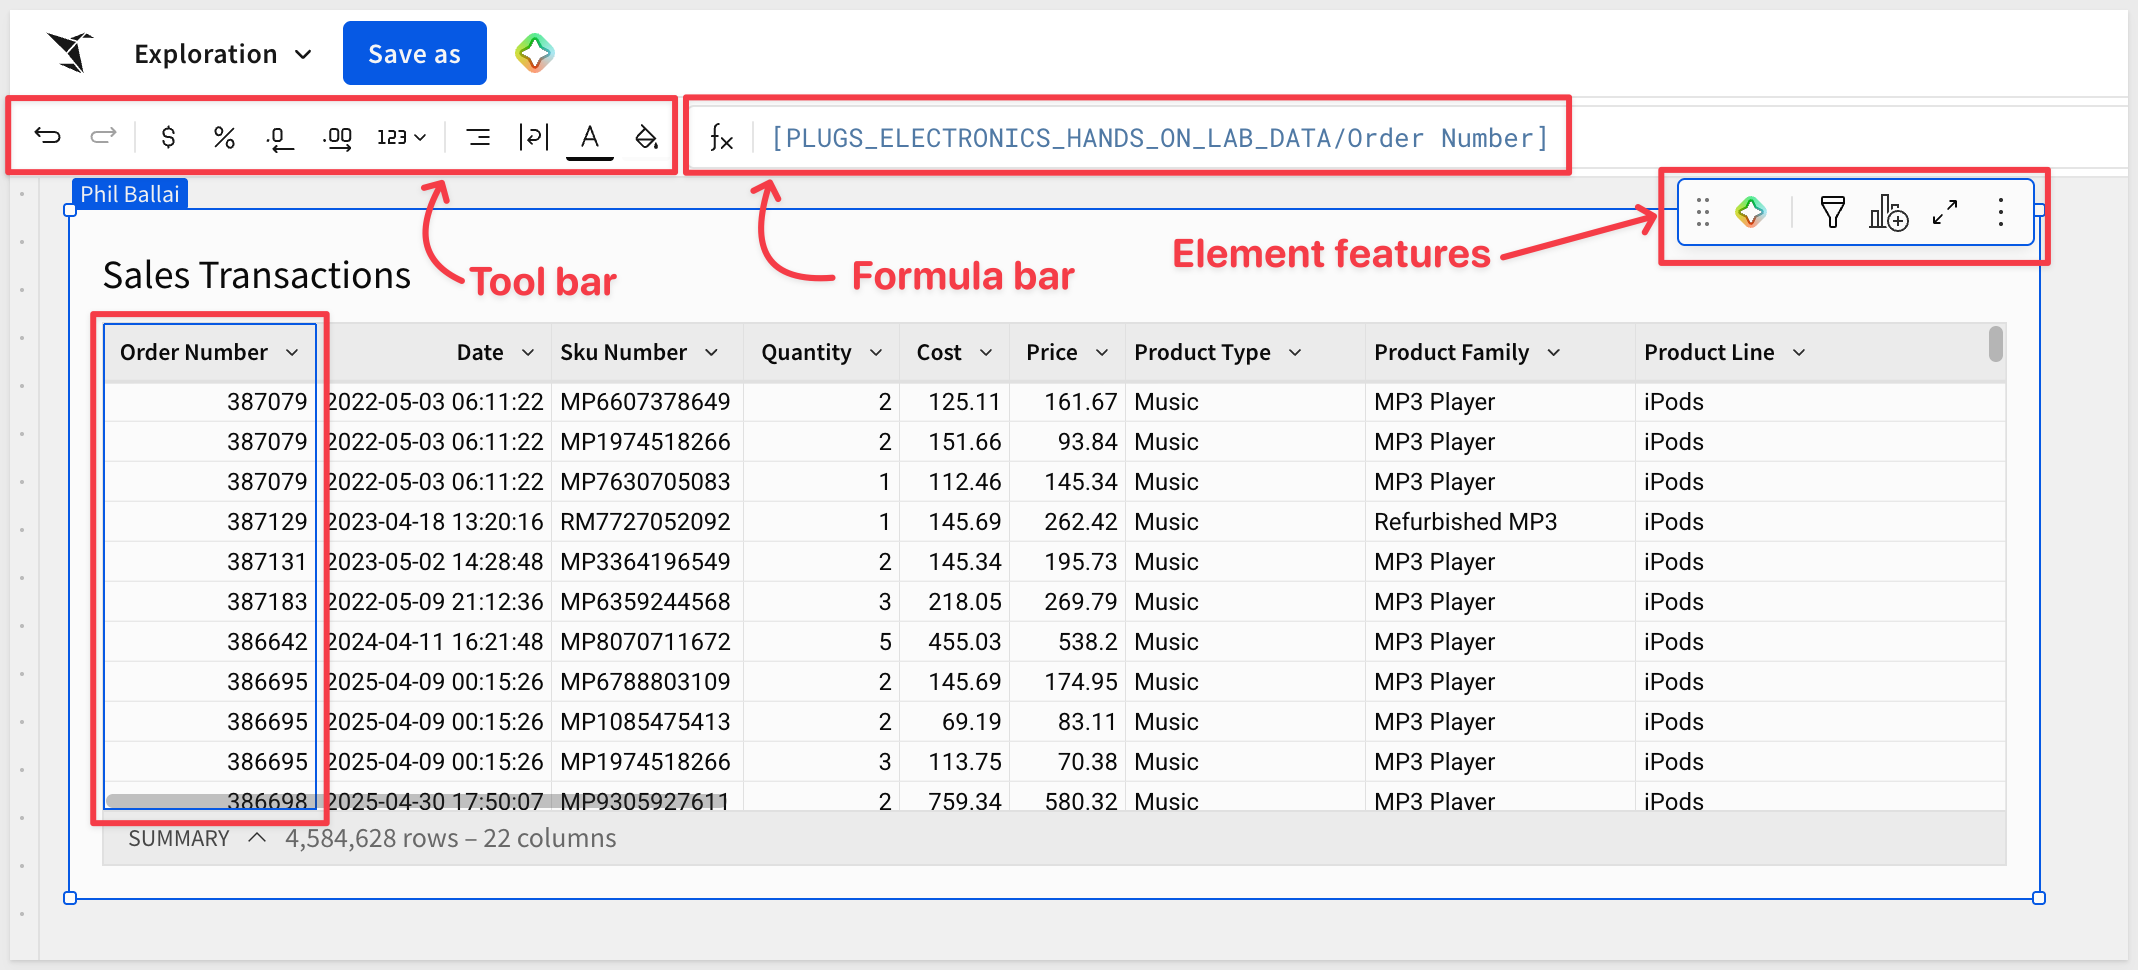
The formula bar is super-powerful as it gives you access to Sigma's full library of functions and is where custom calculations are written and edited.
Important to notice that icons for undo and redo are present -  . These are really handy, and will be used often.
Save the workbook
When you're ready to keep this workbook, click Save As in the upper left corner.
Give the workbook a name that would make sense to you and to anyone you might share it with later. For this QuickStart, create a folder called QuickStarts and name the workbook Fundamentals.
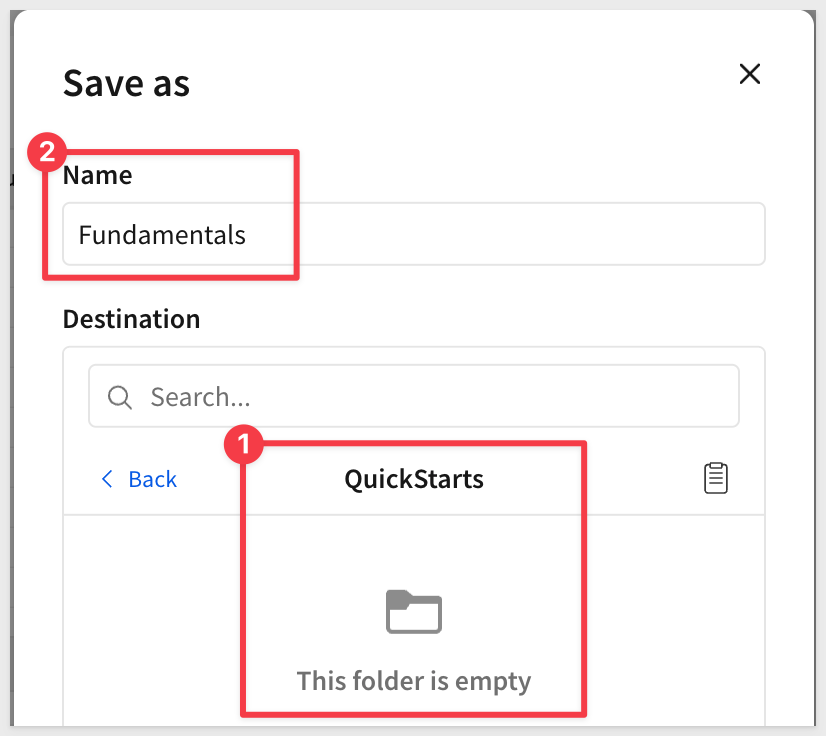
Once saved, the workbook is now in Draft mode. The Publish button is visible in the header, but it remains inactive as we just saved the workbook. It will remain inactive until you make changes.
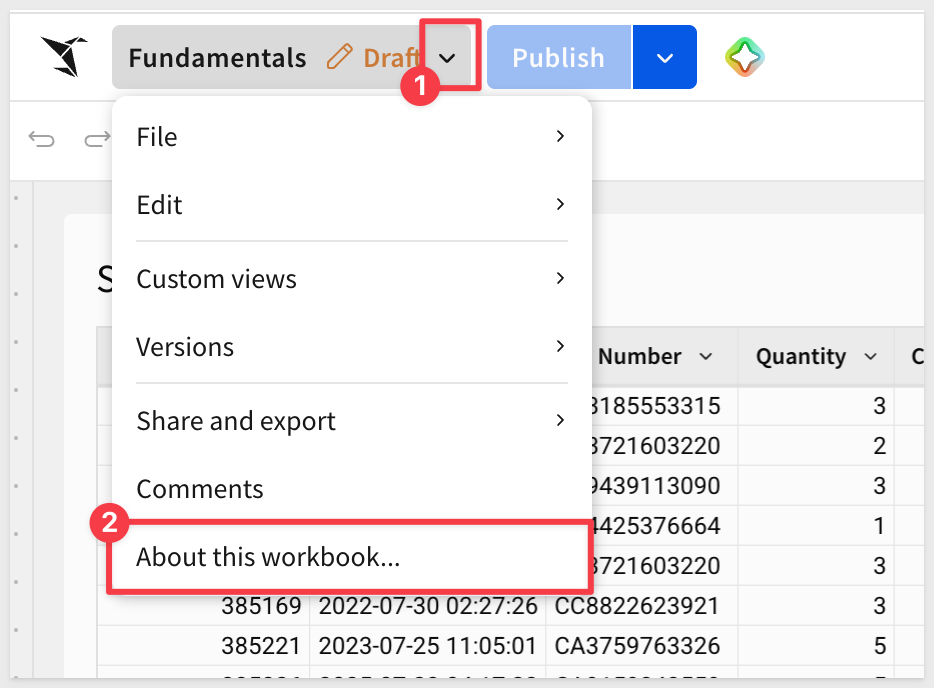
About this workbook
Click the down-arrow next to the workbook name and select About this workbook.
From here you can:
- Star the workbook to add it to your Favorites section on the home page left sidebar menu.
- Leave a text comment to provide additional context.
- Details about where the workbook is stored and who owns it — useful when the workbook is shared with you.
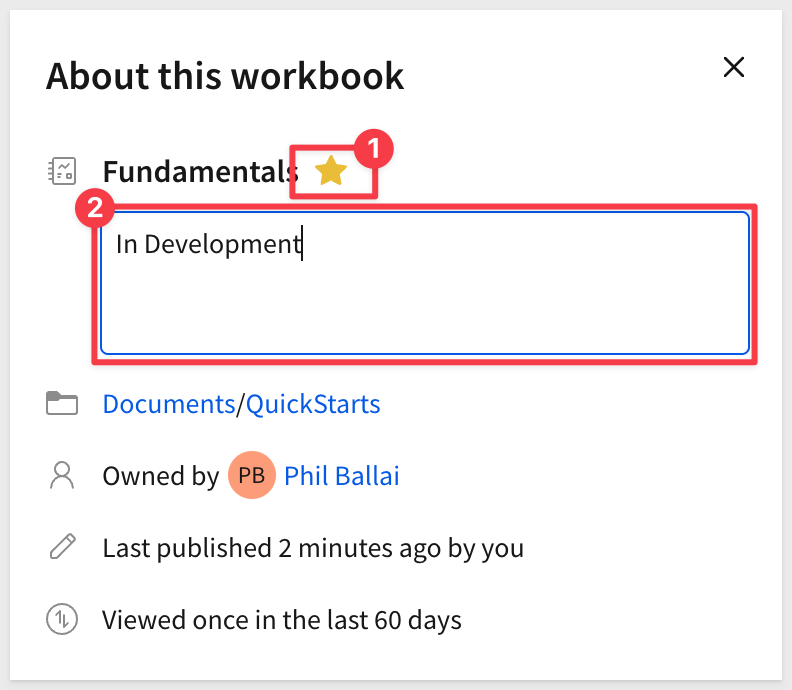
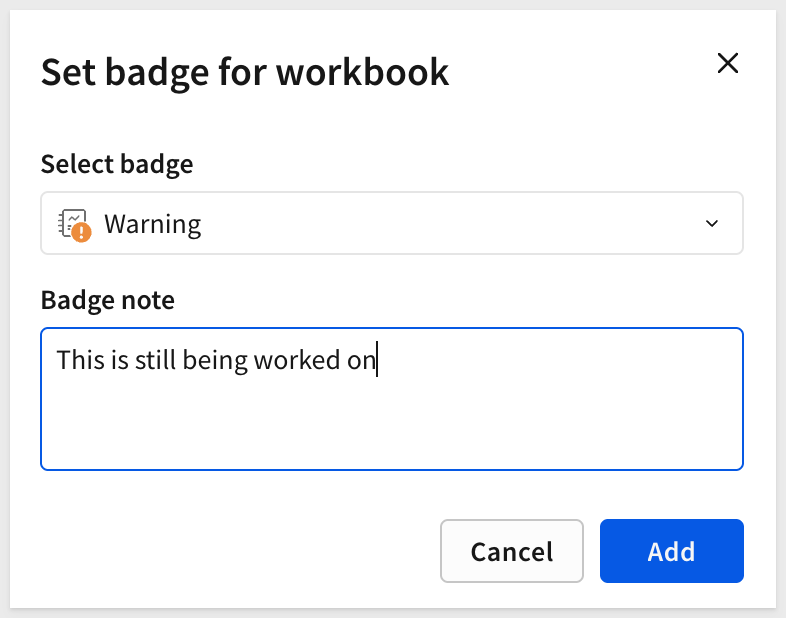
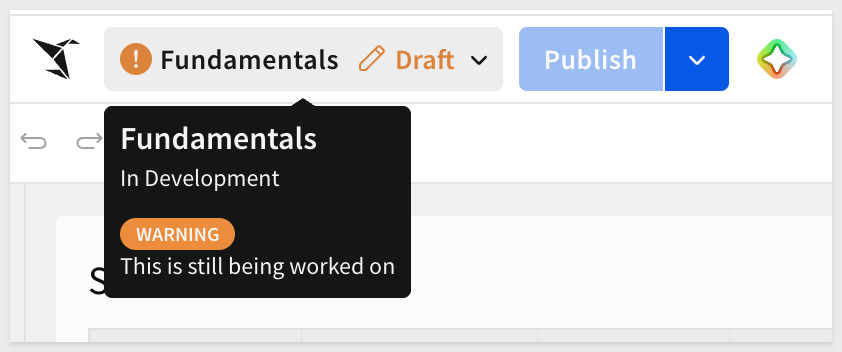
You may also want to set a Badge on the workbook, to inform users about the status of the content:

Publish and view
When you're ready to share the workbook with others, click Publish. This promotes the current draft to the published version — the version all users with access will see.
Opening the Publish drop-down before clicking provides additional options:
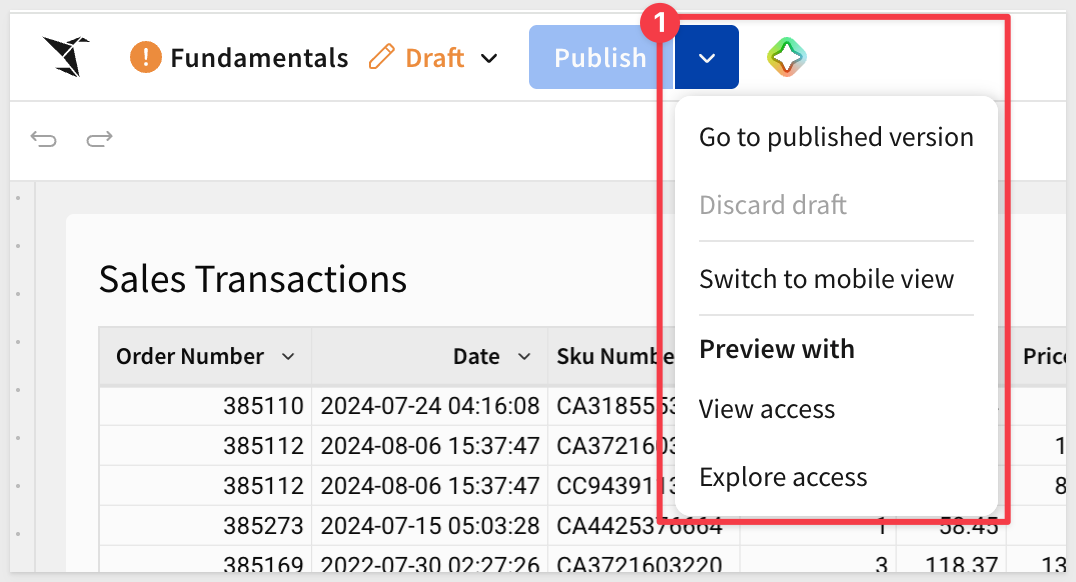
- Go to the published version to see what viewers see.
- Discard unpublished draft changes.
- Preview the workbook at a smaller screen size for mobile use.
- Preview with different access rights applied.
The published view
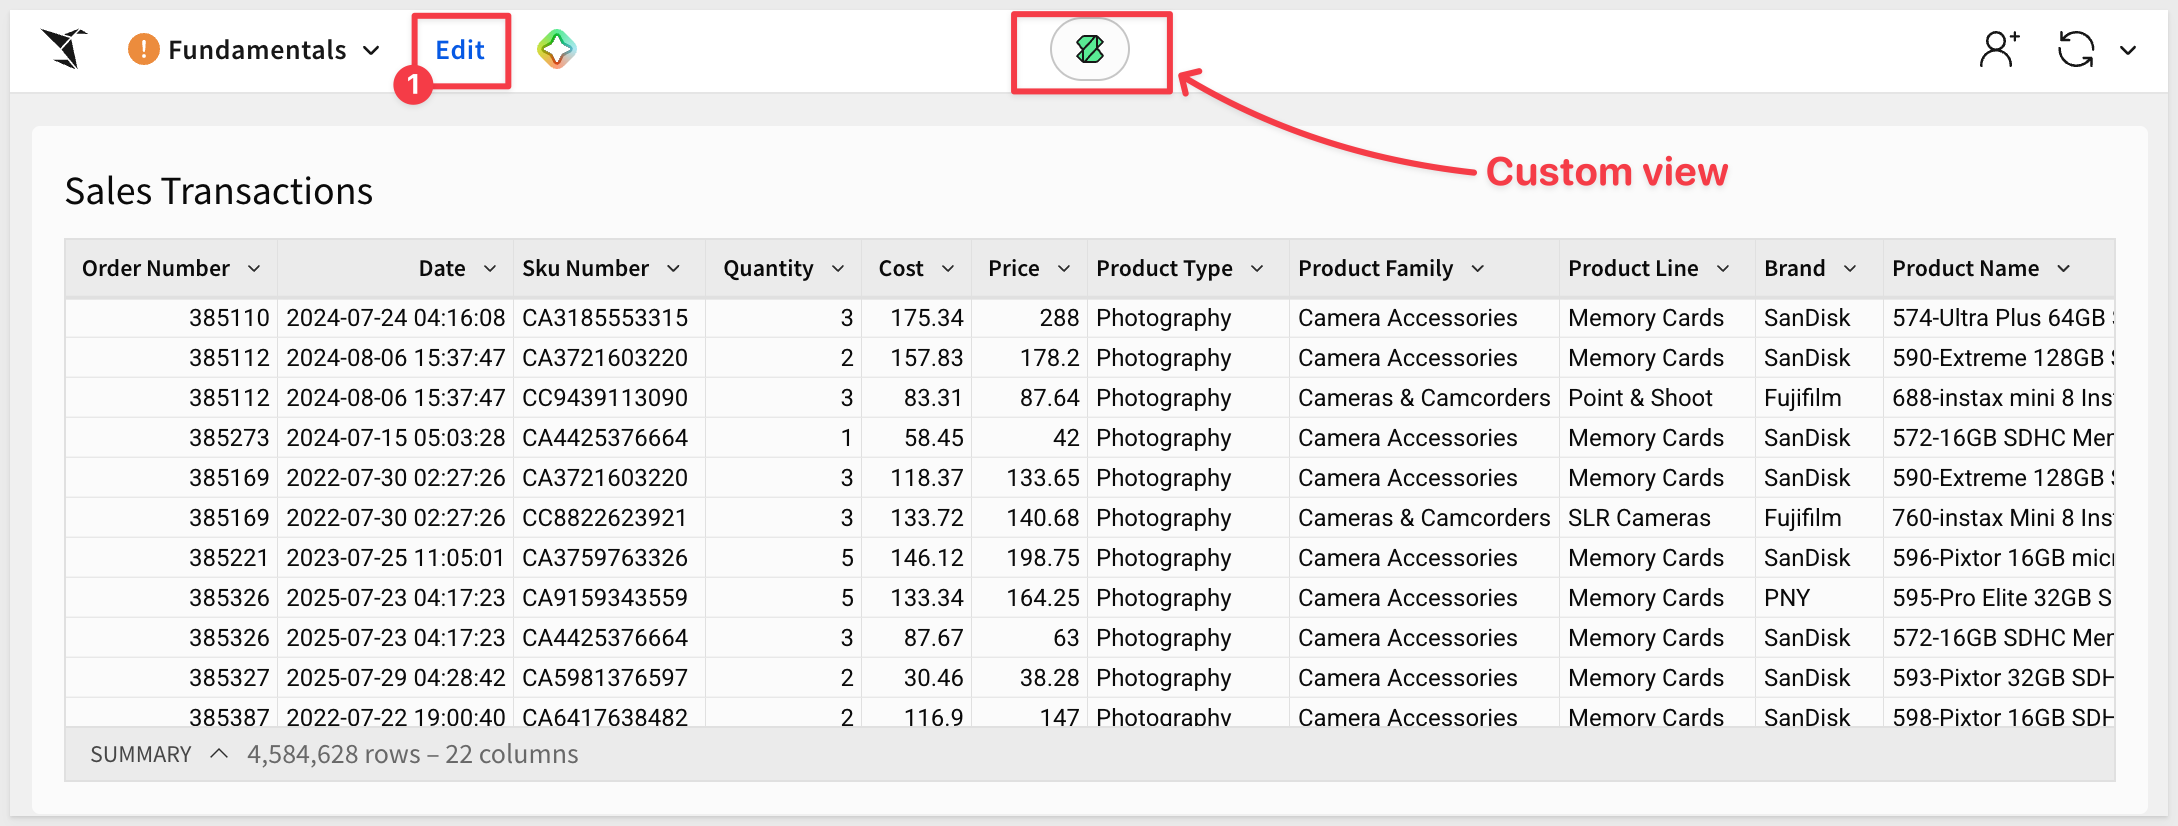
After publishing, click Go to published version from the Publish menu.
In the published view, the header shows an option to return to Edit mode, plus a Custom view icon.
Custom views let you make changes visible only to you — useful for adapting a shared workbook to your own needs without affecting what others see.
If a user has the permission, they can use File > Save as a new workbook to save that view for themselves (and perhaps others):
Once you're done reviewing, click Edit in the header to return to editing mode.
Each workbook page has its own canvas and can be made to operate independently of others, or not.
For example, on one page, we may want to have the data and controls you are using to drive the content on other pages.
On another page, we may want to provide some instructions for the users. Sigma is flexible enough you can create very different designs and even make the design properties reusable as Theme
Create a data page
A dedicated data page in a workbook can be useful for storing information that other users don't need to see. However, elements on the data page can still be easily referenced on any other workbook page.
In the lower left corner of the workbook there is a page tab called Page 1.
Double-click on the Page 1 text and rename the page to Data.
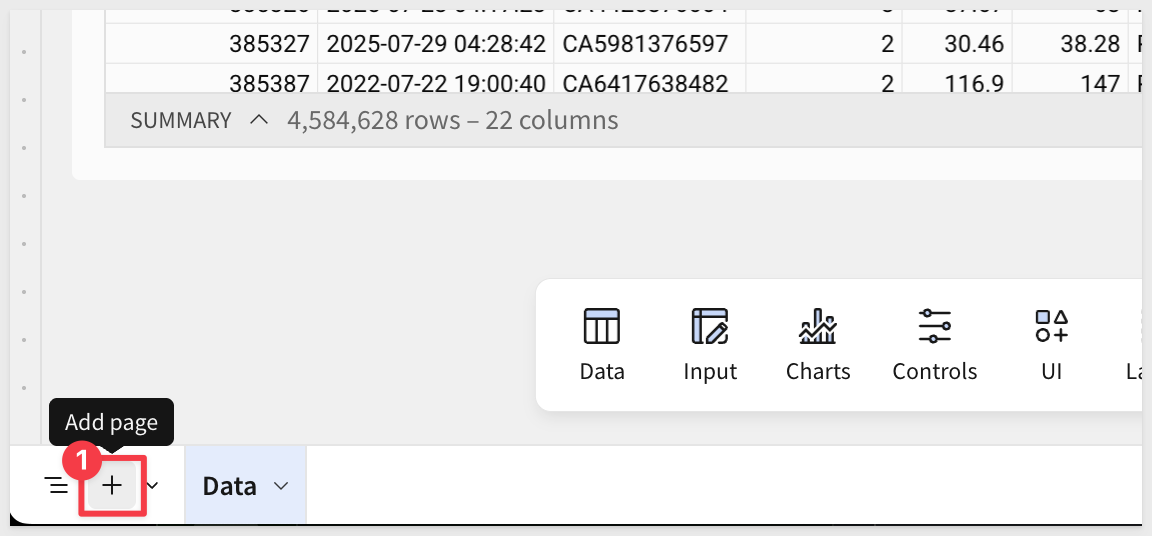
Add a new page and name it Dashboard for now:
Drag the Dashboard page to be first in line.
Click the menu arrow on the Data page and select Hide page:
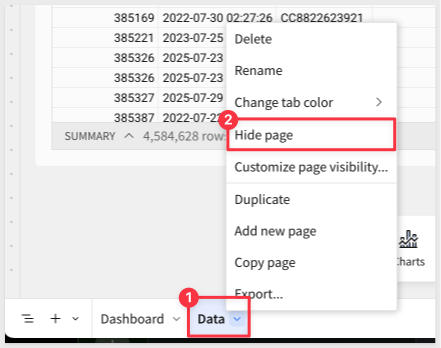
The Data tab will now carry an icon to indicate that it will not be visible to users who do not have edit rights.
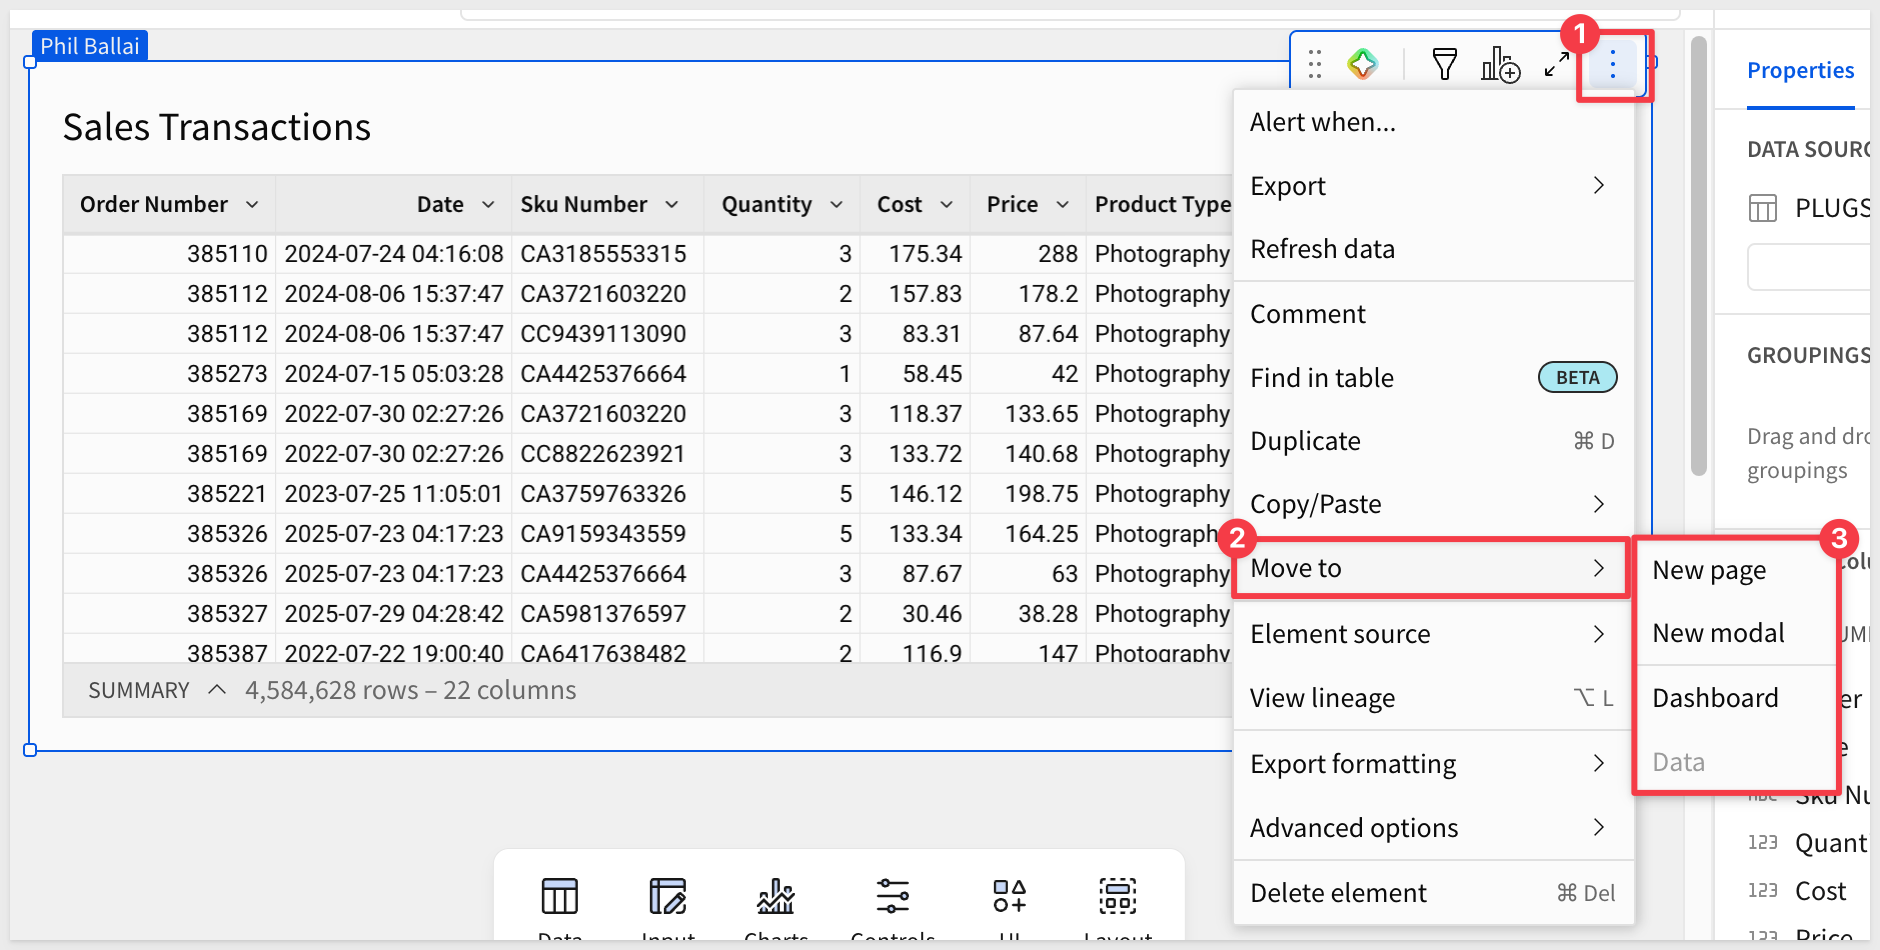
All Sigma elements use a common method for making adjustments via the 3-dot or "Kebab Menu" option.
For example, if we wanted to move the Sales Transactions table to another page, we can do that easily:
Now that we made some changes, the Publish button is active again.
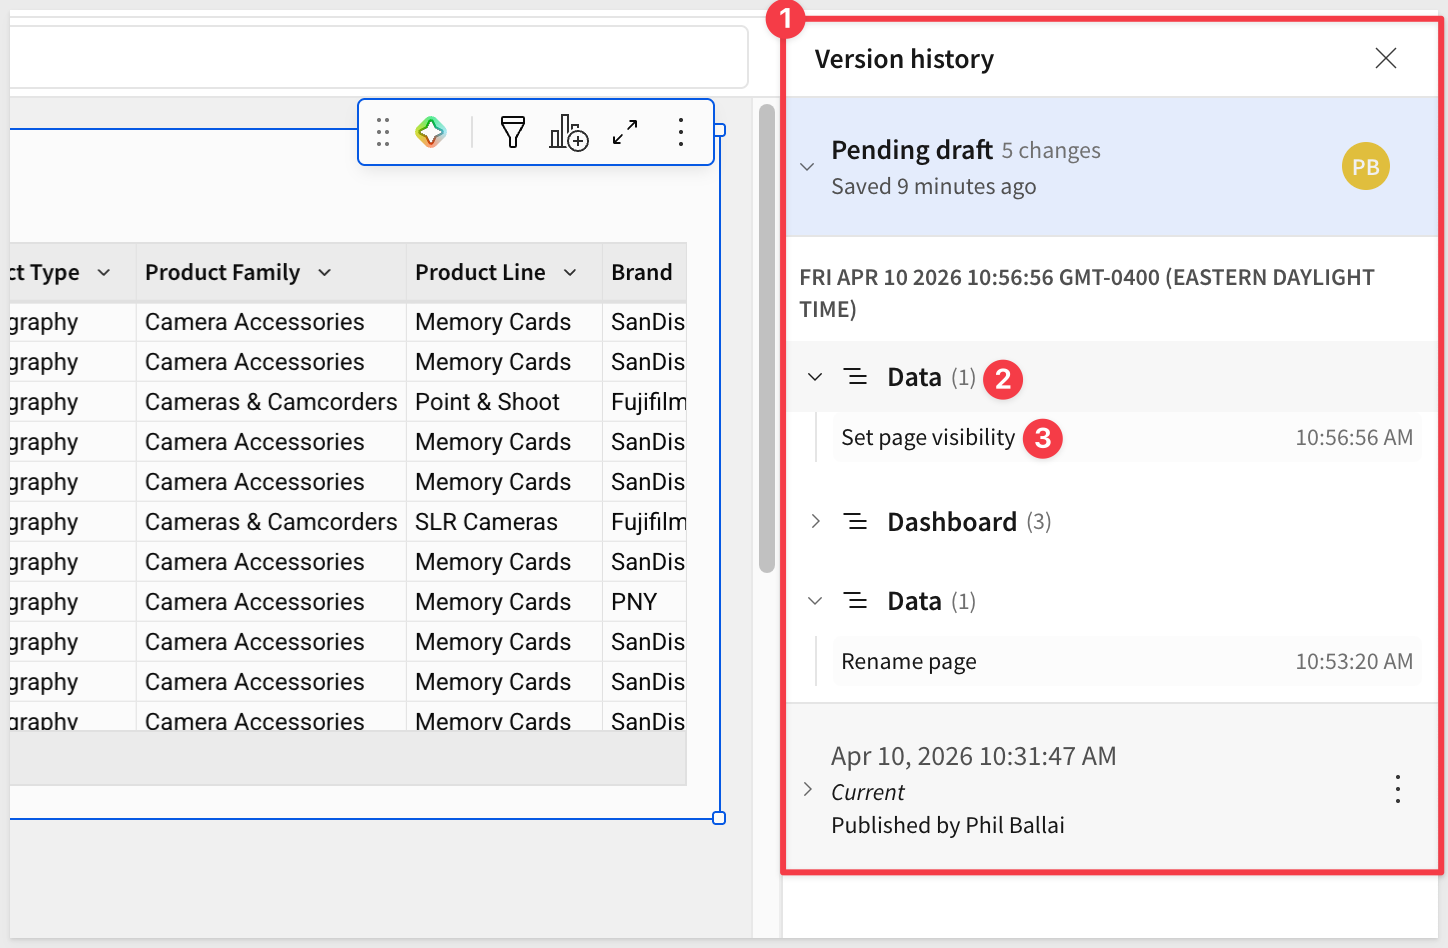
Version history
Every change you make to a workbook — including structural changes like hiding the Data page — is tracked automatically. Sigma maintains a full version history so you can review what changed, when, and who made the change. If something goes wrong, you can restore a previous version without losing other work.
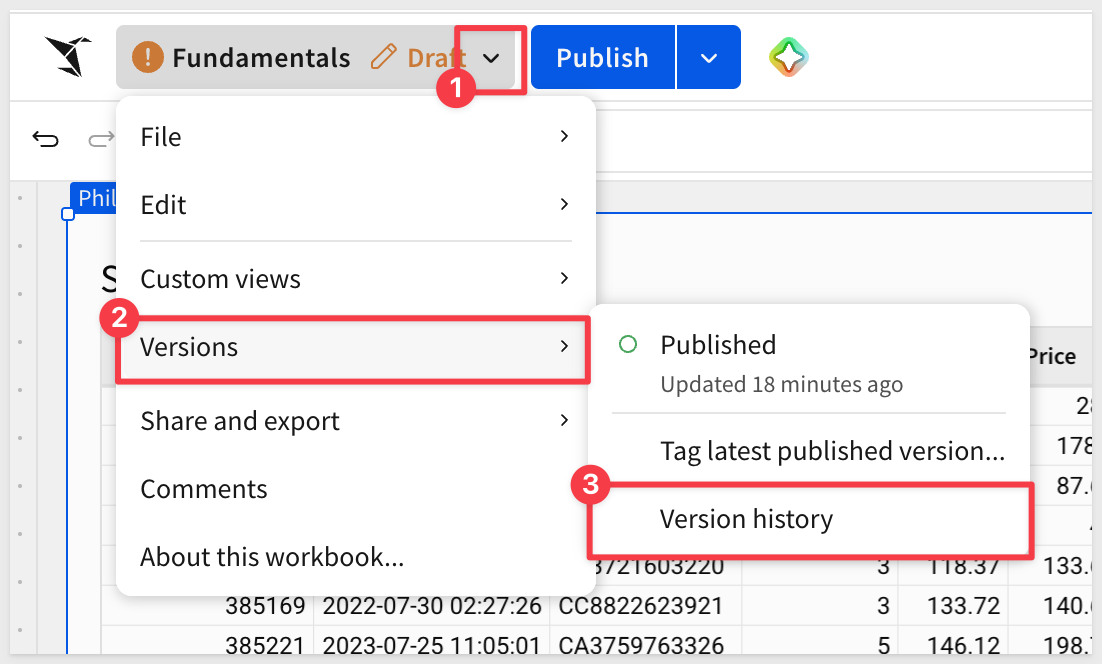
When we changed the visibility of the Data page, that is tracked and can be reverted by clicking on any of the earlier changes.
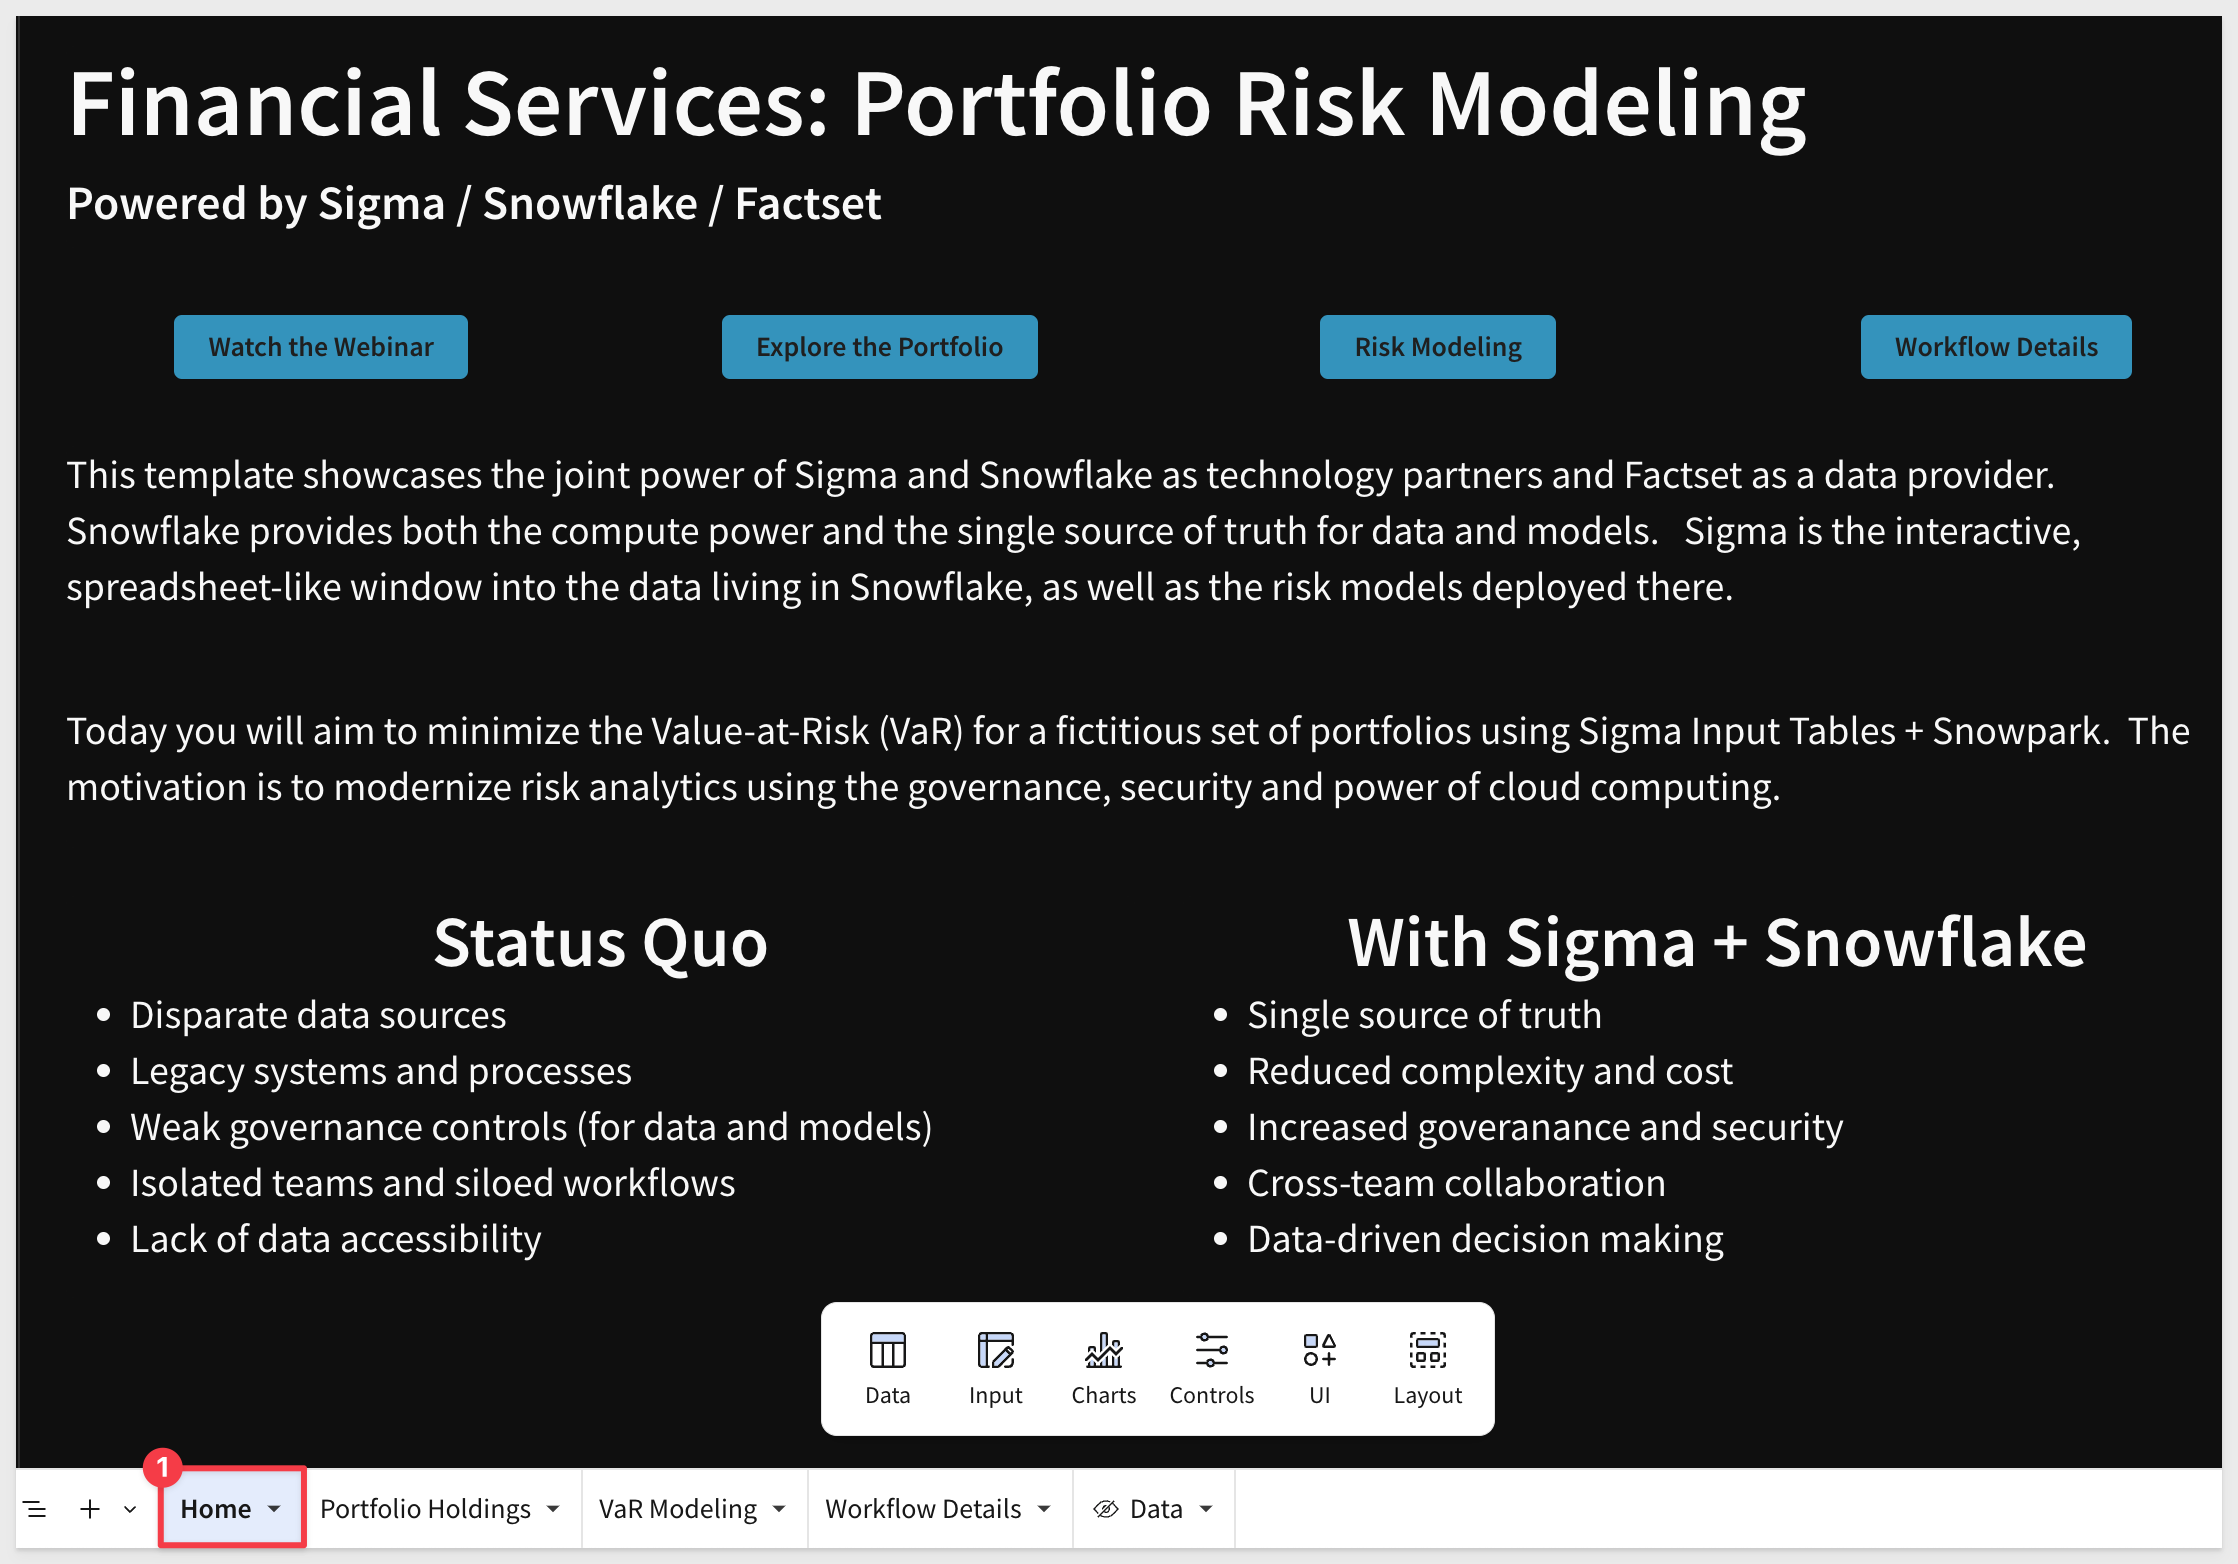
Use a page for instructions or useful information
Creating a dedicated workbook page to inform and assist users who are looking at the workbook is a best practice.
As an example, this Financial Services: Portfolio Risk Modeling workbook has informative text along with some navigation buttons along the top and uses a dark theme. Since it is on the Home page, it is the first thing users see:
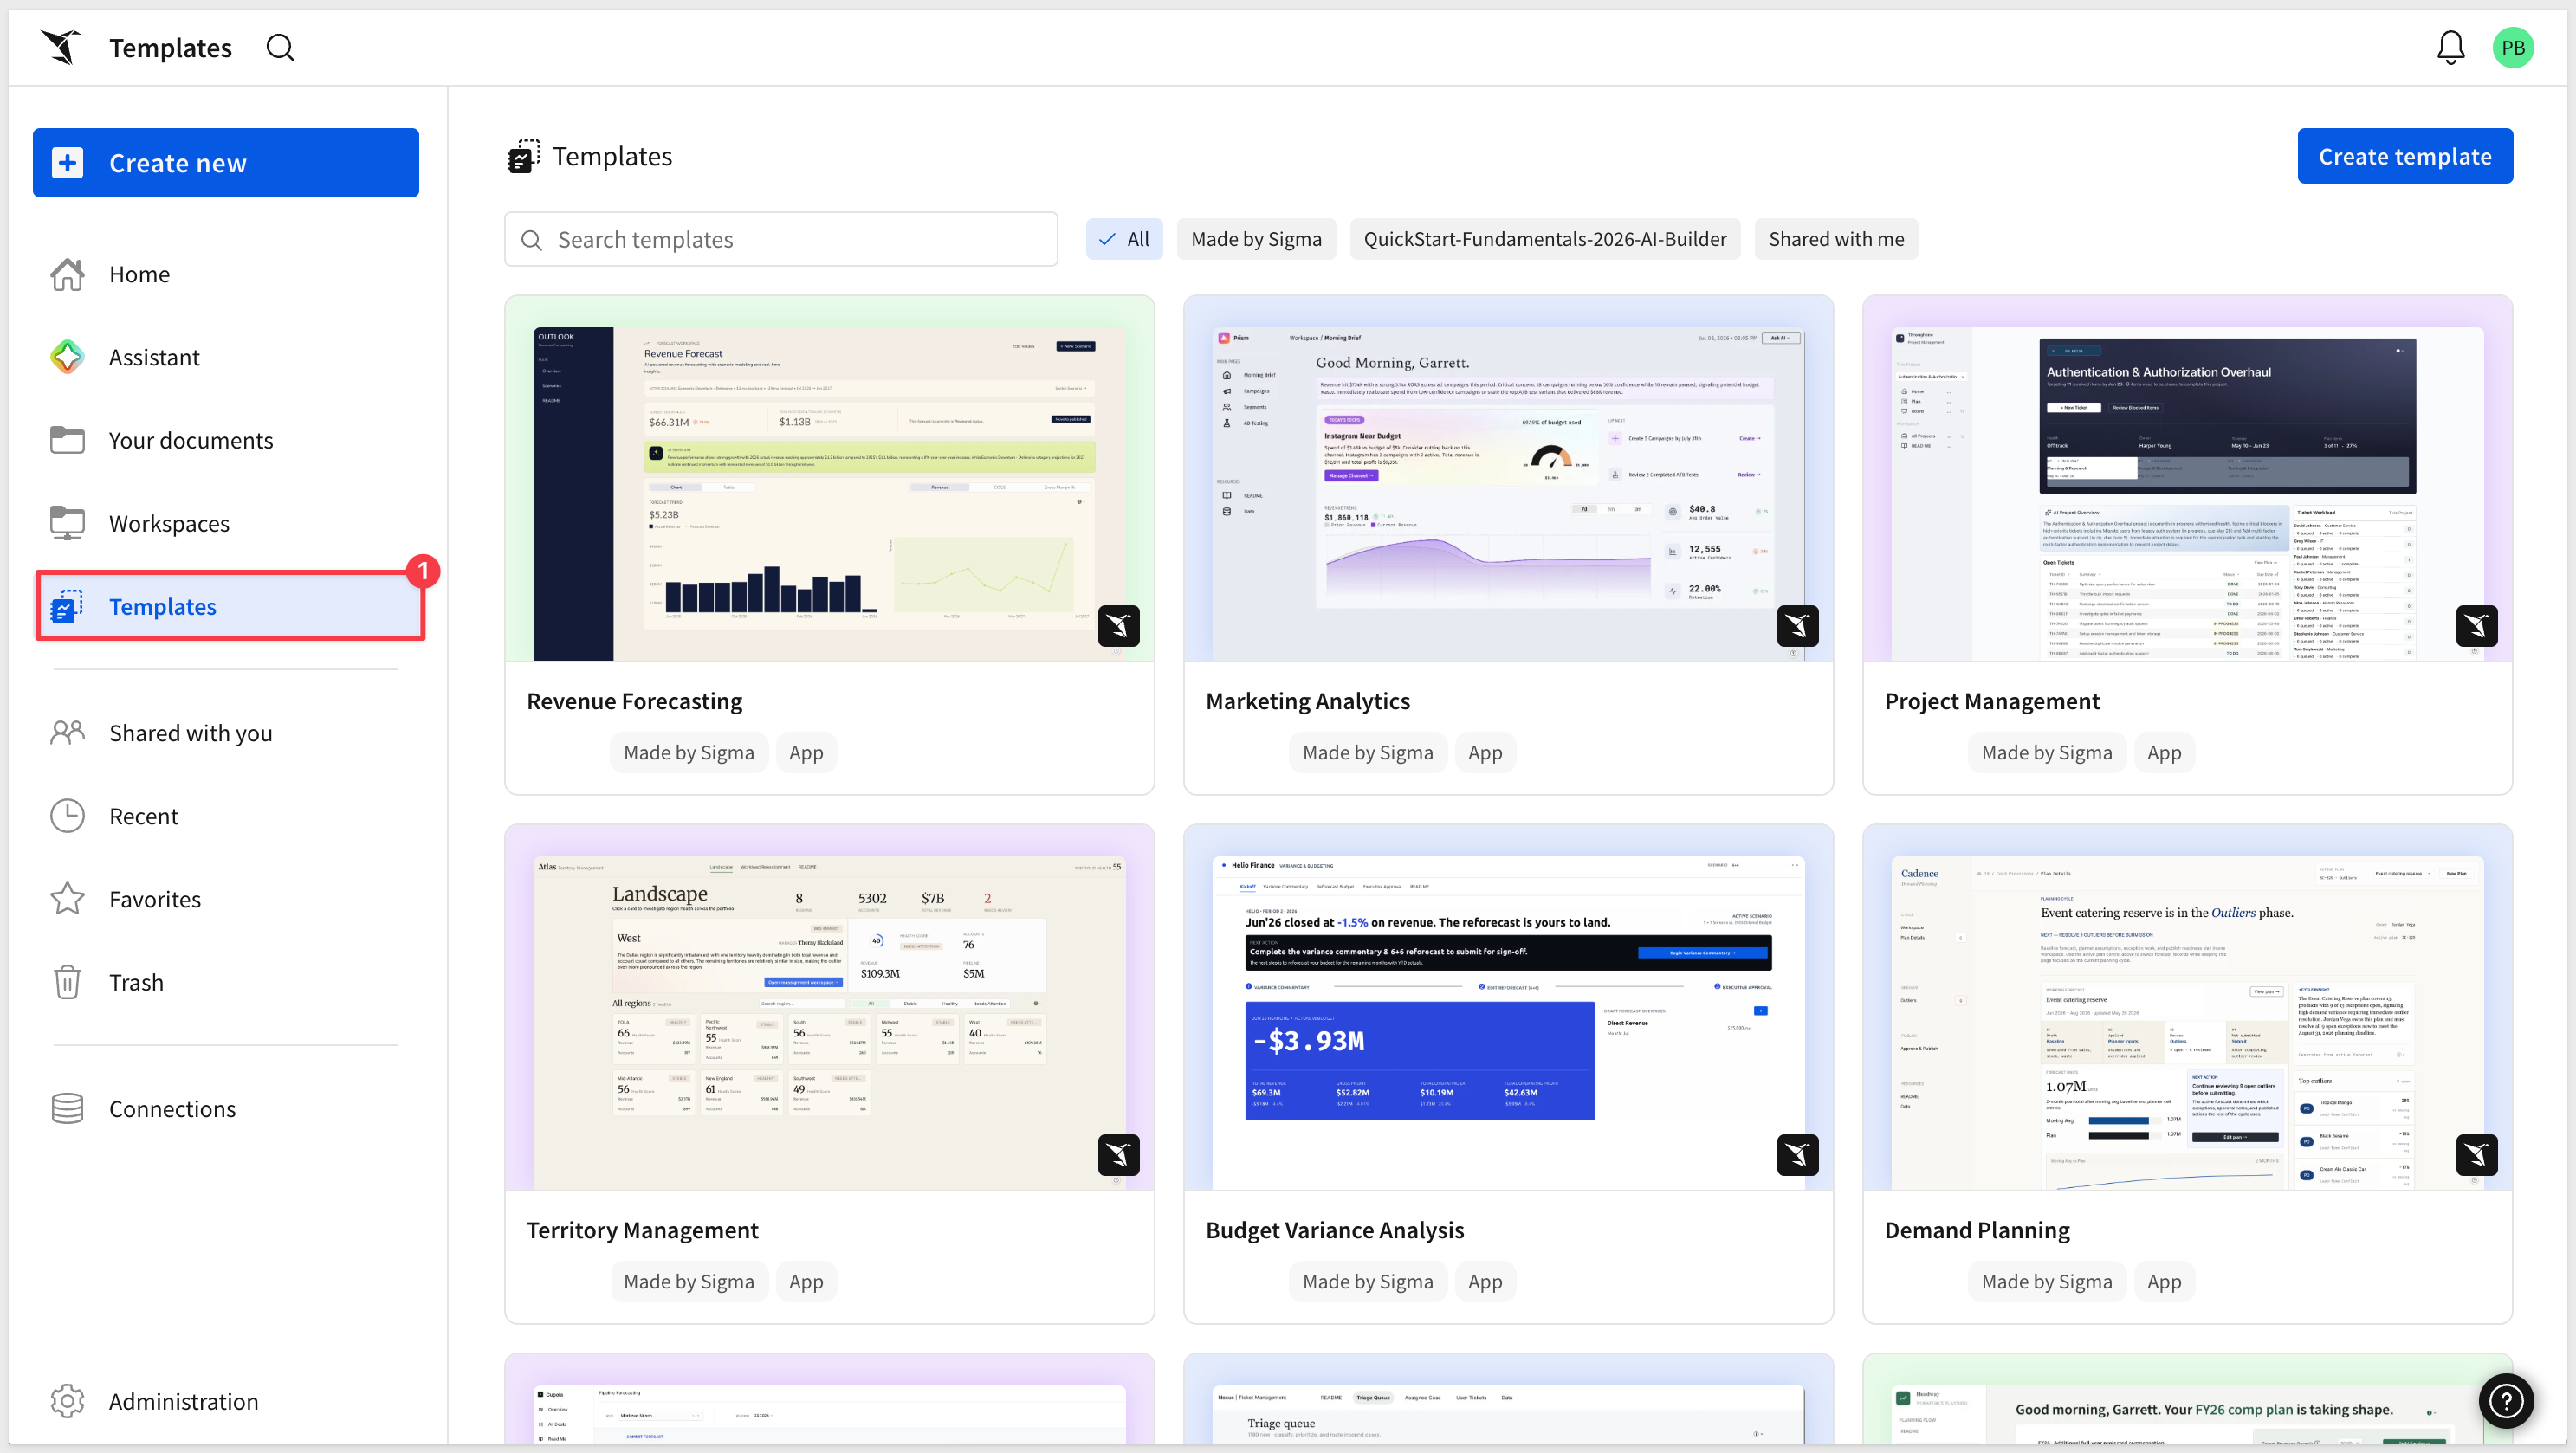
The Templates section in the left sidebar includes Starter Apps — pre-built, fully working apps built on sample data that cover common business workflows across finance, operations, sales, and more. You can explore them, inspect how they're built in edit mode, and connect them to your own data when you're ready.
Sigma offers several layout elements that help you structure workbook pages, improve navigation, and create interactive user experiences. Each element is designed to make your content more organized, visually appealing, and easier to use.
Having all these options allows you to get creative with workbook functionality and design—encouraging your users to engage with and return to your workbooks.
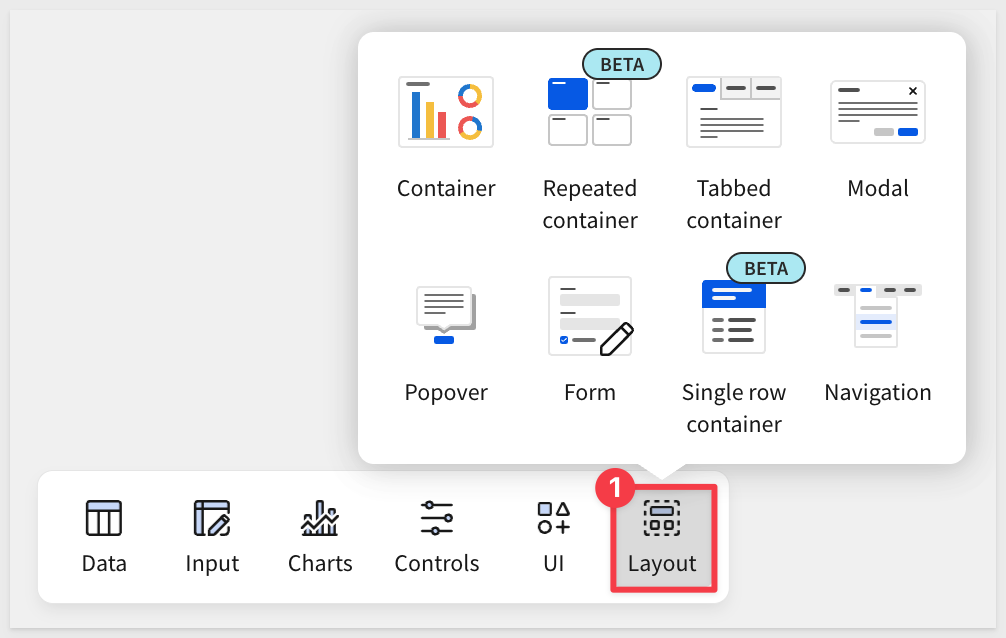
Containers
Sigma's container feature allows you to organize workbook pages by grouping elements within a customizable container.
This provides an intuitive way to manage layouts, ensuring that related elements remain visually cohesive.
Containers not only streamline the design process by enabling you to adjust and style grouped components collectively, but also enhance flexibility when rearranging or resizing elements on the canvas.
This powerful feature simplifies complex workbook structures, making it easier to maintain consistency in both functionality and appearance.
In the animation below, we show how containers dramatically improve the appearance of existing Sigma workbooks.
To learn more about using containers, see Organize workbook layouts with containers
Tabbed Container
Tabbed containers let you organize related content into separate tabs within the same space. This saves screen real estate, reduces scrolling, and allows users to easily switch between different views or datasets without leaving the page.
Modal
A modal feels somewhat similar to a page but behaves differently in that it enables a pop-up window that overlays the workbook. Modals are ideal for highlighting important content, collecting input, or guiding users through a focused interaction without navigating away from the main page.
Modals can be used for simple things like confirming a change, or as complex as the workflow shown in the Approvals QuickStart
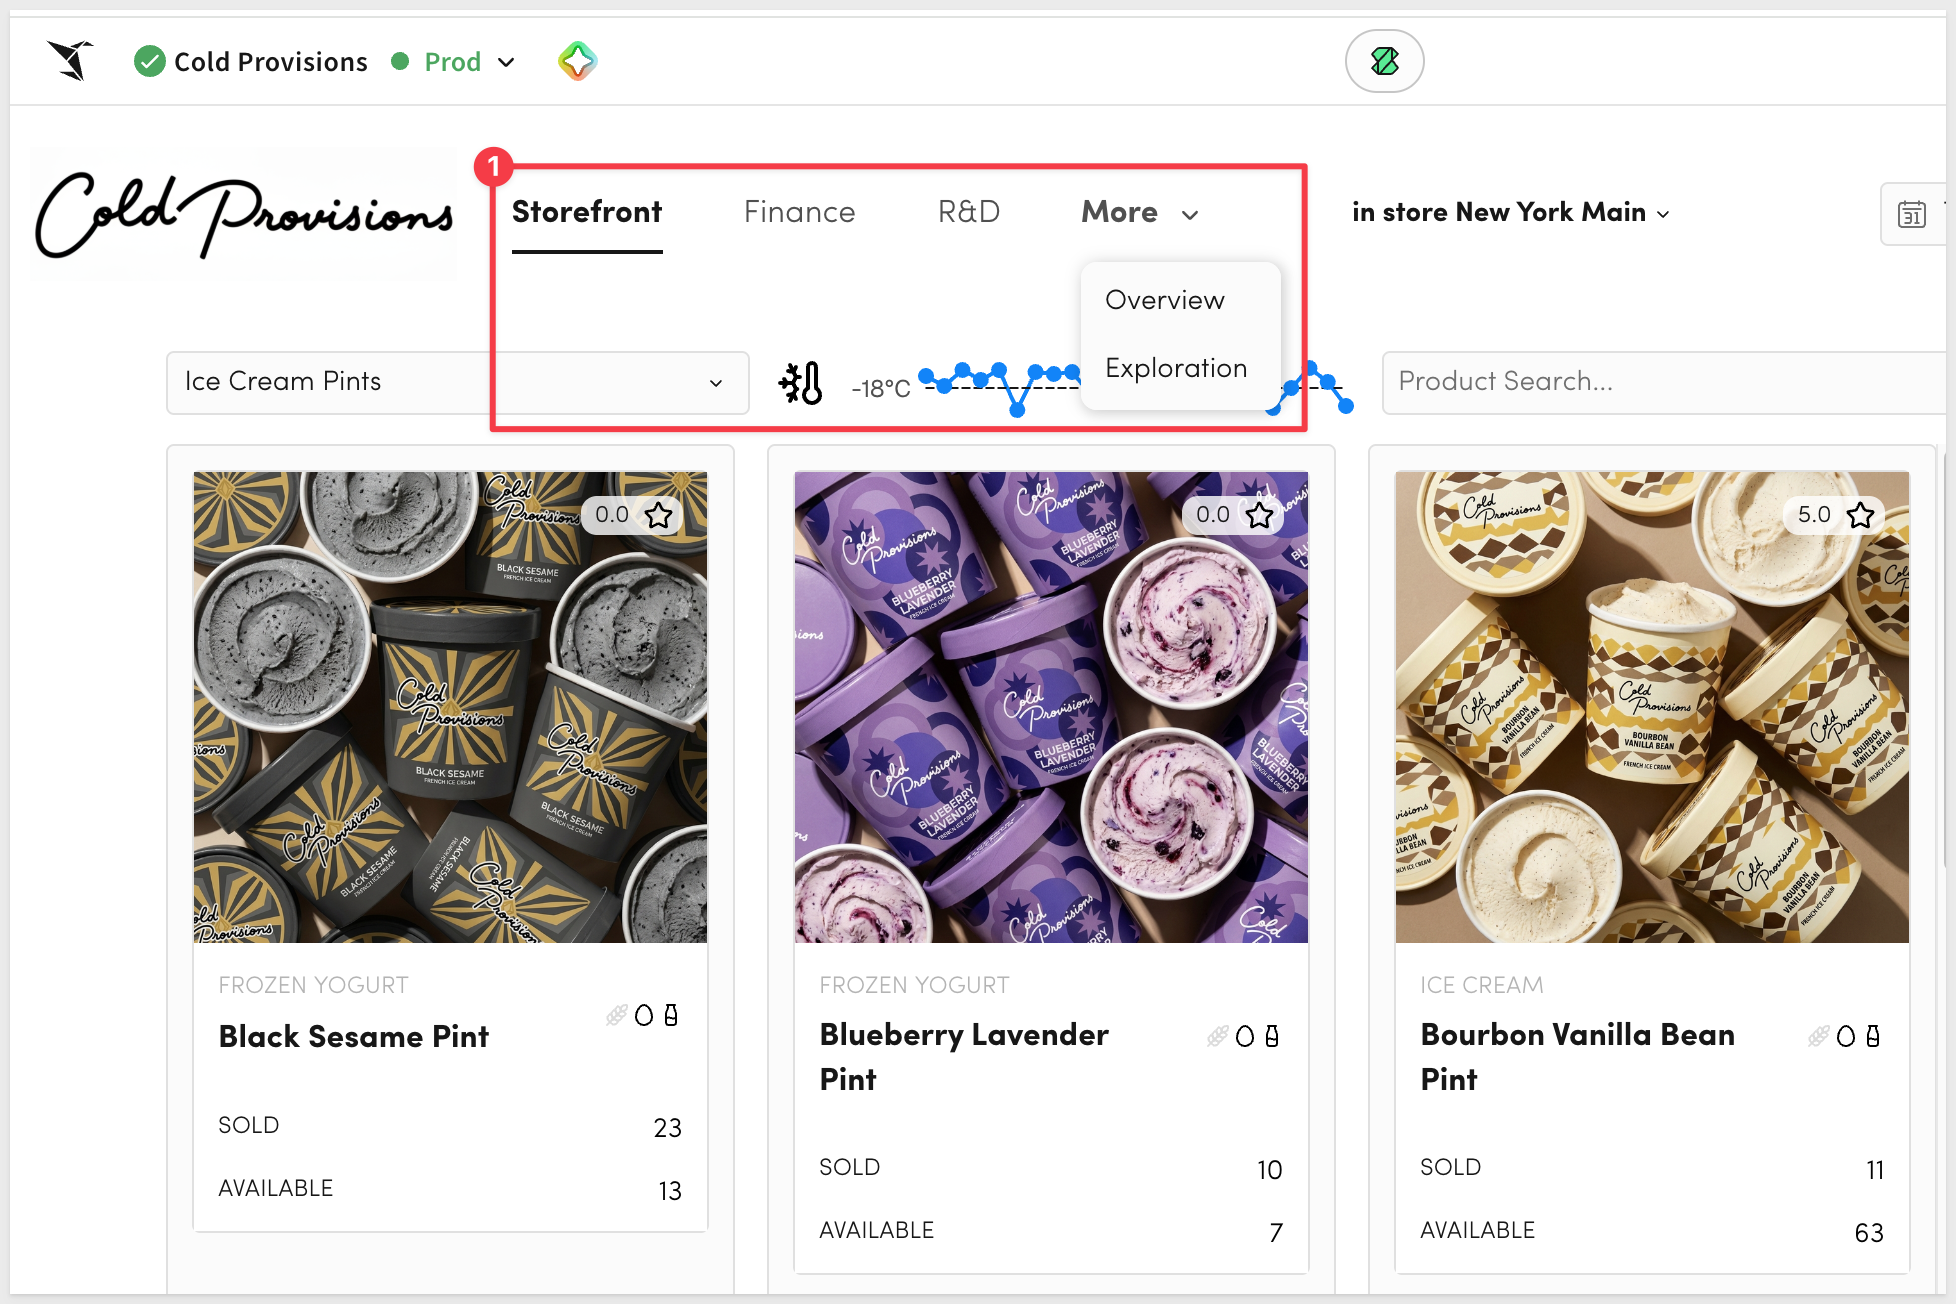
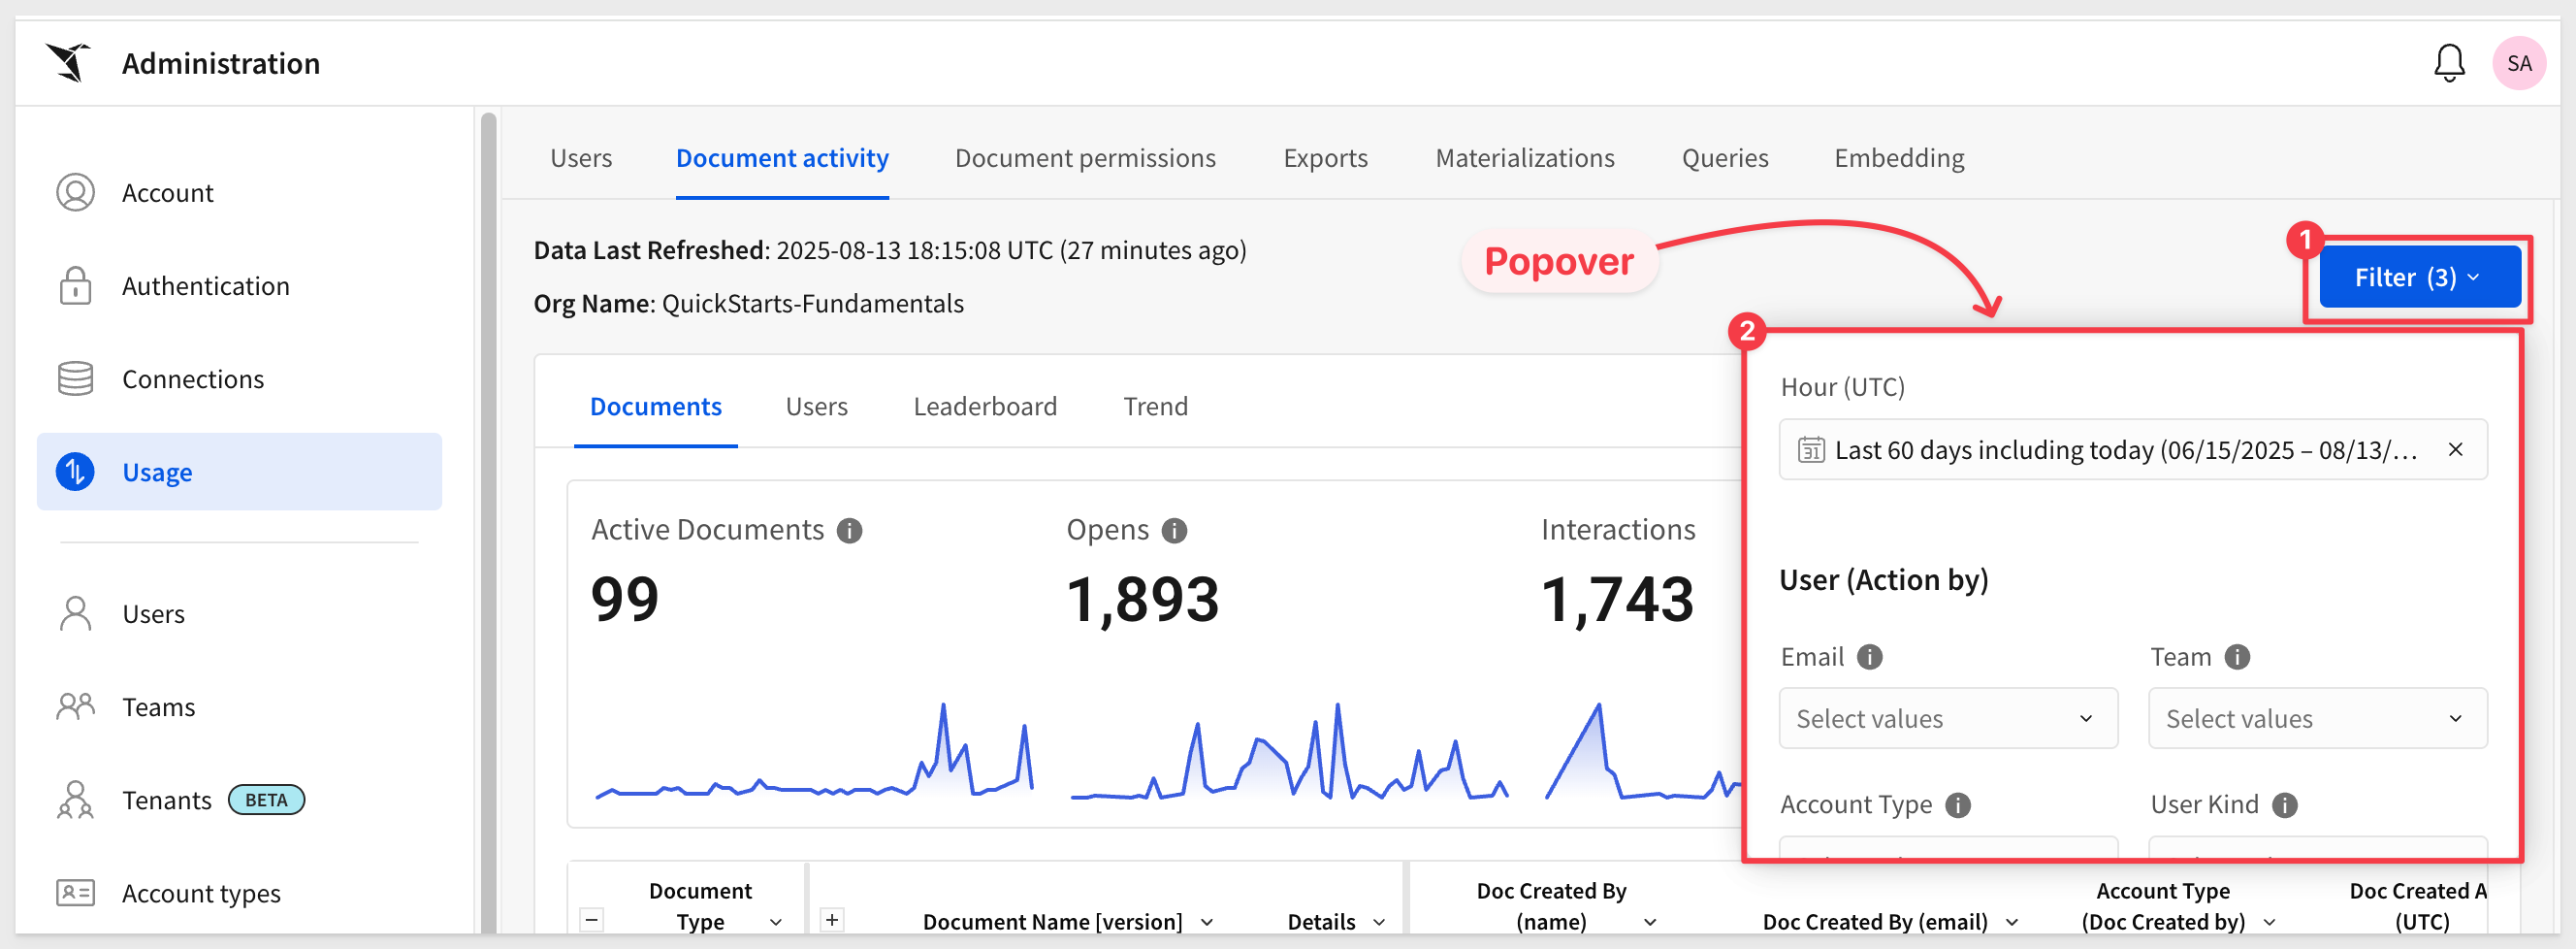
Popover
Popovers display additional information or interactive controls in a small floating panel triggered by a click or hover. They're perfect for providing contextual help, quick filters, or small forms without cluttering the main layout.
An example can be seen on the Administration > Usage page where a popover is used for filters, freeing up space:
Form
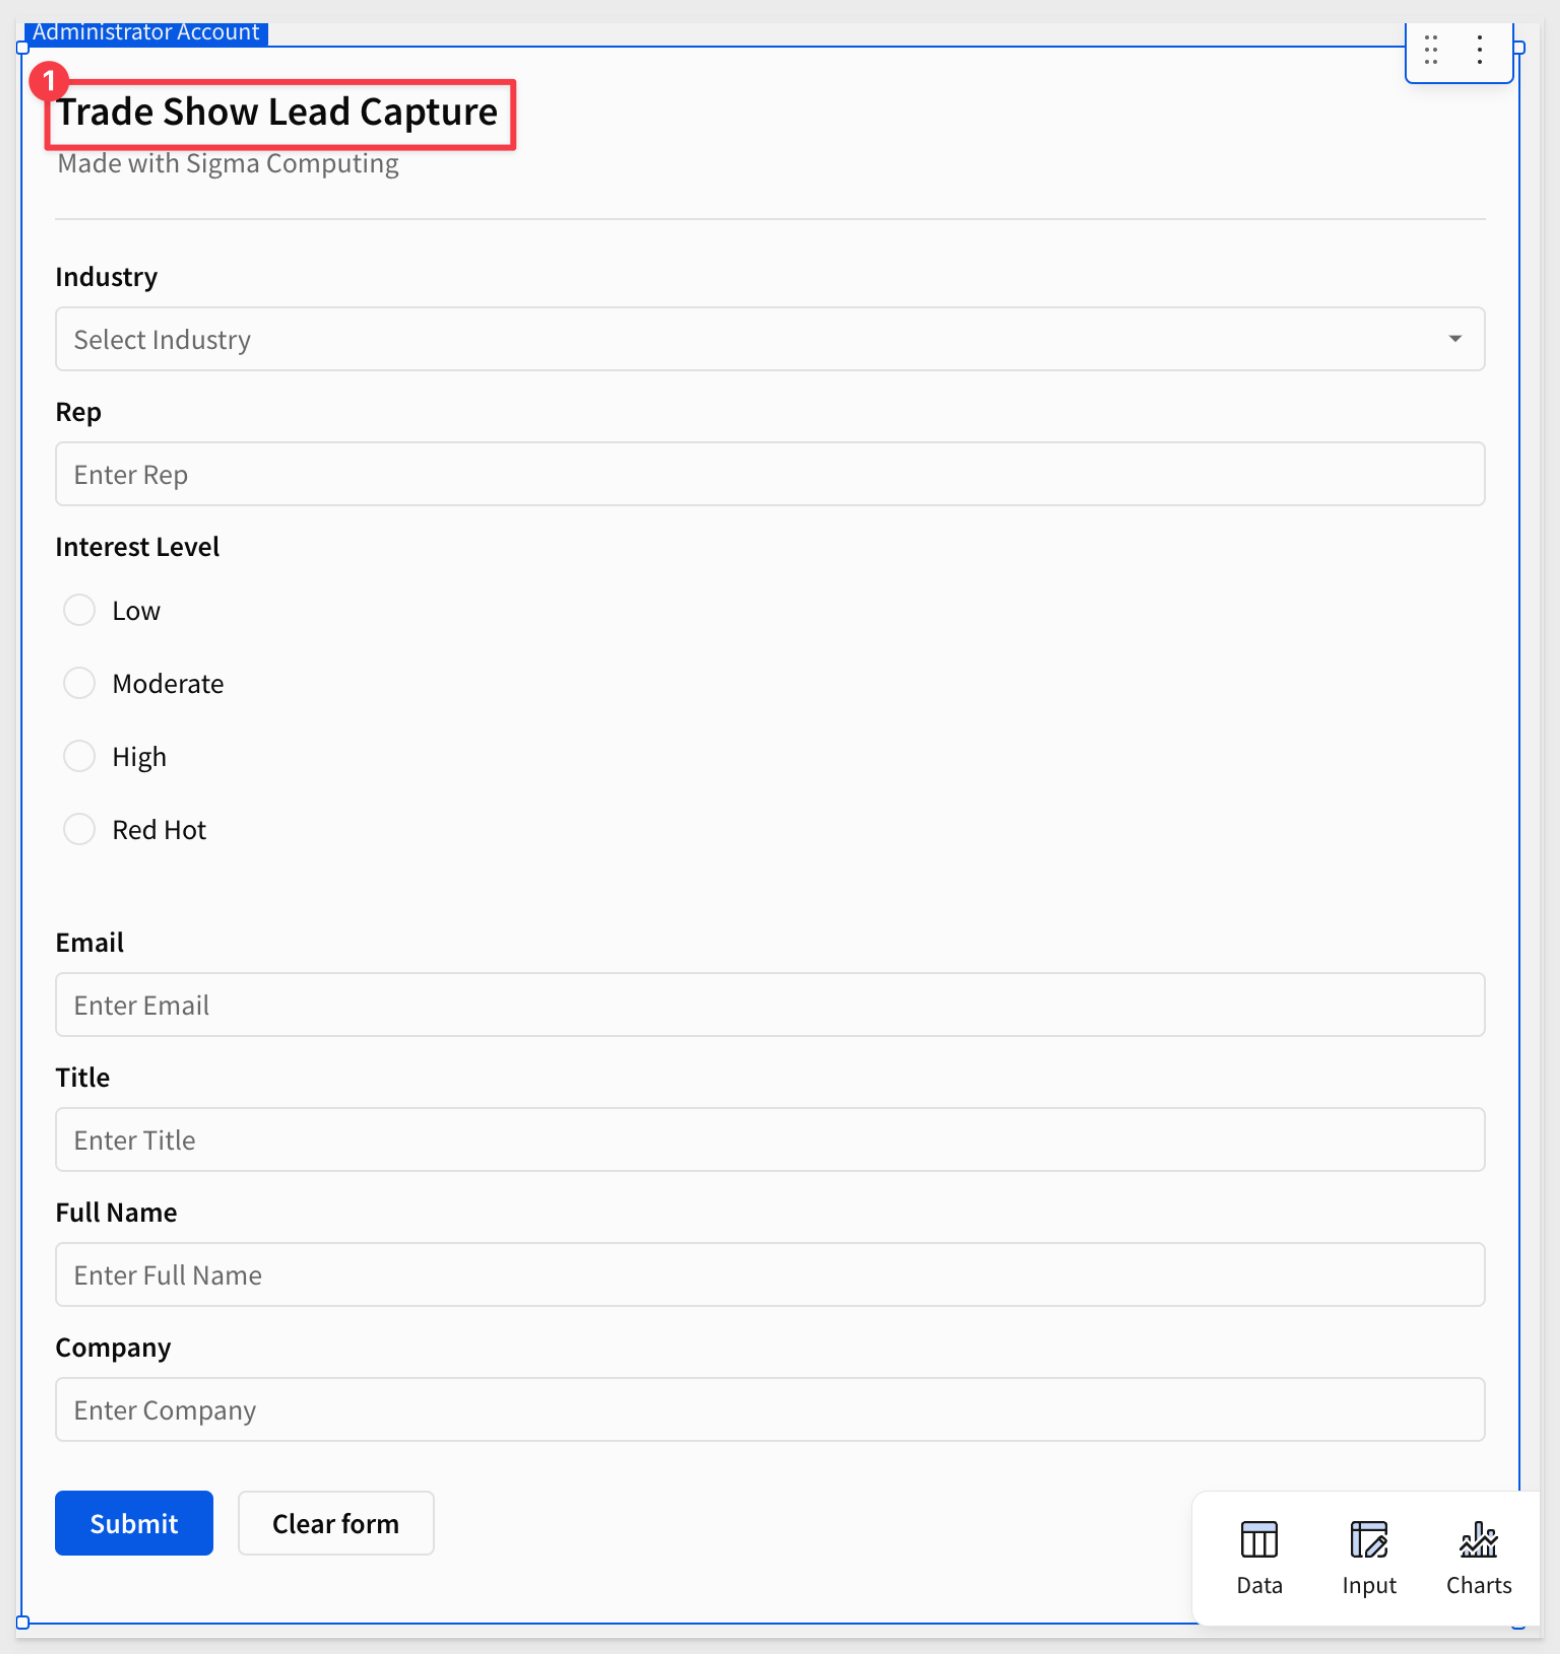
Forms enable users to input and submit data directly within a workbook. They can be used to capture user feedback, send parameters to queries, or write data back to your warehouse—bringing interactivity and data collection directly into your Sigma dashboards.
There is a QuickStart, Building Forms for Data Capture and Analysis that walks through the process of using forms to capture trade show leads.
Here is an example of a form for capturing trade show leads:
Sigma's licensing model includes tiers that define the usage terms of your organization members: View, Act, Analyze and Build.
If your organization utilizes the older Lite/Essential/Pro license model, refer to this document.
Each license tier establishes a different set of available permissions that enable access to Sigma's features and capabilities.
At a high-level, this is what each tier provides:
- View: Suitable for report consumers who need access to prepared data and insights with baseline interactions.
- Act: Ideal for collaborative data contributors who actively input and update data.
- Analyze: Optimized for decision-making data consumers who require more deep-dive capabilities without building workbooks themselves.
- Build: Designed for data architects, BI analysts, and report builders who model, transform, and analyze data.
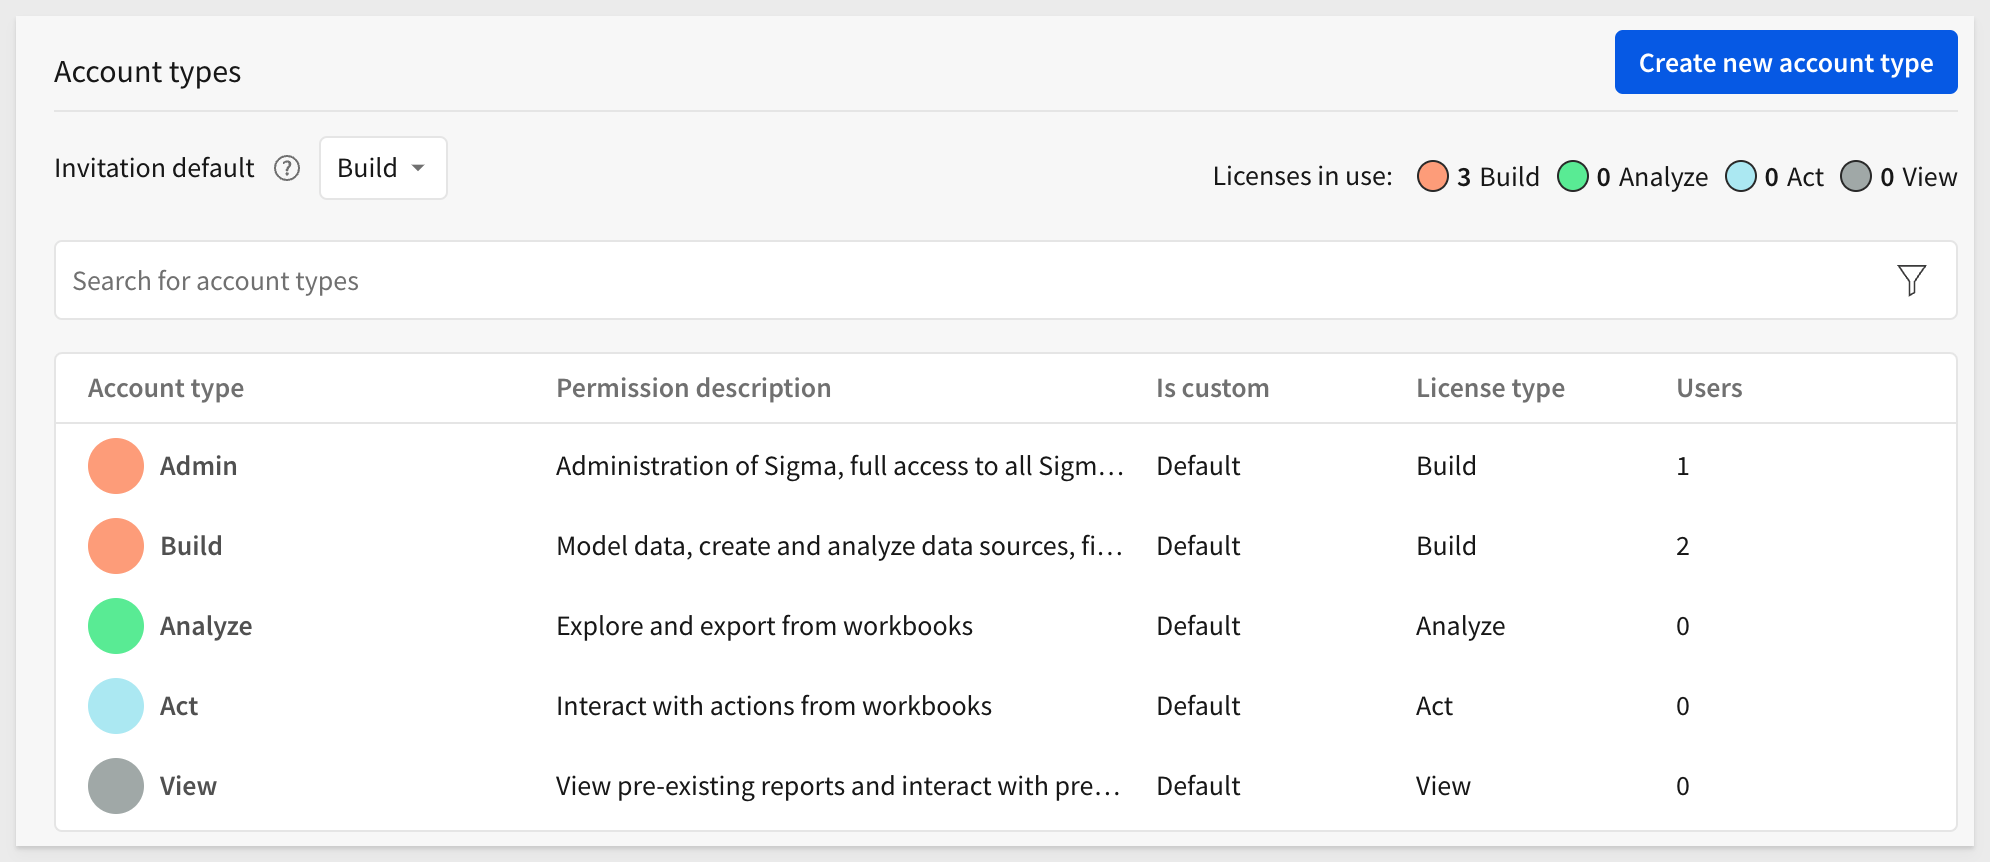
As an administrator, we can see these default account types by navigating to Administration > Account Types.
Here we see the default types, description and can also create a new custom account type.
Custom account types provide the ability to define a granular permission level using Account Types.
For more information, see Account type and License Overview
Sharing in Sigma is simple. Permissions to access a Sigma document can be granted, modified, or revoked by either the document's owner or an organization admin.
Return to the Fundamentals workbook, and click the Share icon in the upper right corner of the workbook:
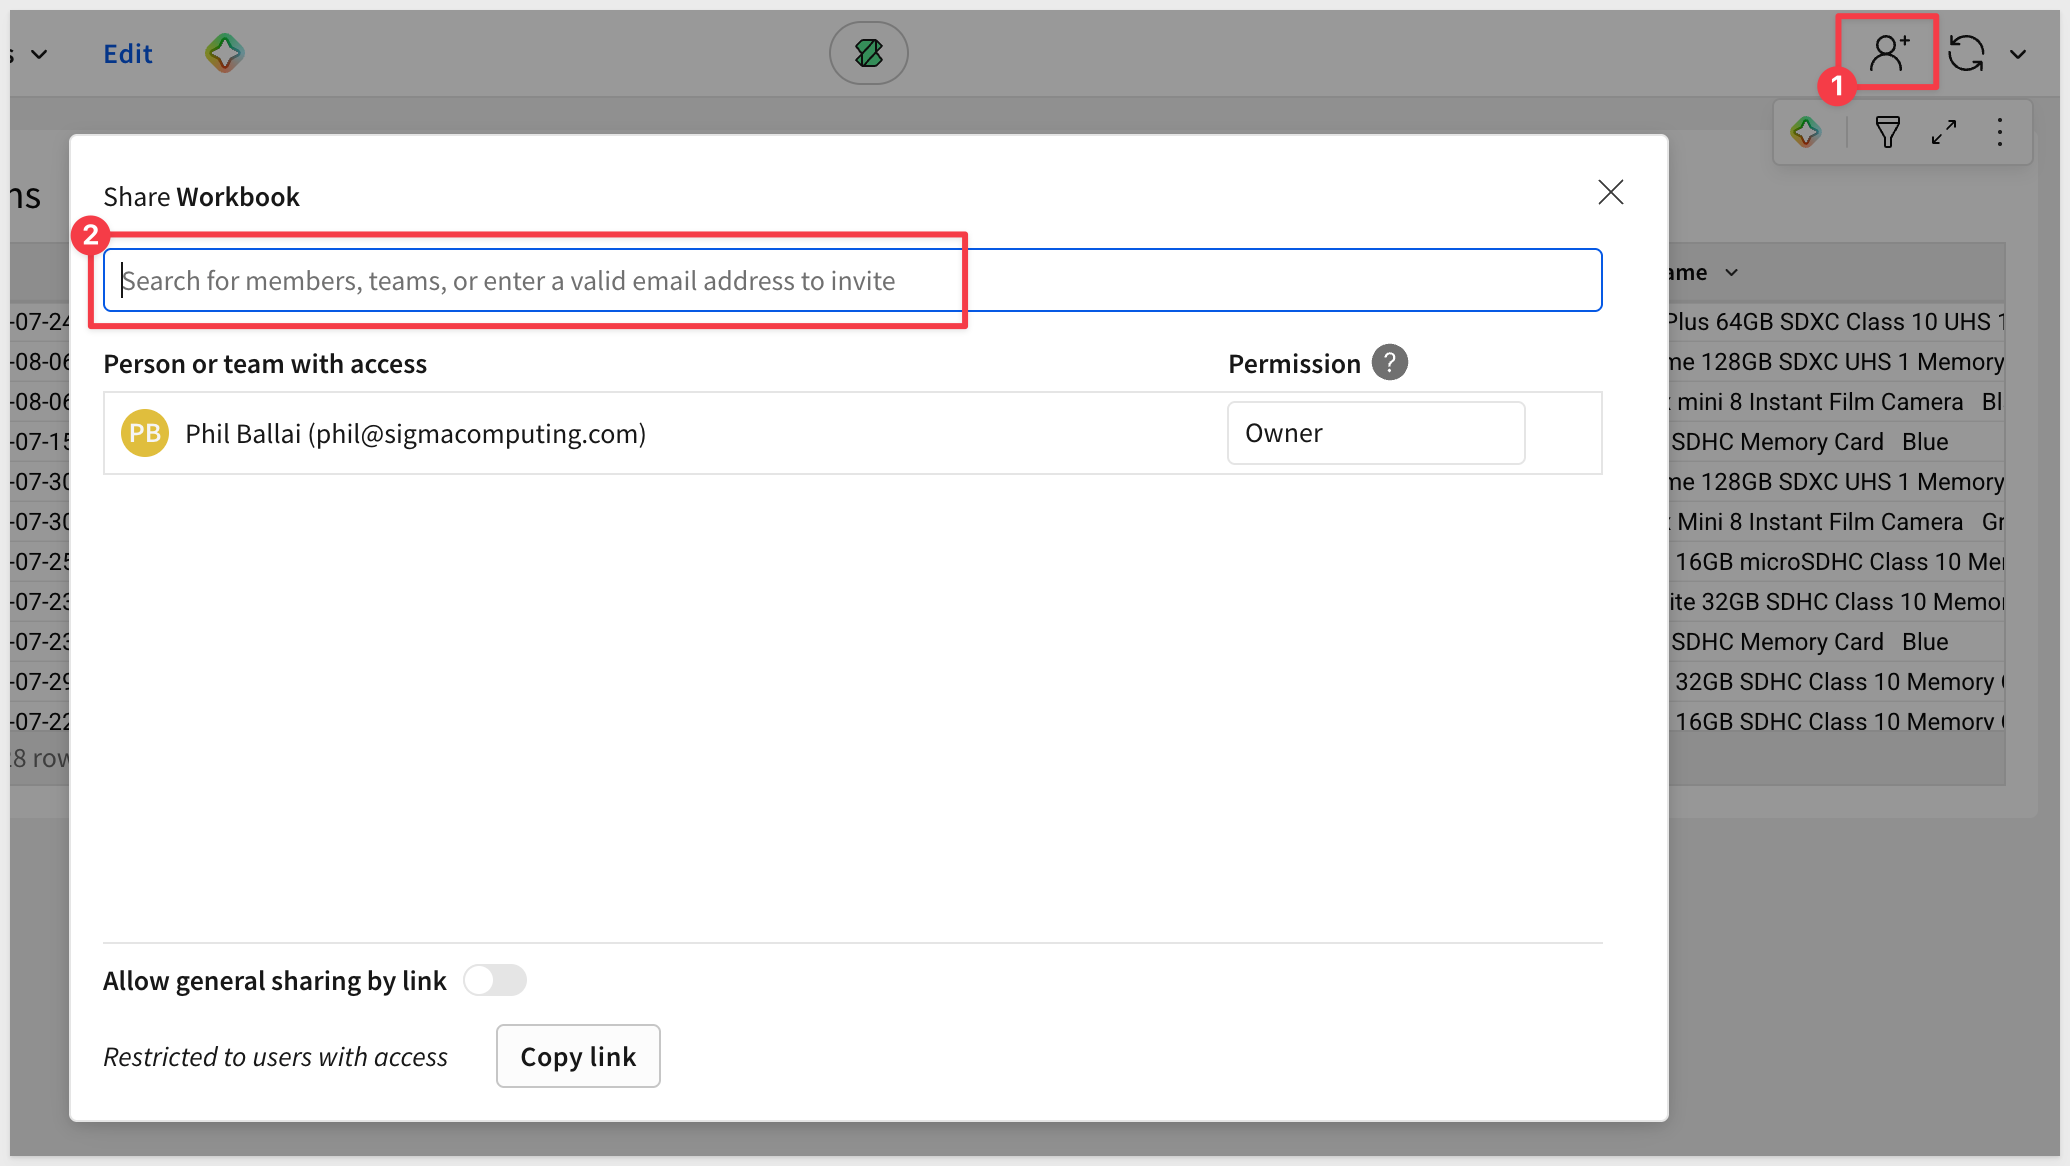
In the share modal we can select a team or member that we want to share the workbook, and at what permission level.
For example, we invited another user (using Gmail's alias feature) and set their permissions to Build.
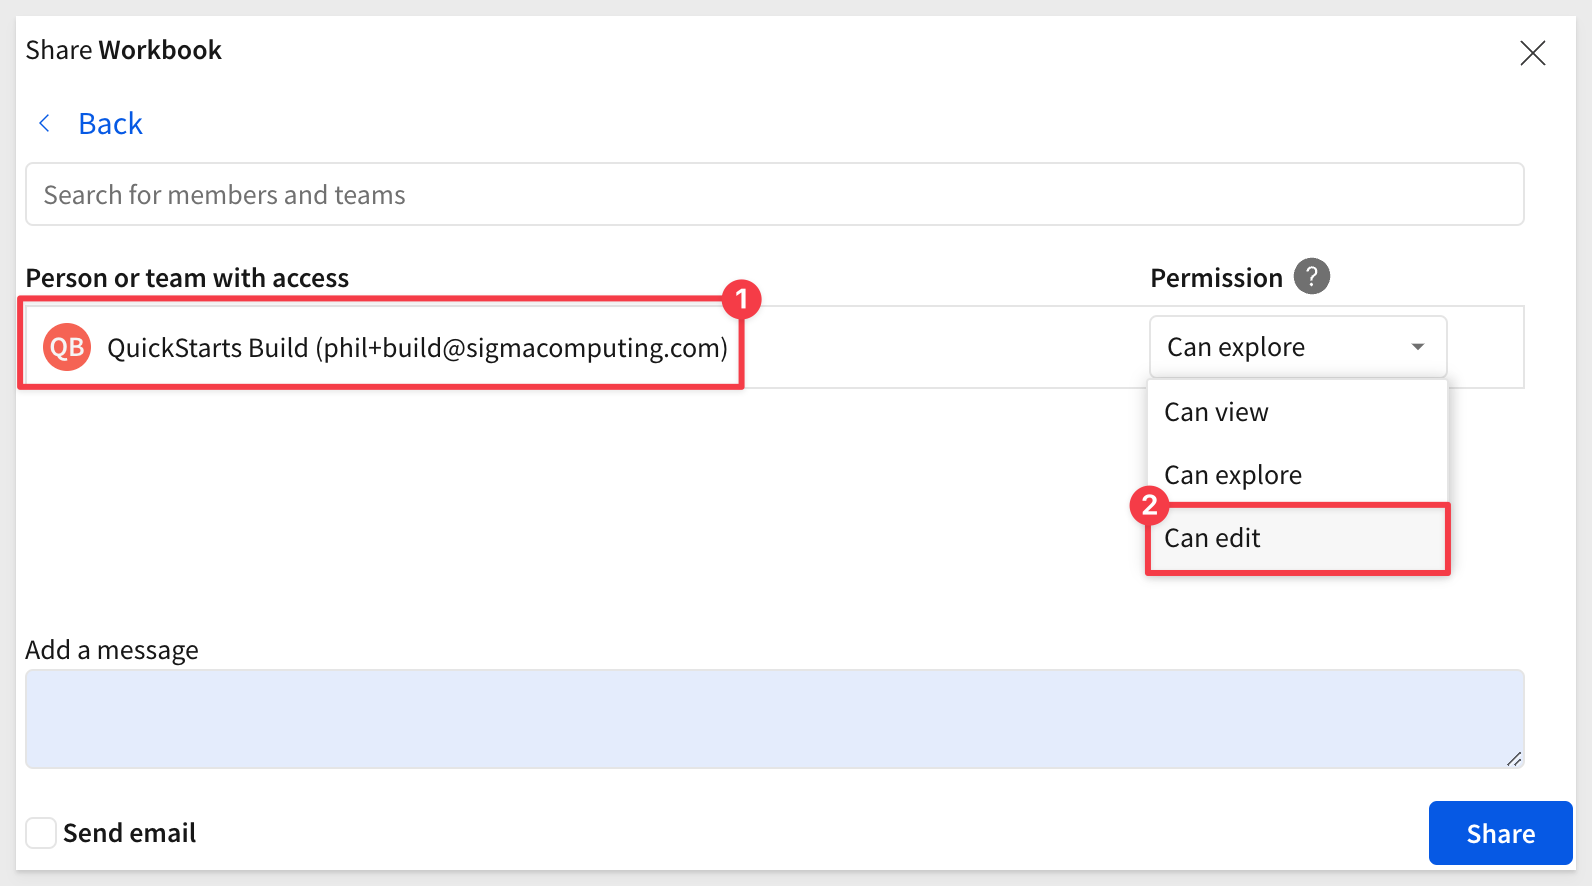
Now we can share the workbook with that new user and select the level of access we want to allow.
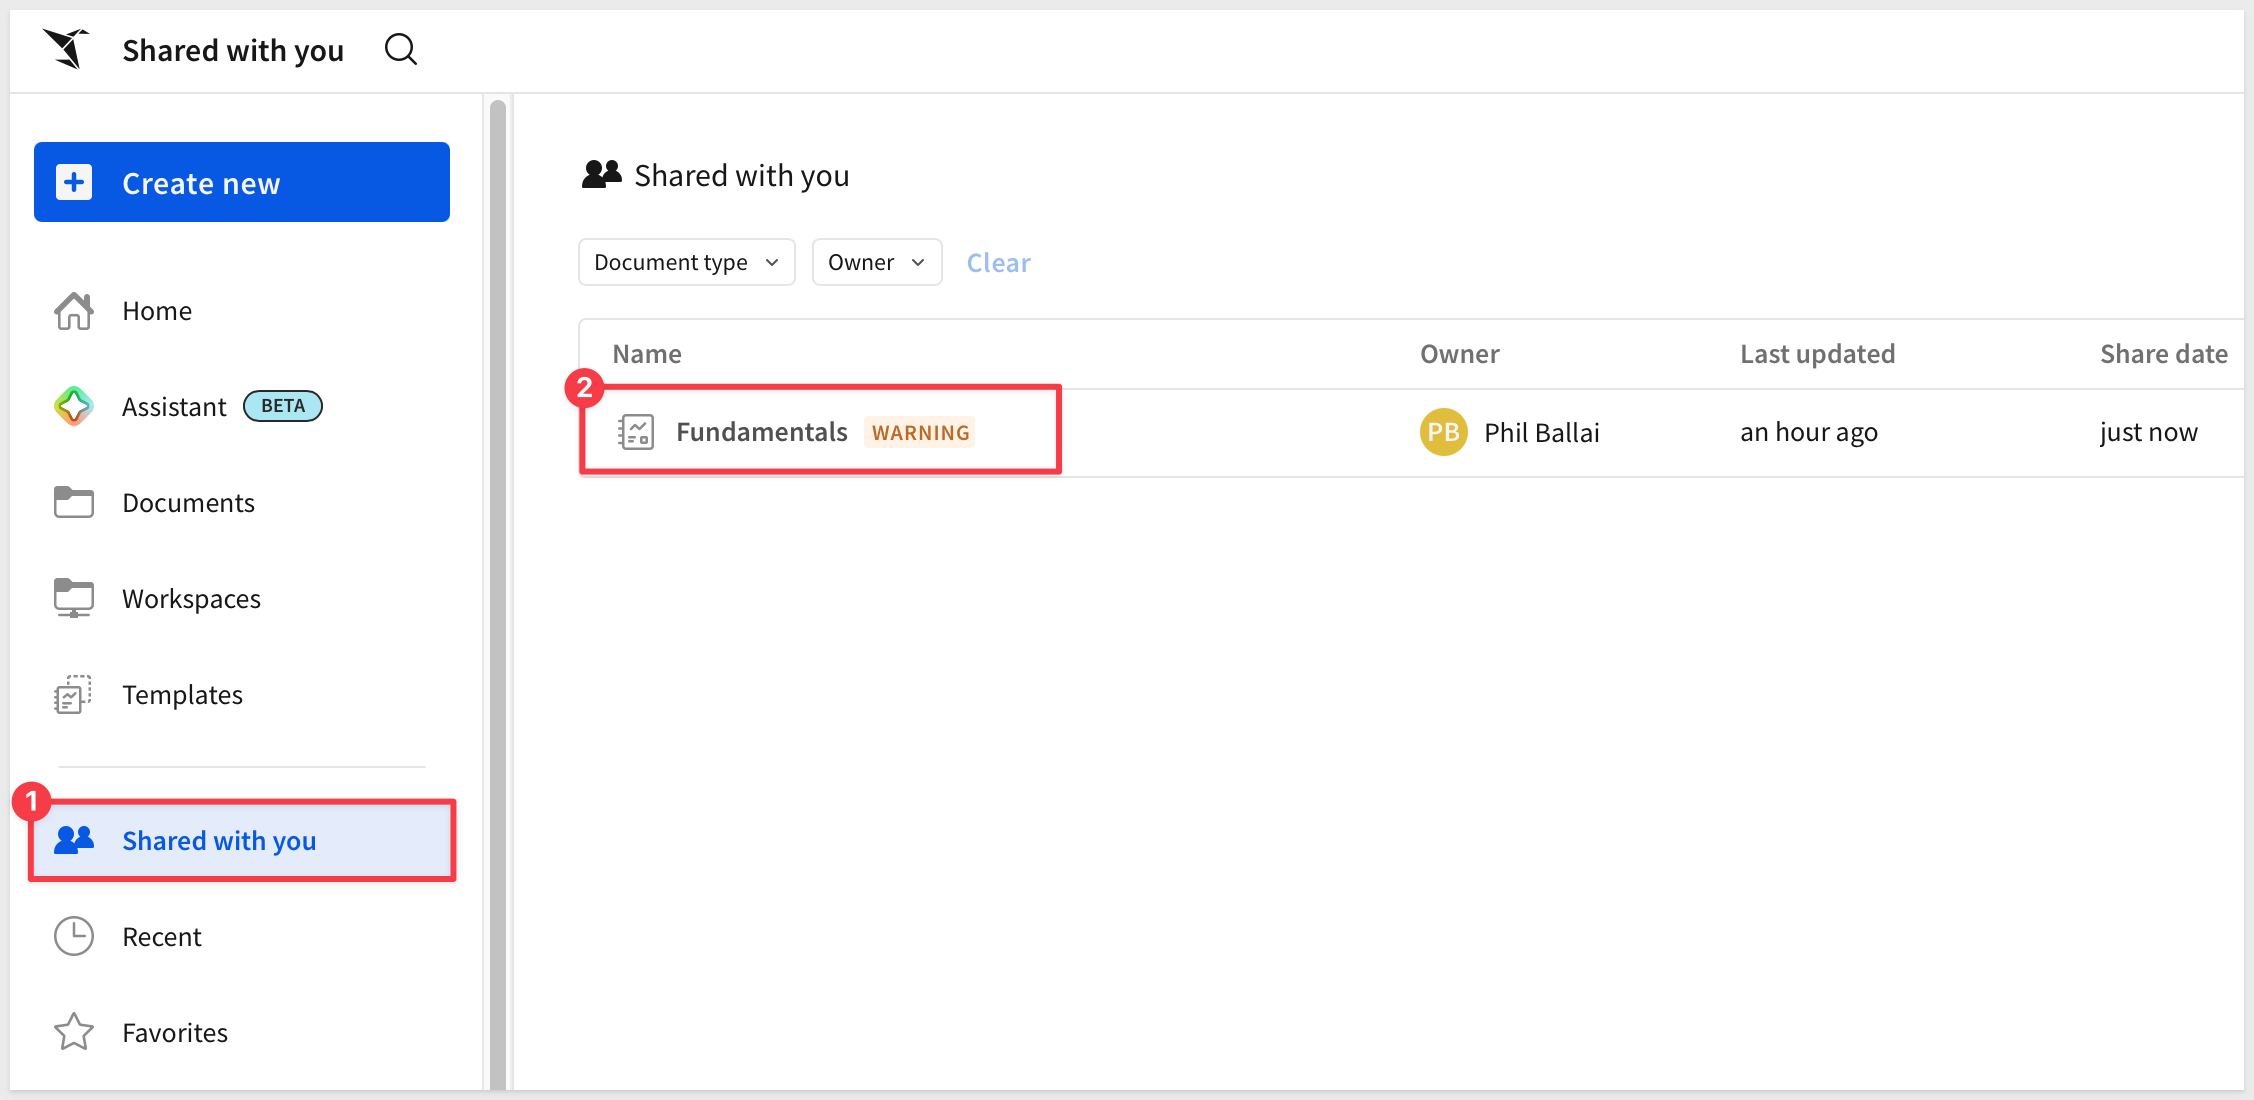
The new user can see the workbook by navigating to Shared with me on the homepage. We logged into Sigma as the new user using a different browser and can see the shared workbook:
Live edit
When we are both editing the same workbook, we can see each other's activity.
First we elevated the Build user to Edit permission using the workbook's sharing icon again.
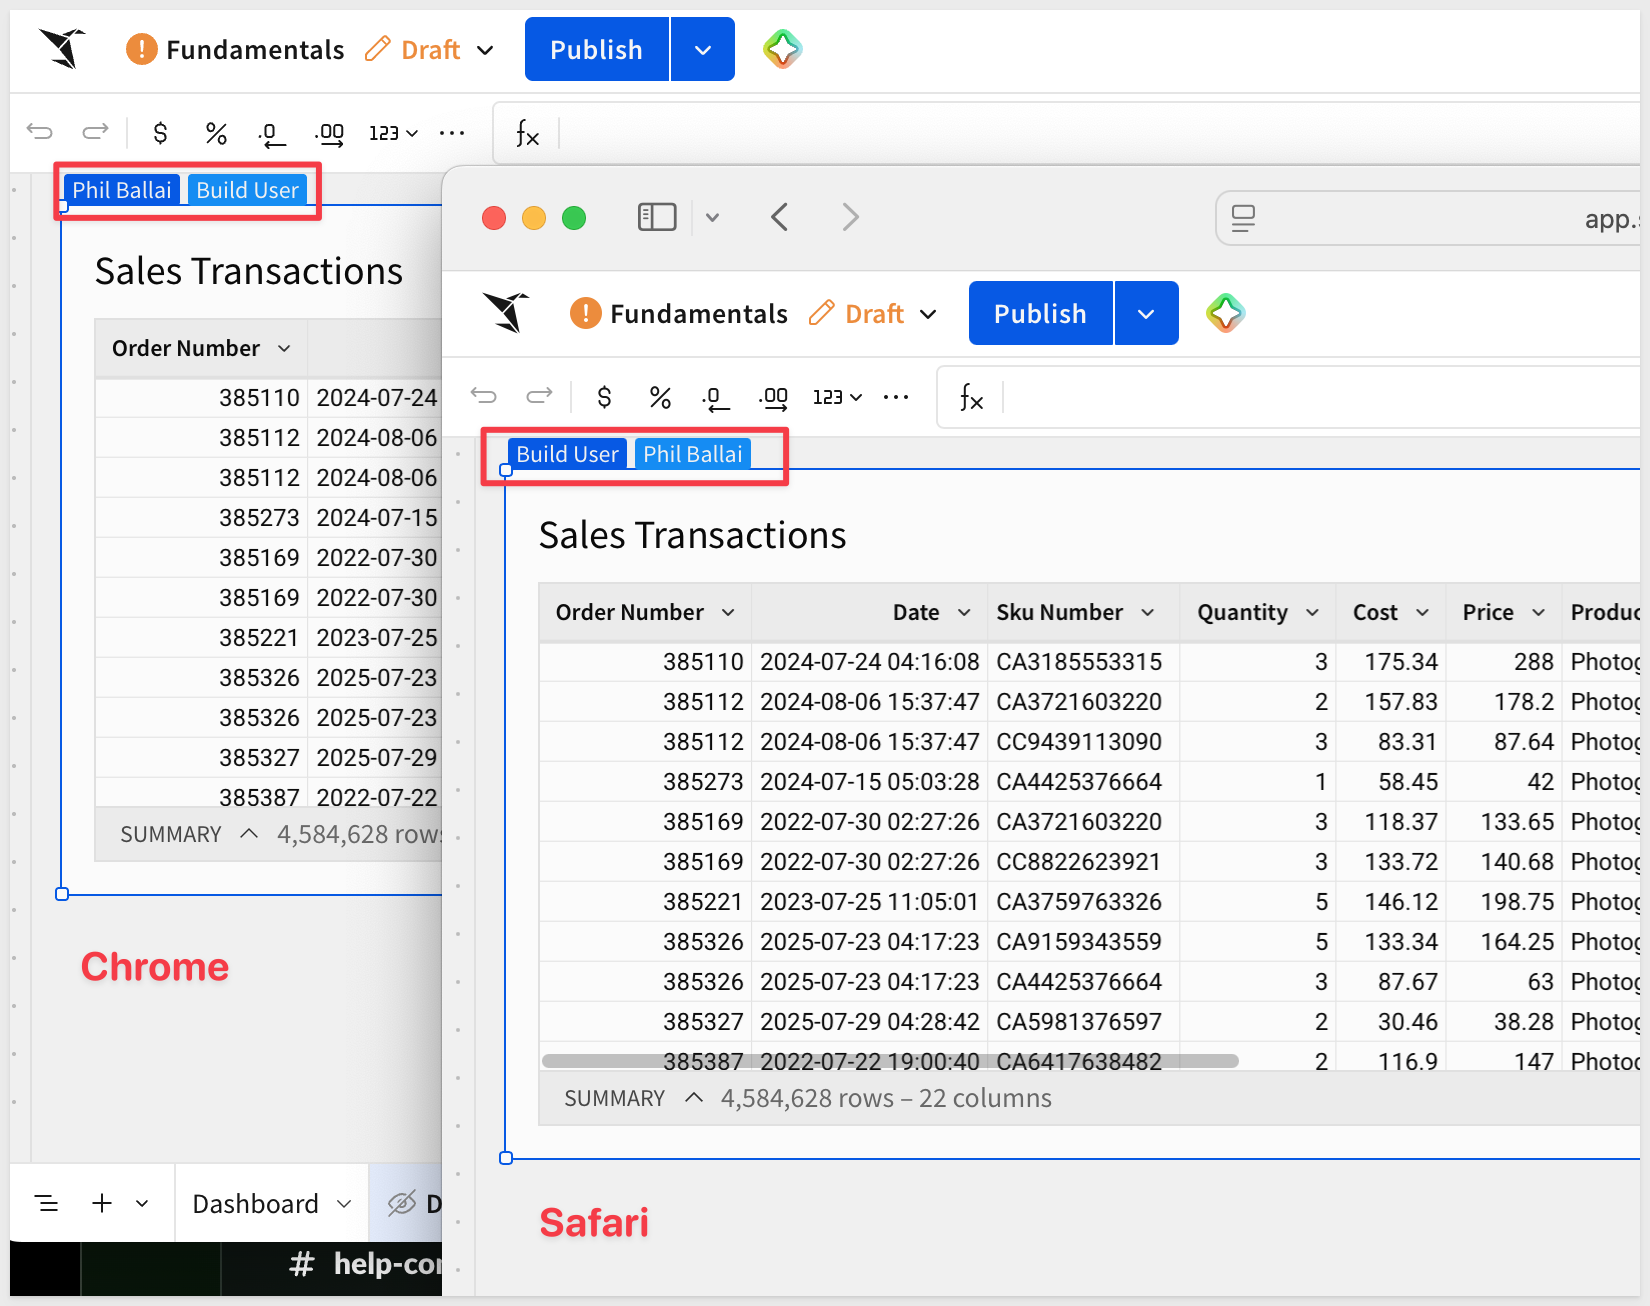
Then we logged both users in using Chrome and Safari browsers and placed the workbook into Edit.
Each user can see the other's presence on the table:
For more information, see About sharing with users, teams, and all organization members
Sigma workbooks support the ability to export data immediately or on a user-defined schedule.
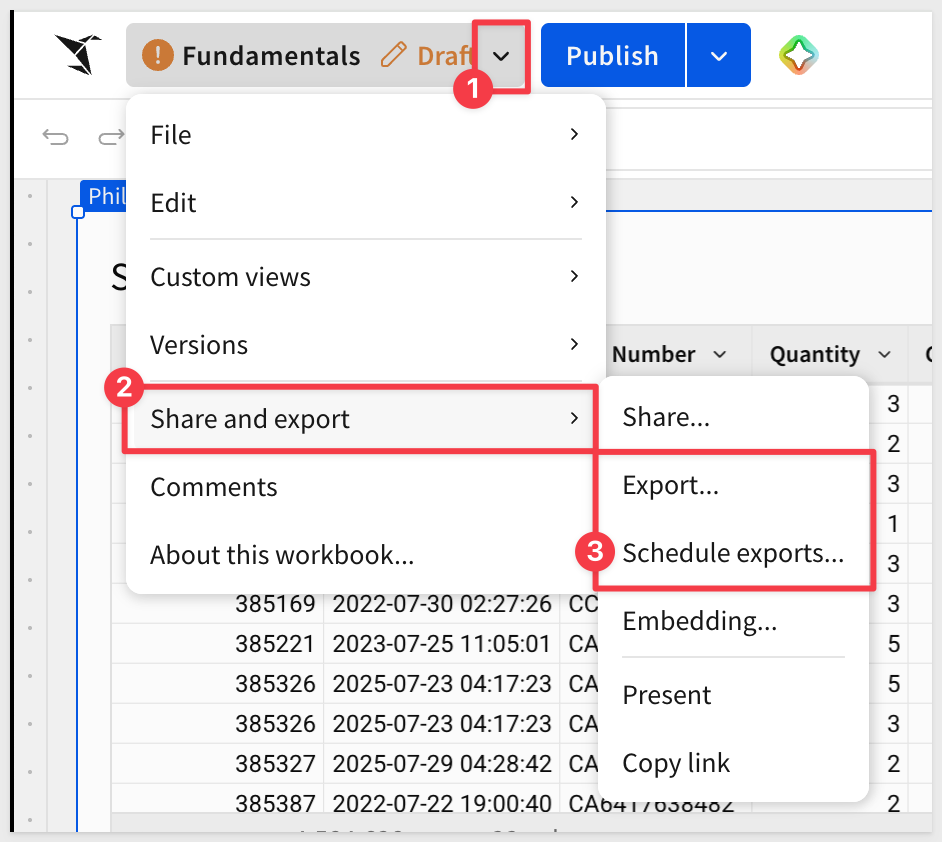
Open the workbooks menu and select Share and export > Scheduled exports...:
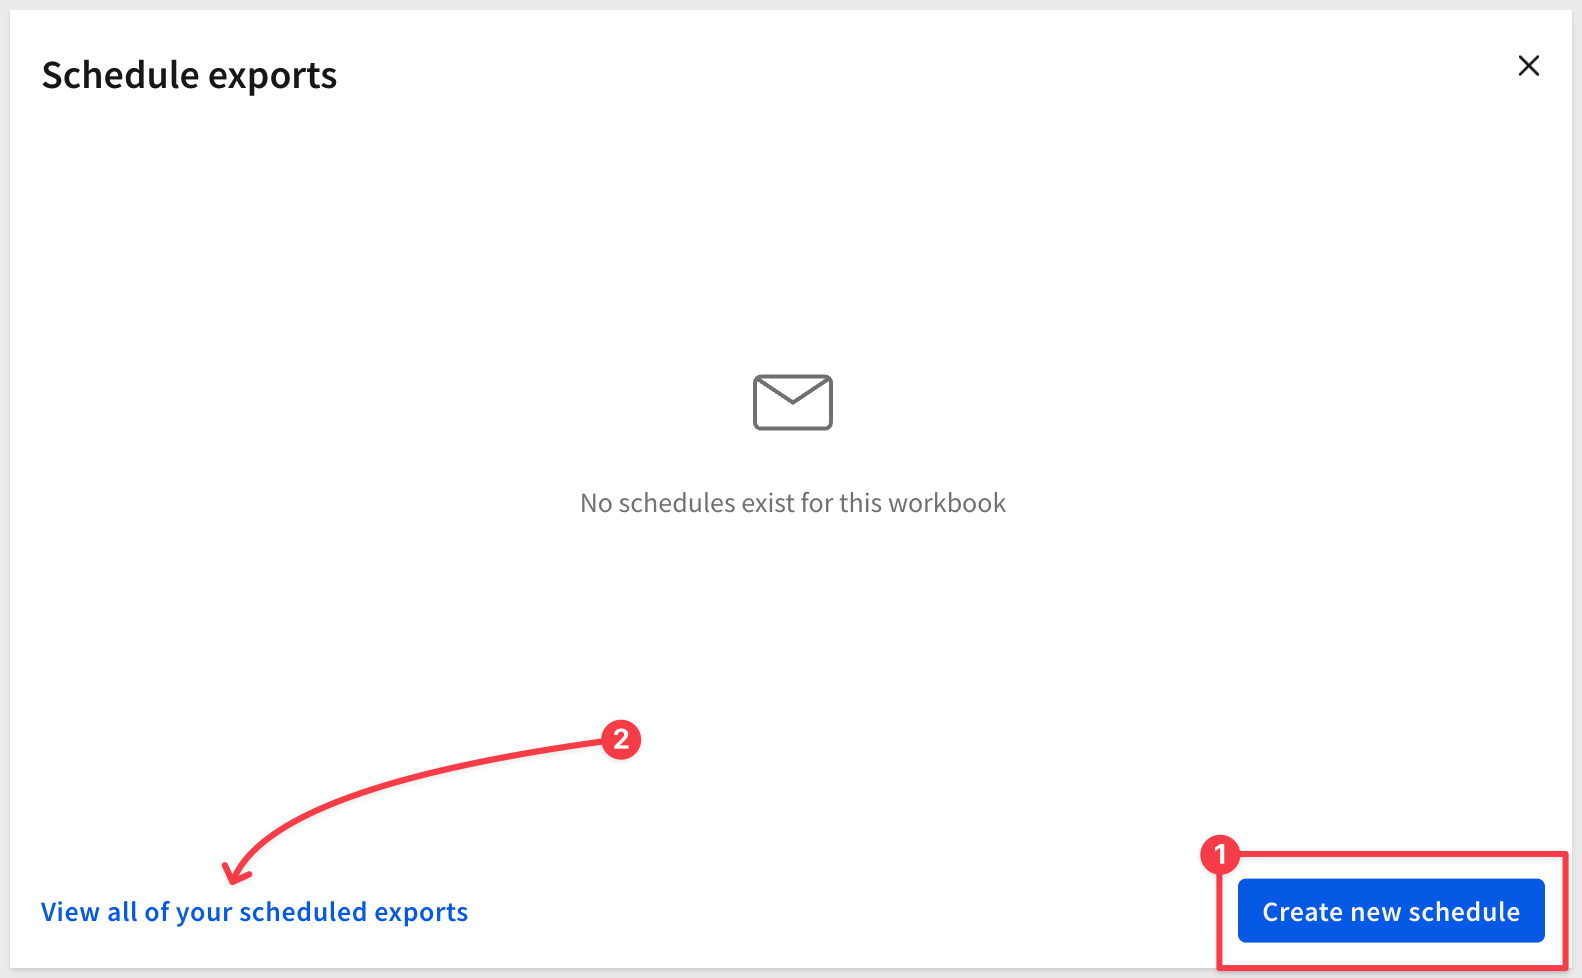
In the modal window, click Create new Schedule
We are able to customize several areas of this operation.
Export (select a type)
There are many destinations supported. Click the desired icon, provide one or more recipients, a subject and message:
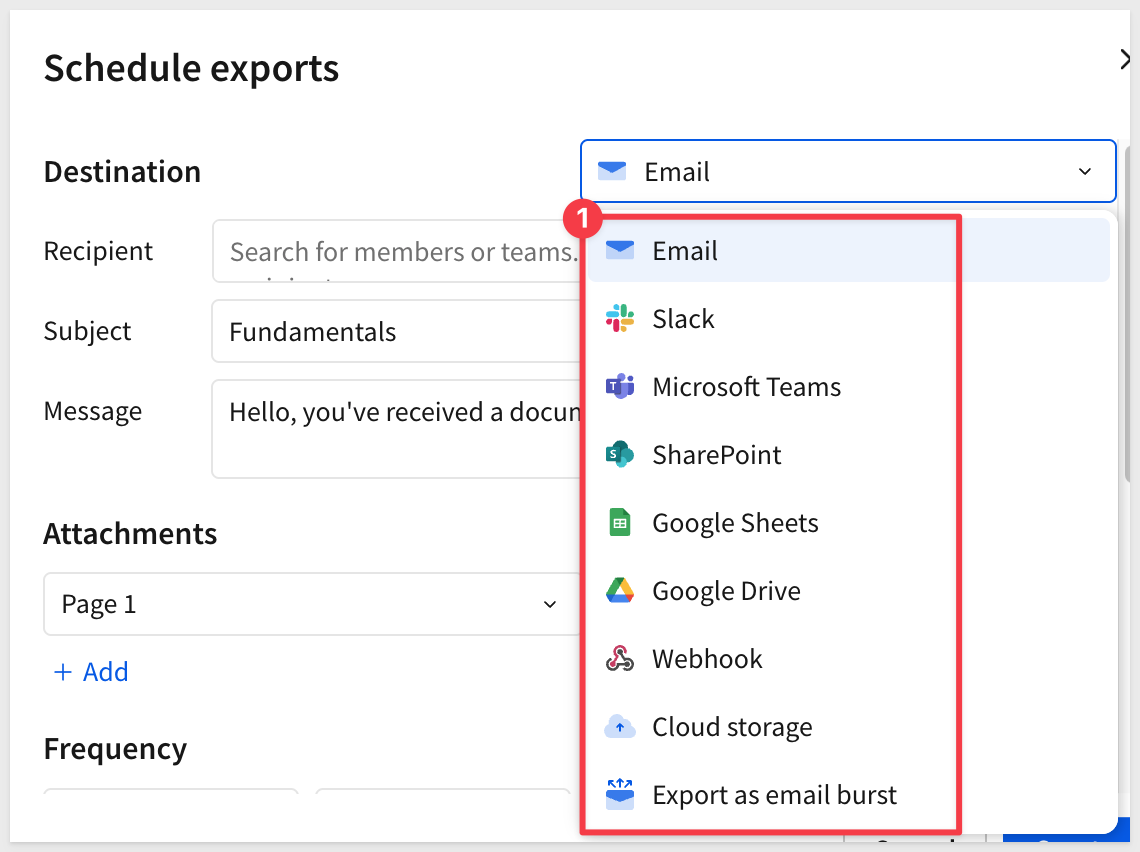
For the most recent list of supported export destinations, see Schedule a conditional export or alert
What to attach
Add one or more attachments, the format and orientation to include with the export:
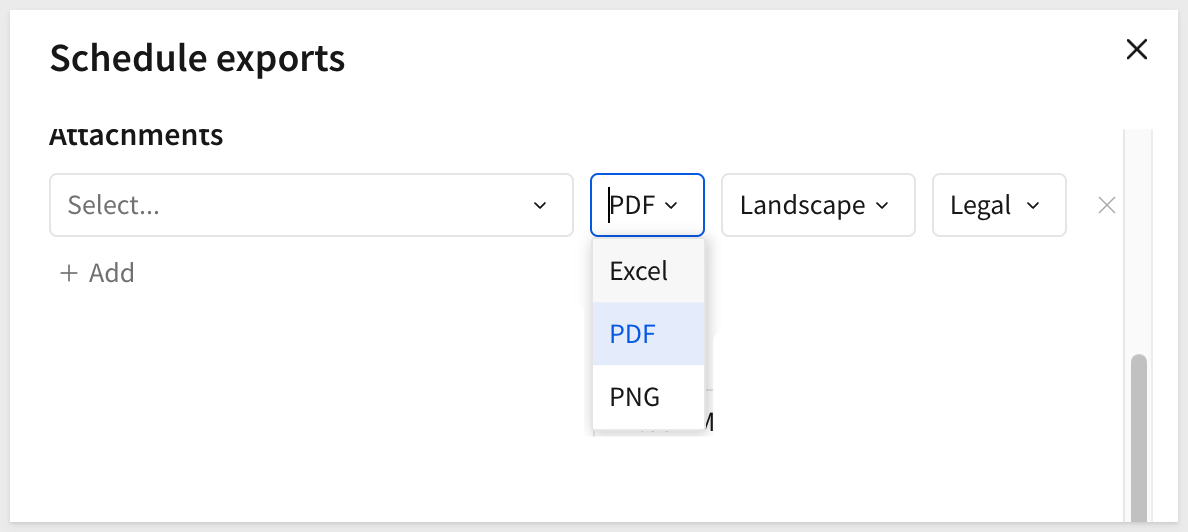
Use the + Add another attachment to build a message from more than one part of a workbook.
Frequency & Conditions
The Frequency tab controls when the export runs and the timezone it runs in. Set the schedule to match the cadence your audience expects — daily, weekly, or at a custom interval.
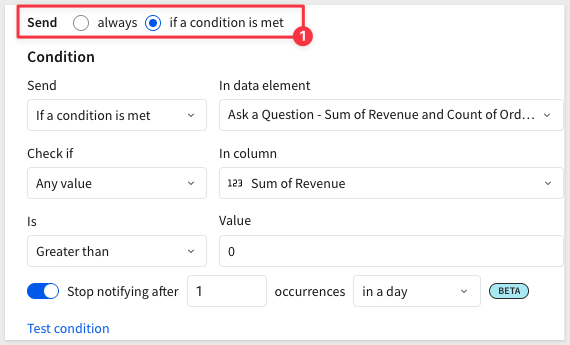
Sigma also supports conditional exports — exports that only deliver when specific data conditions are met. For example, you can configure a schedule to send only when a metric exceeds a threshold, ensuring recipients receive a notification only when action may be required.
More options
For workbooks that have parameter-driven data based on the user, sent items can be run with data filtered for the recipient:
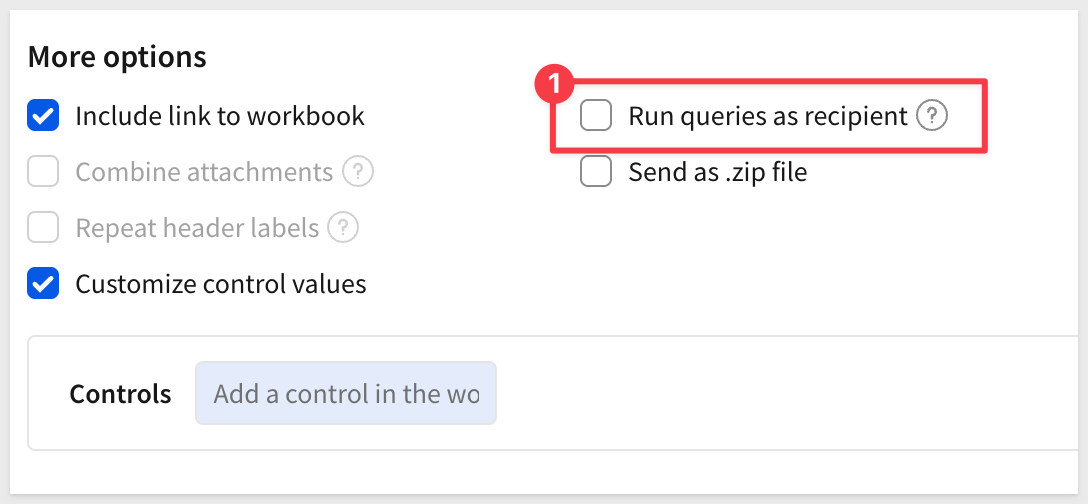
A very powerful feature of scheduling allows us to deliver reports deterministically, based on control parameters.
For more information, see Filter by control values on this page.
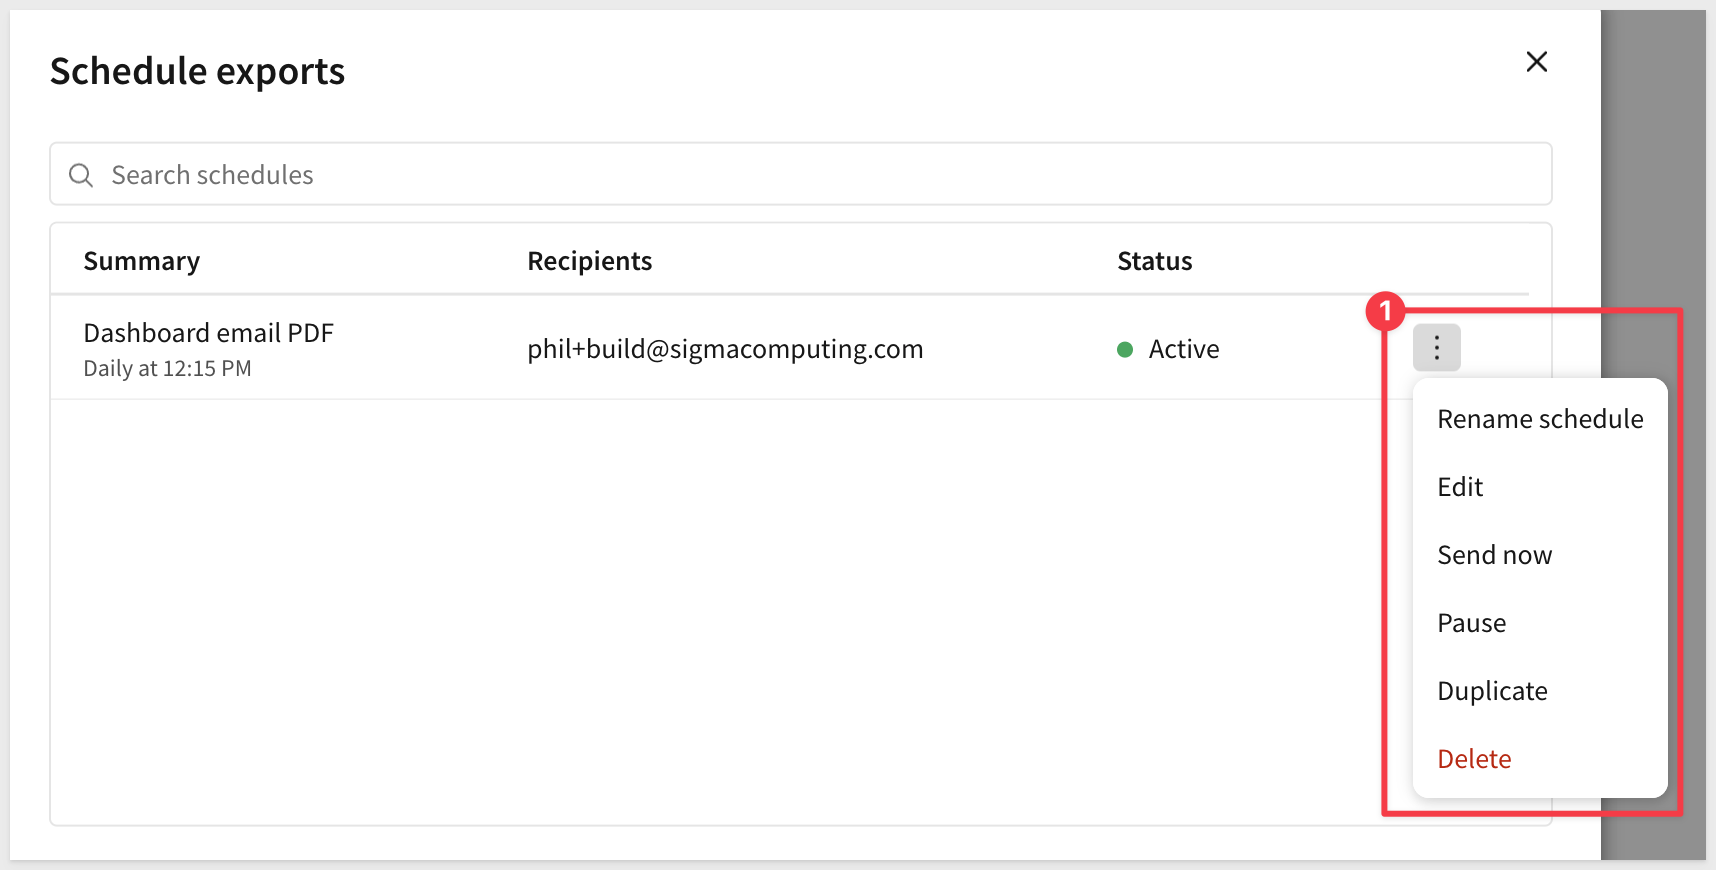
Managing my workbook schedule
Once a user creates a schedule, it is shown on the Schedule exports modal. At this point, we can take some Action on it, including running it now:
Administrative control
Once created, administrators can see it on the list of available Exports in the Administration section:
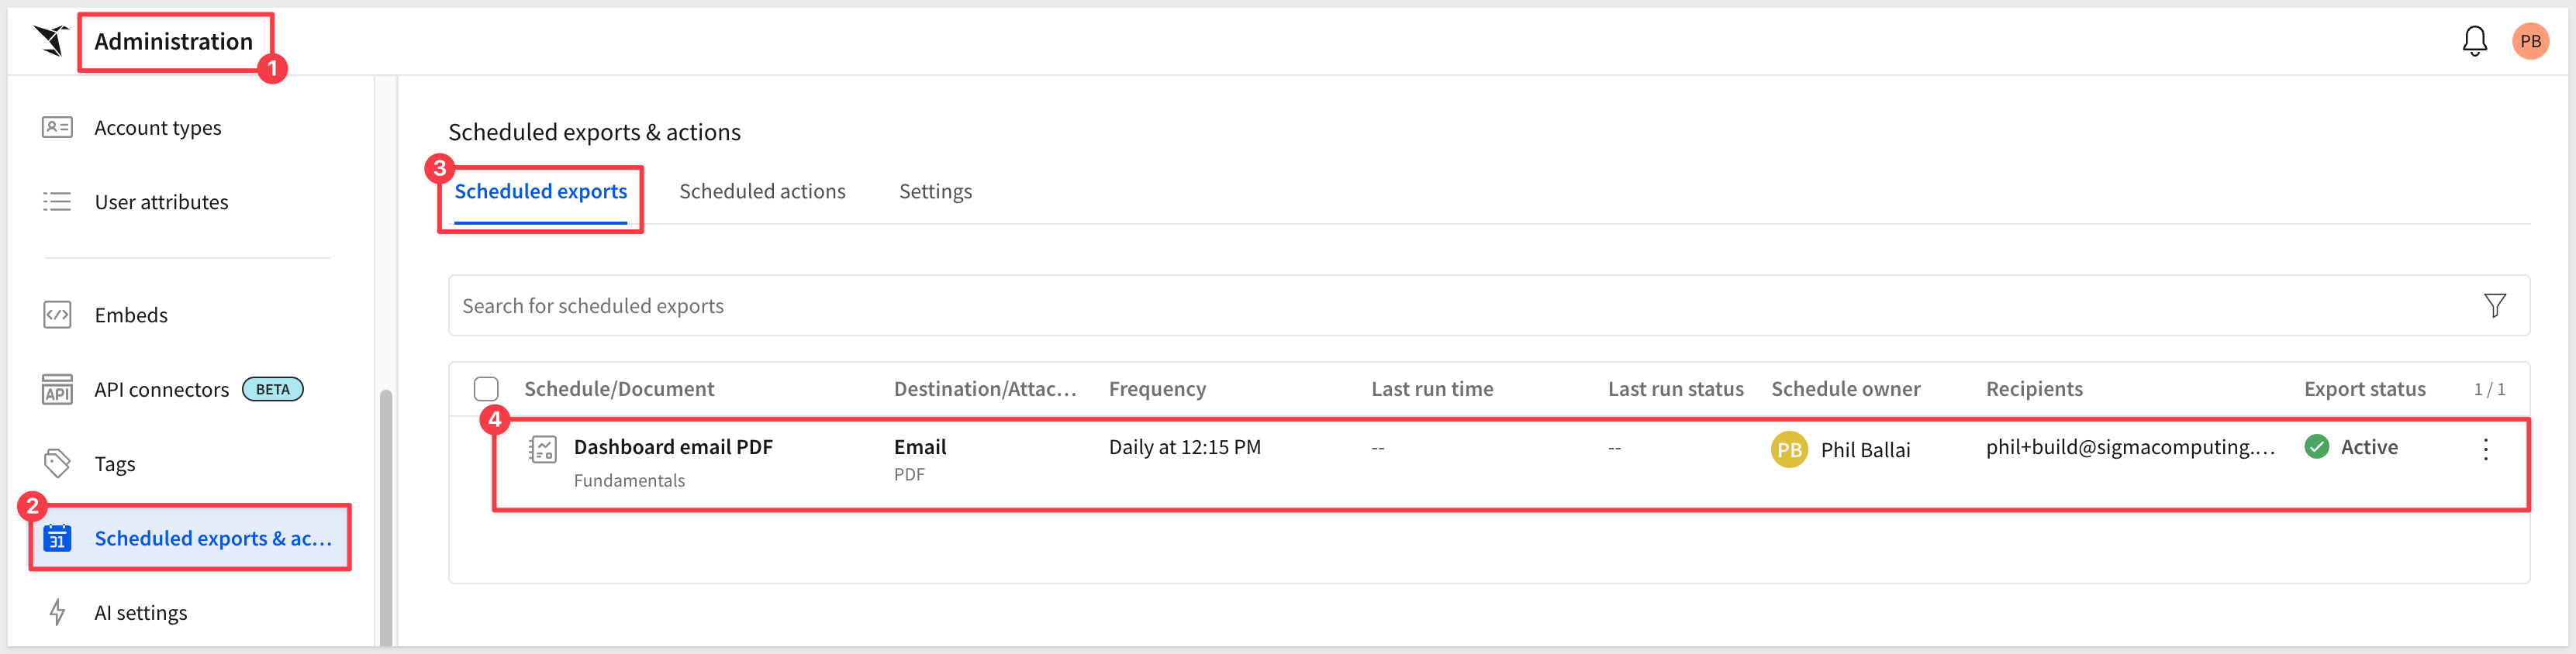
Administrators are able to delete jobs at their discretion.
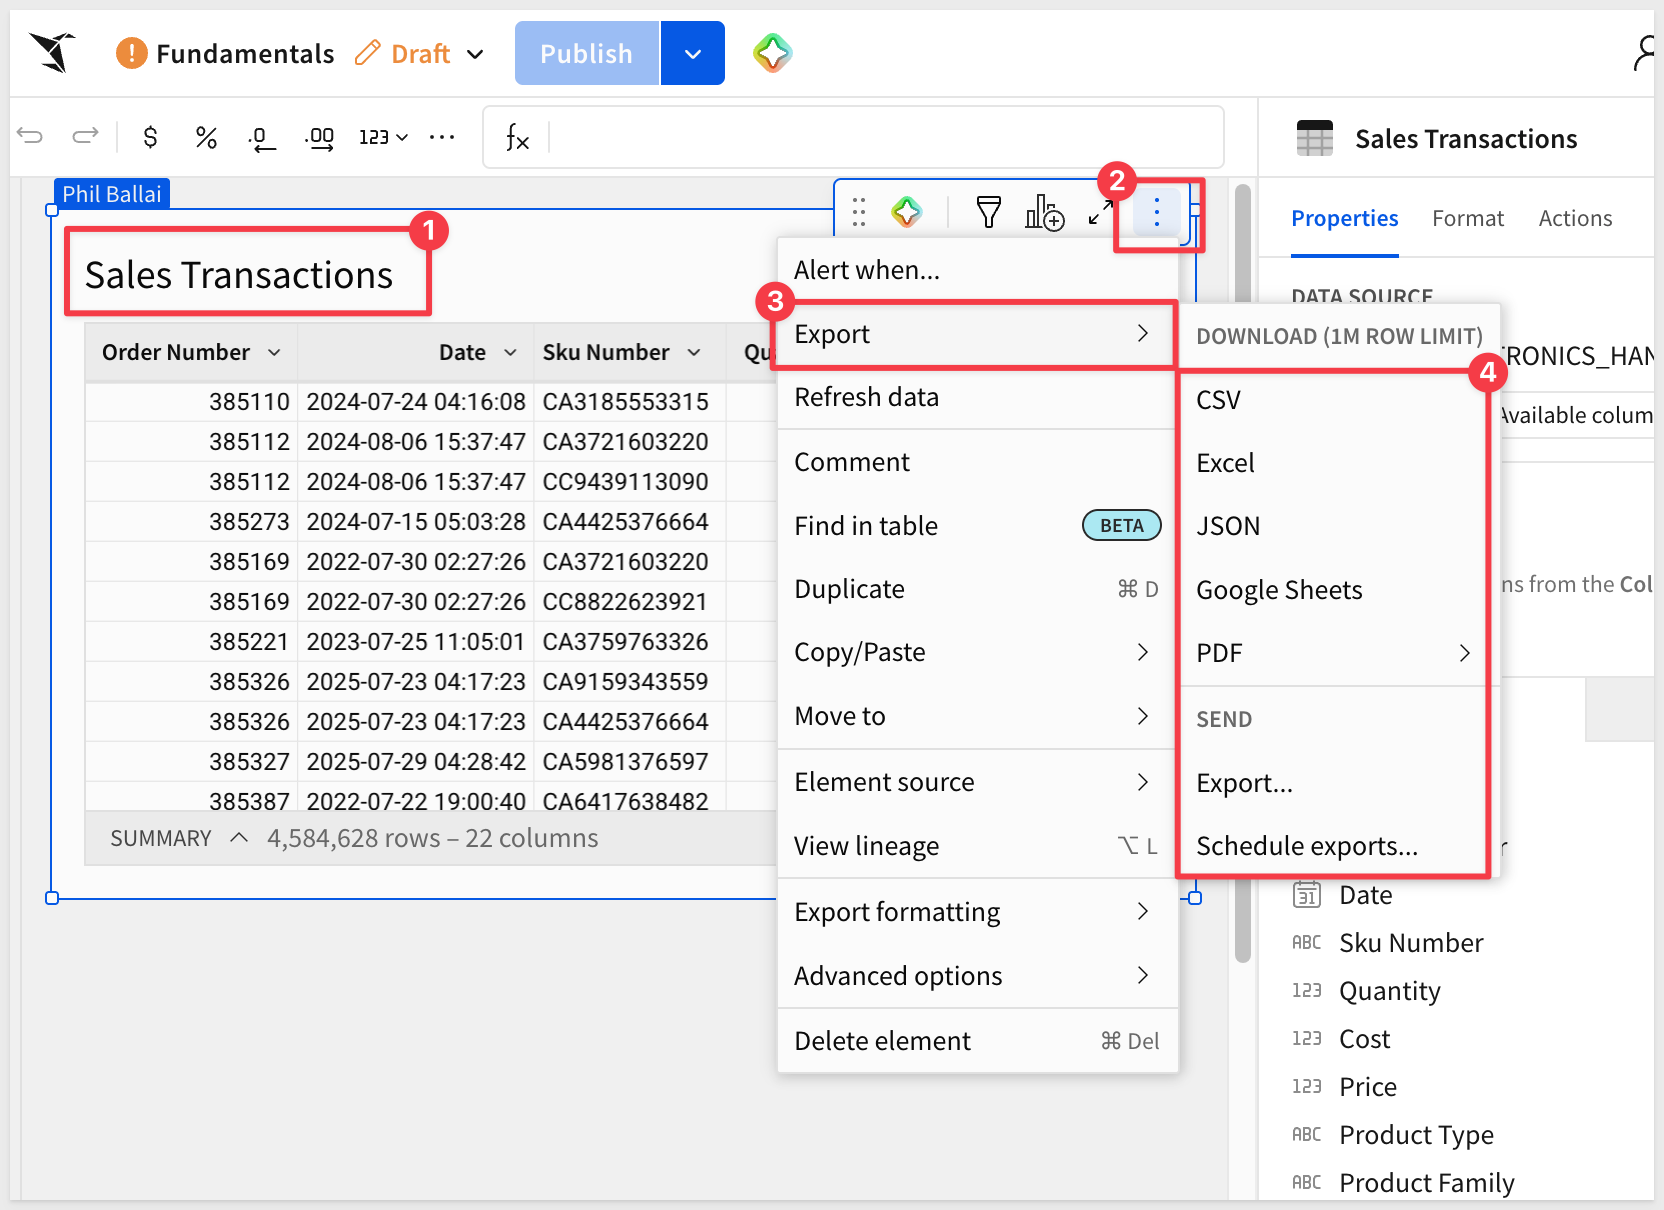
Export element
There is also a method to export data for any single workbook element. While it is preferred to use Sigma to work with warehouse data, there are times where an export is required.
For example, our workbook has one table, Sales Transactions.
We can access the element menu for this table and select Export > and select a document type. Downloading up to one million rows of data in the available formats is supported.
For more information, see Schedule a conditional export or alert
This QuickStart introduced the foundational layer of working in Sigma — the interface, the terminology, and the core workflows that everything else builds on.
You navigated the Sigma home page, explored the UI, created a workbook from scratch, and followed a document from exploration through draft to published. Along the way you saw how Sigma Assistant can accelerate initial analysis, how pages and data pages keep workbooks organized and warehouse-efficient, and how sharing, version history, and scheduled exports fit into a real workflow.
The patterns introduced here apply across every workbook you'll build going forward. The next QuickStart in the series picks up where this one leaves off — working with data in Sigma:
Fundamentals 2: Working with Data